risk assessment of vector-borne diseases for public health ... · pdf file2 20 abstract 21...
TRANSCRIPT

1
Risk assessment of vector-borne diseases for Public Health governance 1
2
L. Seddaa,d*, D. Morleya,e, M. A. H. Braksb, L. De Simonec, D. Benza, and D. J. 3
Rogersa 4
5
a Department of Zoology, University of Oxford (UK), South Parks Road, OX1 3PS, Oxford, 6
United Kingdom. 7
b Centre for Zoonoses and Environmental Microbiology, National Institute for Public 8
Health and the Environment (RIVM) P.O. Box 1, 3720 BA, Bilthoven, the Netherlands. 9
c Surveillance and Response Support Unit (SRS), European Centre for Disease Prevention 10
and Control (ECDC), Tomtebodavägen 11 A, 171 83 Stockholm, Sweden. 11
d present address: Geography and Environment, University of Southampton, University 12
Road, SO17 1BJ, Southampton, United Kingdom. 13
e present address: MRC-PHE Centre for Environment and Health, Imperial College London, 14
St. Mary’s Campus, W2 1PG, London, United Kingdom. 15
16
* Corresponding author. [email protected], Tel. +44(0)2380599622, Fax 17
+44(0)2380593295. 18
19

2
Abstract 20
Objectives. In the context of public health, risk governance (or risk analysis) is a 21
framework for the assessment and subsequent management and/or control of the danger 22
posed by an identified disease threat. Generic frameworks in which to carry out risk 23
assessment have been developed by various agencies. These include monitoring, data 24
collection, statistical analysis and dissemination. Due to the inherent complexity of disease 25
systems, however, the generic approach must be modified for individual, disease-specific 26
risk assessment frameworks. 27
Study design. The analysis was based on the review of the current risk assessments of 28
vector-borne diseases adopted by the main Public Health organisations (OIE, WHO, 29
ECDC, FAO, CDC etc…). 30
Methods. Literature, legislation and statistical assessment of the risk analysis 31
frameworks. 32
Results. This review outlines the need for the development of a general public health 33
risk assessment method for vector-borne diseases, in order to guarantee that sufficient 34
information is gathered to apply robust models of risk assessment. Stochastic (especially 35
spatial) methods, often in Bayesian frameworks are now gaining prominence in standard 36
risk assessment procedures because of their ability to assess accurately model uncertainties. 37
Conclusions. Risk assessment needs to be addressed quantitatively wherever possible, 38
and submitted with its quality assessment in order to enable successful public health 39
measures to be adopted. In terms of current practice, often a series of different models and 40
analyses are applied to the same problem, with results and outcomes that are difficult to 41

3
compare because of the unknown model and data uncertainties. Therefore, the risk 42
assessment areas in need of further research are identified in this article. 43
44
Keywords: risk governance, risk assessment, public health governance, vector-borne 45
diseases, statistical analysis. 46
47

4
1. Introduction 48
Public Health (PH) can be defined as the activities engaged in by governments and 49
organisations to prevent disease and to ensure a healthy population 1. This includes the 50
assessment and monitoring of the health of communities and populations at risk, 51
intervention, education, and formulation of public policies, and encompasses all issues that 52
may be detrimental to health 2. In terms of Public Health, risk has been defined by medical 53
epidemiologists and health organizations as “the probability of disease developing in an 54
individual in a specified time interval” 3. More generally, the Society for Risk Analysis 55
(SRA) 4 defined risk as “the potential for realization of unwanted, adverse consequences to 56
human life, health, property, or the environment; estimation of risk is usually based on the 57
expected value of the probability of the event occurring times the consequence of the event 58
given that it has occurred”. In econometrics, risk is quantified by the “absolute value of 59
expected losses” 5. Notice that in these latter two definitions the probabilistic concept of 60
risk is conflated with some idea of the (fixed or calculable) economic cost outcome should 61
that risk be realised. 62
PH risk governance is a framework 6 that includes risk assessment (or risk 63
estimation), risk management and risk communication. In this manuscript we focus on one 64
category of public health challenges, the risk assessment of vector-borne diseases (human 65
and/or animal illness transmitted by arthropods) which, at least in the tropics, have a huge 66
impact on human health and well-being (for example, WHO estimated there were 627,000 67
deaths among 207 million cases of malaria in 2012 7). Emerging vector-borne diseases are 68
of increasing concern in Europe 8 and North America (West Nile virus, chikunguya, 69
malaria and dengue for instance) some with autochthonous cases 9. 70

5
Especially in the case of vector-borne diseases, because of their complexity, the metric used 71
for risk is not uniquely defined. Often risk is synonymous with vector or host suitability 10, 72
the basic reproduction number R0 11, vector capacity 12, vector presence/absence 13, 73
prevalence or incidence of the disease 14 or many others. The same diversity is found in 74
model selection, data resolution, the predictor variables, their transformation, and the input 75
parameters (e.g. models coefficients applied to different areas/events) used to model risk, 76
even for the same disease (e.g. 15 for Lyme disease). Hence a deep understanding of the 77
various metrics and models used for estimating risk is of primary importance, especially 78
when previously obtained parameters, values and models are applied outside the domain of 79
the original model fitting 15 (e.g. in the case of newly emerging diseases). 80
The goal here is to integrate risk assessment or estimation theory (and models) for 81
vector-borne diseases with the present regulatory, and sometimes mandatory, system of risk 82
governance, as defined by the main health organizations. 83
84
2. Risk governance in international public health organizations and some national 85
agencies. 86
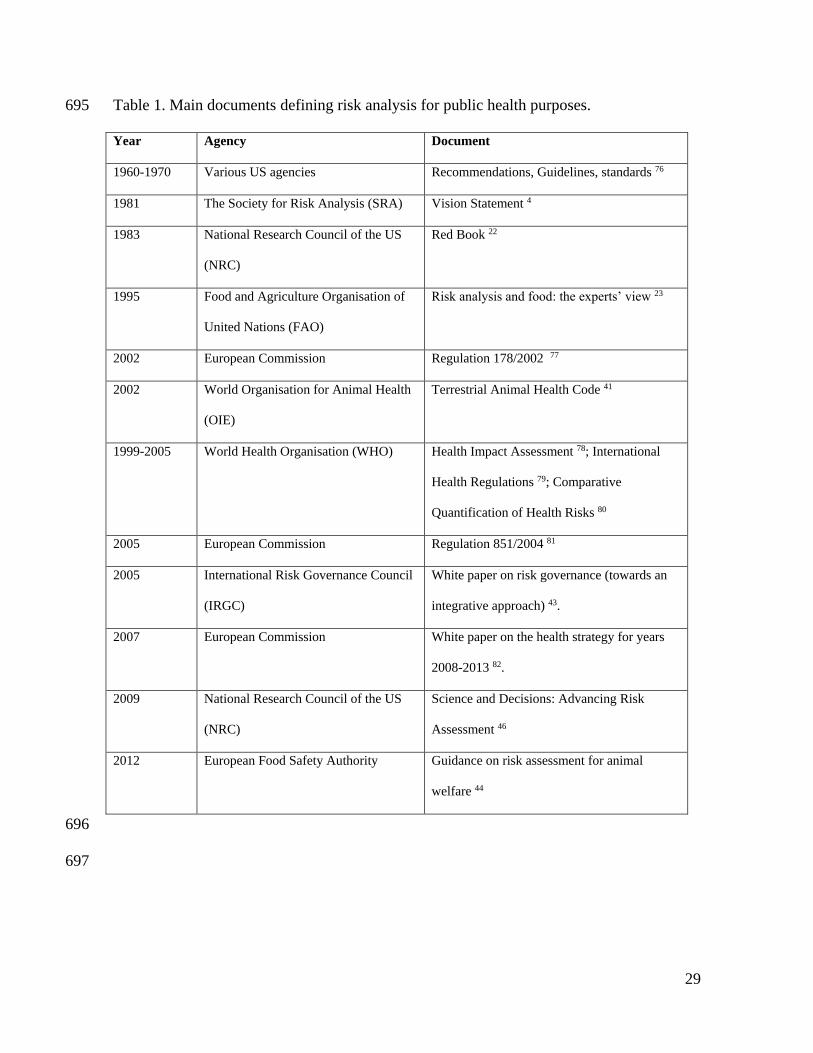
Table 1 presents some key contributions to general risk-related policy over the last 87
fifty years. From the initial basic statements of risk governance guidelines, procedures have 88
developed into clear conceptual frameworks allowing a standard approach to be adopted. 89
Most recently the complementary roles of quantitative and qualitative methods have been 90
directly addressed along with the understanding that an estimation of uncertainty is vital to 91
any risk analysis. 92
6
The concept of risk governance as a combination of risk assessment, risk 93
management and risk communication (or “translating knowledge” 16 into advice for 94
informative/legal actions 17) originated in the 1960s and 1970s when concerns were raised 95
over environmental carcinogens and food additives 18 19 20 21 22. Subsequently risk 96
governance concepts were formulated by individual scientists19, and by national and 97
international agencies20, with a concentration on cancer and harmful chemicals21, 22. In the 98
1990s, risk assessment became mandatory in Europe for environmental, epidemiological 99
and food health threats (i.e. Council Directive 89/391/ECC, the Decision No 2119 of 100
1998/EC, the European Commission Regulation 178/EC of 2002), was enshrined within the 101
European Union Risk Assessment System and was managed by DG SANCO. 102
The fundamentals of risk governance are similar in the various frameworks of Table 1 103
and based on the concepts defined by the Red Book and by the CODEX of the 104
FAO/WHO23 23. With these documents the division of risk governance into risk 105
assessment, risk management and risk communication becomes the standard form for risk 106
governance for any type of risk. 107
None of the frameworks presented in Table 1 imposes a specific method of risk 108
assessment. Indeed, a unique risk assessment method for Public Health risk governance 109
does not yet exist. The following section outlines the current statistical approaches to risk 110
assessment as a contribution to developing such a method. It concentrates on vector-borne 111
diseases because although these have historically been neglected in many risk assessment 112
frameworks they are likely to become increasingly important in temperate regions in the 113
future. 114
115

7
3. Risk assessment for Public Health risk governance. 116
To date, risk assessment of vector-borne and other diseases for Public Health applications 117
has depended heavily upon the modellers and what they can and cannot do with the data 118
available. The choice of the model depends on the aetiology of the disease in question. For 119
example, when aetiology is unknown, studies are usually population-based (e.g. 120
smoking/pollutants related cancers). Usually very large sample sizes are required to 121
remove obvious biases and to reveal what are often very low incremental probabilities of 122
disease risk. In most vector-borne diseases the aetiology is well established. Insect or tick 123
‘vectors’ pick up infections (i.e. become infected) when they take blood from infectious 124
vertebrate hosts. The vectors in turn become infectious (i.e. capable of transmitting the 125
infection to another vertebrate host) only after a period of incubation which may take 126
several days (insects) or even months (ticks) and is referred to as extrinsic incubation 127
period (EIP). Hence a minimum of three species are involved in vector-borne disease 128
transmission (host, vector and pathogen). In fact such transmission often involves 129
numerous and complex vector and zoonotic (domestic and wild animal) components. In 130
these cases even if risk assessment can be more individual-based, or based on identifiable 131
sub-groups, for example focussed only on those people living where vectors can be found, 132
the number of parameters and variables needed would be greater than is typically used in 133
other sorts of public health models 12, 24. More complex systems need more research 134
investment to reach the same level of understanding but vector-borne diseases have been 135
neglected in comparison with other diseases (e.g. cancer), probably because of their lack of 136
importance in the developed world. 137
138
8
In 2006, and following an outbreak of the mosquito-borne disease chikungunya 139
(CHIK)25 in Asia, destination of many tourists and others from Europe, the European 140
Centre for Disease Prevention and Control (ECDC) conducted a CHIK risk assessment for 141
Europe. The risk assessment was based on the knowledge that infected and infectious 142
travellers were returning to Europe, in some cases to places where a known vector of 143
chikungunya, the Asian tiger mosquito Aedes albopictus, had already established (in 144
Europe, this mosquito was first reported in Albania in 1979, and in Italy in 1990). By 145
studying the current numbers of recorded cases in endemic areas as well as imported cases 146
and the presence of local vector species, the ECDC concluded there was a risk of local 147
acquisitions of CHIK virus in Europe, although the magnitude of this risk could not be 148
determined 26. Quantitative models were not applied because of the lack of knowledge of 149
the response of the virus to the environmental conditions of a new geographic area, the 150
preventative measures on the parts of both travellers and health professions, the potential of 151
further spread in southern Europe of Ae. albopictus and finally the competence of local 152
mosquitoes to transmit the virus. In 2009, following a large outbreak of CHIK in Italy in 153
2007 and after a subsequent large-scale entomological survey, the ECDC published a first 154
risk map for Ae. albopictus in Europe 27, based on a random forest model and multi-criteria 155
analysis applied to entomological and environmental datasets. As in all other cases, 156
however, a risk map of a putative vector is not the same as a risk map of the disease it 157
transmits. ‘Anophelism without malaria’ (i.e. the occurrence of the vector Anopheles 158
without the malaria) is a familiar concept to malariologists, and a similar effect is likely to 159
apply to all other vector-borne diseases. 160
9
Disease pathogens potentially transmitted by many different mosquito species are 161
even less likely to be described by risk maps of just one, or even several of their vector 162
species. For example, the European Union has made several attempts to assess the risk to 163
Europe of Rift Valley fever (the transmission of which in Africa involves sevarla different 164
mosquito species) but, due to the complexity of the disease epidemiology and the 165
difficulties in the transmission parameterization, the risk assessments were predominantly 166
qualitative 28 29. 167
168
Similar problems arise with diseases of veterinary importance, especially those of 169
high economic impact such as bluetongue (BT), which provoked an extensive legislative 170
response (Directive 75/EC of 2000, EC Regulation 178 of 2002, Commission Decision 171
393/EC of 2005, Regulation 1266/EC of 2007; Decision, 367/EC, Regulation 394/EC of 172
2008, Regulation 1304/EC of 2008, Decision 655/EC of 2008, Decision 19/EC of 2009, 173
Regulation 1156/EC of 2009); or foot-and-mouth in the UK in 2001. In both cases control 174
activities against the diseases were eventually informed by predictive risk models each of 175
which subsequently came in for a certain amount of criticism because of the ways in which 176
the models were formulated (including the assumptions on which the models were based), 177
and the values of the models parameters used. 178
179
These examples show the difficulties in applying model-based solutions to human 180
and non-human, vector-borne and directly transmitted disease outbreak emergencies when 181
only inadequate or incomplete data are available. This will inevitably be the case with 182
emerging diseases (for example chikungunya, Rift Valley fever and West Nile virus in 183

10
Europe) but may also apply even to neglected but long-established diseases, such as Lyme 184
disease 8, 15. 185
The examples clearly show that, in the face of an imminent public or veterinary 186
health threat, control agencies have little time to worry about the characteristics of disease 187
models. Instead, they must be seen to be doing something to combat the diseases, whether 188
or not this is informed by quantitative models. Sometimes this involves excessive 189
application of the precautionary principle, for example the localised and repeated use of 190
insecticide which although it diminishes disease risk may not eliminate it entirely but 191
certainly does create other environmental and health risks 30. The greater the impact of an 192
event, or the longer its duration, the more likely an inappropriate control (either too much 193
or too little; the precautionary approach encourages the former) will be applied. Policy 194
must therefore encourage the development of robust models in advance of any new threat 195
and, ideally, these models should be tested during simulation exercises 15, as was done in 196
2004 in the aftermath of the 2001 foot-and-mouth outbreak in the UK and following no 197
fewer than three independent reports into the outbreak31 and one Department of Health 198
longitudinal study on the health and social impacts of it32. 199
But what should these robust models look like, and how may they be developed? The 200
final section explores some of the options. 201
202
4. Models for Public Health risk governance. 203
The distinction made in the previous section, between models for diseases without or 204
with known aetiologies, highlights the dichotomy between statistical and biological 205
approaches to disease modelling. Statistical models look for statistical associations 206
11
between a dependent variable (e.g. the number or percentage of disease cases) and a suite 207
of independent variables that may be either correlated with risk, indicators of risk or causal 208
drivers of risk (the distinction between these three different types of independent variables 209
is not obvious at the start of many studies but tends to become clearer over time, as was the 210
case with lung cancer). The statistical model of risk therefore seeks robust statistical 211
descriptions of levels of risk based on the measured levels of the independent variables. 212
Various kinds of regression and odds ratio models can be employed here. 213
In contrast to statistical models, biological models consist of components, each of which 214
captures one or other important biological feature of the know infection pathway. For 215
example, a model for the extrinsic incubation period (defined above) will incorporate 216
temperature as a causal variable determining the duration of the EIP. During the EIP, 217
however, the insect may die either from abiotic (temperature, rainfall) or biotic (predation) 218
effects each of which may be incorporated into full biological models of disease 219
transmission. Characteristic of many biological systems are thresholds (pathogens will not 220
develop at all below a threshold temperature), break-points (mortalities may be low at low 221
densities and then increase above a certain level of abundance of competitors, parasites or 222
predators of the vectors) and non-linearities (insect mortality rates increase at increasing 223
rates at the upper end of their thermal tolerance ranges). The ideal biological model must 224
therefore be able to describe all aspects of each and every threshold, break-point and non-225
linearity at all points of the transmission pathway and this is often beyond the limits of our 226
present knowledge and capabilities. Instead, relatively simplistic but still biologically - 227
based models can go a long way towards describing the overall characteristics of diseases, 228
if not their finer points. Classic examples of simple but powerful biological models for 229
12
vector-borne diseases involve calculation of the key epidemiological variable, R0, the 230
disease’s basic reproductive number, or the number of secondary cases arising in an 231
entirely susceptible population from one case of the disease at the present time. This index 232
can be used to predict if a vector-borne disease can establish after introduction in a certain 233
area and under certain climatic and environmental conditions 33. It has several advantages 234
over statistical methods, such as the clear biological and epidemiological interpretation of 235
its values, and the flexibility for simulating different scenarios. However, even the 236
relatively simplified R0 equation requires estimates of many different parameters and the 237
knowledge of the relevant biological processes involved (for example, the R0 equation for 238
insect vectors is quite different from that for ticks). In addition, theoretical studies show 239
that R0 is related to disease prevalence at equilibrium (i.e. the former might therefore be 240
used to predict the latter). But it is a moot point as to how often diseases are in fact in 241
equilibrium, and therefore how often the R0 approach is applicable; vector-borne diseases 242
are often seasonal and many emerging and re-emerging vector-borne diseases of interest are 243
clearly not in equilibrium. 244
An alternative approach for vector-borne diseases is therefore to fall back on the sorts 245
of statistical methods applied to diseases of unknown aetiology. This would appear to be a 246
backward step (why ignore all the information we have on causal pathways in the 247
transmission of vector-borne diseases?) but it may be the only approach we can take when 248
we are unclear about key aspects of transmission, all of which must be understood for the 249
biological approach to succeed. For example, West Nile virus in the USA infects at least 250
100 species of mammals and birds and is potentially transmitted by up to 70 or more 251
different mosquito species; what chance, ever, is there of being able to quantify the myriad 252

13
interactions there might be between this number of vectors and hosts? In such a context, 253
statistical models ignore many of the details of biological transmission and look for direct 254
correlations between environmental variables and vector or disease outcomes 10. This 255
approach clearly ‘short-circuits’ the often tortuous biological pathways involved in 256
transmission, and depends for its success on close, predictable and unchanging links 257
between predictor and predicted variables. That this approach is often successful is due 258
entirely to the sensitivity of many vector-borne diseases to climate (most of the parameters 259
of the R0 equation for vector-borne diseases are vector-related and hence sensitive to 260
climate and environment). Risk assessments here are based on modelled correlations 261
between the vector’s distribution and or abundance, or past disease presence/incidence, and 262
sets of environmental variables. In the first case (based on vector distribution/abundance), 263
analyses are excellent predictors of risk to individuals. It is, however, difficult to translate 264
them into measures of human disease incidence or prevalence, both population-level 265
measures of risk. In the second (based on past incidence/prevalence) the risk assessment is 266
clearly based on the past exposure of the local human population to disease risk, something 267
that is affected not just by the absolute risk in each area, but by the amount of human 268
exposure to that risk, dependent on both human population density and behaviour. The 269
resulting risk assessment, therefore involves the often unacknowledged component of 270
human behaviour, which is sometimes more important than human population in 271
determining disease incidence or prevalence 34. 272
Commercial trade and human travel add additional levels of complexity. Examples 273
here include the connectivity/mobility analysis of humans (e.g. air travel, 35, and goods 24) 274
in which risk is often calculated from a crude or probabilistic combination of suitable 275

14
habitat in the arrival area for the pathogen or vector (brought in by tourism or trade) and the 276
rate at which such importation occurs. 277
As a result of the application of the above approaches, risk can be expressed as 278
incidence, prevalence, occurrence, cumulative cases (as for the West Nile Virus map used 279
by CDC) or, alternatively, as other metrics that generally represent a portion of the disease 280
transmission process, for example the probability of pathogen establishment according to 281
the probability of introduction24, 35, the probability of contact between host and vectors but 282
not humans 36 or between host capacities (a rate of vector infection from the host species), 283
vector-host feeding preferences and, finally, human biting rates per vector 37. Risk metrics 284
are hence based on the information available (see the attempt of 38 to produce a uniform 285
scheme) and are rarely expressed as a probability (apart from the few examples given here), 286
which is the canonical form for risk as defined for public health (see the introduction 287
section). 288
289
The statistical and mechanistic approaches to risk modelling and prediction are many 290
and varied, including discriminant analysis, generalized linear models (e.g. logistic 291
regression, autoregressive regression, Poisson models etc…), generalized additive models, 292
mixed models, tree based classifications, fractals, spectral density, wavelets, agent based, 293
cellular automata, maximum entropy, multicriteria analysis, community models among 294
others 12, 24, 36, 39, 40. Examples of applications of these models can be found in the 295
quantitative risk assessment as defined by the World Organisation for Animal Health (OIE) 296
(Terrestrial Animal Health Code 41); WHO (numerical approaches to the quantification of 297
risk 42); International Risk Governance Council (IRGC) 43; EFSA 44; International 298

15
Organisation for Standardization (ISO 31000)45; and the National Research Council of the 299
United States 46. It is well established that different models often give different outputs 300
(e.g. the dengue models compared in 47), hence a procedure for their validation and 301
comparison is needed. 302
A further complication, which is often ignored in vector and disease risk mapping, is 303
that of spatial dependency of the disease, which arises for two main reasons. Firstly, simple 304
geographic proximity means that epidemiological outcomes often depend on disease events 305
occurring in nearby locations (e.g. pathogen transmission may occur between areas that are 306
close to each other, or infected vectors might fly, or infected humans move, between them). 307
Secondly the environmental conditions that favour the occurrence of a vector or disease in 308
one area are likely to be similar in nearby areas and so promote the occurrence of the same 309
disease in those areas, too. Whatever the cause of spatial dependency is, it may be used to 310
improve the predictions of vector-borne disease models to render them truly spatial. Spatial 311
dependency is included in models in many different ways, from the simple auto-logistic 312
regression approach of considering the occurrence of the species only in the most adjacent 313
grid squares to the more complex approach of using the techniques of kriging and cokriging 314
(directly or combined with deterministic models). The unwary biologist or modeller should 315
be warned that kriging and cokriging often applies only to predicting errors from a 316
modelled ‘mean’ surface, the latter imagined to be constant or trending in a simple way 317
(e.g. dependent on environmental variables) 48. The biological interest is therefore really in 318
the trend surface rather than in the kriging results 49. Kriging thus contributes an important 319
and usually neglected component to risk maps; the prediction of errors indicating the 320
variability of the modelled result at different points in space (and time, with spatio-temporal 321

16
models), and hence the statistical significance of the trend. The size of such errors 322
generally depends upon the amount and variability of the data available; errors are 323
minimized when there is a sufficient amount of local data, all with similar mean values 324
(which is not always the case for vector-borne diseases such as malaria) 50. 325
Today we are still experiencing risk maps 51 52 based simply on the un-modelled 326
distribution of diseases, pathogens or conditions, or real-time data from online warning 327
systems and media sources (Table 2), or from informal exchanges between public health 328
professionals ("Event-based" surveillance) 53. Despite increasing use of disease mapping, 329
for which often quality cannot be evaluated, it is urgent to define a policy for disease risk 330
mapping assessment (within the risk governance framework) in order to obtain products of 331
similar statistical quality. 332
Uncertainty is a common feature of risk assessment of meteorological events and 333
earthquakes, but it is usually not applied in vector-borne disease risk mapping. In the past, 334
uncertainty was obtained from sensitivity analyses by simply varying (within fixed ranges) 335
the values chosen for the parameters and variables. Rarely do sensitivity analyses consider 336
variation of more than one parameter/variable at a time. Interactions between variables may 337
be investigated using hyper-cube sampling of variables, but gives no real indication of the 338
likely variability of each of the parameters in the field 54. 339
Today, the most successful models use a Bayesian approach to predicting both the level of 340
risk and the uncertainty of that prediction 55. This approach is usually applied when 341
knowledge of the process is available and converted into distributional forms, but is also 342
used for hypothesis testing and uncertainty measurement. These new Bayesian approaches 343
are ideal for the relatively small datasets often found in epidemiology, for which the 344
17
frequentist approaches are unable to include prior knowledge 56 although they are robust for 345
small sample size. Frequentist studies are based on the hypothetical question “Given ten 346
thousand versions of reality, on how many occasions would we observe an outcome as 347
extreme as that shown by the data?” If the occasions are very few, then the result is likely 348
to be ‘significant’, i.e. it is unlikely to be a member of the ten thousand versions of reality 349
generated by the hypothesis being tested. Unfortunately, however, there is only one version 350
of reality and so the above question remains a hypothetical one. The one version of reality, 351
that we do have, generates the data that we record. These data may have been produced by 352
a variety of different mechanisms which we can test in the Bayesian modelling approach to 353
answer the question; “Given this particular dataset, is hypothesis/model A more likely than 354
hypothesis/model B?” Not only do Bayesian statistics allow us to distinguish between 355
alternative hypotheses, they also involve estimation of the errors of the different parameters 356
involved, allowing the output models not only to predict mean risk, but also the errors and 357
uncertainties of those mean risks 34, 57. From the practical point of view, the main 358
differences between the Bayesian and the more traditional frequentist approach are the use 359
of prior and posterior distributions. The latter is the main output of the Bayesian approach 360
and expresses as a probability, the weighted average of the prior (a priori knowledge) and 361
the data (through its likelihood) via the Bayesian theorem 58. 362
363
A third model category exists in Public Health applications, based on expert opinions, 364
or other experience, and referred to as participatory models 59. An example is the 365
vaccination-advice map for yellow fever 60 based on expert opinion that decided specific 366
thresholds for certain environmental variables thought to be key to transmission (for 367

18
example, elevation, land cover etc…) 61. This map categorises risk into four classes: 368
endemic, transitional, low risk and no risk 61. Vaccination is “recommended” for those 369
areas that are classified as endemic and transitional, and also for low risk areas if a 370
prolonged stay is expected. In brief, this semi-quantitative risk assessment is the result of a 371
complex process involving data acquisition, data analysis and data discussion in which 372
modellers, national experts and epidemiologists are involved 60. The role of the health 373
practitioner using such a map is to merge the information given by the guidelines with 374
individual characteristics of the person to be exposed to the disease risk (age, gender, 375
medical history, vaccination history) and trip information (destination, departure date, 376
duration of the travel, purpose of travel) 62. Whilst the final decision here (to vaccinate or 377
not) is based on a subjective weighing of the evidence by the medical practitioner or health 378
agency involved, this decision is likely to be better informed if based upon more accurate, 379
quantitative risk maps. The unplanned surveillance and control in Sudan, for areas that are 380
recognised of endemic transmission for yellow fever, may have contribute to the recent 381
uncontrolled outbreaks in Sudan, which required a mass-vaccination treatment of the 382
population 63. 383
384
In summary, while risk governance is a framework that is very homogeneous between 385
international organisations and scientists 1, the risk assessment component is not 386
standardised, and often not defined at all. For example, in the OIE terrestrial code a list of 387
statistics necessary for risk assessment is given without mention of their uncertainty. EFSA 388
describes the full risk assessment framework, which includes uncertainty, but is not flexible 389
enough to be adapted for general use. Other agencies require semi-quantitative approaches 390

19
with a strong stakeholder component (IRGC and WHO). The seminal work of 1 adapted 391
the IRGC risk governance framework to the case of vector-borne diseases for which they 392
provide generic, but not methodological, guidelines for a pre-assessment and appraisal of 393
the risk. Apart from the useful indication on the data requested for public health utility, the 394
authors did not however, explore the issues related to the existing variability in the data, 395
methods and outputs used for risk estimation. Risk assessment for vector-borne diseases 396
wss only defined in its general aspects, and a framework which guarantees high quality 397
disease mapping and comparable analyses, was missing. 398
399
5. Conclusions. 400
Risk governance is the main component of PH measures (prevention, management, 401
surveillance and communication) and is scientifically and legally defined. Although the 402
same basic framework is followed, each risk assessment tends to be uniquely determined by 403
the details of the particular disease under study, the data available for it and the region and 404
time period over which those data were collected. In a recent review on the impact of 405
drought on vector-borne diseases for UK 64, the authors underlined the undefined risk 406
associated with climate change and human adaptation due to the lack of relevant data 65. In 407
addition, the competence of existing or newly introduced insect vectors in Europe to 408
transmit diseases that are currently confined mostly to the tropics 36 11, 66 are unknown as 409
they ways in which they are transported 24, 35, 37. At present time, when different models 410
and analyses are applied to the same problem, they often produce results that are difficult to 411
compare quantitatively because of unknown model and data uncertainties. 412

20
Hence, new dynamic and flexible approaches are required, determined by the Public 413
Health framework and the inherent complexity and unique characteristics of each system 414
being investigated. 415
Anthropological, zoological or entomological (or a combination of these) disease risk 416
assessment 67 needs to be addressed quantitatively, wherever possible, and submitted with a 417
quality assessment in order to evaluate tolerability and adaptability of the risk1; and to 418
enable successful public health measures to be adopted 68, since simple interventions are 419
often impossible (for many vector-borne diseases there is no available treatment or vaccine 420
69). 421
Successful application of control measures in the future depends on the reliability of 422
the uncertainty estimations 40. Even if uncertainty sometimes cannot be reduced 70, it is 423
important for policy-makers to have an accurate estimate of it to support action if the risk 424
estimates warrant it, in order to avoid over- and under-estimations of risk 49. 425
In conclusion we make the following recommendations for the future: 426
1) A standard risk assessment within a risk governance framework for vector-borne 427
diseases as proposed by 1 should be produced and accepted, that includes 428
experiences and lessons from the various agencies involved in risk assessment 429
(e.g. OIE, FAO, EFSA, WHO, SANCO) and from OneHealth actions 71; 430
2) A comparative review should be carried out of Public Health model selection 431
decisions and model evaluations (as done by 72 for species’ distributions); 432
3) Quantitative approaches should be used in participatory analyses leading to risk 433
assessment 73, 74; 434

21
4) In conformity with the definition of risk in public health, risk should be expressed 435
as a probability; 436
5) All models used for making Public Health decisions should include estimates of 437
model uncertainty 75; 438
6) The spatial and temporal validity of models (i.e. up to what distances and times 439
are the model error levels acceptable) should always be assessed; 440
7) Finally, data should routinely be gathered that can contribute to Public Health 441
preparedness for future outbreaks of vector-borne and other diseases. 442
preparedness for which quality and availability of the data need to be assessed for 443
future emergencies. 444
445
Acknowledgments 446
L.S. and D.J.R. are supported by the European Union grant HEALTH-F3-2010-261504 447
EDENext; this paper is catalogued by the EDEN Steering Committee as EDENext XXXX 448
(http://www.edenext.eu). The contents are the sole responsibility of the authors and do not 449
necessarily reflect the views of the European Commission. 450
451
Competing interests: None declared. The funders had no role in the study design; in the 452
collection, analysis and interpretation of data; in the writing of the manuscript; and in the 453
decision to submit the manuscript for publication. 454
455
Ethical approval: Not required. This research is a review and does not include human 456
subjects. 457

22
458

23
References 459
1. Schmidt K, Dressel KM, Niedrig M, Mertens M, Schule SA, Groschup MH. Public 460
health and vector-borne diseases - a new concept for risk governance. Zoonoses and public 461
health. 2013; 60:528-38. 462
2. Fleming ML, Parker E. Introduction to Public Health: Elsevier Health Sciences 463
APAC; 2009. 464
3. Dicker R, Coronado F, Koo D, Gibson Parrish R. Principles of epidemiology in 465
public health practice. 2006:512. 466
4. Thompson KM, Deisler PF, Jr., Schwing RC. Interdisciplinary vision: the first 25 467
years of the Society for Risk Analysis (SRA), 1980-2005. Risk Anal. 2005; 25:1333-86. 468
5. Stärk KDC, Regula G, Hernandez J, Knopf L, Fuchs K, Morris RS, et al. Concepts 469
for risk-based surveillance in the field of veterinary medicine and veterinary public health: 470
review of current approaches. BMC Health Serv Res. 2006; 6:20. 471
6. Gostin LO, Fund MM. Public Health Law and Ethics: A Reader: University of 472
California Press; 2010. 473
7. WHO. World Malaria Report 2013: World Health Organization; 2014. 474
8. Medlock J, Jameson L. Ecological approaches to informing public health policy and 475
risk assessments on emerging vector-borne zoonoses. Emerging health threats journal. 476
2010; 3:e1. 477
9. Nasci RS. Movement of Chikungynya Virus into the Western Hemisphere. 478
Emerging Infectious Diseases. 2014; 20:1394-5. 479
10. Brownstein JS, Rosen H, Purdy D, Miller JR, Merlino M, Mostashari F, et al. 480
Spatial analysis of West Nile virus: rapid risk assessment of an introduced vector-borne 481
zoonosis. Vector Borne Zoonotic Dis. 2002; 2:157-64. 482
11. Robin CA, Lo Iacono G, Gubbins S, Wood JL, Newton JR. The accuracy of the 483
National Equine Database in relation to vector-borne disease risk modelling of horses in 484
Great Britain. Equine Vet J. 2013; 45:302-8. 485
12. Zavaleta JO, Rossignol PA. Community-level analysis of risk of vector-borne 486
disease. Transactions of the Royal Society of Tropical Medicine and Hygiene. 2004; 487
98:610-8. 488
13. Romi R, Boccolini D, Menegon M, Rezza G. Probable autochthonous introduced 489
malaria cases in Italy in 2009-2011 and the risk of local vector-borne transmission. Euro 490
Surveill. 2012; 17. 491
14. Winters AM, Eisen RJ, Delorey MJ, Fischer M, Nasci RS, Zielinski-Gutierrez E, et 492
al. Spatial risk assessments based on vector-borne disease epidemiologic data: importance 493
of scale for West Nile virus disease in Colorado. The American journal of tropical medicine 494
and hygiene. 2010; 82:945-53. 495
15. Lorenz A, Dhingra R, Chang HH, Bisanzio D, Liu Y, Remais JV. Inter-model 496
comparison of the landscape determinants of vector-borne disease: implications for 497
epidemiological and entomological risk modeling. PloS one. 2014; 9:e103163. 498
16. Matthews GW, Markiewicz M, Beitsch LM. Legal frameworks supporting public 499
health department accreditation: lessons learned from 10 states. J Public Health Manag 500
Pract. 2012; 18:E8-E16. 501
17. Bennett P. Risk Communication and Public Health: OUP Oxford; 2010. 502

24
18. Committee on Risk Assessment of Hazardous Air Pollutants, Board on 503
Environmental Studies and Toxicology, Commission on Life Sciences. Science and 504
Judgment in Risk Assessment: National Academies Press; 1994. 505
19. Rowe WD. An anatomy of risk. New York ; London: Wiley; 1977. 506
20. EPA. Health Risk and Economic Impact Assessments of Suspected Carcinogens: 507
Interim Procedures & Guidelines. In: Agency USEP, editor.: Federal Register; 1976. p. 508
21402-5. 509
21. OTA. Assessment of technologies for determining cancer risks from the 510
environment. Washington, D.C.: U.S. Office of Technology Assessment1981 June. 511
22. National Research Council N. Risk Assessment in the Federal Government: 512
Managing the Process: The National Academies Press; 1983. 513
23. Joint Consultation FAO and WHO Expert FW. Application of Risk Analysis to 514
Food Standards Issues. Geneva: WHO WHO: FNU/FOS/95.31995. 515
24. Thomas SM, Tjaden NB, van den Bos S, Beierkuhnlein C. Implementing cargo 516
movement into climate based risk assessment of vector-borne diseases. International 517
journal of environmental research and public health. 2014; 11:3360-74. 518
25. Burt FJ, Rolph MS, Rulli NE, Mahalingam S, Heise MT. Chikungunya: a re-519
emerging virus. Lancet. 2012; 379:662-71. 520
26. Depoortere E, Coulombier D. Chikungunya risk assessment for Europe: 521
recommendations for action. Euro Surveill. 2006; 11:E060511 2. 522
27. ECDC. Development of Aedes albopictus risk maps. 2009. 523
28. EFSA Panel on Animal Health and Welfare. Scientific Opinion on Rift Valley 524
Fever. EFSA Journal. 2013; 11:1-48. 525
29. EFSA Panel on Animal Health and Welfare. The risk of Rift Valley Fever incursion 526
and its persistence within the community. EFSA Journal. 2005:1-128. 527
30. Matthews G, Zaim M, Yadav RS, Soares A, Hii J, Ameneshewa B, et al. Status of 528
legislation and regulatory control of public health pesticides in countries endemic with or at 529
risk of major vector-borne diseases. Environ Health Perspect. 2011; 119:1517-22. 530
31. Donaldson A, Lee R, Ward N, Willkinson K. Foot and mouth - five years on: the 531
legacy of the 2001 foot and mouth disease crisis for farming and the British countryside. 532
Newcastle Upon Tyne: University of Newcastle Upon Tyne2006 2006. 533
32. Peck DF. Foot and mouth outbreak: lessons for mental health services. Advances in 534
Psychiatric Treatment. 2005; 11:270-6. 535
33. Hartemink N, Vanwambeke SO, Heesterbeek H, Rogers D, Morley D, Pesson B, et 536
al. Integrated mapping of establishment risk for emerging vector-borne infections: a case 537
study of canine leishmaniasis in southwest France. PloS one. 2011; 6:e20817. 538
34. Lawson A, Biggeri A, Böhning D, Lesaffre E, Viel J-F, Bertollini R. Disease 539
mapping and risk assessment for public health: John Wiley & Sons; 1999. 540
35. Huang Z, Das A, Qiu Y, Tatem AJ. Web-based GIS: the vector-borne disease 541
airline importation risk (VBD-AIR) tool. International journal of health geographics. 2012; 542
11:33. 543
36. Tran A, Ippoliti C, Balenghien T, Conte A, Gely M, Calistri P, et al. A geographical 544
information system-based multicriteria evaluation to map areas at risk for Rift Valley fever 545
vector-borne transmission in Italy. Transbound Emerg Dis. 2013; 60 Suppl 2:14-23. 546
25
37. Bosch J, Munoz MJ, Martinez M, de la Torre A, Estrada-Pena A. Vector-borne 547
pathogen spread through ticks on migratory birds: a probabilistic spatial risk model for 548
South-Western europe. Transbound Emerg Dis. 2013; 60:403-15. 549
38. Hay SI, Battle KE, Pigott DM, Smith DL, Moyes CL, Bhatt S, et al. Global 550
mapping of infectious disease. Philos Trans R Soc Lond B Biol Sci. 2013; 368:20120250. 551
39. Meltzer MI. The potential use of fractals in epidemiology. Preventive veterinary 552
medicine. 1991; 11:255-60. 553
40. Lawson AB. Statistical Methods in Spatial Epidemiology: Wiley; 2006. 554
41. World Organization for Animal Health O. Terrestrial Animal Health Code 2012: 555
Renouf Publishing Company Limited; 2012. 556
42. Ezzati M, Lopez AD, Rodgers A, Murray CJL, editors. Comparative quantification 557
of health risks: Global and regional burden of disease attributable to selected major risk 558
factors. Geneva: World Health Organization; 2004. 559
43. Renn O, Walker KD. Global Risk Governance: Concept and Practice Using the 560
IRGC Framework: Springer London, Limited; 2008. 561
44. EFSA Panel on Animal Health and Welfare. Guidance on Risk Assessment for 562
Animal Welfare. EFSA Journal. 2012; 10:1-30. 563
45. Hopkin P. Fundamentals of Risk Management: Understanding, Evaluating and 564
Implementing Effective Risk Management: Kogan Page; 2012. 565
46. National Research Council N. Science and Decisions: Advancing Risk Assessment: 566
The National Academies Press; 2009. 567
47. Rogers DJ, Suk JE, Semenza JC. Using global maps to predict the risk of dengue in 568
Europe. Acta tropica. 2014; 129:1-14. 569
48. Rogers DJ, Sedda L. Statistical models for spatially explicit biological data. 570
Parasitology. 2012; 139:1852-69. 571
49. Gelfand AE, Diggle P, Guttorp P, Fuentes M. Handbook of Spatial Statistics: 572
Taylor & Francis; 2010. 573
50. Clayton D, Kaldor J. Empirical Bayes estimates of age-standardized relative risks 574
for use in disease mapping. Biometrics. 1987:671-81. 575
51. Maantay JA. Geospatial Analysis of Environmental Health: Springer London, 576
Limited; 2011. 577
52. Kitron U. Risk maps: transmission and burden of vector-borne diseases. Parasitol 578
Today. 2000; 16:324-5. 579
53. Keller M, Blench M, Tolentino H, Freifeld CC, Mandl KD, Mawudeku A, et al. Use 580
of unstructured event-based reports for global infectious disease surveillance. Emerg Infect 581
Dis. 2009; 15:689-95. 582
54. Rothman KJ, Greenland S, Lash TL. Modern Epidemiology: Wolters Kluwer 583
Health/Lippincott Williams & Wilkins; 2008. 584
55. Elliott P, Best N. Spatial epidemiology: methods and applications: Oxford 585
University Press; 2001. 586
56. Ghosh M, Natarajan K, Waller LA, Kim D. Hierarchical Bayes GLMs for the 587
analysis of spatial data: An application to disease mapping. Journal of Statistical Planning 588
and Inference. 1999; 75:305-18. 589
57. Elliott P, Wartenberg D. Spatial Epidemiology: Current Approaches and Future 590
Challenges. Environmental Health Perspectives. 2004; 112:998-1006. 591
26
58. Pelosse P, Kribs-Zaleta CM, Ginoux M, Rabinovich JE, Gourbiere S, Menu F. 592
Influence of Vectors' Risk-Spreading Strategies and Environmental Stochasticity on the 593
Epidemiology and Evolution of Vector-Borne Diseases: The Example of Chagas' Disease. 594
PloS one. 2013; 8. 595
59. Fuller D, Troyo A, Alimi T, Beier J. Participatory risk mapping of malaria vector 596
exposure in northern South America using environmental and population data. Applied 597
Geography. 2014; 48:1-7. 598
60. Hill DR. Mapping the risk of yellow Fever infection. Current infectious disease 599
reports. 2012; 14:246-55. 600
61. Jentes ES, Poumerol G, Gershman MD, Hill DR, Lemarchand J, Lewis RF, et al. 601
The revised global yellow fever risk map and recommendations for vaccination, 2010: 602
consensus of the Informal WHO Working Group on Geographic Risk for Yellow Fever. 603
The Lancet Infectious Diseases. 2011; 11:622-32. 604
62. Field VK, Ford LMM, Hill DR. Health information for overseas travel : prevention 605
of illness in travellers from the UK. [Rev. ed.]. ed. London: National Travel Health 606
Network and Centre; 2010. 607
63. Markoff L. Yellow Fever Outbreak in Suda. The NEW ENGLAND JOURNAL of 608
MEDICINE. 2013; 368:689-71. 609
64. Brown L, Medlock J, Murray V. Impact of drought on vector-borne diseases--how 610
does one manage the risk? Public health. 2014; 128:29-37. 611
65. Braks M, van Ginkel R, Wint W, Sedda L, Sprong H. Climate change and public 612
health policy: translating the science. International journal of environmental research and 613
public health. 2014; 11:13-29. 614
66. Eisen L, Wong D, Shelus V, Eisen RJ. What is the risk for exposure to vector-borne 615
pathogens in United States national parks? Journal of medical entomology. 2013; 50:221-616
30. 617
67. Eisen RJ, Eisen L. Spatial modeling of human risk of exposure to vector-borne 618
pathogens based on epidemiological versus arthropod vector data. Journal of medical 619
entomology. 2008; 45:181-92. 620
68. Pohjola MV, Leino O, Kollanus V, Tuomisto JT, Gunnlaugsdottir H, Holm F, et al. 621
State of the art in benefit-risk analysis: environmental health. Food and Chemical 622
Toxicology. 2012; 50:40-55. 623
69. Setbon M, Raude J. Population response to the risk of vector-borne diseases: 624
lessons learned from socio-behavioural research during large-scale outbreaks. Emerging 625
health threats journal. 2009; 2:e6. 626
70. Renn O, Klinke A, van Asselt M. Coping with Complexity, Uncertainty and 627
Ambiguity in Risk Governance: A Synthesis. Ambio. 2011; 40:231-46. 628
71. Palatnik-de-Sousa CB, Day MJ. One Health: the global challenge of epidemic and 629
endemic leishmaniasis. Parasites & vectors. 2011; 4:197. 630
72. Elith J, Leathwick JR. Species Distribution Models: Ecological Explanation and 631
Prediction Across Space and Time. Annual Review of Ecology, Evolution, and 632
Systematics. 2009; 40:677-97. 633
73. Stirling AC, Scoones I. From Risk Assessment to Knowledge Mapping: Science, 634
Precaution, and Participation in Disease Ecology. Ecology & Society. 2009; 14. 635

27
74. Hongoh V, Hoen AG, Aenishaenslin C, Waaub JP, Belanger D, Michel P. Spatially 636
explicit multi-criteria decision analysis for managing vector-borne diseases. International 637
journal of health geographics. 2011; 10:70. 638
75. Reiter P, Thomas CJ, Atkinson PM, Hay SI, Randolph SE, Rogers DJ, et al. Global 639
warming and malaria: a call for accuracy. The Lancet Infectious Diseases. 2004; 4:323-4. 640
76. Suter Ii GW, Norton SB, Barnthouse LW. The Evolution of Frameworks for 641
Ecological Risk Assessment from the Red Book Ancestor. Human and Ecological Risk 642
Assessment: An International Journal. 2003; 9:1349-60. 643
77. European Commission. Regulation (EC) No 178/2002 of the European Parliament 644
and of the Council of 28 January 2002 laying down the general principles and requirements 645
of food law, establishing the European Food Safety Authority and laying down procedures 646
in matters of food safety. Official Journal of the European Communities. 2002; 45:1-24. 647
78. Mindell JS, Boltong A, Forde I. A review of health impact assessment frameworks. 648
Public health. 2008; 122:1177-87. 649
79. World Health Organization W. International Health Regulations (2005): Nonserial 650
Publication: World Health Organization; 2006. 651
80. Ezzati M, Lopez AD, Rodgers AA, Murray CJL. Comparative Quantification of 652
Health Risks: Global and Regional Burden of Disease Attributable to Selected Major Risk 653
Factors: Organisation mondiale de la santé; 2004. 654
81. European Commission. Regulation (EC) No. 851/2004 of the European Parliament 655
and of the Council of 21 April 2004 establishing a European centre for disease prevention 656
and control. Official Journal of the European Union. 2004; 47:1-11. 657
82. European Commission. White paper: Together for Health: A Strategic Approach for 658
the EU 2008-2013. [white paper]. In press 2007. 659
83. Brunette GW, Kozarsky PE, Magill AJ, Shlim DR, Whatley AD, editors. CDC 660
Health Information for International Travel : The Yellow Book 2012. Oxford: Oxford 661
University Press; 2012. 662
84. Parola P. Eurotravnet. Trop Med Int Health. 2011; 16:51-. 663
85. Team HW. Travax-Travel Health-HPS. 2006. 664
86. Lindsey NP, Brown JA, Kightlinger L, Rosenberg L, Fischer M. State health 665
department perceived utility of and satisfaction with ArboNET, the U.S. National Arboviral 666
Surveillance System. Public Health Rep. 2012; 127:383-90. 667
87. Zeldenrust ME, Rahamat-Langendoen JC, Postma MJ, van Vliet JA. The value of 668
ProMED-mail for the Early Warning Committee in the Netherlands: more specific 669
approach recommended. Euro Surveill. 2008; 13. 670
88. Freifeld CC, Mandl KD, Reis BY, Brownstein JS. HealthMap: global infectious 671
disease monitoring through automated classification and visualization of Internet media 672
reports. Journal of the American Medical Informatics Association : JAMIA. 2008; 15:150-673
7. 674
89. Collier N, Doan S, Kawazoe A, Goodwin RM, Conway M, Tateno Y, et al. 675
BioCaster: detecting public health rumors with a Web-based text mining system. 676
Bioinformatics. 2008; 24:2940-1. 677
90. Tolentino H, Kamadjeu R, Fontelo P, Liu F, Michael Matters M, Marjorie Pollack 678
M, et al. Scanning the Emerging Infectious Diseases Horizon - Visualizing ProMED 679
Emails Using EpiSPIDER. Advances in Disease Surveillance. 2007; 2. 680

28
91. Flahault A, Dias-Ferrao V, Chaberty P, Esteves K, Valleron AJ, Lavanchy D. 681
FluNet as a tool for global monitoring of influenza on the Web. JAMA : the journal of the 682
American Medical Association. 1998; 280:1330-2. 683
92. Welte VR, Vargas Teran M. Emergency Prevention System (EMPRES) for 684
transboundary animal and plant pests and diseases. The EMPRES-livestock: an FAO 685
initiative. Annals of the New York Academy of Sciences. 2004; 1026:19-31. 686
93. Jebara KB, Caceres P, Berlingieri F, Weber-Vintzel L. Ten years' work on the 687
World Organisation for Animal Health (OIE) Worldwide Animal Disease Notification 688
System. Preventive veterinary medicine. 2012; 107:149-59. 689
94. Pelat C, Turbelin C, Bar-Hen A, Flahault A, Valleron A. More diseases tracked by 690
using Google Trends. Emerg Infect Dis. 2009; 15:1327-8. 691
692
693
694
29
Table 1. Main documents defining risk analysis for public health purposes. 695
Year Agency Document
1960-1970 Various US agencies Recommendations, Guidelines, standards 76
1981 The Society for Risk Analysis (SRA) Vision Statement 4
1983 National Research Council of the US
(NRC)
Red Book 22
1995 Food and Agriculture Organisation of
United Nations (FAO)
Risk analysis and food: the experts’ view 23
2002 European Commission Regulation 178/2002 77
2002 World Organisation for Animal Health
(OIE)
Terrestrial Animal Health Code 41
1999-2005 World Health Organisation (WHO) Health Impact Assessment 78; International
Health Regulations 79; Comparative
Quantification of Health Risks 80
2005 European Commission Regulation 851/2004 81
2005 International Risk Governance Council
(IRGC)
White paper on risk governance (towards an
integrative approach) 43.
2007 European Commission White paper on the health strategy for years
2008-2013 82.
2009 National Research Council of the US
(NRC)
Science and Decisions: Advancing Risk
Assessment 46
2012 European Food Safety Authority Guidance on risk assessment for animal
welfare 44
696
697

30
Table 2. Surveillance and risk communication websites with a focus on vector-borne 698
diseases. 699
Organisation Description Website Reference
CDC Travel health. http://wwwnc.cdc.gov/
travel/
83
ECDC Travel health. http://www.istm.org/eu
rotravnet/main.html
84
NaTHNac Travel health. http://www.nathnac.or
g/travel/
62
NHS Travel health. http://www.travax.nhs.
uk/
85
CDC Arbonet is a site for displaying vector-borne
disease maps based solely on recorded cases
of each disease (i.e. not on models). Maps
are updated continuously as new
surveillance data are acquired.
http://www.cdc.gov/ncid
od/dvbid/westnile/USGS
_frame.html
86
ProMed An internet reporting system aimed at
providing early warning of global threats to
human health
http://www.promedmail.
org/.
87
HealthMap An online cartographic resource maintained
by the Computational Epidemiology Group
of the Children's Hospital, Boston, U.S.A.
The site offers real-time surveillance of
emerging health threats around the world. It
uses an algorithm that monitors eleven
sources of news and reports, among them
http://healthmap.org/en/. 88

31
ProMED-mail, Google News, WHO, OIE
and ECDC.
BioCaster Real-time surveillance website that tracks
over 1700 RSS feeds and plots emerging
health events in Google Maps.
http://born.nii.ac.jp/_dev/
.
89
EpiSPIDER Identifies potential outbreaks by screening
news reports and Twitter feeds (only English
texts) with a naive Bayesian classification
service, then refining the output with web-
based text miners.
http://www.epispider.org/
.
90
WHO FluNet website receives influenza
virological data from national laboratories
and WHO regional databases.
http://www.who.int/influ
enza/gisrs_laboratory/flu
net/en/.
91
FAO EMPRES-i is a global animal disease
information system based on a collection of
official (e.g. governmental) and unofficial
(e.g. personal contacts, NGOs) sources and
displayed on Google Maps
http://empres-
i.fao.org/eipws3g/
92
OIE WAHID provide access to the data held by
OIE on past, present and immediate animal
disease notification.
http://www.oie.int/wahis
_2/public/wahid.php/Wa
hidhome/Home
93
Google Google Flu trends uses regional search
engine results relating to influenza to detect
possible outbreaks.
http://www.google.org/fl
utrends/
94
700