risk-based inspection -...
TRANSCRIPT

Risk-Based Inspection
API RECOMMENDED PRACTICE 580 SECOND EDITION, NOVEMBER 2009
Copyright American Petroleum Institute Provided by IHS under license with API
Not for ResaleNo reproduction or networking permitted without license from IHS
--`,,```,,,,````-`-`,,`,,`,`,,`---
//^:^^#^~^^"~~:~"~$$"~$^"#:*~:^#~#~^~@~:^:#*:^$:$~:*"\\

Copyright American Petroleum Institute Provided by IHS under license with API
Not for ResaleNo reproduction or networking permitted without license from IHS
--`,,```,,,,````-`-`,,`,,`,`,,`---
//^:^^#^~^^"~~:~"~$$"~$^"#:*~:^#~#~^~@~:^:#*:^$:$~:*"\\

Risk-Based Inspection
Downstream Segment
API RECOMMENDED PRACTICE 580 SECOND EDITION, NOVEMBER 2009
Copyright American Petroleum Institute Provided by IHS under license with API
Not for ResaleNo reproduction or networking permitted without license from IHS
--`,,```,,,,````-`-`,,`,,`,`,,`---
//^:^
^#^~
^^"~
~:~"
~$$"
~$^"
#:*~
:^#~
#~^~
@~:
^:#*
:^$:
$~:*
"\\

Special Notes
API publications necessarily address problems of a general nature. With respect to particular circumstances, local, state, and federal laws and regulations should be reviewed.
API is not undertaking to meet the duties of employers, manufacturers, or suppliers to warn and properly train and equip their employees, and others exposed, concerning health and safety risks and precautions, nor undertaking their obligations under local, state, or federal laws.
Information concerning safety and health risks and proper precautions with respect to particular materials and conditions should be obtained from the employer, the manufacturer or supplier of that material, or the material safety datasheet.
Neither API nor any of API’s employees, subcontractors, consultants, or other assigns make any warranty or representation, either express or implied, with respect to the accuracy, completeness, or utility of the information contained herein, or assume any liability or responsibility for any use, or the results of such use, of any information or process disclosed in this publication, or represent that its used would not infringe upon privately owned rights.
Classified areas may vary depending on the location, conditions, equipment, and substances involved in any given situation. Users of this recommended practice (RP) should consult with the appropriate authorities having jurisdiction.
Users of this RP should not rely exclusively on the information contained in this document. Sound business, scientific, engineering, and safety judgement should be used in employing the information contained herein.
Where applicable, authorities having jurisdiction should be consulted.
Work sites and equipment operations may differ. Users are solely responsible for assessing their specific equipment and premises in determining the appropriateness of applying the RP. At all times users should employ sound business, scientific, engineering, and judgement safety when using this RP.
API standards are published to facilitate the broad availability of proven, sound engineering and operating practices. These standards are not intended to obviate the need for applying sound engineering judgment regarding when and where these standards should be utilized. The formulation and publication of API standards is not intended in any way to inhibit anyone from using any other practices.
Any manufacturer marking equipment or materials in conformance with the marking requirements of an API standard is solely responsible for complying with all the applicable requirements of that standard. API does not represent, war-rant, or guarantee that such products do in fact conform to the applicable API standard.
All rights reserved. No part of this work may be reproduced, translated, stored in a retrieval system, or transmitted by any means, electronic, mechanical, photocopying, recording, or otherwise, without prior written permission from the publisher. Contact the
Publisher, API Publishing Services, 1220 L Street, NW, Washington, DC 20005.
Copyright © 2009 American Petroleum Institute
Copyright American Petroleum Institute Provided by IHS under license with API
Not for ResaleNo reproduction or networking permitted without license from IHS
--`,,```,,,,````-`-`,,`,,`,`,,`---
//^:^^#^~^^"~~:~"~$$"~$^"#:*~:^#~#~^~@~:^:#*:^$:$~:*"\\

Foreword
This recommended practice (RP) is intended to provide guidance on developing a risk-based inspection (RBI) program for fixed equipment and piping in the hydrocarbon and chemical process industries. It includes:
— what is RBI,
— what are the key elements of RBI,
— how to implement an RBI program,
— how to sustain an RBI program.
It is based on the knowledge and experience of engineers, inspectors, risk analysts, and other personnel in the hydrocarbon and chemical industry.
Shall: As used in a standard, “shall” denotes a minimum requirement in order to conform to the specification.
Should: As used in a standard, “should” denotes a recommendation or that which is advised but not required in order to conform to the specification.
This RP is intended to supplement API 510, API 570, and API 653. These API inspection codes and standards allow an owner/user latitude to plan an inspection strategy and increase or decrease the code designated inspection frequencies and activities based on the results of an RBI assessment. The assessment must systematically evaluate both the POF and the associated consequence of failure (COF). The POF assessment should be evaluated by considering all credible damage mechanisms. Refer to the appropriate code for other RBI assessment requirements. This RP is intended to serve as a guide for users in properly performing such an RBI assessment.
The information in this RP does not constitute and should not be construed as a code of rules, regulations, or minimum safe practices. The practices described in this publication are not intended to supplant other practices that have proven satisfactory, nor is this publication intended to discourage innovation and originality in the inspection of hydrocarbon and chemical facilities. Users of this RP are reminded that no book or manual is a substitute for the judgment of a responsible, qualified inspector or engineer.
Nothing contained in any API publication is to be construed as granting any right, by implication or otherwise, for the manufacture, sale, or use of any method, apparatus, or product covered by letters patent. Neither should anything contained in the publication be construed as insuring anyone against liability for infringement of letters patent.
This document was produced under API standardization procedures that ensure appropriate notification and participation in the developmental process and is designated as an API standard. Questions concerning the interpretation of the content of this publication or comments and questions concerning the procedures under which this publication was developed should be directed in writing to the Director of Standards, American Petroleum Institute, 1220 L Street, NW, Washington, DC 20005. Requests for permission to reproduce or translate all or any part of the material published herein should also be addressed to the director.
Generally, API standards are reviewed and revised, reaffirmed, or withdrawn at least every five years. A one-time extension of up to two years may be added to this review cycle. Status of the publication can be ascertained from the API Standards Department, telephone (202) 682-8000. A catalog of API publications and materials is published annually by API, 1220 L Street, NW, Washington, DC 20005.
Suggested revisions are invited and should be submitted to the director, Standards Department, American Petroleum Institute, 1220 L Street, NW, Washington DC 20005, [email protected].
iii
Copyright American Petroleum Institute Provided by IHS under license with API
Not for ResaleNo reproduction or networking permitted without license from IHS
--`,,```,,,,````-`-`,,`,,`,`,,`---
//^:^^#^~^^"~~:~"~$$"~$^"#:*~:^#~#~^~@~:^:#*:^$:$~:*"\\

Copyright American Petroleum Institute Provided by IHS under license with API
Not for ResaleNo reproduction or networking permitted without license from IHS
--`,,```,,,,````-`-`,,`,,`,`,,`---
//^:^^#^~^^"~~:~"~$$"~$^"#:*~:^#~#~^~@~:^:#*:^$:$~:*"\\
Contents
Page
1 Purpose. . . . . . . . . . . . . . . . . . . . . . . . . . . . . . . . . . . . . . . . . . . . . . . . . . . . . . . . . . . . . . . . . . . . . . . . . . . . . . . . . 11.1 General . . . . . . . . . . . . . . . . . . . . . . . . . . . . . . . . . . . . . . . . . . . . . . . . . . . . . . . . . . . . . . . . . . . . . . . . . . . . . . . . . 11.2 RBI Benefits and Limitations . . . . . . . . . . . . . . . . . . . . . . . . . . . . . . . . . . . . . . . . . . . . . . . . . . . . . . . . . . . . . . . 21.3 Using RBI as a Continuous Improvement Tool . . . . . . . . . . . . . . . . . . . . . . . . . . . . . . . . . . . . . . . . . . . . . . . . 21.4 RBI as an Integrated Management Tool . . . . . . . . . . . . . . . . . . . . . . . . . . . . . . . . . . . . . . . . . . . . . . . . . . . . . . 3
2 Scope . . . . . . . . . . . . . . . . . . . . . . . . . . . . . . . . . . . . . . . . . . . . . . . . . . . . . . . . . . . . . . . . . . . . . . . . . . . . . . . . . . 32.1 Industry Scope. . . . . . . . . . . . . . . . . . . . . . . . . . . . . . . . . . . . . . . . . . . . . . . . . . . . . . . . . . . . . . . . . . . . . . . . . . . 32.2 Flexibility in Application . . . . . . . . . . . . . . . . . . . . . . . . . . . . . . . . . . . . . . . . . . . . . . . . . . . . . . . . . . . . . . . . . . . 32.3 Mechanical Integrity Focused . . . . . . . . . . . . . . . . . . . . . . . . . . . . . . . . . . . . . . . . . . . . . . . . . . . . . . . . . . . . . . 32.4 Equipment Covered. . . . . . . . . . . . . . . . . . . . . . . . . . . . . . . . . . . . . . . . . . . . . . . . . . . . . . . . . . . . . . . . . . . . . . . 42.5 Equipment Not Covered . . . . . . . . . . . . . . . . . . . . . . . . . . . . . . . . . . . . . . . . . . . . . . . . . . . . . . . . . . . . . . . . . . . 42.6 Target Audience. . . . . . . . . . . . . . . . . . . . . . . . . . . . . . . . . . . . . . . . . . . . . . . . . . . . . . . . . . . . . . . . . . . . . . . . . . 4
3 Normative References. . . . . . . . . . . . . . . . . . . . . . . . . . . . . . . . . . . . . . . . . . . . . . . . . . . . . . . . . . . . . . . . . . . . . 4
4 Terms, Definitions, Acronyms, and Abbreviations . . . . . . . . . . . . . . . . . . . . . . . . . . . . . . . . . . . . . . . . . . . . . 54.1 Terms and Definitions . . . . . . . . . . . . . . . . . . . . . . . . . . . . . . . . . . . . . . . . . . . . . . . . . . . . . . . . . . . . . . . . . . . . . 54.2 Acronyms and Abbreviations . . . . . . . . . . . . . . . . . . . . . . . . . . . . . . . . . . . . . . . . . . . . . . . . . . . . . . . . . . . . . 11
5 Basic Risk Assessment Concepts . . . . . . . . . . . . . . . . . . . . . . . . . . . . . . . . . . . . . . . . . . . . . . . . . . . . . . . . . 125.1 What is Risk? . . . . . . . . . . . . . . . . . . . . . . . . . . . . . . . . . . . . . . . . . . . . . . . . . . . . . . . . . . . . . . . . . . . . . . . . . . . 125.2 Risk Management and Risk Reduction. . . . . . . . . . . . . . . . . . . . . . . . . . . . . . . . . . . . . . . . . . . . . . . . . . . . . . 125.3 The Evolution of Inspection Intervals/Due Dates . . . . . . . . . . . . . . . . . . . . . . . . . . . . . . . . . . . . . . . . . . . . . 135.4 Overview of Risk Analysis . . . . . . . . . . . . . . . . . . . . . . . . . . . . . . . . . . . . . . . . . . . . . . . . . . . . . . . . . . . . . . . . 135.5 Inspection Optimization . . . . . . . . . . . . . . . . . . . . . . . . . . . . . . . . . . . . . . . . . . . . . . . . . . . . . . . . . . . . . . . . . . 145.6 Relative Risk vs Absolute Risk . . . . . . . . . . . . . . . . . . . . . . . . . . . . . . . . . . . . . . . . . . . . . . . . . . . . . . . . . . . . 15
6 Introduction to Risk-Based Inspection . . . . . . . . . . . . . . . . . . . . . . . . . . . . . . . . . . . . . . . . . . . . . . . . . . . . . . 166.1 Key Elements of an RBI Program . . . . . . . . . . . . . . . . . . . . . . . . . . . . . . . . . . . . . . . . . . . . . . . . . . . . . . . . . . 166.2 Consequence and Probability for RBI. . . . . . . . . . . . . . . . . . . . . . . . . . . . . . . . . . . . . . . . . . . . . . . . . . . . . . . 166.3 Types of RBI Assessment . . . . . . . . . . . . . . . . . . . . . . . . . . . . . . . . . . . . . . . . . . . . . . . . . . . . . . . . . . . . . . . . 176.4 Precision vs Accuracy . . . . . . . . . . . . . . . . . . . . . . . . . . . . . . . . . . . . . . . . . . . . . . . . . . . . . . . . . . . . . . . . . . . 206.5 Understanding How RBI Can Help to Manage Operating Risks . . . . . . . . . . . . . . . . . . . . . . . . . . . . . . . . . 216.6 Management of Risks . . . . . . . . . . . . . . . . . . . . . . . . . . . . . . . . . . . . . . . . . . . . . . . . . . . . . . . . . . . . . . . . . . . . 226.7 Relationship Between RBI and Other Risk-Based and Safety Initiatives . . . . . . . . . . . . . . . . . . . . . . . . . . 236.8 Relationship with Jurisdictional Requirements. . . . . . . . . . . . . . . . . . . . . . . . . . . . . . . . . . . . . . . . . . . . . . . 24
7 Planning the RBI Assessment . . . . . . . . . . . . . . . . . . . . . . . . . . . . . . . . . . . . . . . . . . . . . . . . . . . . . . . . . . . . . 257.1 Getting Started. . . . . . . . . . . . . . . . . . . . . . . . . . . . . . . . . . . . . . . . . . . . . . . . . . . . . . . . . . . . . . . . . . . . . . . . . . 257.2 Establishing Objectives and Goals of an RBI Assessment . . . . . . . . . . . . . . . . . . . . . . . . . . . . . . . . . . . . . 267.3 Initial Screening. . . . . . . . . . . . . . . . . . . . . . . . . . . . . . . . . . . . . . . . . . . . . . . . . . . . . . . . . . . . . . . . . . . . . . . . . 287.4 Establish Operating Boundaries . . . . . . . . . . . . . . . . . . . . . . . . . . . . . . . . . . . . . . . . . . . . . . . . . . . . . . . . . . . 317.5 Selecting a Type of RBI Assessment . . . . . . . . . . . . . . . . . . . . . . . . . . . . . . . . . . . . . . . . . . . . . . . . . . . . . . . 327.6 Estimating Resources and Time Required. . . . . . . . . . . . . . . . . . . . . . . . . . . . . . . . . . . . . . . . . . . . . . . . . . . 32
8 Data and Information Collection for RBI Assessment . . . . . . . . . . . . . . . . . . . . . . . . . . . . . . . . . . . . . . . . . 338.1 General . . . . . . . . . . . . . . . . . . . . . . . . . . . . . . . . . . . . . . . . . . . . . . . . . . . . . . . . . . . . . . . . . . . . . . . . . . . . . . . . 338.2 RBI Data Needs . . . . . . . . . . . . . . . . . . . . . . . . . . . . . . . . . . . . . . . . . . . . . . . . . . . . . . . . . . . . . . . . . . . . . . . . . 348.3 Data Quality . . . . . . . . . . . . . . . . . . . . . . . . . . . . . . . . . . . . . . . . . . . . . . . . . . . . . . . . . . . . . . . . . . . . . . . . . . . . 358.4 Codes and Standards—National and International . . . . . . . . . . . . . . . . . . . . . . . . . . . . . . . . . . . . . . . . . . . . 368.5 Sources of Site Specific Data and Information . . . . . . . . . . . . . . . . . . . . . . . . . . . . . . . . . . . . . . . . . . . . . . . 36
v
Copyright American Petroleum Institute Provided by IHS under license with API
Not for ResaleNo reproduction or networking permitted without license from IHS
--`,,```,,,,````-`-`,,`,,`,`,,`---
//^:^
^#^~
^^"~
~:~"
~$$"
~$^"
#:*~
:^#~
#~^~
@~:
^:#*
:^$:
$~:*
"\\

Page
9 Damage Mechanisms and Failure Modes. . . . . . . . . . . . . . . . . . . . . . . . . . . . . . . . . . . . . . . . . . . . . . . . . . . . 389.1 Introduction . . . . . . . . . . . . . . . . . . . . . . . . . . . . . . . . . . . . . . . . . . . . . . . . . . . . . . . . . . . . . . . . . . . . . . . . . . . . 389.2 Damage Mechanisms . . . . . . . . . . . . . . . . . . . . . . . . . . . . . . . . . . . . . . . . . . . . . . . . . . . . . . . . . . . . . . . . . . . . 399.3 Failure Modes. . . . . . . . . . . . . . . . . . . . . . . . . . . . . . . . . . . . . . . . . . . . . . . . . . . . . . . . . . . . . . . . . . . . . . . . . . . 399.4 Accumulated Damage. . . . . . . . . . . . . . . . . . . . . . . . . . . . . . . . . . . . . . . . . . . . . . . . . . . . . . . . . . . . . . . . . . . . 409.5 Tabulating Results. . . . . . . . . . . . . . . . . . . . . . . . . . . . . . . . . . . . . . . . . . . . . . . . . . . . . . . . . . . . . . . . . . . . . . . 40
10 Assessing Probability of Failure . . . . . . . . . . . . . . . . . . . . . . . . . . . . . . . . . . . . . . . . . . . . . . . . . . . . . . . . . . . 4010.1 Introduction to Probability Analysis . . . . . . . . . . . . . . . . . . . . . . . . . . . . . . . . . . . . . . . . . . . . . . . . . . . . . . . 4010.2 Units of Measure in the POF Analysis. . . . . . . . . . . . . . . . . . . . . . . . . . . . . . . . . . . . . . . . . . . . . . . . . . . . . . 4110.3 Types of Probability Analysis. . . . . . . . . . . . . . . . . . . . . . . . . . . . . . . . . . . . . . . . . . . . . . . . . . . . . . . . . . . . . 4110.4 Determination of POF . . . . . . . . . . . . . . . . . . . . . . . . . . . . . . . . . . . . . . . . . . . . . . . . . . . . . . . . . . . . . . . . . . . 42
11 Assessing Consequences of Failure . . . . . . . . . . . . . . . . . . . . . . . . . . . . . . . . . . . . . . . . . . . . . . . . . . . . . . . 4611.1 Introduction to Consequence Analysis. . . . . . . . . . . . . . . . . . . . . . . . . . . . . . . . . . . . . . . . . . . . . . . . . . . . . 4611.2 Types of Consequence Analysis . . . . . . . . . . . . . . . . . . . . . . . . . . . . . . . . . . . . . . . . . . . . . . . . . . . . . . . . . . 4711.3 Units of Measure in Consequence Analysis. . . . . . . . . . . . . . . . . . . . . . . . . . . . . . . . . . . . . . . . . . . . . . . . . 4811.4 Volume of Fluid Released . . . . . . . . . . . . . . . . . . . . . . . . . . . . . . . . . . . . . . . . . . . . . . . . . . . . . . . . . . . . . . . . 5111.5 Consequence Effect Categories . . . . . . . . . . . . . . . . . . . . . . . . . . . . . . . . . . . . . . . . . . . . . . . . . . . . . . . . . . 5111.6 Determination of Consequence of Failure . . . . . . . . . . . . . . . . . . . . . . . . . . . . . . . . . . . . . . . . . . . . . . . . . . 55
12 Risk Determination, Assessment, and Management . . . . . . . . . . . . . . . . . . . . . . . . . . . . . . . . . . . . . . . . . . 5712.1 Purpose. . . . . . . . . . . . . . . . . . . . . . . . . . . . . . . . . . . . . . . . . . . . . . . . . . . . . . . . . . . . . . . . . . . . . . . . . . . . . . . 5712.2 Determination of Risk . . . . . . . . . . . . . . . . . . . . . . . . . . . . . . . . . . . . . . . . . . . . . . . . . . . . . . . . . . . . . . . . . . . 5812.3 Risk Management Decisions and Acceptable Levels of Risk . . . . . . . . . . . . . . . . . . . . . . . . . . . . . . . . . . 6012.4 Sensitivity Analysis . . . . . . . . . . . . . . . . . . . . . . . . . . . . . . . . . . . . . . . . . . . . . . . . . . . . . . . . . . . . . . . . . . . . . 6012.5 Assumptions . . . . . . . . . . . . . . . . . . . . . . . . . . . . . . . . . . . . . . . . . . . . . . . . . . . . . . . . . . . . . . . . . . . . . . . . . . 6112.6 Risk Presentation. . . . . . . . . . . . . . . . . . . . . . . . . . . . . . . . . . . . . . . . . . . . . . . . . . . . . . . . . . . . . . . . . . . . . . . 6112.7 Establishing Acceptable Risk Thresholds . . . . . . . . . . . . . . . . . . . . . . . . . . . . . . . . . . . . . . . . . . . . . . . . . . 6212.8 Risk Management . . . . . . . . . . . . . . . . . . . . . . . . . . . . . . . . . . . . . . . . . . . . . . . . . . . . . . . . . . . . . . . . . . . . . . 63
13 Risk Management with Inspection Activities . . . . . . . . . . . . . . . . . . . . . . . . . . . . . . . . . . . . . . . . . . . . . . . . . 6413.1 Managing Risk by Reducing Uncertainty Through Inspection . . . . . . . . . . . . . . . . . . . . . . . . . . . . . . . . . 6413.2 Identifying Risk Management Opportunities from RBI Results . . . . . . . . . . . . . . . . . . . . . . . . . . . . . . . . . 6413.3 Establishing an Inspection Strategy Based on Risk Assessment. . . . . . . . . . . . . . . . . . . . . . . . . . . . . . . 6513.4 Managing Risk with Inspection Activities. . . . . . . . . . . . . . . . . . . . . . . . . . . . . . . . . . . . . . . . . . . . . . . . . . . 6613.5 Managing Inspection Costs with RBI . . . . . . . . . . . . . . . . . . . . . . . . . . . . . . . . . . . . . . . . . . . . . . . . . . . . . . 6713.6 Assessing Inspection Results and Determining Corrective Action . . . . . . . . . . . . . . . . . . . . . . . . . . . . . 6713.7 Achieving Lowest Life Cycle Costs with RBI . . . . . . . . . . . . . . . . . . . . . . . . . . . . . . . . . . . . . . . . . . . . . . . . 67
14 Other Risk Mitigation Activities . . . . . . . . . . . . . . . . . . . . . . . . . . . . . . . . . . . . . . . . . . . . . . . . . . . . . . . . . . . . 6814.1 General . . . . . . . . . . . . . . . . . . . . . . . . . . . . . . . . . . . . . . . . . . . . . . . . . . . . . . . . . . . . . . . . . . . . . . . . . . . . . . . 6814.2 Equipment Replacement and Repair. . . . . . . . . . . . . . . . . . . . . . . . . . . . . . . . . . . . . . . . . . . . . . . . . . . . . . . 6814.3 Evaluating Flaws for Fitness-For-Service. . . . . . . . . . . . . . . . . . . . . . . . . . . . . . . . . . . . . . . . . . . . . . . . . . . 6814.4 Equipment Modification, Redesign, and Rerating . . . . . . . . . . . . . . . . . . . . . . . . . . . . . . . . . . . . . . . . . . . . 6814.5 Emergency Isolation . . . . . . . . . . . . . . . . . . . . . . . . . . . . . . . . . . . . . . . . . . . . . . . . . . . . . . . . . . . . . . . . . . . . 6914.6 Emergency Depressurizing/Deinventorying. . . . . . . . . . . . . . . . . . . . . . . . . . . . . . . . . . . . . . . . . . . . . . . . . 6914.7 Modify Process . . . . . . . . . . . . . . . . . . . . . . . . . . . . . . . . . . . . . . . . . . . . . . . . . . . . . . . . . . . . . . . . . . . . . . . . 6914.8 Establish Integrity Operating Windows . . . . . . . . . . . . . . . . . . . . . . . . . . . . . . . . . . . . . . . . . . . . . . . . . . . . 6914.9 Reduce Inventory. . . . . . . . . . . . . . . . . . . . . . . . . . . . . . . . . . . . . . . . . . . . . . . . . . . . . . . . . . . . . . . . . . . . . . . 7014.10 Water Spray/Deluge. . . . . . . . . . . . . . . . . . . . . . . . . . . . . . . . . . . . . . . . . . . . . . . . . . . . . . . . . . . . . . . . . . . . 7014.11 Water Curtain . . . . . . . . . . . . . . . . . . . . . . . . . . . . . . . . . . . . . . . . . . . . . . . . . . . . . . . . . . . . . . . . . . . . . . . . . 7014.12 Blast-resistant Construction . . . . . . . . . . . . . . . . . . . . . . . . . . . . . . . . . . . . . . . . . . . . . . . . . . . . . . . . . . . . 7014.13 Others . . . . . . . . . . . . . . . . . . . . . . . . . . . . . . . . . . . . . . . . . . . . . . . . . . . . . . . . . . . . . . . . . . . . . . . . . . . . . . . 70
vi
Copyright American Petroleum Institute Provided by IHS under license with API
Not for ResaleNo reproduction or networking permitted without license from IHS
--`,,```,,,,````-`-`,,`,,`,`,,`---
//^:^^#^~^^"~~:~"~$$"~$^"#:*~:^#~#~^~@~:^:#*:^$:$~:*"\\
Page
15 Reassessment and Updating RBI Assessments . . . . . . . . . . . . . . . . . . . . . . . . . . . . . . . . . . . . . . . . . . . . . . 7115.1 RBI Reassessments . . . . . . . . . . . . . . . . . . . . . . . . . . . . . . . . . . . . . . . . . . . . . . . . . . . . . . . . . . . . . . . . . . . . 7115.2 Why Conduct an RBI Reassessment? . . . . . . . . . . . . . . . . . . . . . . . . . . . . . . . . . . . . . . . . . . . . . . . . . . . . . 7115.3 When to Conduct an RBI Reassessment . . . . . . . . . . . . . . . . . . . . . . . . . . . . . . . . . . . . . . . . . . . . . . . . . . . 73
16 Roles, Responsibilities, Training, and Qualifications . . . . . . . . . . . . . . . . . . . . . . . . . . . . . . . . . . . . . . . . . . 7316.1 Team Approach . . . . . . . . . . . . . . . . . . . . . . . . . . . . . . . . . . . . . . . . . . . . . . . . . . . . . . . . . . . . . . . . . . . . . . . . 7316.2 Team Members, Roles, and Responsibilities . . . . . . . . . . . . . . . . . . . . . . . . . . . . . . . . . . . . . . . . . . . . . . . . 7316.3 Training and Qualifications for RBI Application . . . . . . . . . . . . . . . . . . . . . . . . . . . . . . . . . . . . . . . . . . . . . 76
17 RBI Documentation and Recordkeeping . . . . . . . . . . . . . . . . . . . . . . . . . . . . . . . . . . . . . . . . . . . . . . . . . . . . 7617.1 General . . . . . . . . . . . . . . . . . . . . . . . . . . . . . . . . . . . . . . . . . . . . . . . . . . . . . . . . . . . . . . . . . . . . . . . . . . . . . . . 7617.2 RBI Methodology . . . . . . . . . . . . . . . . . . . . . . . . . . . . . . . . . . . . . . . . . . . . . . . . . . . . . . . . . . . . . . . . . . . . . . . 7717.3 RBI Personnel . . . . . . . . . . . . . . . . . . . . . . . . . . . . . . . . . . . . . . . . . . . . . . . . . . . . . . . . . . . . . . . . . . . . . . . . . 7717.4 Time Frame. . . . . . . . . . . . . . . . . . . . . . . . . . . . . . . . . . . . . . . . . . . . . . . . . . . . . . . . . . . . . . . . . . . . . . . . . . . . 7717.5 Basis for the Assignment of Risk . . . . . . . . . . . . . . . . . . . . . . . . . . . . . . . . . . . . . . . . . . . . . . . . . . . . . . . . . 7717.6 Assumptions Made to Assess Risk. . . . . . . . . . . . . . . . . . . . . . . . . . . . . . . . . . . . . . . . . . . . . . . . . . . . . . . . 7817.7 Risk Assessment Results. . . . . . . . . . . . . . . . . . . . . . . . . . . . . . . . . . . . . . . . . . . . . . . . . . . . . . . . . . . . . . . . 7817.8 Mitigation and Follow-up . . . . . . . . . . . . . . . . . . . . . . . . . . . . . . . . . . . . . . . . . . . . . . . . . . . . . . . . . . . . . . . . 7817.9 Applicable Codes, Standards, and Government Regulations . . . . . . . . . . . . . . . . . . . . . . . . . . . . . . . . . . 78
18 Summary of RBI Pitfalls . . . . . . . . . . . . . . . . . . . . . . . . . . . . . . . . . . . . . . . . . . . . . . . . . . . . . . . . . . . . . . . . . . 7818.1 General . . . . . . . . . . . . . . . . . . . . . . . . . . . . . . . . . . . . . . . . . . . . . . . . . . . . . . . . . . . . . . . . . . . . . . . . . . . . . . . 7818.2 Planning . . . . . . . . . . . . . . . . . . . . . . . . . . . . . . . . . . . . . . . . . . . . . . . . . . . . . . . . . . . . . . . . . . . . . . . . . . . . . . 7818.3 Data and Information Collection . . . . . . . . . . . . . . . . . . . . . . . . . . . . . . . . . . . . . . . . . . . . . . . . . . . . . . . . . . 7918.4 Damage Mechanisms and Failure Modes. . . . . . . . . . . . . . . . . . . . . . . . . . . . . . . . . . . . . . . . . . . . . . . . . . . 7918.5 Assessing POF . . . . . . . . . . . . . . . . . . . . . . . . . . . . . . . . . . . . . . . . . . . . . . . . . . . . . . . . . . . . . . . . . . . . . . . . 7918.6 Assessing Consequence of Failure. . . . . . . . . . . . . . . . . . . . . . . . . . . . . . . . . . . . . . . . . . . . . . . . . . . . . . . . 7918.7 Risk Determination, Assessment, and Management . . . . . . . . . . . . . . . . . . . . . . . . . . . . . . . . . . . . . . . . . 8018.8 Risk Management with Inspection Activities . . . . . . . . . . . . . . . . . . . . . . . . . . . . . . . . . . . . . . . . . . . . . . . . 8118.9 Other Risk Management Activities . . . . . . . . . . . . . . . . . . . . . . . . . . . . . . . . . . . . . . . . . . . . . . . . . . . . . . . . 8118.10 Reassessment and Updating RBI Assessment . . . . . . . . . . . . . . . . . . . . . . . . . . . . . . . . . . . . . . . . . . . . . 8118.11 Roles, Responsibilities, Training, and Qualifications for RBI Team Members . . . . . . . . . . . . . . . . . . . . 8118.12 RBI Documentation and Recordkeeping . . . . . . . . . . . . . . . . . . . . . . . . . . . . . . . . . . . . . . . . . . . . . . . . . . 82
Figures1 Management of Risk Using RBI . . . . . . . . . . . . . . . . . . . . . . . . . . . . . . . . . . . . . . . . . . . . . . . . . . . . . . . . . . . . 152 Risk Plot . . . . . . . . . . . . . . . . . . . . . . . . . . . . . . . . . . . . . . . . . . . . . . . . . . . . . . . . . . . . . . . . . . . . . . . . . . . . . . . 173 Continuum of RBI Approaches . . . . . . . . . . . . . . . . . . . . . . . . . . . . . . . . . . . . . . . . . . . . . . . . . . . . . . . . . . . . 184 Risk-Based Inspection Planning Process . . . . . . . . . . . . . . . . . . . . . . . . . . . . . . . . . . . . . . . . . . . . . . . . . . . 205 Determination of Consequence of Failure . . . . . . . . . . . . . . . . . . . . . . . . . . . . . . . . . . . . . . . . . . . . . . . . . . . 566 Example of Calculating the Probability of a Specific Consequence . . . . . . . . . . . . . . . . . . . . . . . . . . . . . . 597 Example Risk Matrix Using Probability and Consequence Categories to Display Risk Rankings . . . . . 628 Risk Plot when Using Quantitative or Numeric Risk Values . . . . . . . . . . . . . . . . . . . . . . . . . . . . . . . . . . . . 63
Tables1 Three Levels of POF . . . . . . . . . . . . . . . . . . . . . . . . . . . . . . . . . . . . . . . . . . . . . . . . . . . . . . . . . . . . . . . . . . . . . 412 Six Levels of POF . . . . . . . . . . . . . . . . . . . . . . . . . . . . . . . . . . . . . . . . . . . . . . . . . . . . . . . . . . . . . . . . . . . . . . . 423 Six Level Table . . . . . . . . . . . . . . . . . . . . . . . . . . . . . . . . . . . . . . . . . . . . . . . . . . . . . . . . . . . . . . . . . . . . . . . . . . 504 Three Level Safety, Health, and Environmental Consequence Categories . . . . . . . . . . . . . . . . . . . . . . . . 515 Six Level Safety, Health, and Environmental Consequence Categories. . . . . . . . . . . . . . . . . . . . . . . . . . . 51
Bibliography . . . . . . . . . . . . . . . . . . . . . . . . . . . . . . . . . . . . . . . . . . . . . . . . . . . . . . . . . . . . . . . . . . . . . . . . . . . . . . . . 83
viiCopyright American Petroleum Institute Provided by IHS under license with API
Not for ResaleNo reproduction or networking permitted without license from IHS
--`,,```,,,,````-`-`,,`,,`,`,,`---
//^:^^#^~^^"~~:~"~$$"~$^"#:*~:^#~#~^~@~:^:#*:^$:$~:*"\\
Introduction
This recommended practice (RP) provides information on using risk analysis to develop an effective inspection plan. Inspection planning is a systematic process that begins with identification of facilities or equipment and culminates in an inspection plan. Both the probability 1 of failure and the consequence of failure (COF) should be evaluated by considering all credible damage mechanisms that could be expected to affect the facilities or equipment. In addition, failure scenarios based on each credible damage mechanism should be developed and considered.
The output of the inspection planning process conducted according to these guidelines should be an inspection plan for each equipment item analyzed that includes:
a) inspection methods that should be used,
b) extent of inspection (percent of total area to be examined or specific locations),
c) inspection interval or next inspection date (timing),
d) other risk mitigation activities,
e) the residual level of risk after inspection and other mitigation actions have been implemented.
The RBI plan produced according to the guidance herein, combined with a comprehensive set of integrity operating windows for each process unit and a rigorous MOC program should provide the basis for sound management of the integrity of fixed equipment in the refining and petrochemical process industry.
RBI is synonymous with risk-prioritized inspection, risk-informed inspection and with inspection planning using risk-based methods.
1 Likelihood is sometimes used as a synonym for probability; however, probability is used throughout this standard for consistency.
viii
Copyright American Petroleum Institute Provided by IHS under license with API
Not for ResaleNo reproduction or networking permitted without license from IHS
--`,,```,,,,````-`-`,,`,,`,`,,`---
//^:^
^#^~
^^"~
~:~"
~$$"
~$^"
#:*~
:^#~
#~^~
@~:
^:#*
:^$:
$~:*
"\\
1
Risk-Based Inspection
1 Purpose
1.1 General
The purpose of this document is to provide users with the basic elements for developing, implementing, and maintaining a risk-based inspection (RBI) program. It provides guidance to owners, operators, and designers of pressure-containing equipment for developing and implementing an inspection program. These guidelines include means for assessing an inspection program and its plan. The approach emphasizes safe and reliable operation through risk-prioritized inspection. A spectrum of complementary risk analysis approaches (qualitative through fully quantitative) can be considered as part of the inspection planning process. RBI guideline issues covered include an introduction to the concepts and principles of RBI for risk management; and individual sections that describe the steps in applying these principles within the framework of the RBI process include:
a) understanding the design premise;
b) planning the RBI assessment;
c) data and information collection;
d) identifying damage mechanisms and failure modes;
e) assessing probability of failure (POF);
f) assessing COF;
g) risk determination, assessment, and management;
h) risk management with inspection activities and process control;
i) other risk mitigation activities;
j) reassessment and updating;
k) roles, responsibilities, training, and qualifications;
l) documentation and recordkeeping.
The expected outcome from the application of the RBI process should be the linkage of risks with appropriate inspection, process control or other risk mitigation activities to manage the risks. The RBI process is capable of generating:
1) a ranking by relative risk of all equipment evaluated;
2) a detailed description of the inspection plan to be employed for each equipment item, including:
— inspection method(s) that should be used [e.g. visual, ultrasonic (UT), radiography, wet flourescent magnetic particle];
— extent of application of the inspection method(s) (e.g. percent of total area examined or specific locations);
— timing of inspections/examinations (inspection intervals/due dates);
Copyright American Petroleum Institute Provided by IHS under license with API
Not for ResaleNo reproduction or networking permitted without license from IHS
--`,,```,,,,````-`-`,,`,,`,`,,`---
//^:^^#^~^^"~~:~"~$$"~$^"#:*~:^#~#~^~@~:^:#*:^$:$~:*"\\

2 API RECOMMENDED PRACTICE 580
— risk management achieved through implementation of the inspection plan;
3) a description of any other risk mitigation activities [such as repairs, replacements or safety equipment upgrades, equipment redesign or maintenance, integrity operating windows (IOWs), and controls on operating conditions];
4) the expected risk levels of all equipment after the inspection plan and other risk mitigation activities have been implemented;
5) identification of risk drivers.
1.2 RBI Benefits and Limitations
The primary work products of the RBI assessment and management approach are plans that address ways to manage risks on an equipment level. These equipment plans highlight risks from a safety/health/environment perspective and/or from an economic standpoint. RBI plans should include cost-effective actions along with a projected risk mitigation.
Implementation of these plans provides one of the following:
a) an overall reduction in risk for the facilities and equipment assessed,
b) an acceptance/understanding of the current risk.
The RBI plans also identify equipment that does not require inspection or some other form of mitigation because of the acceptable level of risk associated with the equipment’s current operation. In this way, inspection and maintenance activities can be focused and more cost effective. This often results in a significant reduction in the amount of inspection data that is collected. This focus on a smaller set of data should result in more accurate information. In some cases, in addition to risk reductions and process safety improvements, RBI plans may result in cost reductions.
RBI is based on sound, proven risk assessment and management principles. Nonetheless, RBI will not compensate for:
c) inaccurate or missing information,
d) inadequate designs or faulty equipment installation,
e) operating outside the acceptable IOWs,
f) not effectively executing the plans,
g) lack of qualified personnel or teamwork,
h) lack of sound engineering or operational judgment.
1.3 Using RBI as a Continuous Improvement Tool
Utilization of RBI provides a vehicle for continuously improving the inspection of facilities and systematically reducing the risk associated with pressure boundary failures. As new data (such as inspection results and industry experiences with similar processes) becomes available or when changes occur (e.g. operating conditions), reassessment of the RBI program can be made that will provide a refreshed view of the risks. Risk management plans should then be adjusted appropriately.
Copyright American Petroleum Institute Provided by IHS under license with API
Not for ResaleNo reproduction or networking permitted without license from IHS
--`,,```,,,,````-`-`,,`,,`,`,,`---
//^:^^#^~^^"~~:~"~$$"~$^"#:*~:^#~#~^~@~:^:#*:^$:$~:*"\\

RISK-BASED INSPECTION 3
RBI offers the added advantage of identifying gaps or shortcomings in the effectiveness of commercially available inspection technologies and applications. In cases where technology cannot adequately and/or cost-effectively mitigate risks, other risk mitigation approaches can be implemented. RBI should serve to guide the direction of inspection technology development, and hopefully promote a faster and broader deployment of emerging inspection technologies as well as proven inspection technologies that may be available but are underutilized.
1.4 RBI as an Integrated Management Tool
RBI is a risk assessment and management tool that addresses an area of risk management not completely addressed in other organizational risk management efforts such as process hazards analyses (PHA), IOWs or reliability centered maintenance (RCM). Integration of these risk management efforts, including RBI, is key to the success of a risk management program.
RBI produces inspection and maintenance plans for equipment that identify the actions that should be taken to provide reliable and safe operation. The RBI effort can provide input into an organization’s annual planning and budgeting that define the staffing and funds required to maintain equipment operation at acceptable levels of performance and risk.
RBI needs to be integrated with a management system for defining and maintaining IOWs as well as a robust management of change (MOC) process as a basis for managing and controlling damage mechanisms in fixed equipment.
2 Scope
2.1 Industry Scope
Although the risk management principles and concepts that RBI is built on are universally applicable, this RP is specifically targeted at the application of RBI in the hydrocarbon and chemical process industry.
2.2 Flexibility in Application
Because of the broad diversity in organizations’ size, culture, federal and/or local regulatory requirements, this RP offers users the flexibility to apply the RBI methodology within the context of existing corporate risk management practices and to accommodate unique local circumstances. The document is designed to provide a framework that clarifies the expected attributes of a quality risk assessment without imposing undue constraints on users. This RP is intended to promote consistency and quality in the identification, assessment, and management of risks pertaining to material deterioration, which could lead to loss of containment.
Many types of RBI methods exist and are currently being applied throughout industry. This document is not intended to single out one specific approach as the recommended method for conducting an RBI effort. The document instead is intended to identify and clarify the essential elements of an RBI analysis and program.
2.3 Mechanical Integrity Focused
The RBI process is focused on maintaining the mechanical integrity of pressure equipment items and minimizing the risk of loss of containment due to deterioration. RBI is not a substitute for a PHA or hazard and operability assessment (HAZOP). Typically, PHA risk assessments focus on the process unit design and operating practices and their adequacy given the unit’s current or anticipated operating conditions. RBI complements the PHA by focusing on the mechanical integrity related damage mechanisms and risk management through inspection. RBI also is complementary to RCM programs in that both programs are focused on understanding failure modes, addressing the modes and therefore improving the reliability of equipment and process facilities.
Copyright American Petroleum Institute Provided by IHS under license with API
Not for ResaleNo reproduction or networking permitted without license from IHS
--`,,```,,,,````-`-`,,`,,`,`,,`---
//^:^^#^~^^"~~:~"~$$"~$^"#:*~:^#~#~^~@~:^:#*:^$:$~:*"\\

4 API RECOMMENDED PRACTICE 580
2.4 Equipment Covered
The following types of equipment and associated components/internals are covered by this document.
a) Pressure Vessels—All pressure containing components.
b) Process Piping—Pipe and piping components.
c) Storage Tanks—Atmospheric and pressurized.
d) Rotating Equipment—Pressure containing components.
e) Boilers and Heaters—Pressurized components.
f) Heat exchangers (shells, floating heads, channels, and bundles).
g) Pressure-relief devices.
2.5 Equipment Not Covered
The following equipment is not covered by this document:
a) instrument and control systems,
b) electrical systems,
c) structural systems,
d) machinery components (except pump and compressor casings).
However, these systems and components may be covered by other types of RBI or risk assessment work processes such as RCM.
2.6 Target Audience
The primary audience for this RP is inspection and engineering personnel who are responsible for the mechanical integrity and operability of equipment covered by this RP. However, while an organization’s inspection/materials engineering group may champion the RBI initiative, RBI is not exclusively an inspection activity. RBI requires the involvement of various segments of the organization such as engineering, maintenance and operations. Implementation of the resulting RBI product (e.g. inspection plans, replacement/upgrading recommendations, other mitigation activities, etc.) may rest with more than one segment of the organization. RBI requires the commitment and cooperation of the total operating organization. In this context, while the primary audience may be inspection and materials engineering personnel, other stakeholders who are likely to be involved should be familiar with the concepts and principles embodied in the RBI methodology to the extent necessary for them to understand the risk assessment process and to be able to accept the results.
3 Normative References
The following referenced documents are indispensable for the application of this document. For dated references, only the edition cited applies. For undated references, the latest edition of the referenced document (including any amendments) applies.
API Publication 510, Pressure Vessel Inspection Code: Inspection, Rating, Repair, and Alteration
Copyright American Petroleum Institute Provided by IHS under license with API
Not for ResaleNo reproduction or networking permitted without license from IHS
--`,,```,,,,````-`-`,,`,,`,`,,`---
//^:^^#^~^^"~~:~"~$$"~$^"#:*~:^#~#~^~@~:^:#*:^$:$~:*"\\

RISK-BASED INSPECTION 5
API Publication 570, Piping Inspection Code: Inspection, Repair, Alteration, and Rerating of In-service Piping Systems
API Recommended Practice 571, Damage Mechanisms Affecting Fixed Equipment in the Refining Industry
API Standard 579-1/ASME 1 FFS-1, Fitness-For-Service
API Recommended Practice 581, Risk-Based Inspection Technology
API Standard 653, Tank Inspection, Repair, Alteration, and Reconstruction
API Recommended Practice 752, Management of Hazards Associated With Location of Process Plant Buildings
API Recommended Practice 941, Steels for Hydrogen Service at Elevated Temperatures and Pressures in Petroleum Refineries and Petrochemical Plants
AICHE 2, Dow’s Fire and Explosion Index Hazard Classification Guide, 1994
ASME PVRC Project 99-IP-01, A Comparison of Criteria For Acceptance of Risk, February 16, 2000
EPA 58 FR 54190 (40 CFR Part 68) 3, Risk Management Plan (RMP) Regulations
ISO Guide 73 4, Risk Management Vocabulary
OSHA 29 CFR 1910.119 5, Process Safety Management of Highly Hazardous Chemicals
4 Terms, Definitions, Acronyms and Abbreviations
4.1 Terms and Definitions
For purposes of this RP, the following terms, definitions, acronyms, and abbreviations shall apply.
4.1.1 absolute risk An ideal and accurate description and quantification of risk.
4.1.2 acceptable risk A level of risk that is acceptable to the owner-user.
4.1.3 as low as reasonably practical ALARP A concept of minimization that postulates that attributes (such as risk) can only be reduced to a certain minimum under current technology and with reasonable cost.
1 ASME International, 3 Park Avenue, New York, New York 10016-5990, www.asme.org.2 American Institute of Chemical Engineers, Center for Chemical Process Safety, 3 Park Avenue, 19th Floor, New York, New
York 10016, www.aiche.org/ccps.3 U.S. Environmental Protection Agency, Ariel Rios Building, 1200 Pennsylvania Avenue, Washington, DC 20460,
www.epa.gov.4 International Organization for Standardization, 1, ch. de la Voie-Creuse, Case postale 56, CH-1211, Geneva 20,
Switzerland, www.iso.org.5 U.S. Department of Labor, Occupational Safety and Health Administration, 200 Constitution Avenue, NW, Washington, DC
20210, www.osha.gov.
Copyright American Petroleum Institute Provided by IHS under license with API
Not for ResaleNo reproduction or networking permitted without license from IHS
--`,,```,,,,````-`-`,,`,,`,`,,`---
//^:^
^#^~
^^"~
~:~"
~$$"
~$^"
#:*~
:^#~
#~^~
@~:
^:#*
:^$:
$~:*
"\\

6 API RECOMMENDED PRACTICE 580
4.1.4 components Parts that make up a piece of equipment or equipment item. For example a pressure boundary may consist of components (pipe, elbows, nipples, heads, shells, nozzles, stiffening rings, skirts, supports, etc.) that are bolted or welded into assembles to make up equipment items.
4.1.5 consequence An outcome from an event. There may be one or more consequences from an event. Consequences may range from positive to negative. However, consequences are always negative for safety aspects. Consequences may be expressed qualitatively or quantitatively.
4.1.6 corrosion specialist A person who is knowledgeable and experienced in the specific process chemistries, corrosion degradation mechanisms, materials selection, corrosion mitigation methods, corrosion monitoring techniques, and their impact on pressure equipment.
4.1.7 cost-effective An activity that is both effective in resolving an issue (e.g. some form of mitigation) and is a financially sound use of resources.
4.1.8 damage (or deterioration) mechanism A process that induces micro and/or macro material changes over time that are harmful to the material condition or mechanical properties. Damage mechanisms are usually incremental, cumulative, and, in some instances, unrecoverable. Common damage mechanisms include corrosion, stress corrosion cracking, creep, erosion, fatigue, fracture, and thermal aging.
4.1.9 damage (or deterioration) mode The physical manifestation of damage (e.g. wall thinning, pitting, cracking, rupture).
4.1.10 damage tolerance The amount of deterioration that a component can withstand without failing.
4.1.11 design premise Assumptions made during the design (e.g. design life and corrosion allowance needed).
4.1.12 deterioration The reduction in the ability of a component to provide its intended purpose of containment of fluids. This can be caused by various damage mechanisms (e.g. thinning, cracking, mechanical). Damage or degradation may be used in place of deterioration.
4.1.13 equipment An individual item that is part of a system. Examples include pressure vessels, relief devices, piping, boilers, and heaters.
4.1.14 event Occurrence of a particular set of circumstances. The event may be certain or uncertain. The event can be singular or multiple. The probability of an event occurring within a given period of time can be estimated.
Copyright American Petroleum Institute Provided by IHS under license with API
Not for ResaleNo reproduction or networking permitted without license from IHS
--`,,```,,,,````-`-`,,`,,`,`,,`---
//^:^^#^~^^"~~:~"~$$"~$^"#:*~:^#~#~^~@~:^:#*:^$:$~:*"\\

RISK-BASED INSPECTION 7
4.1.15 event tree An analytical tool that organizes and characterizes potential occurrences in a logical and graphical manner. The event tree begins with the identification of potential initiating events. Subsequent possible events (including activation of safety functions) resulting from the initiating events are then displayed as the second level of the event tree. This process is continued to develop pathways or scenarios from the initiating events to potential outcomes.
4.1.16 external event Events resulting from forces of nature, acts of God, sabotage, or events such as neighboring fires or explosions, terrorism, neighboring hazardous material releases, electrical power failures, forces of nature, and intrusions of external transportation vehicles, such as aircraft, ships, trains, trucks, or automobiles. External events are usually beyond the direct or indirect control of persons employed at or by the facility.
4.1.17 facility Any location containing equipment and/or components to be addressed under this RP.
4.1.18 failure Termination of the ability of a system, structure, equipment or component to perform its required function of containment of fluid (i.e. loss of containment). Failures may be unannounced and undetected at the instant of occurrence (unannounced failure). For example, a slow leak under insulation may not be detected until a pool of fluid forms on the ground or someone notices a drip or wisp of vapor. A small leak may not be noticed until the next inspection (unannounced failure), e.g. slow leakage from buried piping or small leak in a heat exchanger tube; or they may be announced and detected by any number of methods at the instance of occurrence (announced failure), e.g. rupture of a pipe in a process plant or sudden decrease in pressure in the system.
4.1.19 failure mode The manner of failure. For RBI, the failure of concern is loss of containment of pressurized equipment items. Examples of failure modes are small hole, crack, and rupture.
4.1.20 Fitness-For-Fervice assessment A methodology whereby damage or flaws/imperfections contained within a component or equipment item are assessed in order to determine acceptability for continued service.
4.1.21 hazard A physical condition or a release of a hazardous material that could result from component failure and result in human injury or death, loss or damage, or environmental degradation. Hazard is the source of harm. Components that are used to transport, store, or process a hazardous material can be a source of hazard. Human error and external events may also create a hazard.
4.1.22 hazard and operability study HAZOP study A HAZOP study is a form of failure modes and effects analysis (FMEA). HAZOP studies, which were originally developed for the process industry, use systematic techniques to identify hazards and operability issues throughout an entire facility. It is particularly useful in identifying unforeseen hazards designed into facilities due to lack of information, or introduced into existing facilities due to changes in process conditions or operating procedures. The basic objectives of the techniques are:
— to produce a full description of the facility or process, including the intended design conditions;
Copyright American Petroleum Institute Provided by IHS under license with API
Not for ResaleNo reproduction or networking permitted without license from IHS
--`,,```,,,,````-`-`,,`,,`,`,,`---
//^:^
^#^~
^^"~
~:~"
~$$"
~$^"
#:*~
:^#~
#~^~
@~:
^:#*
:^$:
$~:*
"\\
8 API RECOMMENDED PRACTICE 580
— to systematically review every part of the facility or process to discover how deviations from the intention of the design can occur;
— to decide whether these deviations can lead to hazards or operability issues;
— to assess effectiveness of safeguards.
4.1.23 inspection Activities performed to verify that materials, fabrication, erection, examinations, testing, repairs, etc., conform to applicable code, engineering, and/or owner’s written procedure requirements. It includes the planning, implementation, and evaluation of the results of inspection activities. The external, internal, or on-stream assessment (or any combination of the three) of the condition of pressure equipment.
4.1.24 integrity operating window IOW Established limits for process variables that can affect the integrity of the equipment if the process operation deviates from the established limits for a predetermined amount of time.
4.1.25 likelihood Probability.
4.1.26 management of change MOC A documented management system for review and approval of changes in process, equipment or piping systems prior to implementation of the change.
4.1.27 mitigation Limitation of any negative consequence or reduction in probability of a particular event.
4.1.28 probability Extent to which an event is likely to occur within the time frame under consideration. The mathematical definition of probability is “a real number in the scale 0 to 1 attached to a random event.” Probability can be related to a long-run relative frequency of occurrence or to a degree of belief that an event will occur. For a high degree of belief, the probability is near one (1). Frequency rather than probability may be used in describing risk. Degrees of belief about probability can be chosen as classes or ranks like “rare/unlikely/moderate/likely/almost certain” or “incredible/improbable/remote/occasional/probable/frequent.”
4.1.29 process unit A group of systems arranged in a specific fashion to produce a product or service. Examples of processes include power generation, acid production, fuel oil production, and ethylene production.
4.1.30 qualitative risk analysis An analysis that uses broad categorizations for probabilities and consequences of failure. Methods that use primarily engineering judgment and experience as the basis for the determination of probabilities and consequences of failure. The results of qualitative risk analyses are dependent on the background and expertise of the analysts and the objectives of the analysis. FMEA and HAZOPs are examples of qualitative risk analysis techniques that become QRA methods when consequence and failure probability values are estimated along with the respective descriptive input.
Copyright American Petroleum Institute Provided by IHS under license with API
Not for ResaleNo reproduction or networking permitted without license from IHS
--`,,```,,,,````-`-`,,`,,`,`,,`---
//^:^
^#^~
^^"~
~:~"
~$$"
~$^"
#:*~
:^#~
#~^~
@~:
^:#*
:^$:
$~:*
"\\
RISK-BASED INSPECTION 9
4.1.31 quantitative risk analysis QRA
An analysis that quantifies the probabilities and consequences of the probable damage mechanisms and that:
— identifies and delineates the combinations of events that, if they occur, may lead to a severe event or any other undesired consequence;
— estimates the probability of occurrence for each combination;
— estimates the consequences.
QRA generally:
— integrates information about facility design, operating practices, operating history, component reliability, human actions, the physical progression of incidents, and potential environmental and health effects;
— uses logic and probabilistic models depicting combinations of events and the progression of incidents to provide both qualitative and quantitative insights into the level of risks;
— analysis logic models consisting of event trees and fault trees to estimate the frequency of each incident sequence.
4.1.32 reassessment The process of integrating inspection data or other changes into the risk analysis.
4.1.33 relative risk The comparative risk of a facility, process unit, system, equipment item or component to other facilities, process units, systems, equipment items, or components, respectively.
4.1.34 residual risk The risk remaining after risk mitigation.
4.1.35 risk Combination of the probability of an event and its consequence. In some situations, risk is a deviation from the expected. When probability and consequence are expressed numerically, risk is the product.
4.1.36 risk acceptance A decision to accept a risk. Risk acceptance depends on risk criteria.
4.1.37 risk analysis Systematic use of information to identify sources and to estimate the risk. Risk analysis provides a basis for risk evaluation, risk mitigation and risk acceptance. Information can include historical data, theoretical analysis, informed opinions, and concerns of stakeholders.
4.1.38 risk assessment Overall process of risk analysis and risk evaluation.
Copyright American Petroleum Institute Provided by IHS under license with API
Not for ResaleNo reproduction or networking permitted without license from IHS
--`,,```,,,,````-`-`,,`,,`,`,,`---
//^:^^#^~^^"~~:~"~$$"~$^"#:*~:^#~#~^~@~:^:#*:^$:$~:*"\\
10 API RECOMMENDED PRACTICE 580
4.1.39 risk avoidance Decision not to become involved in, or action to withdraw from a risk situation. The decision may be taken based on the result of risk evaluation.
4.1.40 risk-based inspection RBI A risk assessment and management process that is focused on loss of containment of pressurized equipment in processing facilities, due to material deterioration. These risks are managed primarily through equipment inspection.
4.1.41 risk communication Exchange or sharing of information about risk between the decision maker and other stakeholders. The information may relate to the existence, nature, form, probability, severity, acceptability, mitigation, or other aspects of risk.
4.1.42 risk criteria Terms of reference by which the significance of risk is assessed. Risk criteria may include associated cost and benefits, legal and statutory requirements, socio-economic and environmental aspects, concerns of stakeholders, priorities and other inputs to the assessment.
4.1.43 risk driver An item affecting either the probability, consequence, or both such that it constitutes a significant portion of the risk.
4.1.44 risk estimation Process used to assign values to the probability and consequence of a risk. Risk estimation may consider cost, benefits, stakeholder concerns, and other variables, as appropriate for risk evaluation.
4.1.45 risk evaluation Process used to compare the estimated risk against given risk criteria to determine the significance of the risk. Risk evaluation may be used to assist in the acceptance or mitigation decision.
4.1.46 risk identification Process to find, list, and characterize elements of risk. Elements may include: source, event, consequence, probability. Risk identification may also identify stakeholder concerns.
4.1.47 risk management Coordinated activities to direct and control an organization with regard to risk. Risk management typically includes risk assessment, risk mitigation, risk acceptance, and risk communication.
4.1.48 risk mitigation Process of selection and implementation of measures to modify risk. The term risk mitigation is sometimes used for measures themselves.
4.1.49 risk reduction Actions taken to lessen the probability, negative consequences, or both associated with a particular risk.
4.1.50 semi-quantitative analysis A semi-quantitative analysis includes aspects of both qualitative and quantitative analyses.
Copyright American Petroleum Institute Provided by IHS under license with API
Not for ResaleNo reproduction or networking permitted without license from IHS
--`,,```,,,,````-`-`,,`,,`,`,,`---
//^:^^#^~^^"~~:~"~$$"~$^"#:*~:^#~#~^~@~:^:#*:^$:$~:*"\\

RISK-BASED INSPECTION 11
4.1.51 source Thing or activity with a potential for consequence. Source in a safety context is a hazard.
4.1.52 stakeholder Any individual, group or organization that may affect, be affected by, or perceive itself to be affected by the risk.
4.1.53 system A collection of equipment assembled for a specific function within a process unit. Examples of systems include service water system, distillation systems, and separation systems.
4.1.54 turnaround A period of down time to perform inspection, maintenance, or modifications and prepare process equipment for the next operating cycle.
4.1.55 toxic chemical Any chemical that presents a physical or health hazard or an environmental hazard according to the appropriate material safety datasheet. These chemicals (when ingested, inhaled, or absorbed through the skin) can cause damage to living tissue, impairment of the central nervous system, severe illness, or in extreme cases, death. These chemicals may also result in adverse effects to the environment (measured as ecotoxicity and related to persistence and bioaccumulation potential).
4.1.56 unmitigated risk The risk prior to mitigation activities.
4.2 Acronyms and Abbreviations
ACC American Chemistry CouncilAIChE American Institute of Chemical EngineersALARP as low as reasonably practicalANSI American National Standards InstituteASME American Society of Mechanical EngineersASNT American Society of Nondestructive TestingASTM American Society of Testing and MaterialsBLEVE boiling liquid expanding vapor explosionCCPS Center for Chemical Process SafetyCOF consequence of failureEPA Environmental Protection AgencyFMEA failure modes and effects analysisHAZOP hazard and operability assessmentIOW integrity operating windowISO International Organization for StandardizationLOPA layers of protection analysisMOC management of changeMSD material selection diagramsNACE National Association of Corrosion EngineersNDE nondestructive examination
Copyright American Petroleum Institute Provided by IHS under license with API
Not for ResaleNo reproduction or networking permitted without license from IHS
--`,,```,,,,````-`-`,,`,,`,`,,`---
//^:^^#^~^^"~~:~"~$$"~$^"#:*~:^#~#~^~@~:^:#*:^$:$~:*"\\

12 API RECOMMENDED PRACTICE 580
NFPA National Fire Protection AssociationOSHA Occupational Safety and Health AdministrationPHA process hazards analysisPMI positive material identificationPOF probability of failurePSM process safety managementPTASCC polythionic acid stress corrosion crackingPVRC Pressure Vessel Research CouncilQA/QC quality assurance/quality controlQRA quantitative risk assessmentRBI risk-based inspectionRCM reliability centered maintenanceRMP risk management planSIL safety integrity levelTEMA Tubular Exchangers Manufacturers AssociationTNO The Netherlands Organization for Applied Scientific ResearchUT ultrasonic testing
5 Basic Risk Assessment Concepts
5.1 What is Risk?
Risk is something that we as individuals live with on a day-to-day basis. Knowingly or unknowingly, people are constantly making decisions based on risk. Simple decisions such as driving to work or walking across a busy street involve risk. More important decisions such as buying a house, investing money, and getting married all imply an acceptance of risk. Life is not risk-free and even the most cautious, risk-adverse individuals inherently take risks. Some people take more risks than others (knowingly or unknowingly), e.g. sky divers, mountain climbers, coal miners, and people who drive while intoxicated.
For example, in driving a car, people accept the probability that they could be killed or seriously injured. The reason this risk is accepted is that people consider the probability of being killed or seriously injured to be sufficiently low as to make the risk acceptable. Influencing the decision are the type of car, the safety features installed, traffic volume and speed, and other factors such as the availability, risks and affordability of other alternatives (e.g. mass transit).
Risk is the combination of the probability of some event occurring during a time period of interest and the consequences, (generally negative) associated with the event. In mathematical terms, risk can be calculated by the equation:
Risk = Probability × Consequence
Likelihood is sometimes used as a synonym for probability, however probability is used throughout this document for consistency.
Effective risk assessment should be a rational, logical, structured process, which contains at least two key steps. First to determine how big the risk is; and second, to determine whether the risk is acceptable.
5.2 Risk Management and Risk Reduction
Once the risk is known and the magnitude of the risk is established, it is time for risk management. At first, it may seem that risk management and risk reduction are synonymous. However, risk reduction is only part of risk management. Risk reduction is the act of mitigating a known risk that is deemed to be too high to a lower, more acceptable level of risk with
Copyright American Petroleum Institute Provided by IHS under license with API
Not for ResaleNo reproduction or networking permitted without license from IHS
--`,,```,,,,````-`-`,,`,,`,`,,`---
//^:^
^#^~
^^"~
~:~"
~$$"
~$^"
#:*~
:^#~
#~^~
@~:
^:#*
:^$:
$~:*
"\\
RISK-BASED INSPECTION 13
some form of risk reduction activity. Risk management, on the other hand, is a process to assess risks, to determine if risk reduction is required and to develop a plan to maintain risks at an acceptable level. By using risk management, some risks may be identified as acceptable so that no risk reduction (mitigation) is required.
5.3 The Evolution of Inspection Intervals/Due Dates
In process plants, inspection and testing programs and process monitoring are established to detect and evaluate deterioration due to the effects of in-service operation. The effectiveness of inspection programs varies widely, ranging from reactive programs, which concentrate on known areas of concern, to broad proactive programs covering a variety of equipment. One extreme of this would be the “don’t fix it unless its broken” approach. The other extreme would be complete inspection of all equipment items on a frequent basis.
Setting the intervals/due dates between inspections has evolved over time. With the need to periodically verify equipment integrity, organizations initially resorted to time-based or “calendar-based” intervals/due dates.
With advances in inspection approaches, and better understanding of the type and rate of deterioration, inspection intervals/due dates became more dependent on the equipment condition (i.e. condition-based inspection), rather than what might have been an arbitrary calendar date. Codes and standards such as API 510, API 570, and API 653 evolved to an inspection philosophy with elements such as:
a) inspection intervals/due dates based on some percentage of equipment life (such as half life),
b) on-stream inspection in lieu of internal inspection based on low deterioration rates,
c) internal inspection requirements for damage mechanisms related to process environment induced cracking,
d) consequence based inspection intervals/due dates.
RBI represents the next generation of inspection approaches and interval/due date setting, recognizing that the ultimate goal of inspection is the safety and reliability of operating facilities. RBI, as a risk-based approach, focuses attention specifically on the equipment and associated damage mechanisms representing the most risk to the facility. In focusing on risks and their mitigation, RBI provides a better linkage between the mechanisms that lead to equipment failure (loss of containment) and the inspection approaches that will effectively reduce the associated risks. Though there can be many definitions for failure of pressure equipment, in this document, failure is defined as loss of containment.
5.4 Overview of Risk Analysis
The complexity of a risk analysis is a function of the number of factors that can affect the risk and there is a continuous spectrum of methods available to assess risk. The methods range from a strictly relative ranking to rigorous calculation. The methods generally represent a range of precision for the resulting risk analysis (see 6.4).
Any particular analysis may not yield usable results due to a lack of data, low-quality data or the use of an approach that does not adequately differentiate the risks represented by the equipment items. Further, analysis results may not be realistic. Therefore, the risk analysis should be validated before decisions are made based on the analysis results.
A logical progression for a risk analysis is:
a) collect and validate the necessary data and information (see Section 8);
b) identify damage mechanisms and, optionally, determine the damage mode(s) for each mechanism (e.g. general metal loss, local metal loss, pitting) (see Section 9);
c) determine damage susceptibility and rates (see Section 9);
Copyright American Petroleum Institute Provided by IHS under license with API
Not for ResaleNo reproduction or networking permitted without license from IHS
--`,,```,,,,````-`-`,,`,,`,`,,`---
//^:^^#^~^^"~~:~"~$$"~$^"#:*~:^#~#~^~@~:^:#*:^$:$~:*"\\

14 API RECOMMENDED PRACTICE 580
d) determine the POF over a defined time frame for each damage mechanism (see Section 10);
e) determine credible failure mode(s) [e.g. small leak, large leak, rupture (see Section 10)];
f) identify credible consequence scenarios that will result from the failure mode(s) (see Section 11);
g) determine the probability of each consequence scenario, considering the POF and the probability that a specific consequence scenario will result from the failure (see Section 11);
h) determine the risk, including a sensitivity analysis, and review risk analysis results for consistency/reasonableness (see Section 12).
Then the logical progression after completing the risk analysis is to develop an inspection plan and, if necessary, other mitigation actions, and evaluate the residual risk (see Section 13).
If the risk is not acceptable, consider mitigation. For example, if the damage mode is general metal loss, a mitigation plan could consist of on-stream wall thickness measurements, with a requirement to shut down or to repair on-stream if the wall thickness measurements do not meet Fitness-For-Service acceptance criteria.
5.5 Inspection Optimization
When the risk associated with individual equipment items is determined and the relative effectiveness of different inspection techniques and process monitoring in reducing risk is estimated or quantified, adequate information is available for planning, optimizing, and implementing an RBI program.
Figure 1 presents stylized curves showing the reduction in risk that can be expected when the degree and frequency of inspection are increased. The upper curve in Figure 1 represents a typical inspection program. Where there is no inspection, there may be a higher level of risk, as indicated on the y-axis in the figure. With an initial investment in inspection activities, risk generally is significantly reduced. A point is reached where additional inspection activity begins to show a diminishing return and, eventually, may produce very little additional risk reduction. If excessive inspection is applied, the level of risk may even go up. This is because invasive inspections in certain cases may cause additional deterioration (e.g. moisture ingress in equipment with polythionic acid; inspection damage to protective coatings or glass-lined vessels). This situation is represented by the dotted line at the end of the upper curve.
A complete RBI program provides a consistent methodology for assessing the optimum combination of methods and frequencies of inspection. Each available inspection method can be analyzed and its relative effectiveness in reducing failure probability can be estimated. Given this information and the cost of each procedure, an optimization program can be developed. The key to developing such a procedure is the ability to assess the risk associated with each item of equipment and then to determine the most appropriate inspection techniques for that piece of equipment. A conceptual result of this methodology is illustrated by the lower curve in Figure 1. The lower curve indicates that with the application of an effective RBI program, lower risks can be achieved with the same level of inspection activity. This is because, through RBI, inspection activities are focused on higher risk items and away from lower risk items.
As shown in Figure 1, risk cannot be reduced to zero solely by inspection efforts. The residual risk factors for loss of containment include, but are not limited to issues such as the following:
a) human error,
b) natural disasters,
c) external events (e.g. collisions or falling objects),
Copyright American Petroleum Institute Provided by IHS under license with API
Not for ResaleNo reproduction or networking permitted without license from IHS
--`,,```,,,,````-`-`,,`,,`,`,,`---
//^:^^#^~^^"~~:~"~$$"~$^"#:*~:^#~#~^~@~:^:#*:^$:$~:*"\\

RISK-BASED INSPECTION 15
d) secondary effects from nearby units,
e) consequential effects from associated equipment in the same unit,
f) deliberate acts (e.g. sabotage),
g) fundamental limitations of inspection methods,
h) design errors,
i) unknown or unanticipated mechanisms of damage.
Many of these factors are strongly influenced by the PSM system in place at the facility.
5.6 Relative Risk vs Absolute Risk
The complexity of risk calculations is a function of the number of factors that can affect the risk. Calculating absolute risk can be very time and cost consuming and often can not be done with a high degree of accuracy, due to having too many uncertainties. Many variables are involved with loss of containment in hydrocarbon and chemical facilities and the determination of absolute risk numbers is often not even possible and not cost effective. RBI is focused on a systematic determination of relative risks. In this way, facilities, units, systems, equipment, or components can be ranked based on their relative risk. This serves to focus the risk management efforts on the higher ranked risks and allow decisions to be made on the usefulness of risk management efforts on lower ranked risks.
If a quantitative RBI study is conducted rigorously and properly, the resultant risk number should be a fair approximation of the actual risk of loss of containment due to deterioration. Numeric relative risk values determined in qualitative and semi-quantitative assessments using appropriate sensitivity analysis methods also may be used effectively to evaluate risk acceptance.
Figure 1—Management of Risk Using RBI
Level of inspection activity
Ris
k
Risk using RBIand an optimizedinspection program
Residual risk notaffected by RBI
Risk with typical inspection programs
Copyright American Petroleum Institute Provided by IHS under license with API
Not for ResaleNo reproduction or networking permitted without license from IHS
--`,,```,,,,````-`-`,,`,,`,`,,`---
//^:^^#^~^^"~~:~"~$$"~$^"#:*~:^#~#~^~@~:^:#*:^$:$~:*"\\

16 API RECOMMENDED PRACTICE 580
6 Introduction to Risk-Based Inspection
6.1 Key Elements of an RBI Program
Key elements that should exist in any RBI program include:
a) management systems for maintaining documentation, personnel qualifications, data requirements, consistency of the program and analysis updates;
b) documented method for POF determination;
c) documented method for COF determination;
d) documented methodology for managing risk through inspection, process control and other mitigation activities.
However, all the elements outlined in Section 1 should be adequately addressed in all RBI applications, in accordance with the recommended practices in this document.
6.2 Consequence and Probability for RBI
The objective of RBI is to determine what incident could occur (consequence) in the event of an equipment failure, and how likely (probability) it is that the incident could happen. For example, if a pressure vessel subject to damage from corrosion under insulation develops a leak, a variety of consequences could occur. Some of the possible consequences are:
a) form a vapor cloud that could ignite causing injury and equipment damage;
b) release of a toxic chemical that could cause health problems;
c) result in a spill and cause environmental damage;
d) force a unit shutdown and have an adverse economic impact;
e) have minimal safety, health, environmental, and/or economic impact.
Combining the probability of one or more of these events with its consequences will determine the risk to the operation. Some failures may occur relatively frequently without significant adverse safety, environmental or economic impacts. Similarly, some failures have potentially serious consequences, but if the probability of the incident is low, the risk may not warrant immediate or extensive action. However, if the probability and consequence combination (risk) is high enough to be unacceptable, then a mitigation action to reduce the probability and/or the consequence of the event is appropriate.
Traditionally, organizations have focused solely on the consequences or the POF without systematic efforts tying the two together. They have not considered how likely it is that an undesirable incident will occur in combination with the consequence. Only by considering both factors can effective risk-based decision-making take place. Typically, risk acceptability criteria are defined, recognizing that not every failure will lead to an undesirable incident with serious consequence (e.g. water leaks) and that some serious consequence incidents have very low probabilities (e.g. rupture of a clean propane vessel).
Understanding the two-dimensional aspect of risk allows new insight into the use of risk for inspection prioritization and planning. Figure 2 displays the risk associated with the operation of a number of equipment items in a process plant. Both the probability and COF have been determined for 10 equipment items, and the results have been plotted. The points represent the risk associated with each equipment item. Ordering by risk produces a risk-based ranking of the equipment items to be inspected. From this list, an inspection plan can be developed that focuses attention on the
Copyright American Petroleum Institute Provided by IHS under license with API
Not for ResaleNo reproduction or networking permitted without license from IHS
--`,,```,,,,````-`-`,,`,,`,`,,`---
//^:^^#^~^^"~~:~"~$$"~$^"#:*~:^#~#~^~@~:^:#*:^$:$~:*"\\

RISK-BASED INSPECTION 17
areas of highest risk. An “ISO-risk” line is shown on Figure 2. An ISO-risk line represents a constant risk level, as shown across the matrix in Figure 2. All items that fall on or very near the ISO-risk line are roughly equivalent in their level of risk. A user defined acceptable risk level could be plotted as an ISO-risk line. In this way the acceptable risk line would separate the unacceptable from the acceptable risk items. Often a risk plot is drawn using log-log scales for a better understanding of the relative risks of the items assessed.
6.3 Types of RBI Assessment
Various types of RBI assessment may be conducted at several levels. The choice of approach is dependent on multiple variables such as:
a) objective of the study,
b) number of facilities and equipment items to study,
c) available resources,
d) assessment time frame,
e) complexity of facilities and processes,
f) nature and quality of available data,
g) the amount of risk discrimination needed.
The RBI procedure can be applied qualitatively, quantitatively or by using aspects of both (i.e. semi-quantitatively). Each approach provides a systematic way to screen for risk, identify areas of potential concern, and develop a prioritized list for more in depth inspection or analysis. Each develops a risk ranking measure to be used for evaluating separately the POF and the potential COF. These two values are then combined to estimate risk of failure.
The chosen approach may be selected at the beginning of the analysis process and carried through to completion, or the approach may be changed (i.e. the analysis may become more or less quantitative) as the analysis progresses. However, consistency of approach will be vital to comparing results from one assessment to the next. If the risk
Figure 2—Risk Plot
Consequence of failure
Pro
babi
lity
of fa
ilure
ISO-risk line
1 2
3
4
5
6
7
89
10
Copyright American Petroleum Institute Provided by IHS under license with API
Not for ResaleNo reproduction or networking permitted without license from IHS
--`,,```,,,,````-`-`,,`,,`,`,,`---
//^:^
^#^~
^^"~
~:~"
~$$"
~$^"
#:*~
:^#~
#~^~
@~:
^:#*
:^$:
$~:*
"\\
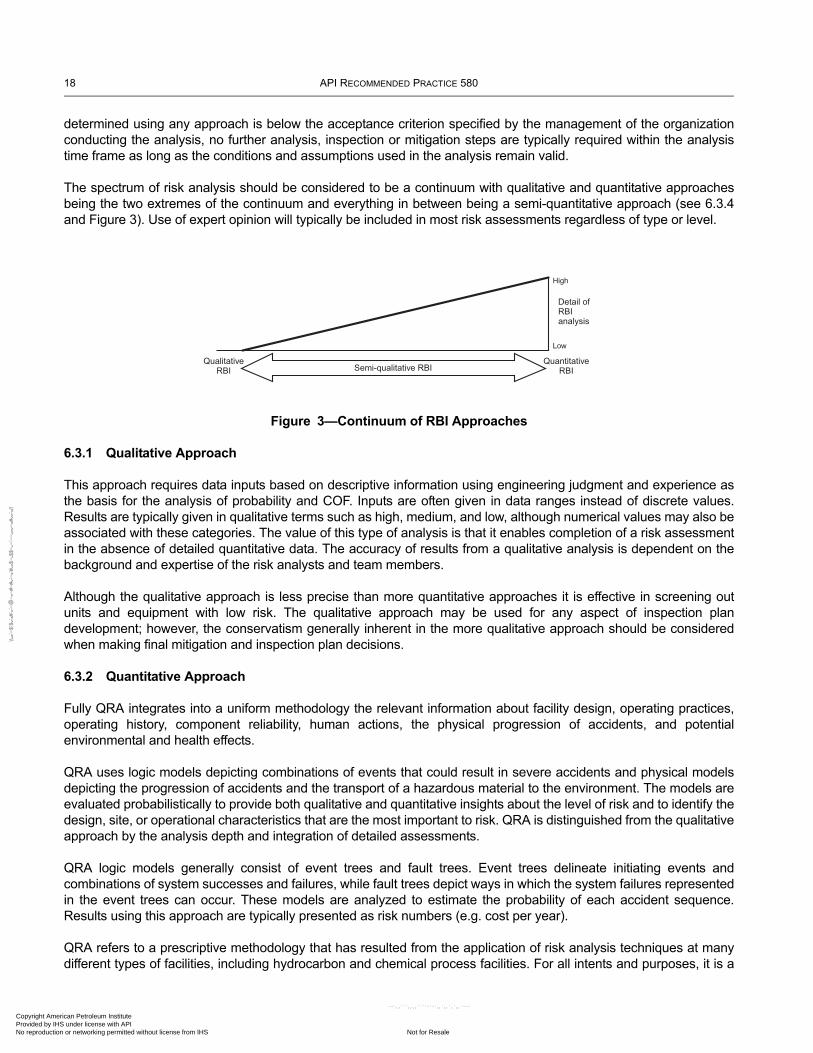
18 API RECOMMENDED PRACTICE 580
determined using any approach is below the acceptance criterion specified by the management of the organization conducting the analysis, no further analysis, inspection or mitigation steps are typically required within the analysis time frame as long as the conditions and assumptions used in the analysis remain valid.
The spectrum of risk analysis should be considered to be a continuum with qualitative and quantitative approaches being the two extremes of the continuum and everything in between being a semi-quantitative approach (see 6.3.4 and Figure 3). Use of expert opinion will typically be included in most risk assessments regardless of type or level.
6.3.1 Qualitative Approach
This approach requires data inputs based on descriptive information using engineering judgment and experience as the basis for the analysis of probability and COF. Inputs are often given in data ranges instead of discrete values. Results are typically given in qualitative terms such as high, medium, and low, although numerical values may also be associated with these categories. The value of this type of analysis is that it enables completion of a risk assessment in the absence of detailed quantitative data. The accuracy of results from a qualitative analysis is dependent on the background and expertise of the risk analysts and team members.
Although the qualitative approach is less precise than more quantitative approaches it is effective in screening out units and equipment with low risk. The qualitative approach may be used for any aspect of inspection plan development; however, the conservatism generally inherent in the more qualitative approach should be considered when making final mitigation and inspection plan decisions.
6.3.2 Quantitative Approach
Fully QRA integrates into a uniform methodology the relevant information about facility design, operating practices, operating history, component reliability, human actions, the physical progression of accidents, and potential environmental and health effects.
QRA uses logic models depicting combinations of events that could result in severe accidents and physical models depicting the progression of accidents and the transport of a hazardous material to the environment. The models are evaluated probabilistically to provide both qualitative and quantitative insights about the level of risk and to identify the design, site, or operational characteristics that are the most important to risk. QRA is distinguished from the qualitative approach by the analysis depth and integration of detailed assessments.
QRA logic models generally consist of event trees and fault trees. Event trees delineate initiating events and combinations of system successes and failures, while fault trees depict ways in which the system failures represented in the event trees can occur. These models are analyzed to estimate the probability of each accident sequence. Results using this approach are typically presented as risk numbers (e.g. cost per year).
QRA refers to a prescriptive methodology that has resulted from the application of risk analysis techniques at many different types of facilities, including hydrocarbon and chemical process facilities. For all intents and purposes, it is a
Figure 3—Continuum of RBI Approaches
QualitativeRBI
QuantitativeRBISemi-qualitative RBI
High
Detail ofRBIanalysis
Low
Copyright American Petroleum Institute Provided by IHS under license with API
Not for ResaleNo reproduction or networking permitted without license from IHS
--`,,```,,,,````-`-`,,`,,`,`,,`---
//^:^^#^~^^"~~:~"~$$"~$^"#:*~:^#~#~^~@~:^:#*:^$:$~:*"\\

RISK-BASED INSPECTION 19
traditional risk analysis. An RBI analysis shares many of the techniques and data requirements with a QRA. If a QRA has been prepared for a process unit, the RBI consequence analysis can borrow extensively from this effort.
The traditional QRA is generally comprised of five tasks:
1) systems identification,
2) hazards identification,
3) probability assessment,
4) consequence analysis,
5) risk results.
The systems definition, hazard identification and consequence analysis are integrally linked. Hazard identification in an RBI analysis generally focuses on identifiable failure mechanisms in the equipment (inspectable causes) but does not explicitly deal with other potential failure scenarios resulting from events such as power failures or human errors. A QRA deals with total risk, not just risk associated with equipment damage.
The QRA typically involves a much more detailed evaluation than an RBI analysis. The following data are typically analyzed:
a) existing HAZOP or PHA results,
b) dike and drainage design,
c) hazard detection systems,
d) fire protection systems,
e) release statistics,
f) injury statistics,
g) population distributions,
h) topography,
i) weather conditions,
j) land use.
A QRA is generally performed by experienced risk analysts. There are opportunities to link the detailed QRA with an RBI study.
6.3.3 Semi-quantitative Approach
Semi-quantitative is a term that describes any approach that has aspects derived from both the qualitative and quantitative approaches. It is geared to obtain the major benefits of the previous two approaches (e.g. speed of the qualitative and rigor of the quantitative). Typically, most of the data used in a quantitative approach is needed for this approach but in less detail. The models also may not be as rigorous as those used for the quantitative approach. The results are usually given in consequence and probability categories or as risk numbers but numerical values may be
Copyright American Petroleum Institute Provided by IHS under license with API
Not for ResaleNo reproduction or networking permitted without license from IHS
--`,,```,,,,````-`-`,,`,,`,`,,`---
//^:^^#^~^^"~~:~"~$$"~$^"#:*~:^#~#~^~@~:^:#*:^$:$~:*"\\

20 API RECOMMENDED PRACTICE 580
associated with each category to permit the calculation of risk and the application of appropriate risk acceptance criteria.
6.3.4 Continuum of Approaches
In practice, an RBI study typically uses aspects of qualitative, quantitative and semi-quantitative approaches. These RBI approaches are not considered as competing but rather as complementary. For example, a high level qualitative approach could be used at a unit level to select the unit within a facility that provides the highest risk for further analysis. Systems and equipment within the unit then may be screened using a qualitative approach with a more quantitative approach used for the higher risk items. Another example could be to use a qualitative consequence analysis combined with a semi-quantitative probability analysis.
When performing risk analysis across different equipment, a single site or multiple sites, the user is cautioned about comparing specific results unless the same or very similar RBI methodologies and assumptions were applied. The user is also cautioned against drawing conclusions about different results when different methodologies are used to evaluate the same piece of equipment.
The RBI process, shown in the simplified block diagram in Figure 4, depicts the essential elements of inspection planning based on risk analysis. This diagram is applicable to Figure 3 regardless of which RBI approach is applied, i.e. each of the essential elements shown in Figure 4 are necessary for a complete RBI program regardless of approach (qualitative, semi-quantitative, or quantitative).
6.4 Precision vs Accuracy
It is important to understand the difference between precision and accuracy when it comes to risk analysis. Accuracy is a function of the analysis methodology, the quality of the data and consistency of application while precision is a function of the selected metrics and computational methods. Risk presented as a precise numeric value (as in a quantitative analysis) implies a greater level of accuracy when compared to a risk matrix (as in a qualitative analysis). However, the implied linkage of precision and accuracy may not exist because of the element of uncertainty that is inherent with probabilities and consequences. The basis for predicted damage and rates, the level of confidence in inspection data and the technique used to perform the inspection are all factors that should be considered. In practice, there are often many extraneous factors that will affect the estimate of damage rate (probability) as well as the magnitude of a failure (consequence) that cannot be fully taken into account with a fixed model. Therefore, it may be beneficial to use quantitative and qualitative methods in a complementary fashion to produce the most effective and efficient assessment.
Figure 4—Risk-Based Inspection Planning Process
Data andinformationcollection
Consequence offailure
Probability offailure
Riskranking
Inspectionplan
Mitigation(if any)
Reassessment
Risk assessment process
Copyright American Petroleum Institute Provided by IHS under license with API
Not for ResaleNo reproduction or networking permitted without license from IHS
--`,,```,,,,````-`-`,,`,,`,`,,`---
//^:^
^#^~
^^"~
~:~"
~$$"
~$^"
#:*~
:^#~
#~^~
@~:
^:#*
:^$:
$~:*
"\\

RISK-BASED INSPECTION 21
Quantitative analysis uses logic models to calculate probabilities and consequences of failure. Logic models used to characterize materials damage of equipment and to determine the COFs typically can have significant variability and therefore could introduce error and inaccuracy impacting the quality of the risk assessment. Therefore, it is important that results from these logic models are validated by expert judgment.
The accuracy of any type of RBI analysis depends on using a sound methodology, quality data, and knowledgeable personnel and is important to any type of RBI methodology selected for application.
6.5 Understanding How RBI Can Help to Manage Operating Risks
The mechanical integrity and functional performance of equipment depends on the suitability of the equipment to operate safely and reliably under the normal and abnormal (upset) operating conditions to which the equipment is exposed. In performing an RBI assessment, the susceptibility of equipment to damage by one or more mechanisms (e.g. corrosion, fatigue and cracking) is established. The susceptibility of each equipment item should be clearly defined for the current and projected operating conditions including such factors as:
a) normal operation,
b) upset conditions,
c) normal start-up and shutdown,
d) idle or out-of-service time,
e) emergency shutdown and subsequent start-up.
Process variables that should be considered for each operating condition include, but are not limited to:
a) process fluid, contaminants and aggressive components;
b) pressures, including cyclic and transient conditions;
c) temperatures, including cyclic and transient conditions;
d) flow rates;
e) desired unit run length between scheduled shutdowns (turnarounds).
The suitability and current condition of the equipment within the established IOW will determine the POF (see Section 10) of the equipment from one or more damage mechanisms. This probability, when coupled with the associated COF (see Section 11) will determine the operating risk associated with the equipment item (see Section 12), and therefore the need for mitigation, if any, such as inspection, metallurgy change or change in operating conditions (see Section 13 and Section 14).
Since risk is dynamic (i.e. changes with time) it is vital that any RBI process that is developed or selected for application have the ability to be easily updated (including changes in the inspection plan) when changes occur or new information is discovered. Those changes might include such things as:
a) new data from inspection activities (i.e. changes in rates of deterioration are noted in external, internal, or on-stream inspections);
b) changes in operation, operating variables or operation outside of the IOW;
c) changes in the process fluids, however small;
Copyright American Petroleum Institute Provided by IHS under license with API
Not for ResaleNo reproduction or networking permitted without license from IHS
--`,,```,,,,````-`-`,,`,,`,`,,`---
//^:^^#^~^^"~~:~"~$$"~$^"#:*~:^#~#~^~@~:^:#*:^$:$~:*"\\

22 API RECOMMENDED PRACTICE 580
d) changes in process equipment, including additions;
e) equipment leaks or failures.
Any and all of this type of information must be communicated on a timely basis so that changes in the inspection plan can be made, as necessary.
6.6 Management of Risks
6.6.1 Risk Management Through Inspection
The objective of RBI is to direct management’s decision process of prioritizing resources to manage risk. Inspection influences the uncertainty of the risk associated with pressure equipment primarily by improving knowledge of the deterioration state and predictability of the POF. Although inspection does not reduce risk directly, it is a risk management activity (provider of new information) that may lead to risk reduction. Impending failure of pressure equipment is not avoided by inspection activities unless the inspection precipitates risk mitigation activities that change the POF. In-service inspection is primarily concerned with the detection and monitoring of deterioration. The POF due to such deterioration is a function of four factors:
a) deterioration type and mechanism,
b) rate of deterioration,
c) probability of identifying and detecting deterioration and predicting future deterioration states with inspection technique(s),
d) tolerance of the equipment to the type of deterioration.
6.6.2 Using RBI to Establish Inspection Plans and Priorities
The primary product of an RBI effort should be an inspection plan for each equipment item evaluated. RBI is a logical and structured process for planning and evaluating inspection activities for pressure equipment. The inspection plan should detail the unmitigated risk related to the current operation. For risks considered unacceptable, the plan should contain the mitigation actions that are recommended to reduce the unmitigated risk to acceptable levels.
For those equipment items where inspection is a cost-effective means of risk management, the plans should describe the type, scope and timing of inspection/examination recommended. Ranking of the equipment by the unmitigated risk level allows users to assign priorities to the various inspection/examination tasks. The level of the unmitigated risk should be used to evaluate the urgency for performing the inspection.
6.6.3 Evaluation and Fitness-For-Service Analysis
Evaluation of the results of the inspection and examination activities and conducting an assessment of fitness for continued service are also key parts of the RBI process. Although the reduction in uncertainty provided by the inspection process can help to better quantify the calculated risk, without evaluation of inspection results and assessment of equipment Fitness-For-Service after the inspection, effective risk reduction may not be accomplished. The Fitness-For-Service assessment is often accomplished through the knowledge and expertise of the inspector and engineers involved when deterioration is within known acceptable limits, but on occasion will require an engineering analysis such as those contained in API 579-1/ASME FFS-1.
Copyright American Petroleum Institute Provided by IHS under license with API
Not for ResaleNo reproduction or networking permitted without license from IHS
--`,,```,,,,````-`-`,,`,,`,`,,`---
//^:^
^#^~
^^"~
~:~"
~$$"
~$^"
#:*~
:^#~
#~^~
@~:
^:#*
:^$:
$~:*
"\\

RISK-BASED INSPECTION 23
6.6.4 Other Risk Management
Some risks cannot be adequately managed by inspection alone. Examples where inspection may not be sufficient to manage risks to acceptable levels are:
a) equipment nearing retirement;
b) failure mechanisms (such as brittle fracture, fatigue) where avoidance of failure primarily depends on design and operating within a defined pressure/temperature envelope;
c) consequence-dominated risks.
In such cases, noninspection mitigation actions (such as equipment repair, replacement or upgrade, equipment redesign or maintenance of strict controls on operating conditions) may be the only appropriate measures that can be taken to reduce risk to acceptable levels. See Section 14 for methods of risk mitigation other than inspection.
6.7 Relationship Between RBI and Other Risk-Based and Safety Initiatives
6.7.1 General
The risk-based inspection methodology is intended to complement other risk-based and safety initiatives. The output from several of these initiatives can provide input to the RBI effort, and RBI outputs may be used to improve safety and risk-based initiatives already implemented by organizations. Examples of some of these other initiatives are:
a) OSHA PSM programs,
b) EPA risk management programs,
c) ACC responsible care,
d) ASME risk assessment publications,
e) CCPS risk assessment techniques,
f) RCM,
g) PHA,
h) safeguarding analysis,
i) SIL,
j) LOPA.
The relationship between RBI and several initiatives is described in 6.7.2 through 6.7.4.
6.7.2 PHA
A PHA uses a systemized approach to identify and analyze hazards in a process unit. The RBI study can include a review of the output from any PHA that has been conducted on the unit being evaluated. Hazards associated with potential equipment failure due to in-service degradation identified in the PHA can be specifically addressed in the RBI analysis.
Copyright American Petroleum Institute Provided by IHS under license with API
Not for ResaleNo reproduction or networking permitted without license from IHS
--`,,```,,,,````-`-`,,`,,`,`,,`---
//^:^^#^~^^"~~:~"~$$"~$^"#:*~:^#~#~^~@~:^:#*:^$:$~:*"\\

24 API RECOMMENDED PRACTICE 580
Potential hazards identified in a PHA will often affect the POF side of the risk equation. The hazard may result from a series of events that could cause a process upset, or it could be the result of process design or instrumentation deficiencies. In either case, the hazard may increase the POF, in which case the RBI assessment could reflect the same.
Some hazards identified affect the consequence side of the risk equation. For example, the potential failure of an isolation valve could increase the inventory of material available for release in the event of a leak. The consequence calculation in the RBI procedure could be modified to reflect this added hazard.
Likewise, the results of an RBI assessment can significantly enhance the overall value of a PHA and help to avoid duplicate effort by two separate teams looking at the risk of failure.
6.7.3 PSM
An effective PSM system can significantly reduce risk levels in a process plant (refer to OSHA 29 CFR 1910.119 and API 750). RBI may include methodologies to assess the effectiveness of the management systems in maintaining mechanical integrity. The results of such a management systems evaluation are factored into the risk determinations.
Several of the features of an effective PSM program provide input for an RBI study. Extensive data on the equipment and the process are required in the RBI analysis, and output from PHA and incident investigation reports increases the validity of the study. In turn, the RBI program can improve the mechanical integrity aspect of the PSM program. An effective PSM program includes a well-structured and effective pressure equipment inspection program. The RBI system will improve the focus of the inspection plan, resulting in a strengthened PSM program.
Operating with a comprehensive inspection program should reduce the risks of releases from a facility and should provide benefits in complying with safety-related initiatives.
6.7.4 Equipment Reliability
Equipment reliability programs can provide input to the probability analysis portion of an RBI program. Specifically, reliability records can be used to develop equipment failure probabilities and leak frequencies. Equipment reliability is especially important if leaks can be caused by secondary failures, such as loss of utilities. Reliability efforts, such as RCM, can be linked with RBI, resulting in an integrated program to reduce downtime in an operating unit. At facilities with an effective RBI program, the RCM program can typically focus on the reliability aspects of equipment other than pressure equipment, and perhaps just focus on the reliability aspects of pressure equipment that do not pertain to loss of containment (e.g. tray damage and valve reliability).
6.8 Relationship with Jurisdictional Requirements
Codes and legal requirements vary from one jurisdiction to another. In some cases, jurisdictional requirements mandate specific actions such as the type of inspections and intervals between inspections. In jurisdictions that permit the application of the API inspection codes and standards, RBI should be an acceptable method for establishing inspection plans and setting inspection due dates. All users should review their jurisdictional code and legal requirements for acceptability of using RBI for inspection planning purposes. The fact that some jurisdictions may have some prescriptive time-based rules on inspection intervals do not preclude the user from gaining significant benefits from the application of RBI, as long as jurisdictional requirements are met and as long as the local regulations do not specifically prohibit the use of RBI planning. Those benefits can include:
a) application of RBI can provide evidence of sound risk management and integrity monitoring programs that can be used as a basis for advocating adoption of RBI by jurisdictions,
b) application of RBI can provide evidence of fulfilling requirements of meeting specific industry standards as well as other types of asset integrity programs,
Copyright American Petroleum Institute Provided by IHS under license with API
Not for ResaleNo reproduction or networking permitted without license from IHS
--`,,```,,,,````-`-`,,`,,`,`,,`---
//^:^
^#^~
^^"~
~:~"
~$$"
~$^"
#:*~
:^#~
#~^~
@~:
^:#*
:^$:
$~:*
"\\

RISK-BASED INSPECTION 25
c) application of RBI can provide a basis for reducing risk further than what may be achieved through time-based inspection rules.
7 Planning the RBI Assessment
7.1 Getting Started
This section helps a user determine the scope and the priorities for an RBI assessment. Screening is done to focus the effort. Boundary limits are identified to determine what is vital to include in the assessment. The organizing process of aligning priorities, screening risks, and identifying boundaries improves the efficiency and effectiveness of conducting the RBI assessment and its end-results in managing risk.
An RBI assessment is a team-based process. At the beginning of the exercise, it is important to answer the following questions.
— Why the assessment is being done?
— How the RBI assessment will be carried out?
— What knowledge and skills are required for the assessment?
— Who is on the RBI team?
— What are their roles in the RBI process?
— Who is responsible and accountable for what actions?
— Which facilities, assets, and components will be included?
— What data is to be used in the assessment?
— What codes and standards are applicable?
— When the assessment will be completed?
— How long the assessment will remain in effect and when it will be updated?
— How the results will be used?
— What is the plan period?
At the conclusion of the planning portion of the development of the RBI program, the following should have been completed:
a) establish the objectives of the risk analysis,
b) identify the physical boundaries,
c) identify the operating boundaries,
d) develop screening questions and criteria consistent with the objectives of the analysis and identified physical and operating boundaries.
Copyright American Petroleum Institute Provided by IHS under license with API
Not for ResaleNo reproduction or networking permitted without license from IHS
--`,,```,,,,````-`-`,,`,,`,`,,`---
//^:^^#^~^^"~~:~"~$$"~$^"#:*~:^#~#~^~@~:^:#*:^$:$~:*"\\

26 API RECOMMENDED PRACTICE 580
Once this portion of the RBI planning process has been completed, the data and information required for collection should be identified (see Section 8). Note that it may be necessary to revise the objectives, boundaries, screening questions, etc., based upon the availability and quality of the data and information.
7.2 Establishing Objectives and Goals of an RBI Assessment
7.2.1 General
An RBI assessment should be undertaken with clear objectives and goals that are fully understood by all members of the RBI team and by management. Some examples are listed in 7.2.2 to 7.2.9.
7.2.2 Understand Risks
An objective of the RBI assessment may be to better understand the risks involved in the operation of a plant or process unit and to understand the effects that inspection, maintenance and mitigation actions have on the risks.
From the understanding of risks, an inspection program may be designed that optimizes the use of inspection and plant maintenance resources.
7.2.3 Define Risk Criteria
An RBI assessment will determine the risk associated with the items assessed. The RBI team and management may wish to judge whether the individual equipment item and cumulative risks are acceptable. Establishing risk criteria to judge acceptability of risk could be an objective of the RBI assessment if such criteria do not exist already within the user’s company.
7.2.4 Management of Risks
When the risks are identified, inspection actions and/or other mitigation that have a positive effect in reducing risk to an acceptable level may be undertaken. These actions may be significantly different from the inspection actions undertaken during a statutory or certification type inspection program. The results of managing and reducing risk are improved safety, avoided losses of containment, and avoided commercial losses.
7.2.5 Reduce Costs
Reducing inspection costs is usually not the primary objective of an RBI assessment, but it is frequently a side effect of optimization. When the inspection program is optimized based on an understanding of risk, one or more of the following cost reduction benefits may be realized:
a) ineffective, unnecessary or inappropriate inspection activities may be eliminated;
b) inspection of low-risk items may be eliminated or reduced;
c) on-line or noninvasive inspection methods may be substituted for invasive methods that require equipment shutdown;
d) more effective infrequent inspections may be substituted for less effective frequent inspections.
7.2.6 Meet Safety and Environmental Management Requirements
Managing risks by using RBI assessment can be useful in implementing an effective inspection program that meets performance-based safety and environmental requirements. RBI focuses efforts on areas where the greatest risks exist. RBI provides a systematic method to guide a user in the selection of equipment items to be included and the frequency, scope, and extent of inspection activities to be conducted to meet performance objectives.
Copyright American Petroleum Institute Provided by IHS under license with API
Not for ResaleNo reproduction or networking permitted without license from IHS
--`,,```,,,,````-`-`,,`,,`,`,,`---
//^:^^#^~^^"~~:~"~$$"~$^"#:*~:^#~#~^~@~:^:#*:^$:$~:*"\\

RISK-BASED INSPECTION 27
7.2.7 Identify Mitigation Alternatives
The RBI assessment may identify risks that may be managed by actions other than inspection. Some of these mitigation actions may include but are not limited to:
a) modification of the process to eliminate conditions driving the risk;
b) modification of operating procedures to avoid situations driving the risk;
c) chemical treatment of the process to reduce deterioration rates/susceptibilities;
d) change metallurgy of components to reduce POF;
e) removal of unnecessary insulation to reduce probability of corrosion under insulation;
f) reduce or limit available inventories to reduce COF;
g) upgrade safety, detection or loss limiting systems;
h) change process fluids to less flammable or toxic fluids;
i) change component design to reduce POF;
j) process control and adherence to IOWs.
The data within the RBI assessment can be useful in determining the optimum economic strategy to reduce risk. The strategy may be different at different times in a plant’s life cycle. For example, it is usually more economical to modify the process or change metallurgy when a plant is being designed than when it is operating.
7.2.8 New Project Risk Assessment
An RBI assessment made on new equipment or a new project, while in the design stage, may yield important information on potential risks. This may allow potential risks to be minimized by design and have a risk-based inspection plan in place prior to actual installation.
7.2.9 Facilities End of Life Strategies
Facilities approaching the end of their economic or operating service life are a special case where application of RBI can be very useful. The end of life case for plant operation is about gaining the maximum remaining economic benefit from an asset without undue personnel, environmental or financial risk.
End of life strategies focus the inspection efforts directly on high-risk areas where the inspections will provide a reduction of risk during the remaining life of the plant. Inspection activities that do not impact risk during the remaining life are usually eliminated or reduced.
End of life inspection RBI strategies may be developed in association with a Fitness-For-Service assessment of damaged components using methods described in API 579-1/ASME FFS-1.
It is important to revisit the RBI assessment if the remaining plant life is extended after the remaining life strategy has been developed and implemented.
Copyright American Petroleum Institute Provided by IHS under license with API
Not for ResaleNo reproduction or networking permitted without license from IHS
--`,,```,,,,````-`-`,,`,,`,`,,`---
//^:^^#^~^^"~~:~"~$$"~$^"#:*~:^#~#~^~@~:^:#*:^$:$~:*"\\

28 API RECOMMENDED PRACTICE 580
7.3 Initial Screening
7.3.1 General
The screening process focuses the analysis on the most important group of equipment items so that time and resources are more effectively utilized.
7.3.2 Establish Physical Boundaries of an RBI Assessment
Boundaries for physical assets included in the assessment are established consistent with the overall objectives. The level of data to be reviewed and the resources available to accomplish the objectives directly impact the extent of physical assets that can be assessed.
The scope of an RBI assessment may vary between an entire refinery or plant and a single component within a single piece of equipment. Typically, RBI is done on multiple pieces of equipment (e.g. an entire process unit) rather than on a single component.
7.3.3 Facilities Screening
At the facility level, RBI may be applied to all types of plants including but not limited to:
a) oil and gas production facilities,
b) oil and gas processing and transportation terminals,
c) refineries,
d) petrochemical and chemical plants,
e) pipelines and pipeline stations,
f) liquified natural gas plants.
Screening at the facility level may be done by a simplified qualitative RBI assessment. Screening at the facility level could also be done by:
a) asset or product value,
b) history of problems/failures at each facility,
c) PSM/non-PSM facilities,
d) age of facilities,
e) proximity to the public,
f) proximity to environmentally sensitive areas.
Examples of key questions to answer at the facility level are listed as follows.
a) Is the facility located in a regulatory jurisdiction that will accept modifications to statutory inspection intervals based on RBI?
b) Is the management of the facility willing to invest in the resources necessary to achieve the benefits of RBI?
Copyright American Petroleum Institute Provided by IHS under license with API
Not for ResaleNo reproduction or networking permitted without license from IHS
--`,,```,,,,````-`-`,,`,,`,`,,`---
//^:^^#^~^^"~~:~"~$$"~$^"#:*~:^#~#~^~@~:^:#*:^$:$~:*"\\

RISK-BASED INSPECTION 29
c) Does the facility have sufficient resources and expertise available to conduct the RBI assessment?
7.3.4 Process Units Screening
If the scope of the RBI assessment is a multi-unit facility, the first step in the application of RBI is screening of entire process units to rank relative risk. The screening points out areas that are higher in priority and suggests which process units to begin with. It also provides insight about the level of assessment that may be required for operating systems and equipment items in the various units.
Priorities may be assigned based on one of the following:
a) relative risk of the process units,
b) relative economic impact of the process units,
c) relative COF of the process units,
d) relative reliability of the process units,
e) turnaround schedule,
f) experience with similar process units.
Examples of key questions to answer at the process unit level are similar to the questions at the facility level.
a) Does the process unit have a significant impact on the operation of the facility?
b) Are there significant risks involved in the operation of the process unit and would the effect of risk reduction be measurable?
c) Do process unit operators see that some benefit may be gained through the application of RBI?
d) Does the process unit have sufficient resources and expertise available to conduct the RBI assessment?
e) What is the failure history in this unit?
7.3.5 Systems within Process Unit Screening
It is often advantageous to group equipment within a process unit into systems, loops, or circuits where common environmental operating conditions exist based on process chemistry, pressure and temperature, metallurgy, equipment design and operating history. By dividing a process unit into systems, the equipment can be screened together saving time compared to treating each piece of equipment separately. In case the risks of each piece of equipment in the system show a common sensitivity to changes in process conditions, then a screening can establish one single IOW with common variables and ranges for the entire system.
Block flow or process flow diagrams for the unit may be used to identify the systems including information about metallurgy, process conditions, credible damage mechanisms and historical problems.
When a process unit is identified for an RBI assessment and overall optimization is the goal, it is usually best to include all systems within the unit. Practical considerations such as resource availability may require that the RBI assessment is limited to one or more systems within the unit. Selection of systems may be based on the following:
a) relative risk of the systems,
Copyright American Petroleum Institute Provided by IHS under license with API
Not for ResaleNo reproduction or networking permitted without license from IHS
--`,,```,,,,````-`-`,,`,,`,`,,`---
//^:^^#^~^^"~~:~"~$$"~$^"#:*~:^#~#~^~@~:^:#*:^$:$~:*"\\

30 API RECOMMENDED PRACTICE 580
b) relative COF of systems,
c) relative reliability of systems,
d) expected benefit from applying RBI to a system,
e) sensitivities of risk to changes in process conditions.
7.3.6 Equipment Item Screening
In most plants, a large percentage of the total unit risk will be concentrated in a relatively small percentage of the equipment items. These potential high-risk items should receive greater attention in the risk assessment. Screening of equipment items is sometimes conducted to identify the higher risk items to carry forward to more detailed risk assessment.
An RBI assessment may be applied to all pressure containing equipment such as:
a) piping,
b) pressure vessels,
c) reactors,
d) heat exchangers,
e) furnaces and boilers,
f) tanks,
g) pumps (pressure boundary),
h) compressors (pressure boundary),
i) pressure-relief devices,
j) control valves (pressure boundary).
Selection of equipment types to be included is based on meeting the objectives discussed in 7.2. The following issues may be considered in screening the equipment to be included.
a) Will the integrity of safeguard equipment be compromised by damage mechanisms?
b) Which types of equipment have had the most reliability problems?
c) Which pieces of equipment have the highest COF if there is a pressure boundary failure?
d) Which pieces of equipment are subject to the most deterioration that could affect pressure boundary containment?
e) Which pieces of equipment have lower design safety margins and/or lower corrosion allowances that may affect pressure boundary containment considerations?
Copyright American Petroleum Institute Provided by IHS under license with API
Not for ResaleNo reproduction or networking permitted without license from IHS
--`,,```,,,,````-`-`,,`,,`,`,,`---
//^:^
^#^~
^^"~
~:~"
~$$"
~$^"
#:*~
:^#~
#~^~
@~:
^:#*
:^$:
$~:*
"\\

RISK-BASED INSPECTION 31
7.3.7 Utilities, Emergency and Off-plot Systems
Whether or not utilities, emergency and off-plot systems should be included depends on the planned use of the RBI assessment and the current inspection requirements of the facility. Possible reasons for inclusion of off-plot and utilities are listed below as follows.
a) The RBI assessment is being done for an overall optimization of inspection resources and environmental and business COF are included.
b) There is a specific reliability problem in a utility system. An example would be a cooling water system with corrosion and fouling problems. An RBI approach could assist in developing the most effective combination of inspection, mitigation, monitoring, and treatment for the entire facility.
c) Reliability of the process unit is a major objective of the RBI analysis.
When emergency systems (e.g. flare systems, emergency shutdown systems) are included in the RBI assessment, their service conditions during both routine operations and upset should be considered.
7.4 Establish Operating Boundaries
7.4.1 General
Similar to physical boundaries, operating boundaries for the RBI study are established consistent with the study objectives, level of data to be reviewed and resources. The purpose of establishing operational boundaries is to identify key process parameters that may impact deterioration. The RBI assessment normally includes review of both POF and COF for normal operating conditions. Start-up and shutdown conditions as well as emergency and non-routine conditions should also be reviewed for their potential effect on POF and COF.
The operating conditions, including any sensitivity analysis, used for the RBI assessment should be recorded as the operating limits for the assessment.
Operating within the boundaries is fundamental to the validity of the RBI study as well as good operating practice. It is vital to establish and monitor key process parameters that may affect equipment integrity to determine whether operations are maintained within boundaries (i.e. IOWs).
7.4.2 Start-up and Shutdown
Process conditions during start-up and shutdown can have a significant effect on the risk of a plant especially when they are more severe (likely to cause accelerated deterioration) than normal conditions, and as such should be considered for all equipment covered by the RBI assessment. A good example is polythionic acid stress corrosion cracking (PTASCC). The POF for susceptible equipment is controlled by whether mitigation measures are applied during shutdown procedures to avoid PTASCC. Start-up lines are often included within the process piping and their service conditions during start-up and subsequent operation should be considered.
7.4.3 Normal, Upset, and Cyclic Operation
The normal operating conditions may be most easily provided if there is a process flow model or mass balance available for the plant or process unit. However, the normal operating conditions found on documentation should be verified by unit operations personnel as it is not uncommon to find discrepancies between design and operating conditions that could impact the RBI results substantially. The following data should be provided:
a) operating temperature and pressure including variation ranges,
b) process fluid composition including variation with feed composition ranges,
Copyright American Petroleum Institute Provided by IHS under license with API
Not for ResaleNo reproduction or networking permitted without license from IHS
--`,,```,,,,````-`-`,,`,,`,`,,`---
//^:^^#^~^^"~~:~"~$$"~$^"#:*~:^#~#~^~@~:^:#*:^$:$~:*"\\

32 API RECOMMENDED PRACTICE 580
c) flow rates including variation ranges,
d) presence of moisture or other contaminant species.
Changes in the process, such as pressure, temperature or fluid composition, resulting from unit abnormal or upset conditions should be considered in the RBI assessment.
The RBI assessment on systems with cyclic operation, such as reactor regeneration systems, should consider the complete cyclic range of conditions. Cyclic or intermittent conditions could impact the POF due to some damage mechanisms (e.g. mechanical fatigue, thermal fatigue, corrosion-fatigue, and corrosion under insulation). Examples include pressure swing absorbtion vessels, catalytic reforming unit regeneration piping systems, deaerator vessels, and insulated equipment that normally operates at higher temperatures but is subjected to periods of inactivity.
7.4.4 Operating Time Period
The unit run lengths of the selected process units/equipment is an important limit to consider. The RBI assessment may include the entire operational life, or may be for a selected period. For example, process units are occasionally shut down for maintenance activities and the associated run length may depend on the condition of the equipment in the unit. An RBI analysis may focus on the current run period or may include the current and next-projected run period. The time period may also influence the types of decisions and inspection plans that result from the study, such as inspection, repair, replace, operating, and so on. Projected operational changes are also important as part of the basis for the operational time period.
7.5 Selecting a Type of RBI Assessment
Selection of the type of RBI assessment will be dependent on a variety of factors, such as:
a) is the assessment at a facility, process unit, system, equipment item, or component level;
b) objective of the assessment;
c) availability and quality of data;
d) resource availability;
e) perceived or previously evaluated risks;
f) time constraints.
A strategy should be developed, matching the type of assessment to the expected or evaluated risk. For example, processing units that are expected to have lower risk may only require simple, fairly conservative methods to adequately accomplish the RBI objectives. Whereas, process units which have a higher expected risk may require more detailed methods. Another example would be to evaluate all equipment items in a process unit qualitatively and then evaluate the higher risk items identified more quantitatively. See 6.3 for more on types of RBI assessment.
7.6 Estimating Resources and Time Required
The resources and time required to implement an RBI assessment will vary widely between organizations depending on a number of factors including:
a) implementation strategy/plans,
b) knowledge and training of implementers,
Copyright American Petroleum Institute Provided by IHS under license with API
Not for ResaleNo reproduction or networking permitted without license from IHS
--`,,```,,,,````-`-`,,`,,`,`,,`---
//^:^
^#^~
^^"~
~:~"
~$$"
~$^"
#:*~
:^#~
#~^~
@~:
^:#*
:^$:
$~:*
"\\

RISK-BASED INSPECTION 33
c) availability and quality of necessary data and information,
d) availability and cost of resources needed for implementation,
e) amount of equipment included in each level of RBI analysis,
f) degree of complexity of RBI analysis selected,
g) degree of precision required.
The estimate of scope and cost involved in completing an RBI assessment might include the following:
a) number of facilities, units, equipment items, and components to be evaluated;
b) time and resources required to gather data for the items to be evaluated;
c) training time for implementers;
d) time and resources required for RBI assessment of data and information;
e) time and resources to evaluate RBI assessment results and develop inspection, maintenance, and mitigation plans.
8 Data and Information Collection for RBI Assessment
8.1 General
Utilizing the objectives, boundaries, level of approach and resources identified in Section 7, the objective of this section is to provide an overview of the data that may be necessary to develop an RBI plan.
The data collected will provide the information needed to assess potential damage mechanisms, potential failure modes and scenarios of failure that are discussed in Section 9. Additionally, it will provide much of the data used in Section 10 to assess probabilities, the data used in Section 11 to assess consequences and data used in Section 13 to assist in inspection planning.
Examples of data sources include:
a) design and construction records;
b) inspection and maintenance records;
c) operating and process technology records;
d) hazards analysis and MOC records;
e) materials selection records; corrosion engineering records and library/database;
f) cost and project engineering records.
The precision of the data should be consistent with the RBI method used. The individual or team should understand the precision of the data needed for the analysis before gathering it. It may be advantageous to combine risk analysis data gathering with other risk/hazard analysis data gathering (see 6.7) as much of the data may be the same.
Copyright American Petroleum Institute Provided by IHS under license with API
Not for ResaleNo reproduction or networking permitted without license from IHS
--`,,```,,,,````-`-`,,`,,`,`,,`---
//^:^^#^~^^"~~:~"~$$"~$^"#:*~:^#~#~^~@~:^:#*:^$:$~:*"\\

34 API RECOMMENDED PRACTICE 580
8.2 RBI Data Needs
An RBI study may use a qualitative, semi-quantitative and/or quantitative approach (see 6.3). A fundamental difference among these approaches is the amount and detail of input, calculations and output.
For each RBI approach it is important to document all bases for the study and assumptions from the onset and to apply a consistent rationale. Any deviations from prescribed, standard procedures should be documented. Documentation of unique equipment and piping identifiers is a good starting point for any level of study. The equipment should also correspond to a unique group or location such as a particular process unit at a particular plant site.
Typical data needed for an RBI analysis may include but is not limited to:
a) type of equipment;
b) materials of construction;
c) inspection, repair and replacement records;
d) process fluid compositions;
e) inventory of fluids;
f) operating conditions;
g) safety systems;
h) detection systems;
i) damage mechanisms, rates, and severity;
j) personnel densities;
k) coating, cladding, and insulation data;
l) business interruption cost;
m) equipment replacement costs;
n) environmental remediation costs.
8.2.1 Data Needs for Qualitative RBI
A more qualitative approach typically does not require all of the data mentioned in 8.2. Further, items required only need to be categorized into broad ranges or classified versus a reference point. It is important to establish a set of rules to assure consistency in categorization or classification.
Generally, a qualitative analysis using broad ranges requires a higher level of judgment, skill and understanding from the user than a more quantitative approach. Ranges and summary fields may evaluate circumstances with widely varying conditions requiring the user to carefully consider the impact of input on risk results. Therefore, despite its simplicity, it is important to have knowledgeable and skilled persons perform the qualitative RBI analysis.
Copyright American Petroleum Institute Provided by IHS under license with API
Not for ResaleNo reproduction or networking permitted without license from IHS
--`,,```,,,,````-`-`,,`,,`,`,,`---
//^:^^#^~^^"~~:~"~$$"~$^"#:*~:^#~#~^~@~:^:#*:^$:$~:*"\\
RISK-BASED INSPECTION 35
8.2.2 Data Needs for Quantitative RBI
QRA uses logic models depicting combinations of events that could result in severe accidents and physical models depicting the progression of accidents and the transport of a hazardous material to the environment. The models are evaluated probabilistically to provide both qualitative and quantitative insights about the level of risk and to identify the design, site, or operational characteristics that are the most important to risk. Hence, more detailed information and data are needed for a fully quantitative RBI in order to provide input for the models.
8.2.3 Data Needs for Semi-quantitative RBI
The semi-quantitative analysis typically requires the same type of data as a quantitative analysis but generally not as detailed. For example, the fluid volumes may be estimated. Although the precision of the analysis may be less, the time required for data gathering and analysis will be less too; however that does not mean that the analysis will be less accurate (see 6.4).
8.3 Data Quality
The data quality has a direct relation to the relative accuracy of the RBI analysis. Although the data requirements are quite different for the various types of RBI analysis, quality of input data is equally important no matter what approach to RBI is selected. It is beneficial to the accuracy and quality of an RBI analysis to assure that the data input are up to date and validated by knowledgeable persons (see Section 16).
As is true in any inspection program, data validation is essential for a number of reasons. Among the reasons for inspection data quality errors are:
a) outdated drawings and documentation,
b) inspection error,
c) clerical and data transcription errors,
d) measurement equipment accuracy.
Another potential source of scatter and error in the analysis is assumptions on equipment history. For example if baseline inspections were not performed or documented, nominal thickness may be used for the original thickness. This assumption can significantly impact the calculated corrosion rate early in the equipment life. The effect may be to mask a high corrosion rate or to inflate a low corrosion rate. A similar situation exists when the remaining life of a piece of equipment with a low corrosion rate requires inspection more frequently. The measurement error may result in the calculated corrosion rate appearing artificially high or low. It is important that those making assumptions understand the potential impact of their assumptions on the risk calculation.
This validation step stresses the need for a knowledgeable individual comparing data from the inspections to the expected damage mechanism and rates. This person may also compare the results with previous measurements on that system, similar systems at the site or within the company or published data. Statistics may be useful in this review. This review should also factor in any changes or upsets in the process. As mentioned previously, this data validation step is necessary for the quality of any inspection program, not just RBI. Unfortunately, when this data validation step has not been a priority before RBI, the time required to do it gets included with the time and resources necessary to do a good job on RBI, leaving the wrong impression with some managers believing that RBI is more time consuming and expensive than it should be.
Copyright American Petroleum Institute Provided by IHS under license with API
Not for ResaleNo reproduction or networking permitted without license from IHS
--`,,```,,,,````-`-`,,`,,`,`,,`---
//^:^
^#^~
^^"~
~:~"
~$$"
~$^"
#:*~
:^#~
#~^~
@~:
^:#*
:^$:
$~:*
"\\

36 API RECOMMENDED PRACTICE 580
8.4 Codes and Standards—National and International
In the data collection stage, an assessment of what codes and standards are currently in use for in-service inspection and evaluation, or were in use during the equipment design, is generally necessary. The selection and type of codes and standards used by a facility can have a significant impact on RBI results.
8.5 Sources of Site-specific Data and Information
Information for RBI can be found in many places within a facility. It is important to stress that the precision of the data should match the complexity of the RBI method used (see 6.4). The risk analysis and RBI team should understand the sensitivity of the data needed for the program before gathering any data. It may be advantageous to combine RBI data gathering with other risk/hazard analysis data gathering (e.g. PHA, RCM, QRA) as much of the data overlaps.
Potential sources of specific information include but are not limited to:
a) design and construction records/drawings:
— P&IDs, process flow diagrams, material selection diagrams (MSDs), etc.,
— piping isometric drawings,
— engineering specification sheets,
— materials of construction records,
— construction QA/QC records,
— codes and standards used,
— protective instrument systems,
— leak detection and monitoring systems,
— isolation systems,
— inventory records
— emergency depressurizing and relief systems,
— safety systems,
— fire-proofing and fire-fighting systems,
— layout;
b) inspection records:
— schedules and frequency,
— amount and types of inspection,
— repairs and alterations,
Copyright American Petroleum Institute Provided by IHS under license with API
Not for ResaleNo reproduction or networking permitted without license from IHS
--`,,```,,,,````-`-`,,`,,`,`,,`---
//^:^
^#^~
^^"~
~:~"
~$$"
~$^"
#:*~
:^#~
#~^~
@~:
^:#*
:^$:
$~:*
"\\

RISK-BASED INSPECTION 37
— positive material identification (PMI) records,
— inspection results;
c) process data,
— fluid composition analysis including contaminants or trace components,
— distributed control system data,
— operating procedures,
— start-up and shutdown procedures,
— emergency procedures,
— operating logs and process records,
— PSM, PHA, RCM, and QRA data or reports;
d) MOC records;
e) off-site data and information—if consequence may affect off-site areas;
f) failure data:
— generic failure frequency data-industry or in-house,
— industry specific failure data,
— plant and equipment specific failure data,
— reliability and condition monitoring records,
— leak data;
g) site conditions:
— climate/weather records,
— seismic activity records;
h) equipment replacement costs:
— project cost reports,
— industry databases;
Copyright American Petroleum Institute Provided by IHS under license with API
Not for ResaleNo reproduction or networking permitted without license from IHS
--`,,```,,,,````-`-`,,`,,`,`,,`---
//^:^
^#^~
^^"~
~:~"
~$$"
~$^"
#:*~
:^#~
#~^~
@~:
^:#*
:^$:
$~:*
"\\

38 API RECOMMENDED PRACTICE 580
i) hazards data:
— PSM studies,
— PHA studies,
— QRA studies,
— other site specific risk or hazard studies;
j) incident investigations.
9 Damage Mechanisms and Failure Modes
9.1 Introduction
This section provides guidance in identifying credible damage mechanisms and failure modes of pressure boundary metallic components that should be included in an RBI analysis. Guidance is also provided in other documents. Damage mechanisms in the hydrocarbon process industry are addressed in API 571. ASME PCC-3 also has some useful information and appendices on damage mechanisms. See 16.2.4 for the type of person with knowledge in materials and corrosion that should be involved in the process.
Damage mechanisms include corrosion, cracking, mechanical and metallurgical damage. Understanding damage mechanisms is important for:
a) the analysis of the POF;
b) the selection of appropriate inspection intervals/due dates, locations and techniques;
c) the ability to make decisions (e.g. modifications to process, materials selection, monitoring, etc.) that can eliminate or reduce the probability of a specific damage mechanism.
Failure modes identify how the damaged component will fail (e.g. by leakage or by rupture). Understanding failure modes is important for three reasons:
a) the analysis of the COF,
b) the ability to make run-or-repair decisions,
c) the selection of repair techniques.
9.1.1 Identification of Damage Mechanisms
Identification of the credible damage 6 mechanisms and failure modes for equipment included in a risk analysis is essential to the quality and the effectiveness of the risk analysis. The RBI team should consult with a corrosion specialist to define the equipment damage mechanisms, damage modes (optional), and potential failure modes. A sequential approach is as follows.
a) As indicated in Section 7, identify the internal and external operating and environmental conditions, age, design and operational loading. Data used and assumptions made should be validated and documented. Process
6 Deterioration or degradation is sometimes used as a synonym for damage. However, damage mechanism is used throughout this document for consistency. The term “aging mechanism” is used in some industries to identify a subset of mechanisms that are dependent upon long term exposure at specific temperatures or cyclic stresses.
Copyright American Petroleum Institute Provided by IHS under license with API
Not for ResaleNo reproduction or networking permitted without license from IHS
--`,,```,,,,````-`-`,,`,,`,`,,`---
//^:^^#^~^^"~~:~"~$$"~$^"#:*~:^#~#~^~@~:^:#*:^$:$~:*"\\

RISK-BASED INSPECTION 39
conditions as well as anticipated process changes should be considered. Identifying trace constituents (ppm) in addition to the primary constituents in a process can be very important as trace constituents can have a significant affect on the damage mechanisms.
b) Considering the materials, methods and details of fabrication, develop a list of the credible damage mechanisms that may have been present in past operation, be presently active, or may become active.
c) Under certain circumstances it may be preferable to list a specific damage mechanism and then list the various damage modes or ways that the damage mechanism may manifest itself. For example, the damage mechanism “corrosion under insulation” may precipitate a damage mode of either generalized corrosion or localized corrosion. Generalized corrosion could result in a large burst while localized corrosion might be more likely to result in a pinhole type leak. All credible failure modes for each damage mechanism or damage mode should be considered.
d) It is often possible to have two or more damage mechanisms at work on the same piece of equipment or piping component at the same time. An example of this could be stress corrosion cracking in combination with generalized or localized corrosion (thinning or pitting).
9.2 Damage Mechanisms
Understanding equipment operation and the interaction with the process environment (both internal and external) and mechanical environment is key to identifying damage mechanisms. Process specialists can provide useful input (such as the spectrum of process conditions, injection points etc.) to aid corrosion specialists in the identification of credible damage mechanisms and rates. For example, understanding that localized thinning may be caused by the method of fluid injection and agitation may be as important as knowing the corrosion mechanism.
9.3 Failure Modes
Once a credible damage mechanism(s) has been identified, the associated failure mode should also be identified. For example, local thinning could lead to a pinhole leak in the pressure containing boundary. There may be more than one credible failure mode for each damage mechanism. For example, cracking could lead to a through-wall crack with a leak before break scenario or could lead to a catastrophic rupture. The failure mode will depend on the type of cracking, the geometric orientation of the cracking, the properties of the material of construction, the component thickness, the temperature, and the stress level. Examples of failure modes include:
a) pinhole leak,
b) small to moderate leak,
c) large leak,
d) ductile rupture,
e) brittle fracture.
The risk analysis may, at the discretion of the owner, also include failures other than loss of containment, such as loss of function, tray damage, demister pad failures, coalescer element failures, liquid distribution hardware failures, and heat exchanger tube leaks.
Copyright American Petroleum Institute Provided by IHS under license with API
Not for ResaleNo reproduction or networking permitted without license from IHS
--`,,```,,,,````-`-`,,`,,`,`,,`---
//^:^^#^~^^"~~:~"~$$"~$^"#:*~:^#~#~^~@~:^:#*:^$:$~:*"\\

40 API RECOMMENDED PRACTICE 580
9.4 Accumulated Damage
Damage rates may vary as damage mechanisms progress (i.e. various mechanisms may accelerate or slow or stop completely). In some cases, damage by one mechanism may progress to a point at which a different mechanism takes over and begins to dominate the rate of damage.
An evaluation of damage mechanisms and failure modes should include the cumulative effect of each mechanism and/or mode.
9.5 Tabulating Results
The results of a damage mechanisms and failure modes analysis for RBI should indicate:
a) a list of credible damage mechanism(s):
— example: external corrosion;
b) a list of credible damage mode(s) resulting from the damage mechanisms(s) in 9.5 a):
— example 1: localized thinning,
— example 2: general thinning;
NOTE This step is optional. Failure modes may be determined directly without this intermediate step if desired.
c) a ranking of credible failure mode(s) resulting from the damage mode(s) in 9.5 a) and 9.5 b):
1) example 1: localized thinning:
— failure mode 1: pinhole leak,
— failure mode 2: small leak;
2) example 2: general thinning:
— failure mode 1: pinhole leak,
— failure mode 2: small leak,
— failure mode 3: large leak,
— failure mode 4: rupture.
10 Assessing Probability of Failure (POF)
10.1 Introduction to Probability Analysis
The probability analysis in an RBI program is performed to estimate the probability of a specific adverse consequence resulting from a loss of containment that occurs due to a damage mechanism(s). The probability that a specific consequence will occur is the product of the POF and the probability of the scenario under consideration assuming that the failure has occurred. This section provides guidance only on determining the POF. Guidance on determining the probability of specific consequences is provided in Section 12.
Copyright American Petroleum Institute Provided by IHS under license with API
Not for ResaleNo reproduction or networking permitted without license from IHS
--`,,```,,,,````-`-`,,`,,`,`,,`---
//^:^^#^~^^"~~:~"~$$"~$^"#:*~:^#~#~^~@~:^:#*:^$:$~:*"\\

RISK-BASED INSPECTION 41
The POF analysis should address all damage mechanisms to which the equipment being studied is or can be susceptible. Further, it should address the situation where equipment is or can be susceptible to multiple damage mechanisms (e.g. thinning and creep). The analysis should be credible, repeatable and documented.
It should be noted that damage mechanisms are not the only causes of loss of containment. Other causes of loss of containment could include but are not limited to:
a) seismic activity,
b) weather extremes,
c) overpressure due to pressure-relief device failure,
d) operator error,
e) inadvertent substitution of materials of construction,
f) design error,
g) sabotage.
These and other causes of loss of containment may have an impact on the POF and may be (but typically are not) included in the POF analysis for RBI.
10.2 Units of Measure in the POF Analysis
POF is typically expressed in terms of frequency. Frequency is expressed as a number of events occurring during a specific time frame. For probability analysis, the time frame is typically expressed as a fixed interval (e.g. one year) and the frequency is expressed as events per interval (e.g. 0.0002 failures per year). The time frame may also be expressed as an occasion (e.g. one run length) and the frequency would be events per occasion (e.g. 0.03 failures per run). For a qualitative analysis, the POF may be categorized (e.g. high, medium and low, or one through five). However, even in this case, it is appropriate to associate an event frequency with each probability category to provide guidance to the individuals who are responsible for determining the probability. If this is done, the change from one category to the next could be one or more orders of magnitude or other appropriate demarcations that will provide adequate discrimination.
Two examples of this are listed in Table 1 and Table 2.
10.3 Types of Probability Analysis
10.3.1 General
The following paragraphs discuss different approaches to the determination of probability. For the purposes of the discussion, these approaches have been categorized as “qualitative” or “quantitative.” However, it should be recognized that “qualitative” and “quantitative” are the end points of a continuum rather than distinctive approaches (see Figure 3). Most probability assessments use a blend of qualitative and quantitative approaches.
Table 1—Three Levels of POF
Possible Qualitative Rank Annual Failure Probability or Frequency
Low <0.0001
Moderate 0.0001 to 0.01
High >0.01
Copyright American Petroleum Institute Provided by IHS under license with API
Not for ResaleNo reproduction or networking permitted without license from IHS
--`,,```,,,,````-`-`,,`,,`,`,,`---
//^:^
^#^~
^^"~
~:~"
~$$"
~$^"
#:*~
:^#~
#~^~
@~:
^:#*
:^$:
$~:*
"\\
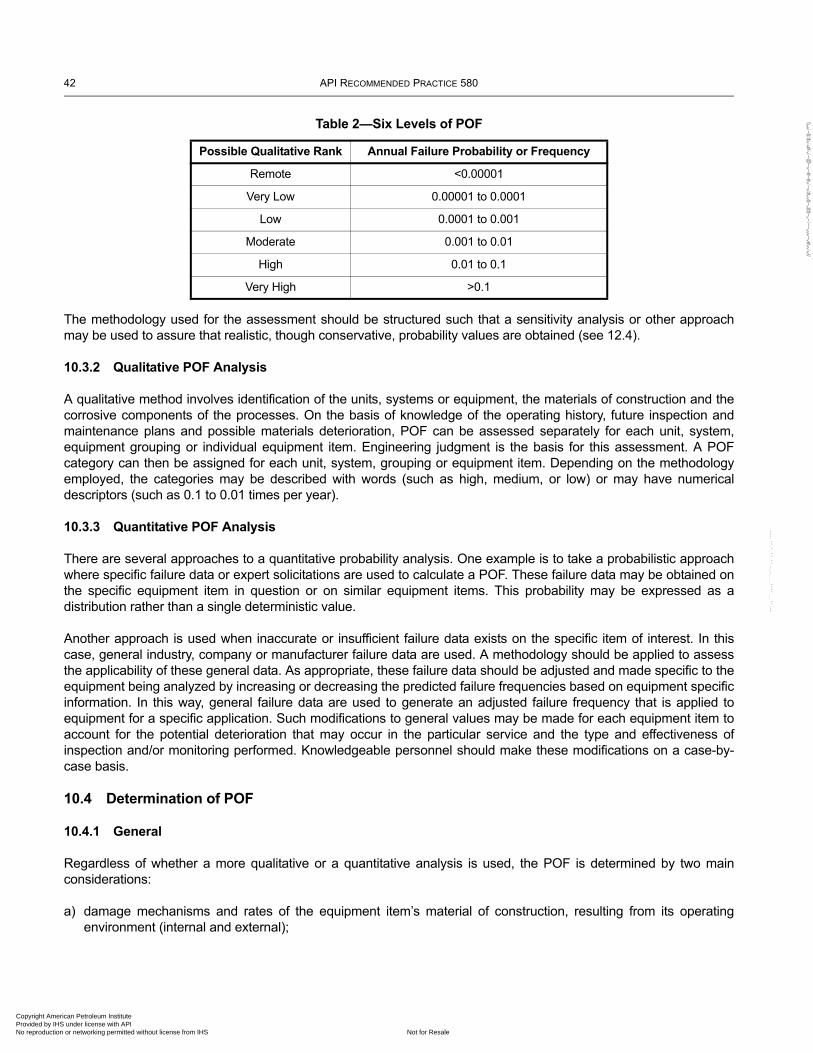
42 API RECOMMENDED PRACTICE 580
The methodology used for the assessment should be structured such that a sensitivity analysis or other approach may be used to assure that realistic, though conservative, probability values are obtained (see 12.4).
10.3.2 Qualitative POF Analysis
A qualitative method involves identification of the units, systems or equipment, the materials of construction and the corrosive components of the processes. On the basis of knowledge of the operating history, future inspection and maintenance plans and possible materials deterioration, POF can be assessed separately for each unit, system, equipment grouping or individual equipment item. Engineering judgment is the basis for this assessment. A POF category can then be assigned for each unit, system, grouping or equipment item. Depending on the methodology employed, the categories may be described with words (such as high, medium, or low) or may have numerical descriptors (such as 0.1 to 0.01 times per year).
10.3.3 Quantitative POF Analysis
There are several approaches to a quantitative probability analysis. One example is to take a probabilistic approach where specific failure data or expert solicitations are used to calculate a POF. These failure data may be obtained on the specific equipment item in question or on similar equipment items. This probability may be expressed as a distribution rather than a single deterministic value.
Another approach is used when inaccurate or insufficient failure data exists on the specific item of interest. In this case, general industry, company or manufacturer failure data are used. A methodology should be applied to assess the applicability of these general data. As appropriate, these failure data should be adjusted and made specific to the equipment being analyzed by increasing or decreasing the predicted failure frequencies based on equipment specific information. In this way, general failure data are used to generate an adjusted failure frequency that is applied to equipment for a specific application. Such modifications to general values may be made for each equipment item to account for the potential deterioration that may occur in the particular service and the type and effectiveness of inspection and/or monitoring performed. Knowledgeable personnel should make these modifications on a case-by-case basis.
10.4 Determination of POF
10.4.1 General
Regardless of whether a more qualitative or a quantitative analysis is used, the POF is determined by two main considerations:
a) damage mechanisms and rates of the equipment item’s material of construction, resulting from its operating environment (internal and external);
Table 2—Six Levels of POF
Possible Qualitative Rank Annual Failure Probability or Frequency
Remote <0.00001
Very Low 0.00001 to 0.0001
Low 0.0001 to 0.001
Moderate 0.001 to 0.01
High 0.01 to 0.1
Very High >0.1
Copyright American Petroleum Institute Provided by IHS under license with API
Not for ResaleNo reproduction or networking permitted without license from IHS
--`,,```,,,,````-`-`,,`,,`,`,,`---
//^:^
^#^~
^^"~
~:~"
~$$"
~$^"
#:*~
:^#~
#~^~
@~:
^:#*
:^$:
$~:*
"\\
RISK-BASED INSPECTION 43
b) effectiveness of the inspection program to identify and monitor the damage mechanisms so that the equipment can be repaired or replaced prior to failure.
Analyzing the effect of in-service deterioration and inspection on the POF involves the following steps.
a) Identify active and credible damage mechanisms that are reasonably expected to occur during the time period being considered (considering normal and upset conditions).
b) Determine the deterioration susceptibility and rate. For example, a fatigue crack is driven by cyclic stress; corrosion damage is driven by the temperature, concentration of corrosive, corrosion current, etc. A damage accumulation rule may be available to mathematically model this process. Rather than a given value of the magnitude of the damage mechanism driving forces, a statistical distribution of these forces may be available (see API 579-1/ASME FF2-1).
c) Using a consistent approach, quantify the effectiveness of the past inspection, maintenance and process monitoring program and a proposed future inspection, maintenance and process monitoring program. It is usually necessary to evaluate the POF considering several alternative future inspection and maintenance strategies, possibly including a “no inspection or maintenance” strategy.
d) Determine the probability that with the current condition, continued deterioration at the predicted/expected rate will exceed the damage tolerance of the equipment and result in a failure. The failure mode (e.g. small leak, large leak, equipment rupture) should also be determined based on the damage mechanism. It may be desirable in some cases to determine the probability of more than one failure mode and combine the risks.
10.4.2 Determine the Deterioration Susceptibility and Rate
Combinations of process conditions and materials of construction for each equipment item should be evaluated to identify active and credible damage mechanisms. One method of determining these mechanisms and susceptibility is to group components that have the same material of construction and are exposed to the same internal and external environment. Inspection results from one item in the group can be related to the other equipment in the group.
For many damage mechanisms, the rate of damage progression is generally understood and can be estimated for process plant equipment. Deterioration rate can be expressed in terms of corrosion rate for thinning or susceptibility for mechanisms where the deterioration rate is unknown or immeasurable (such as stress corrosion cracking). Susceptibility is often designated as high, medium or low based on the environmental conditions and material of construction combination. Fabrication variables and repair history are also important.
The deterioration rate in specific process equipment is often not known with certainty. The ability to state the rate of deterioration precisely is affected by equipment complexity, type of damage mechanism, process and metallurgical variations, inaccessibility for inspection, limitations of inspection and test methods and the inspector’s expertise.
Sources of deterioration rate information include (also see Section 8):
a) published data and unpublished company data,
b) laboratory testing,
c) in-situ testing and in-service monitoring,
d) experience with similar equipment,
e) previous inspection data.
Copyright American Petroleum Institute Provided by IHS under license with API
Not for ResaleNo reproduction or networking permitted without license from IHS
--`,,```,,,,````-`-`,,`,,`,`,,`---
//^:^^#^~^^"~~:~"~$$"~$^"#:*~:^#~#~^~@~:^:#*:^$:$~:*"\\

44 API RECOMMENDED PRACTICE 580
The best information will come from operating experiences where the conditions that led to the observed deterioration rate could realistically be expected to occur in the equipment under consideration. Other sources of information could include databases of plant experience or reliance on expert opinion. The latter method is often used since plant databases, where they exist, sometimes do not contain sufficiently detailed information.
Damage rates will often vary as the mechanism progresses. In some cases, the mechanism is self-limiting (i.e. after progressing to a certain point), and damage will nearly arrest. In other cases, damage will occur in a slow, stable manner until it reaches a point where failure occurs. In some cases, damage by one mechanism may progress to a point at which a different mechanism takes over to control the rate of further damage (e.g. pitting that gives rise to stress corrosion cracking).
The following parameters should be considered in the determination of damage rates:
a) fluid stream composition, including electrolytes and ions in solution;
b) the temperature, humidity and corrosiveness of the atmosphere or soil;
c) process temperature;
d) the flow velocity;
e) the amount of dissolved oxygen;
f) the phase of the fluid (liquid, vapor, or gas);
g) the pH of the solution;
h) the contaminants in the flow stream;
i) the process operating phase (operation, shutdown, wash, etc.);
j) the mechanical properties of the metal (hardness, cold work, grain size, etc.);
k) the metallurgical properties and corrosion resistance of the alloy;
l) the weld properties: heat treatment, hardness, residual stresses, sensitization, inclusions, etc.;
m) the component geometry (crevices, local turbulence, etc.);
n) the coating and lining condition (no holiday);
o) the relative size of anodic and cathodic regions;
p) the solubility of corrosion products;
q) the addition of corrosion inhibitors (type, quantity, and distribution);
r) process control and stability.
Copyright American Petroleum Institute Provided by IHS under license with API
Not for ResaleNo reproduction or networking permitted without license from IHS
--`,,```,,,,````-`-`,,`,,`,`,,`---
//^:^^#^~^^"~~:~"~$$"~$^"#:*~:^#~#~^~@~:^:#*:^$:$~:*"\\

RISK-BASED INSPECTION 45
10.4.3 Determine Failure Mode
POF analysis is used to evaluate the failure mode (e.g. small hole, crack, catastrophic rupture) and the probability that each failure mode will occur. It is important to link the damage mechanism to the most likely resulting failure mode. For example:
a) pitting generally leads to small-hole-sized leaks;
b) stress corrosion cracking can develop into small, through wall cracks or, in some cases, catastrophic rupture;
c) metallurgical deterioration and mechanical damage can lead to failure modes that vary from small holes to ruptures;
d) general thinning from corrosion often leads to larger leaks or rupture;
e) localized corrosion can lead to small to medium-sized leaks.
Failure mode primarily affects the magnitude of the consequences. For this and other reasons, the probability and consequence analyses should be worked interactively.
10.4.4 Quantify Effectiveness of Past Inspection Program
Inspection programs [the combination of nondestructive examination (NDE) methods such as visual, UT, radiographic etc., frequency and coverage/location of inspections] vary in their effectiveness for locating, characterizing and sizing deterioration, and thus for determining deterioration rates. After the likely damage mechanisms have been identified, the inspection program should be evaluated to determine the effectiveness in finding the identified mechanisms.
Limitations in the effectiveness of an inspection program could be due to the following items.
a) Lack of coverage of an area subject to deterioration.
b) Inherent limitations of some inspection methods to detect and quantify certain types of deterioration.
c) Selection of inappropriate inspection methods, techniques and tools.
d) Application of methods and tools by inadequately trained inspection personnel.
e) Inadequate inspection and examination procedures.
f) Deterioration rate under some extremes of conditions is so high that failure can occur within a very short time. Even though no deterioration is found during an inspection, failure could still occur as a result of a change or upset in conditions. For example, if a very aggressive acid is carried over from a corrosion resistant part of a system into a downstream vessel that is made of carbon steel, rapid corrosion could result in failure in a few hours or days. Similarly, if an aqueous chloride solution is carried into a stainless steel vessel, chloride stress corrosion cracking could occur very rapidly (depending on the temperature).
If multiple inspections have been performed, it is important to recognize that the most recent inspection may best reflect current operating conditions. If operating conditions have changed, deterioration rates based on inspection data from the previous operating conditions may not be valid.
Determination of inspection effectiveness should consider the following:
a) equipment type;
Copyright American Petroleum Institute Provided by IHS under license with API
Not for ResaleNo reproduction or networking permitted without license from IHS
--`,,```,,,,````-`-`,,`,,`,`,,`---
//^:^
^#^~
^^"~
~:~"
~$$"
~$^"
#:*~
:^#~
#~^~
@~:
^:#*
:^$:
$~:*
"\\

46 API RECOMMENDED PRACTICE 580
b) active and credible damage mechanism(s);
c) rate of deterioration or susceptibility;
d) NDE methods, coverage and frequency (i.e. ability to detect the specific deterioration);
e) accessibility to expected deterioration areas.
The effectiveness of future inspections can be optimized by utilization of NDE methods better suited for the active/credible damage mechanisms, adjusting the inspection coverage, adjusting the inspection frequency or some combination thereof.
10.4.5 Calculate the POF by Deterioration Type
By combining the expected damage mechanism, rate or susceptibility, process monitoring, inspection data and inspection effectiveness, a POF can now be determined for each deterioration type and failure mode. The POF may be determined for future time periods or conditions as well as current. It is important for users to validate that the method used to calculate the POF is in fact thorough and adequate for the users’ needs.
11 Assessing Consequences of Failure
11.1 Introduction to Consequence Analysis
11.1.1 General
The consequence analysis in an RBI program is performed to provide discrimination between equipment items on the basis of the significance of a potential failure. The consequence analysis should be a repeatable, simplified, credible estimate of what might be expected to happen if a failure were to occur in the equipment item being assessed. The COF analysis should be performed to estimate the consequences that occur due to a failure mode typically resulting from an identified damage mechanism(s) (see Section 9). Consequence should typically be categorized as:
a) safety and health impacts,
b) environmental impacts,
c) economic impacts.
In general, an RBI program will be managed by plant inspectors or inspection engineers, who will normally manage risk by managing the POF with inspection and maintenance planning. They will not normally have much ability to modify the COF. On the other hand, management and process safety personnel may desire to manage the consequence side of the risk equation. Numerous methods for modifying the COF are mentioned in Section 14. For all of these users, the consequence analysis is an aid in establishing a relative risk ranking of equipment items. The consequence analysis should address all credible failure modes to which the equipment item is susceptible.
More or less complex and detailed methods of consequence analysis can be used, depending on the desired application for the assessment. The consequence analysis method chosen should have a demonstrated ability to provide the required level of discrimination between higher and lower consequence equipment items.
11.1.2 Loss of Containment
The consequence of loss of containment is generally evaluated as loss of fluid to the external environment. The consequence effects for loss of containment can be generally considered to be in the following categories:
a) safety and health impact,
Copyright American Petroleum Institute Provided by IHS under license with API
Not for ResaleNo reproduction or networking permitted without license from IHS
--`,,```,,,,````-`-`,,`,,`,`,,`---
//^:^
^#^~
^^"~
~:~"
~$$"
~$^"
#:*~
:^#~
#~^~
@~:
^:#*
:^$:
$~:*
"\\

RISK-BASED INSPECTION 47
b) environmental impact,
c) production losses,
d) maintenance and reconstruction costs.
11.1.3 Other Functional Failures
Although RBI is mainly concerned with loss of containment failures, other functional failures could be included in an RBI study if a user desired. Other functional failures could include:
a) functional or mechanical failure of internal components of pressure containing equipment (e.g. column trays, de-mister mats, coalescer elements, distribution hardware, etc.);
b) heat exchanger tube failure;
NOTE There may be situations where a heat exchanger tube failure could lead to a loss of containment of the heat exchanger or ancillary equipment. These would typically involve leakage from a high-pressure side to a low-pressure side of the exchanger and subsequent breach of containment of the low-pressure side.
c) pressure-relief device failure;
d) rotating equipment failure (e.g. seal leaks, impeller failures, etc.).
These other functional failures are usually covered within RCM programs and therefore are not covered in detail in this document.
11.2 Types of Consequence Analysis
11.2.1 General
The following paragraphs discuss different approaches to the determination of consequences of failure. For the purposes of the discussion, these approaches have been categorized as “qualitative” or “quantitative.” However, it should be recognized that “qualitative” and “quantitative” are the end points of a continuum rather than distinctive approaches (see Figure 3).
11.2.2 Qualitative Consequences Analysis
A qualitative method involves identification of the units, systems or equipment, and the hazards present as a result of operating conditions and process fluids. On the basis of expert knowledge and experience, the consequences of failure (safety, health, environmental and financial impacts) can be estimated separately for each unit, system, equipment group or individual equipment item.
For a qualitative method, a consequences category (such as “A” through “E” or “high,” “medium,” or “low”) is typically assigned for each unit, system, grouping or equipment item. It may be appropriate to associate a numerical value, such as cost (see 11.3.3), with each consequence category.
11.2.3 Quantitative Consequences Analysis
A quantitative method involves using a logic model depicting combinations of events to represent the effects of failure on people, property, the business and the environment. Quantitative models usually contain one or more standard failure scenarios or outcomes and calculate COF based on:
a) type of process fluid in equipment;
Copyright American Petroleum Institute Provided by IHS under license with API
Not for ResaleNo reproduction or networking permitted without license from IHS
--`,,```,,,,````-`-`,,`,,`,`,,`---
//^:^
^#^~
^^"~
~:~"
~$$"
~$^"
#:*~
:^#~
#~^~
@~:
^:#*
:^$:
$~:*
"\\

48 API RECOMMENDED PRACTICE 580
b) state of the process fluid inside the equipment (solid, liquid, or gas);
c) key properties of process fluid (molecular weight, boiling point, autoignition temperature, ignition energy, density, flammability, toxicity, etc.);
d) process operating variables such as temperature and pressure;
e) mass of inventory available for release in the event of a leak;
f) failure mode and resulting leak size;
g) state of fluid after release in ambient conditions (solid, gas, or liquid).
Results of a quantitative analysis are usually numeric. Consequence categories may be also used to organize more quantitatively assessed consequences into manageable groups.
11.3 Units of Measure in Consequence Analysis
11.3.1 General
Different types of consequences may be described best by different measures. The RBI analyst should consider the nature of the hazards present and select appropriate units of measure. However, the analyst should bear in mind that the resultant consequences should be comparable, as much as possible, for subsequent risk prioritization and inspection planning.
The following provide some units of measure of consequence that can be used in an RBI assessment.
11.3.2 Safety
Safety consequences are often expressed as a numerical value or characterized by a consequence category associated with the severity of potential injuries that may result from an undesirable event.
For example, safety consequences could be expressed based on the severity of an injury (e.g. fatality, serious injury, medical treatment, first aid) or expressed as a category linked to the injury severity (e.g. A through E). An approach for assigning monetary values to safety and health consequences is included in API 581. However, the FAA has published material on this topic. If it is necessary to convert safety and health consequences into monetary units for subsequent risk ranking or analysis, the analyst should document the basis for the values assigned.
11.3.3 Cost
Cost is commonly used as an indicator of potential consequences. Consequences may be expressed in relative monetary units (e.g. dollars) to the maximum extent practical with an understanding that the numbers are typically not absolute. For example, low, moderate and high categories could be assigned values of $100,000, $1,000,000 and $10,000,000 respectively. This will permit adding the different consequences of a single event and facilitate comparisons of risk from one process unit to another. Potential injuries and fatalities may be considered separately, with a maximum acceptable probability of occurrence assigned.
It is possible, although not always credible, to assign costs to almost any type of consequence. Typical consequences that can be expressed in “cost” include:
a) production loss due to rate reduction or downtime,
b) deployment of emergency response equipment and personnel,
Copyright American Petroleum Institute Provided by IHS under license with API
Not for ResaleNo reproduction or networking permitted without license from IHS
--`,,```,,,,````-`-`,,`,,`,`,,`---
//^:^^#^~^^"~~:~"~$$"~$^"#:*~:^#~#~^~@~:^:#*:^$:$~:*"\\

RISK-BASED INSPECTION 49
c) lost product from a release,
d) degradation of product quality,
e) replacement or repair of damaged equipment,
f) property damage offsite,
g) spill/release cleanup onsite or offsite,
h) business interruption costs (lost profits),
i) loss of market share,
j) injuries or fatalities,
k) land reclamation,
l) litigation,
m) fines,
n) goodwill.
The above list is reasonably comprehensive, but in practice some of these costs are neither practical nor necessary to use in an RBI assessment.
Cost generally requires fairly detailed information to fully assess. It is possible, although not always practical, to assign a monetary value to almost any type of consequence. The cost associated with most of the consequences listed above can be calculated using standard methods. Information such as product value, capacity, equipment costs, repair costs, personnel resources, and environmental damage may be difficult to derive, and the manpower required to perform a complete financial-based consequence analysis may be limited depending on the complexity of the relationship of failure to lost opportunity cost. However, expressing consequences in monetary units has the advantage of permitting a direct comparison of the various categories of consequences on a common basis. Therefore, it is often better to provide approximations or “best estimates” than to use only verbal descriptions (see 11.2.2).
Instead of determining point values or unique ranges of economic loss for each consequence scenario, consequences may be placed into categories that have pre-defined ranges. Table 3 provides an example of this. The ranges may be adjusted for the unit or plant to be considered. For example, $10,000,000 may be a catastrophic loss for a small company, but a large company may consider only losses greater than $1,000,000,000 to be catastrophic.
Table 3—Six Level Table
Category Description Economic Loss Range
I Catastrophic >$100,000,000
II Major > $10,000,000 < $100,000,000
III Serious > $1,000,000 < $10,000,000
IV Significant > $100,000 < $1,000,000
V Minor > $10,000 < $100,000
VI Insignificant <$10,000
Copyright American Petroleum Institute Provided by IHS under license with API
Not for ResaleNo reproduction or networking permitted without license from IHS
--`,,```,,,,````-`-`,,`,,`,`,,`---
//^:^^#^~^^"~~:~"~$$"~$^"#:*~:^#~#~^~@~:^:#*:^$:$~:*"\\

50 API RECOMMENDED PRACTICE 580
11.3.4 Affected Area
Affected area is also used to describe potential consequences in the field of risk assessment. As its name implies, affected area represents the amount of surface area of the plot plan that experiences an effect (toxic dose, thermal radiation, explosion overpressure, etc.) greater than a pre-defined limiting value. Based on the thresholds chosen, anything (i.e. personnel, equipment, environment) within the area will be affected by the consequences of the hazard.
In order to rank consequences according to affected area, it is typically assumed that equipment or personnel at risk are evenly distributed throughout the unit. A more rigorous approach would assign a population density with time or equipment value density to different areas of the unit.
The units for affected area consequence (square feet or square meters) do not readily translate into our everyday experiences and thus there is some reluctance to use this measure. It has, however, several features that merit consideration. The affected area approach has the characteristic of being able to compare toxic and flammable consequences by relating to the physical area impacted by a release. A drawback for area consequences is that it does not include the business impact of failure, which can often be the largest portion of total consequence.
11.3.5 Environmental Damage
Environmental consequence measures are the least developed among those currently used for RBI. A common unit of measure for environmental damage is not available in the current technology, making environmental consequences difficult to assess. Typical parameters used that provide an indirect measure of the degree of environmental damage are:
a) acres of land affected per year;
b) miles of shoreline affected per year;
c) number of biological or human-use resources consumed;
d) the portrayal of environmental damage almost invariably leads to the use of cost, in terms of dollars per year, for the loss and restoration of environmental resources.
11.3.6 Categorizing Safety, Health, and Environmental Consequences
Examples of placing safety, health and environmental consequences into categories is provided in Table 4 and Table 5. Table 4 shows three levels, while Table 5 shows six levels. In practice, other numbers of levels could be used.
Table 4—Three Level Safety, Health and Environmental Consequence Categories
Category Safety Consequence Health Consequence Environmental Consequence
High Fatality or injury with permanent disability Long-term health effects Major offsite response and cleanup
effort
Moderate Lost time injury with full recovery expected
Short-term health effect with full recovery expected
Minor offsite, but possible major onsite response
Low First aid only injury Minimal health impact Minor on-site response
Copyright American Petroleum Institute Provided by IHS under license with API
Not for ResaleNo reproduction or networking permitted without license from IHS
--`,,```,,,,````-`-`,,`,,`,`,,`---
//^:^^#^~^^"~~:~"~$$"~$^"#:*~:^#~#~^~@~:^:#*:^$:$~:*"\\

RISK-BASED INSPECTION 51
11.3.7 Other Considerations
The following should be considered in addition to the consequences described above. It is usually possible to develop a monetary estimate for these considerations:
a) loss of reputation leading to loss of market share,
b) future insurability,
c) regulatory actions curtailing production or raising costs.
11.4 Volume of Fluid Released
In most consequence evaluations, a key element in determining the magnitude of the consequence is the volume of fluid released. The volume released is typically derived from a combination of the following items below.
a) Volume of Fluid Available for Release—Volume of fluid in the piece of equipment and connected equipment items. In theory, this is the amount of fluid between isolation valves that can be quickly closed.
b) Failure mode.
c) Leak rate.
d) Detection and isolation time.
In some cases, the volume released will be the same as the volume available for release. Usually, there are safeguards and procedures in place so that the breach of containment can be isolated and the volume released will be less than the volume available for release. The cost of the lost fluid may be calculated by:
Lost Fluid Cost = Volume of Fluid Lost × Value of the Fluid per Unit Volume
11.5 Consequence Effect Categories
11.5.1 General
The failure of the pressure boundary and subsequent release of fluids may cause safety, health, environmental, facility and business damage. The RBI analyst should consider the nature of the hazards and assure that appropriate factors are considered for the equipment, system, unit, or plant being assessed.
Table 5—Six Level Safety, Health and Environmental Consequence Categories
Category Description Examples
I Catastrophic Large number of fatalities, and/or major long-term environmental impact
II Major A few fatalities, and/or major short-term environmental impact
III Serious Serious injuries, and/or significant environmental impact
IV Significant Minor injuries, and/or short-term environmental impact
V Minor First aid injuries only, and/or minimal environmental impact
VI Insignificant No significant consequence
Copyright American Petroleum Institute Provided by IHS under license with API
Not for ResaleNo reproduction or networking permitted without license from IHS
--`,,```,,,,````-`-`,,`,,`,`,,`---
//^:^^#^~^^"~~:~"~$$"~$^"#:*~:^#~#~^~@~:^:#*:^$:$~:*"\\

52 API RECOMMENDED PRACTICE 580
Regardless of whether a more qualitative or quantitative analysis is used, the major factors to consider in evaluating the consequences of failure include:
a) flammable events (fire and explosion),
b) toxic releases,
c) releases of other hazardous fluids,
d) environmental consequences,
e) production consequences (business interruption),
f) maintenance and reconstruction impact.
11.5.2 Flammable Events (Fire and Explosion)
Flammable events occur when both a leak and ignition occur. The ignition could be through an ignition source or auto-ignition. Flammable events can cause damage in two ways: thermal radiation and blast overpressure. Most of the damage from thermal effects tends to occur at close range, but blast effects can cause damage over a larger distance from the blast center. Following are typical categories of fire and explosion events:
a) vapor cloud explosion,
b) pool fire,
c) jet fire,
d) flash fire,
e) boiling liquid expanding vapor explosion (BLEVE).
The flammable events consequence is typically derived from a combination of the following elements:
a) inherent tendency to ignite,
b) volume of fluid released,
c) ability to flash to a vapor,
d) possibility of auto-ignition,
e) effects of higher pressure or higher temperature operations,
f) engineered safeguards,
g) personnel and equipment exposed to damage.
11.5.3 Toxic Releases
Toxic releases, in RBI, are only addressed when they affect personnel (site and public). These releases can cause effects at greater distances than flammable events. Unlike flammable releases, toxic releases do not require an additional event (e.g. ignition, as in the case of flammables) to cause personnel injuries. The RBI program typically focuses on acute toxic risks that create an immediate danger, rather than chronic risks from low-level exposures.
Copyright American Petroleum Institute Provided by IHS under license with API
Not for ResaleNo reproduction or networking permitted without license from IHS
--`,,```,,,,````-`-`,,`,,`,`,,`---
//^:^^#^~^^"~~:~"~$$"~$^"#:*~:^#~#~^~@~:^:#*:^$:$~:*"\\

RISK-BASED INSPECTION 53
The toxic consequence is typically derived from the following elements:
a) volume of fluid released and toxicity,
b) ability to disperse under typical process and environmental conditions,
c) detection and mitigation systems,
d) population in the vicinity of the release.
11.5.4 Releases of Other Hazardous Fluids
Other hazardous fluid releases are of most concern in RBI assessments when they affect personnel. These materials can cause thermal or chemical burns if a person comes in contact with them. Common fluids, including steam, hot water, acids, and caustics can have a safety consequence of a release and should be considered as part of an RBI program. Generally, the consequence of this type of release is significantly lower than for flammable or toxic releases because the affected area is likely to be much smaller and the magnitude of the hazard is less. Key parameters in this evaluation are as follows.
a) Volume of fluid released.
b) Personnel density in the area.
c) Type of fluid and nature of resulting injury.
d) Safety systems (e.g. personnel protective clothing, showers, etc.).
e) Environmental damage if the spill is not contained.
f) Equipment Damage—For some reactive fluids, contact with equipment or piping may result in aggressive deterioration and failure.
11.5.5 Environmental Consequences
Environmental consequences are an important component to any consideration of overall risk in a processing plant. The RBI program typically focuses on acute and immediate environmental risks, rather than chronic risks from low-level emissions.
The environmental consequence is typically derived from the following elements:
a) volume of fluid released;
b) ability to flash to vapor;
c) leak containment safeguards;
d) environmental resources affected;
e) regulatory consequence (e.g. citations for violations, fines, potential shutdown by authorities).
Liquid releases may result in contamination of soil, groundwater, and/or open water. Gaseous releases are equally important but more difficult to assess since the consequence typically relates to local regulatory constraints and the penalty for exceeding those constraints.
Copyright American Petroleum Institute Provided by IHS under license with API
Not for ResaleNo reproduction or networking permitted without license from IHS
--`,,```,,,,````-`-`,,`,,`,`,,`---
//^:^^#^~^^"~~:~"~$$"~$^"#:*~:^#~#~^~@~:^:#*:^$:$~:*"\\

54 API RECOMMENDED PRACTICE 580
The consequences of environmental damage are best understood by cost. The cost may be calculated as follows:
Environmental Cost = Cost for Cleanup + Fines + Other Costs
The cleanup cost will vary depending on many factors. Some key factors are listed as follows.
a) Type of Spill—Aboveground, belowground, surfacewater etc.
b) Type of liquid.
c) Method of clean-up.
d) Volume of spill.
e) Accessibility and terrain at the spill location.
The fine component cost will depend on the regulations and laws of the applicable local and federal jurisdictions.
The other cost component would include costs that may be associated with the spill such as litigation from landowners or other parties. This component is typically specific to the locale of the facility.
11.5.6 Production (Business Interruption) Consequences
Production consequences generally occur with any loss of containment of the process fluid and often with a loss of containment of a utility fluid (water, steam, fuel gas, acid, caustic, etc.). These production consequences may be in addition to or independent of flammable, toxic, hazardous or environmental consequences. The main production consequences for RBI are financial.
The financial consequences could include the value of the lost process fluid and business interruption. The cost of the lost fluid can be calculated fairly easily by multiplying the volume released by the value of the fluid lost. Calculation of the business interruption is more complex. The selection of a specific method depends on:
a) the scope and level of detail of the study,
b) availability of business interruption data.
A simple method for estimating the business interruption consequence is to use the equation:
Business Interruption = Process Unit Daily Value × Downtime (Days)
The unit daily value could be on a revenue or profit basis. The downtime estimate would represent the time required to get back into production. The Dow Fire and Explosion Index is a typical method of estimating downtime after a fire or explosion.
More rigorous methods for estimating business interruption consequences may take into account factors such as:
a) ability to compensate for damaged equipment (e.g. spare equipment, rerouting, etc.);
b) potential for damage to nearby equipment (knock-on damage);
c) potential for production loss to other units.
Copyright American Petroleum Institute Provided by IHS under license with API
Not for ResaleNo reproduction or networking permitted without license from IHS
--`,,```,,,,````-`-`,,`,,`,`,,`---
//^:^^#^~^^"~~:~"~$$"~$^"#:*~:^#~#~^~@~:^:#*:^$:$~:*"\\

RISK-BASED INSPECTION 55
Site specific circumstances should be considered in the business interruption analysis to avoid over or under stating this consequence. Examples of these considerations include:
a) lost production may be compensated at another under-utilized or idle facility;
b) loss of profit could be compounded if other facilities use the unit’s output as a feedstock or processing fluid;
c) repair of small damage cost equipment may take as long as large damage cost equipment;
d) extended downtime may result in losing customers or market share, thus extending loss of profit beyond production restart;
e) loss of hard to get or unique equipment items may require extra time to obtain replacements;
f) insurance coverage.
11.5.7 Maintenance and Reconstruction Impact
Maintenance and reconstruction impact represents the effort required to correct the failure and to fix or replace equipment damaged in the subsequent events (e.g. fire, explosion). The maintenance and reconstruction impact should be accounted for in the RBI program. Maintenance impact will generally be measured in monetary terms and typically includes:
a) repairs,
b) equipment replacement.
11.6 Determination of COF
11.6.1 General
The consequences of releasing a hazardous material can be estimated in six steps (see Figure 5), with each step performed using the assumption of a specific scenario and the steps should be repeated for each credible scenario. The steps are as follows:
a) estimate the release rate,
b) estimate total volume of fluid that will be released,
c) determine if the fluid is dispersed in a rapid manner (instantaneous) or slowly (continuous),
d) determine if the fluid disperses in the atmosphere as a liquid or a gas,
e) estimate the impacts of any existing mitigation system,
f) estimate the consequences.
11.6.2 Factors for Estimating Consequences
Estimate the consequences of a failure from equipment items considering such factors as physical properties of the contained material, its toxicity and flammability, type of release and release duration, weather conditions and dispersion of the released contents, escalation effects, and mitigation actions. Consider the impact on plant personnel and equipment, population in the nearby communities, and the environment. Lost production, loss of raw material and other losses should also be considered. Several credible consequence scenarios may result from a single failure
Copyright American Petroleum Institute Provided by IHS under license with API
Not for ResaleNo reproduction or networking permitted without license from IHS
--`,,```,,,,````-`-`,,`,,`,`,,`---
//^:^^#^~^^"~~:~"~$$"~$^"#:*~:^#~#~^~@~:^:#*:^$:$~:*"\\

56 API RECOMMENDED PRACTICE 580
Figure 5—Determination of COF
F lu id P roperties :in E qu ipm ent and
at A m bien tC ond itions
E stim ateEqu iva len t Ho le
Size :(e.g. 0.25 in., 1 in.)Es mate
E stim ate To ta lV o lum e of F lu id
R e leased
Determine if FluidDisperses as a Gas or a
Liquid
A ssess E xis tingM itiga tion
Toxic Release
Other HazardousFluid Release
FlammableEvent
E stim ate C onsequence:
Safety and Health Impact
Environmental Impact
d
Determine if Dispersion isCon nuous or Instantaneous
Copyright American Petroleum Institute Provided by IHS under license with API
Not for ResaleNo reproduction or networking permitted without license from IHS
--`,,```,,,,````-`-`,,`,,`,`,,`---
//^:^^#^~^^"~~:~"~$$"~$^"#:*~:^#~#~^~@~:^:#*:^$:$~:*"\\
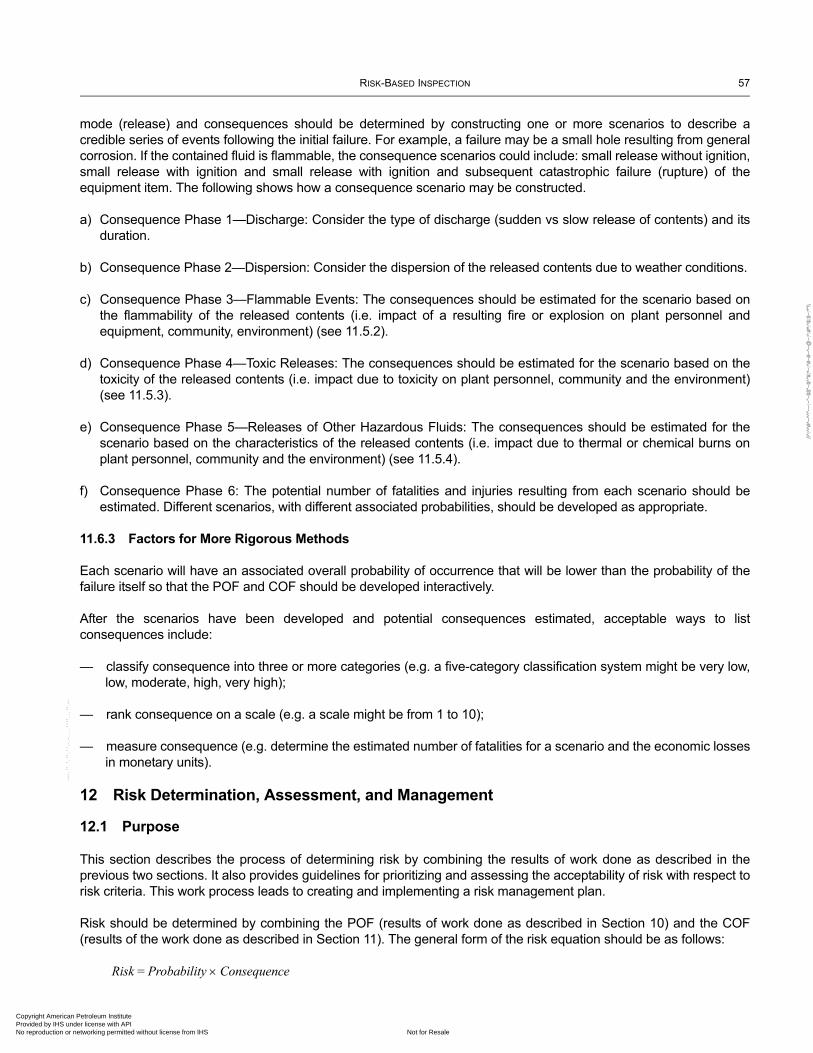
RISK-BASED INSPECTION 57
mode (release) and consequences should be determined by constructing one or more scenarios to describe a credible series of events following the initial failure. For example, a failure may be a small hole resulting from general corrosion. If the contained fluid is flammable, the consequence scenarios could include: small release without ignition, small release with ignition and small release with ignition and subsequent catastrophic failure (rupture) of the equipment item. The following shows how a consequence scenario may be constructed.
a) Consequence Phase 1—Discharge: Consider the type of discharge (sudden vs slow release of contents) and its duration.
b) Consequence Phase 2—Dispersion: Consider the dispersion of the released contents due to weather conditions.
c) Consequence Phase 3—Flammable Events: The consequences should be estimated for the scenario based on the flammability of the released contents (i.e. impact of a resulting fire or explosion on plant personnel and equipment, community, environment) (see 11.5.2).
d) Consequence Phase 4—Toxic Releases: The consequences should be estimated for the scenario based on the toxicity of the released contents (i.e. impact due to toxicity on plant personnel, community and the environment) (see 11.5.3).
e) Consequence Phase 5—Releases of Other Hazardous Fluids: The consequences should be estimated for the scenario based on the characteristics of the released contents (i.e. impact due to thermal or chemical burns on plant personnel, community and the environment) (see 11.5.4).
f) Consequence Phase 6: The potential number of fatalities and injuries resulting from each scenario should be estimated. Different scenarios, with different associated probabilities, should be developed as appropriate.
11.6.3 Factors for More Rigorous Methods
Each scenario will have an associated overall probability of occurrence that will be lower than the probability of the failure itself so that the POF and COF should be developed interactively.
After the scenarios have been developed and potential consequences estimated, acceptable ways to list consequences include:
— classify consequence into three or more categories (e.g. a five-category classification system might be very low, low, moderate, high, very high);
— rank consequence on a scale (e.g. a scale might be from 1 to 10);
— measure consequence (e.g. determine the estimated number of fatalities for a scenario and the economic losses in monetary units).
12 Risk Determination, Assessment, and Management
12.1 Purpose
This section describes the process of determining risk by combining the results of work done as described in the previous two sections. It also provides guidelines for prioritizing and assessing the acceptability of risk with respect to risk criteria. This work process leads to creating and implementing a risk management plan.
Risk should be determined by combining the POF (results of work done as described in Section 10) and the COF (results of the work done as described in Section 11). The general form of the risk equation should be as follows:
Risk = Probability × Consequence
Copyright American Petroleum Institute Provided by IHS under license with API
Not for ResaleNo reproduction or networking permitted without license from IHS
--`,,```,,,,````-`-`,,`,,`,`,,`---
//^:^
^#^~
^^"~
~:~"
~$$"
~$^"
#:*~
:^#~
#~^~
@~:
^:#*
:^$:
$~:*
"\\

58 API RECOMMENDED PRACTICE 580
12.2 Determination of Risk
12.2.1 Determination of the Probability of a Specific Consequence
Once the probabilities of failure and failure mode(s) have been determined for the relevant damage mechanisms (see Section 10), the probability of each credible consequence scenario should be determined. In other words, the loss of containment failure may only be the first event in a series of events that lead to a specific consequence. The probability of credible events leading up to the specific consequence should be factored into the probability of the specific consequence occurring. For example, after a loss of containment:
— the first event may be initiation or failure of safeguards (isolation, alarms, etc.);
— the second event may be dispersion, dilution or accumulation of the fluid;
— the third event may be initiation of or failure to initiate preventative action (shutting down nearby ignition sources, neutralizing the fluid, etc.);
— and so on until the specific consequence event (fire, toxic release, injury, environmental release, etc.).
It is important to understand this linkage between the POF and the probability of possible resulting incidents. The probability of a specific consequence is tied to the severity of the consequence and may differ considerably from the probability of the equipment failure itself. Probabilities of incidents generally decrease with the severity of the incident. For example, the probability of an event resulting in a fatality will generally be less than the probability that the event will result in a first aid or medical treatment injury. It is important to understand this relationship.
Personnel inexperienced in risk assessment methods often link the POF with the most severe consequences that can be envisioned. An extreme example would be coupling the POF of a damage mechanism where the mode of failure is a small hole leak with the consequence of a major fire. This linkage would lead to an overly conservative risk assessment since a small leak will rarely lead to a major fire. Each type of damage mechanism has its own characteristic failure mode(s). For a specific damage mechanism, the expected mode of failure should be taken into account when considering the probability of incidents in the aftermath of an equipment failure. For instance, the consequences expected from a small leak could be very different than the consequences expected from a brittle fracture.
The example in Figure 5 serves to illustrate how the probability of a specific consequence could be determined. The example has been simplified and the numbers used are purely hypothetical.
Copyright American Petroleum Institute Provided by IHS under license with API
Not for ResaleNo reproduction or networking permitted without license from IHS
--`,,```,,,,````-`-`,,`,,`,`,,`---
//^:^^#^~^^"~~:~"~$$"~$^"#:*~:^#~#~^~@~:^:#*:^$:$~:*"\\

RISK-BASED INSPECTION 59
EXAMPLE
An equipment item containing a flammable fluid is being assessed.
The probability of a specific consequence should be the product of the probability of each event that could result in the specific consequence. In this example, the specific consequence being evaluated is a fire (an example event tree starting with a loss of containment is shown below). The probability of a fire would be:
Probability of Fire = (Probability of Failure) × (Probability of Ignition)
Probability of Fire = 0.001 per year × 0.01 = 0.00001 or 1 × 10⁻⁵ per year
The probability of no fire encompasses two scenarios (loss of containment without ignition and no loss of containment). The probability of no fire would be:
Probability of No Fire = (Probability of Failure × Probability of Non-ignition) + Probability of No Failure
Probability of No Fire = (0.001 per year × 0.99) + 0.999 per year = 0.99999 per year
NOTE The probability of all consequence scenarios should equal 1.0. In the example, the probability of the specific consequence of a fire (1 × 10⁻⁵ per year) plus the probability of no fire (0.999999 per year) equals 1.0.
If the consequence of a fire had been assessed at $1 × 10⁷ then the resulting risk would be:
Risk of Fire = (1 × 10⁻⁵ per year) × ($1 × 10⁷) = $100/year
NOTE The overall risk must include the probability of loss of containment. For example, if the probability of loss of containment is 0.1, the overall risk above is 0.1 × $100/year = $10/year.
Typically, there will be other credible consequences that should be evaluated. However, it is often possible to determine a dominant probability/consequence pair, such that it is not necessary to include every credible scenario in the analysis. Engineering judgment and experience should be used to eliminate trivial cases.
12.2.2 Calculate Risk
Referring back to the risk equation:
Risk = Probability × Consequence
Figure 6—Example of Calculating the Probability of a Specific Consequence
1.3 Loss of Containment
Probability of Failure
1.2 Fire
Probability of Igni on
1.1 No Fire
Probability of Non-igni on
Copyright American Petroleum Institute Provided by IHS under license with API
Not for ResaleNo reproduction or networking permitted without license from IHS
--`,,```,,,,````-`-`,,`,,`,`,,`---
//^:^^#^~^^"~~:~"~$$"~$^"#:*~:^#~#~^~@~:^:#*:^$:$~:*"\\
60 API RECOMMENDED PRACTICE 580
It is now possible to calculate the risk for each specific consequence. The risk equation can now be stated as:
Risk of a Specific Consequence = (Probability of a Specific Consequence) × (Specific Consequence)
The total risk is the sum of the individual risks for each specific consequence. Often one probability/consequence pair will be dominant and the total risk can be approximated by the risk of the dominant scenario.
For the example mentioned in 12.2.1, if the consequence of a fire had been assessed at $1 × 10⁷ then the resulting risk would be:
Risk of Fire = (1 × 10⁻⁵ per year) × ($1 × 10⁷) = $100/year
If probability and consequence are not expressed as numerical values, risk is usually determined by plotting the probability and consequence on a risk matrix (see 12.6). Probability and consequence pairs for various scenarios may be plotted to determine risk of each scenario. Note that when a risk matrix is used, the probability to be plotted should be the probability of the associated consequence, not the POF. Also note that the overall risk must include the probability of loss of containment. For example, if the probability of loss of containment is 0.1, the overall risk above is 0.1 × $100/year = $10/year.
12.3 Risk Management Decisions and Acceptable Levels of Risk
12.3.1 Risk Acceptance
Risk-based inspection is a tool to provide an analysis of the risks of loss of containment of equipment. Many companies have corporate risk criteria defining acceptable and prudent levels of safety, environmental and financial risks. These risk criteria should be used when making risk-based inspection decisions. Because each company may be different in terms of acceptable risk levels, risk management decisions can vary among companies.
Cost-benefit analysis is a powerful tool that is being used by many companies, governments and regulatory authorities as one method in determining risk acceptance. Users are referred to A Comparison of Criteria for Acceptance of Risk by the Pressure Vessel Research Council (PVRC), for more information on risk acceptance. Risk acceptance may vary for different risks. For example, risk tolerance for an environmental risk may be higher than for a safety/health risk.
12.3.2 Using Risk Assessment in Inspection and Maintenance Planning
The use of risk assessment in inspection and maintenance planning is unique in that consequence information, which is traditionally operations-based, and POF information, which is typically engineering/maintenance/inspection-based, is combined to assist in the planning process. Part of this planning process is the determination of what to inspect, how to inspect (technique), where to inspect (location), and how much to inspect (coverage). Determining the risk of process units, or individual process equipment items facilitates this, as the inspections are now prioritized based on the risk value. The second part of this process is determining when to inspect the equipment. Understanding how risk varies with time facilitates this part of the process. Refer to Section 13 for a more detailed description of inspection planning based on risk analysis.
12.4 Sensitivity Analysis
Understanding the value of each variable and how it influences the risk calculation is key to identifying which input variables deserve closer scrutiny versus other variables which may not have significant effects. This is more important when performing risk analyses that are more detailed and quantitative in nature.
Sensitivity analysis typically involves reviewing some or all input variables to the risk calculation to determine the overall influence on the resultant risk value. Once this analysis has been performed, the user can see which input variables significantly influence the risk value. Those key input variables deserve the most focus or attention.
Copyright American Petroleum Institute Provided by IHS under license with API
Not for ResaleNo reproduction or networking permitted without license from IHS
--`,,```,,,,````-`-`,,`,,`,`,,`---
//^:^^#^~^^"~~:~"~$$"~$^"#:*~:^#~#~^~@~:^:#*:^$:$~:*"\\

RISK-BASED INSPECTION 61
It often is worthwhile to gather additional information on such variables. Typically, the preliminary estimates of probability and consequence may be too conservative or too pessimistic; therefore, the information gathering performed after the sensitivity analysis should be focused on developing more certainty for the key input variables. This process should ultimately lead to a re-evaluation of the key input variables. As such, the quality and accuracy of the risk analysis should improve. This is an important part of the data validation phase of risk assessment.
12.5 Assumptions
Assumptions or estimates of input values are often used when consequence and/or POF data are not available. Even when data are known to exist, conservative estimates may be utilized in an initial analysis pending input of future process or engineering modeling information, such as a sensitivity analysis. Caution is advised in being too conservative, as overestimating consequences and/or POF values will unnecessarily inflate the calculated risk values. Presenting over inflated risk values may mislead inspection planners, management and insurers, and can create a lack of credibility for the user and the RBI process. Appropriate members of the RBI team as outlined in Section 16 should agree on the assumptions made for RBI analysis and the potential impacts on the risk results.
12.6 Risk Presentation
12.6.1 General
Once risk values are developed, they can then be presented in a variety of ways to communicate the results of the analysis to decision-makers and inspection planners. One goal of the risk analysis is to communicate the results in a common format that a variety of people can understand. Using a risk matrix or plot is helpful in accomplishing this goal.
12.6.2 Risk Matrix
For risk ranking methodologies that use consequence and probability categories, presenting the results in a risk matrix is a very effective way of communicating the distribution of risks throughout a plant or process unit without numerical values. An example risk matrix is shown in Figure 7. In this figure, the consequence and probability categories are arranged such that the highest risk ranking is toward the upper right-hand corner. It is usually desirable to associate numerical values with the categories to provide guidance to the personnel performing the assessment (e.g. probability category C ranges from 0.001 to 0.01). Different sizes of matrices may be used (e.g. 5 × 5, 4 × 4, etc.). Regardless of the matrix selected, the consequence and probability categories should provide sufficient discrimination between the items assessed.
Risk categories may be assigned to the boxes on the risk matrix. An example risk categorization (higher, medium, lower) of the risk matrix is shown in Figure 7. In this example, the risk categories are symmetrical. They may also be asymmetrical where for instance the consequence category may be given higher weighting than the probability category. A risk matrix depicts results at a particular point in time.
12.6.3 Risk Plots
When more quantitative consequence and probability data are being used, and where showing numeric risk values is more meaningful to the stakeholders, a risk plot (or graph) is used (see Figure 7). This graph is constructed similarly to the risk matrix in that the highest risk is plotted toward the upper right-hand corner. Often a risk plot is drawn using log-log scales for a better understanding of the relative risks of the items assessed. In the example plot in Figure 8, 10 pieces of equipment are shown, as well as an iso-risk line (line of constant risk). If this line is the acceptable threshold of risk in this example, then equipment items 1, 2, and 3 should be mitigated so that their resultant risk levels fall below the line.
Copyright American Petroleum Institute Provided by IHS under license with API
Not for ResaleNo reproduction or networking permitted without license from IHS
--`,,```,,,,````-`-`,,`,,`,`,,`---
//^:^^#^~^^"~~:~"~$$"~$^"#:*~:^#~#~^~@~:^:#*:^$:$~:*"\\

62 API RECOMMENDED PRACTICE 580
12.6.4 Using a Risk Plot or Matrix
Equipment items residing towards the upper right-hand corner of the plot or matrix (in the examples presented) will most likely take priority for inspection planning because these items have the highest risk. Similarly, items residing toward the lower left-hand corner of the plot (or matrix) will tend to take lower priority because these items have the lowest risk. Once the plots have been completed, the risk plot (or matrix) can then be used as a screening tool during the prioritization process.
Risk may be described in terms of dollars or other numerical values as described in 10.2 even if a qualitative analysis has been performed, and the results have been plotted on a risk matrix. Numerical values associated with each of the probability and consequence categories on the risk matrix may be used to calculate the risk. For cost related risk, a net present value savings vs inspection time plot may be used to time the inspection activities.
12.7 Establishing Acceptable Risk Thresholds
After the risk analysis has been performed, and risk values plotted, the risk evaluation process begins. Risk plots and matrices can be used to screen, and initially identify higher, intermediate and lower risk equipment items. The equipment can also be ranked (prioritized) according to its risk value in tabular form. Thresholds that divide the risk
Figure 7—Example Risk Matrix Using Probability and Consequence Categories to Display Risk Rankings
12
34
5
A B C D E
Higher risk
Lower risk
Medium risk
Pro
babi
lity
cate
gory
Consequence category
Qualitative Risk Matrix
Copyright American Petroleum Institute Provided by IHS under license with API
Not for ResaleNo reproduction or networking permitted without license from IHS
--`,,```,,,,````-`-`,,`,,`,`,,`---
//^:^^#^~^^"~~:~"~$$"~$^"#:*~:^#~#~^~@~:^:#*:^$:$~:*"\\

RISK-BASED INSPECTION 63
plot, matrix or table into acceptable and unacceptable regions of risk can be developed. Corporate safety and financial policies and constraints or risk criteria influence the placement of the thresholds. Regulations and laws may also specify or assist in identifying the acceptable risk thresholds.
Reduction of some risks to a lower level may not be practical due to technology and cost constraints. An “as low as reasonably practical” (ALARP) approach to risk management or other risk management approach may be necessary for these items.
12.8 Risk Management
Based on the ranking of items and the risk threshold, the risk management process begins. For risks that are judged acceptable, no mitigation may be required and no further action necessary.
For risks considered unacceptable and therefore requiring risk mitigation, there are various mitigation categories that should be considered.
a) Decommission—Is the equipment really necessary to support unit operation?
b) Inspection/Condition Monitoring—Can a cost-effective inspection program, with repair as indicated by the inspection results, be implemented that will reduce risks to an acceptable level?
c) Consequence Mitigation—Can actions be taken to lessen the consequences related to an equipment failure?
Figure 8—Risk Plot when Using Quantitative or Numeric Risk Values
Consequence of failure
Pro
babi
lity
of fa
ilure
ISO-risk line
12
3
4
5
6
7
89
10
Risk plot
Copyright American Petroleum Institute Provided by IHS under license with API
Not for ResaleNo reproduction or networking permitted without license from IHS
--`,,```,,,,````-`-`,,`,,`,`,,`---
//^:^^#^~^^"~~:~"~$$"~$^"#:*~:^#~#~^~@~:^:#*:^$:$~:*"\\

64 API RECOMMENDED PRACTICE 580
d) Probability Mitigation—Can actions be taken to lessen the POF such as metallurgy changes or equipment redesign?
Risk management decisions can now be made on which mitigation actions(s) to take. Risk management/mitigation is covered further in Section 13 and Section 14.
13 Risk Management with Inspection Activities
13.1 Managing Risk by Reducing Uncertainty Through Inspection
In previous sections, it has been mentioned that risk can be managed by inspection. Obviously, inspection does not arrest or mitigate damage mechanisms or in and of itself it does not reduce risk, but the information gained though effective inspection can better quantify the actual risk. Impending failure of pressure equipment is not avoided by inspection activities unless the inspection precipitates risk mitigation activities that change the POF. Inspection serves to identify, monitor, and measure the damage mechanism(s). Also, it is invaluable input in the prediction of when the damage will reach a critical point. Correct application of inspections will improve the user's ability to predict the damage mechanisms and rates of deterioration. The better the predictability, the less uncertainty there will be as to when a failure may occur. Mitigation (repair, replacement, changes, etc.) can then be planned and implemented prior to the predicted failure date. The reduction in uncertainty and increase in predictability through inspection translate directly into a better estimate of the probability of a failure and therefore a reduction in the calculated risk. However, users should be diligent to assure that temporary inspection alternatives, in lieu of more permanent risk reductions, are actually effective.
The foregoing does not imply that risk-based inspection plans and activities are always the answer to monitoring degradation and therefore reducing risks associated with pressure equipment. Some damage mechanisms are very difficult or impossible to monitor with just inspection activities (e.g. metallurgical deterioration that may result in brittle fracture, many forms of stress corrosion cracking, and even fatigue). Other damage mechanisms precipitated by short-term, event-driven operating changes can happen too fast to be monitored with normal inspection plans, be they risk-based, condition-based or time-based. Hence the need for a establishing and implementing a comprehensive program for IOWs, along with adequate communications to inspection personnel when deviations occur and a rigorous MOC program for changes from the established parameters.
Risk mitigation (by the reduction in uncertainty) achieved through inspection presumes that the organization will act on the results of the inspection in a timely manner. Risk mitigation is not achieved if inspection data that are gathered are not properly analyzed and acted upon where needed. The quality of the inspection data and the analysis or interpretation will greatly affect the level of risk mitigation. Proper inspection methods and data analysis tools are therefore critical.
13.2 Identifying Risk Management Opportunities from RBI Results
As discussed in Section 12, typically a risk priority list is developed as a result of the RBI process. RBI will also identify whether consequence or POF or both is driving risk. In the situations where risk is being driven by POF, there is usually potential for risk management through inspection.
Once an RBI assessment has been completed, the items with higher or unacceptable risk should be assessed for potential risk management through inspection, or other risk management strategies. Whether inspections will be effective or not will depend on:
a) equipment type;
b) active and credible damage mechanism(s);
c) rate of deterioration or susceptibility;
Copyright American Petroleum Institute Provided by IHS under license with API
Not for ResaleNo reproduction or networking permitted without license from IHS
--`,,```,,,,````-`-`,,`,,`,`,,`---
//^:^
^#^~
^^"~
~:~"
~$$"
~$^"
#:*~
:^#~
#~^~
@~:
^:#*
:^$:
$~:*
"\\

RISK-BASED INSPECTION 65
d) inspection methods, coverage and frequency;
e) accessibility to expected damage areas;
f) shutdown requirements;
g) amount of achievable reduction in POF (i.e. a reduction in POF of a low POF item is usually difficult to achieve through inspection).
Depending on factors such as the remaining life of the equipment and type of damage mechanism, risk management through inspection may have little or no effect. Examples of such cases are:
a) corrosion rates well-established with equipment nearing end of life,
b) instantaneous failures related to operating conditions such as brittle fracture,
c) inspection technology that is not sufficient to detect or quantify deterioration adequately,
d) too short a time frame from the onset of deterioration to final failure for periodic inspections to be effective (e.g. high-cycle fatigue cracking),
e) event-driven failures (circumstances that cannot be predicted),
In cases such as these, an alternative form of mitigation may be required.
The most practical and cost effective risk mitigation strategy can then be developed for each item. Usually, inspection provides a major part of the overall risk management strategy, but not always.
13.3 Establishing an Inspection Strategy Based on Risk Assessment
The results of an RBI assessment and the resultant risk management assessment are normally used as the basis for the development of an overall inspection strategy for the group of items included. The inspection strategy should be designed in conjunction with other mitigation plans so that all equipment items will have resultant risks that are acceptable. For the development of their inspection strategy, users should consider the following:
— risk criteria and ranking,
— risk drivers,
— item history,
— number and results of inspections,
— type and effectiveness of inspections,
— equipment in similar service and remaining life.
Inspection is only effective if the examination technique chosen is sufficient for detecting the damage mechanism and its severity. As an example, spot thickness readings on a piping circuit would be considered to have little or no benefit if the damage mechanism results in unpredictable localized corrosion (e.g. pitting, ammonia bisulfide corrosion, local thin area, etc.). In this case, ultrasonic scanning, radiography, etc. will be more effective. The level of risk reduction achieved by inspection will depend on:
a) mode of failure of the damage mechanism,
Copyright American Petroleum Institute Provided by IHS under license with API
Not for ResaleNo reproduction or networking permitted without license from IHS
--`,,```,,,,````-`-`,,`,,`,`,,`---
//^:^^#^~^^"~~:~"~$$"~$^"#:*~:^#~#~^~@~:^:#*:^$:$~:*"\\

66 API RECOMMENDED PRACTICE 580
b) time interval between the onset of deterioration and failure (i.e. speed of deterioration),
c) detection capability of examination technique,
d) scope of inspection,
e) frequency of inspection.
Organizations should be deliberate and systematic in assigning the level of risk management achieved through inspection and should be cautious not to assume that there is an unending capacity for risk management through inspection.
The inspection strategy should be a documented, iterative process to assure that inspection activities are continually focused on items with higher risk.
13.4 Managing Risk with Inspection Activities
The effectiveness of past inspections is part of the determination of the present risk. The future risk can now be influenced by future inspection activities. RBI can be used as a “what if” tool to determine when, what and how inspections should be conducted to yield an acceptable future risk level. Key parameters and examples that can affect the future risk are as follows.
a) Frequency of Inspection—Increasing the frequency of inspections may serve to better define, identify or monitor the damage mechanism(s) and therefore better quantify the risk. Both routine and turnaround inspection frequencies can be optimized.
b) Coverage—Different zones or areas of inspection of an item or series of items can be modeled and evaluated to determine the coverage that will produce an acceptable level of risk. For example:
— a higher risk piping system may be a candidate for more extensive inspection, using one or more NDE techniques targeted to locating the identified damage mechanisms;
— an assessment may reveal the need for focus on parts of a vessel where the highest risk may be located and focus on quantifying this risk rather than focusing on the rest of the vessel where there are perhaps only low risk deterioration processes occurring.
c) Tools and Techniques—The selection and usage of the appropriate inspection tools and techniques can be optimized to cost effectively and safely quantify the POF. In the selection of inspection tools and techniques, inspection personnel should take into consideration that more than one technology may achieve risk mitigation. However, the level of mitigation achieved can vary depending on the choice. As an example, profile radiography would typically be more effective than digital ultrasonics for thickness monitoring in cases of localized corrosion.
d) Procedures and Practices—Inspection procedures and the actual inspection practices can impact the ability of inspection activities to identify, measure and/or monitor damage mechanisms. If the inspection activities are executed effectively by well-trained and qualified inspectors, the expected risk management benefits should be obtained. The user is cautioned not to assume that all inspectors and NDE examiners are well qualified and experienced, but rather to take steps to assure that they have the appropriate level of experience and qualifications.
e) Internal, On-stream, or External Inspection—Risk quantification by internal, on-stream and external inspections should be assessed. Often external inspection with effective on-stream inspection techniques can provide useful
Copyright American Petroleum Institute Provided by IHS under license with API
Not for ResaleNo reproduction or networking permitted without license from IHS
--`,,```,,,,````-`-`,,`,,`,`,,`---
//^:^^#^~^^"~~:~"~$$"~$^"#:*~:^#~#~^~@~:^:#*:^$:$~:*"\\

RISK-BASED INSPECTION 67
data for risk assessment. It is worth noting that invasive inspections, in some cases, may cause deterioration and increase the risk of the item. Examples where this may happen include:
— moisture ingress to equipment leading to stress corrosion cracking or polythionic acid cracking,
— internal inspection of glass lined vessels,
— removal of passivating films,
— human errors in start up (re-streaming),
— increased risks associated with shutting down and starting up equipment.
The user can adjust these parameters to obtain the optimum inspection plan that manages risk, is cost effective, and is practical.
13.5 Managing Inspection Costs with RBI
Inspection costs can be more effectively managed through the utilization of RBI. Resources can be applied or shifted to those areas identified as a higher risk or targeted based on the strategy selected. Consequently, this same strategy allows consideration for reduction of inspection activities in those areas that have a lower risk or where the inspection activity has little or no effect on the associated risks. This results in inspection resources being applied where they are needed most and thereby increased inspection cost effectiveness.
Another opportunity for managing inspection costs is by identifying items in the inspection plan that can be inspected non-intrusively on-stream. If the non-intrusive inspection provides sufficient risk management, there is a potential for a net savings based on not having to blind, open, clean, and internally inspect during downtime. If the item considered is the main driver for bringing an operational unit down, the non-intrusive inspection may contribute to increased uptime of the unit. The user should recognize that while there is a potential for the reduction of inspection costs through the utilization of RBI, increased equipment integrity and inspection cost optimization should remain the focus.
13.6 Assessing Inspection Results and Determining Corrective Action
Inspection results such as the identification of damage mechanisms, rate of deterioration and equipment tolerance to the types of deterioration should be used as variables in assessing remaining life and future inspection plans. The results can also be used for comparison or validation of the models that may have been used for POF determination.
A documented mitigation action plan should be developed for any equipment item requiring repair or replacement. The action plan should describe the extent of repair (or replacement), recommendations, the proposed repair method(s), appropriate QA/QC and the date the plan should be completed.
13.7 Achieving Lowest Life Cycle Costs with RBI
Not only can RBI be used to optimize inspection costs that directly affect life cycle costs, it can assist in lowering overall life cycle costs through various cost benefit assessments. The following examples can give a user ideas on how to lower life cycle costs through RBI with cost benefit assessments.
a) RBI should enhance the prediction of failures caused by damage mechanisms. This in turn should give the user confidence to continue to operate equipment safely, closer to the predicted failure date. By doing this, the equipment cycle time should increase and life cycle costs decrease.
b) RBI can be used to assess the effects of changing to a more aggressive fluid. A subsequent plan to upgrade construction material or replace specific items can then be developed. The construction material plan would
Copyright American Petroleum Institute Provided by IHS under license with API
Not for ResaleNo reproduction or networking permitted without license from IHS
--`,,```,,,,````-`-`,,`,,`,`,,`---
//^:^^#^~^^"~~:~"~$$"~$^"#:*~:^#~#~^~@~:^:#*:^$:$~:*"\\

68 API RECOMMENDED PRACTICE 580
consider the optimized run length safely attainable along with the appropriate inspection plan. This could equate to increased profits and lower life cycle costs through reduced maintenance, optimized inspections, and increased unit/equipment uptime.
c) Turnaround and maintenance costs also have an effect on the life cycle costs of an equipment item. By using the results of the RBI inspection plan to identify more accurately where to inspect and what repairs and replacements to expect, turnaround and maintenance work can be preplanned and, in most cases, executed at a lower cost than if unplanned.
14 Other Risk Mitigation Activities
14.1 General
As described in the previous section, inspection is often an effective method of risk management. However, inspection may not always provide sufficient risk mitigation or may not be the most cost effective method. The purpose of this section is to describe other methods of risk mitigation. This list is not meant to be all inclusive. These risk mitigation activities fall into one or more of the following:
a) reduce the magnitude of consequence,
b) reduce the POF,
c) enhance the survivability of the facility and people to the consequence,
d) mitigate the primary source of consequence.
14.2 Equipment Replacement and Repair
When equipment deterioration has reached a point that the risk of failure cannot be managed to an acceptable level, replacement/repair is often the only way to mitigate the risk.
14.3 Evaluating Flaws for Fitness-For-Service
Inspection may identify flaws in equipment. A Fitness-For-Service assessment (e.g. API 579-1/ASME FFS-1) may be performed to determine if the equipment may continue to be safely operated, under what conditions and for what time period. A Fitness-For-Service analysis can also be performed to determine what size flaws, if found in future inspections, would require repair or equipment replacement.
14.4 Equipment Modification, Redesign, and Rerating
Modification and redesign of equipment, utilizing a rigorous MOC process, can provide mitigation of POF. Examples include:
a) change of metallurgy,
b) addition of protective linings and coatings,
c) removal of deadlegs,
d) increased corrosion allowance,
e) physical changes that will help to control/minimize deterioration,
Copyright American Petroleum Institute Provided by IHS under license with API
Not for ResaleNo reproduction or networking permitted without license from IHS
--`,,```,,,,````-`-`,,`,,`,`,,`---
//^:^
^#^~
^^"~
~:~"
~$$"
~$^"
#:*~
:^#~
#~^~
@~:
^:#*
:^$:
$~:*
"\\
RISK-BASED INSPECTION 69
f) insulation improvements,
g) injection point design changes,
h) resizing of the relief device.
Sometimes equipment is over designed for the process conditions. Rerating the equipment may result in a reduction of the POF assessed for that item.
14.5 Emergency Isolation
Emergency isolation capability can reduce toxic, explosion or fire consequences in the event of a release. Proper location of the isolation valves is key to successful risk mitigation. Remote operation is usually required to provide significant risk reduction. To mitigate flammable and explosion risk, operations need to be able to detect the release and actuate the isolation valves quickly (within a few minutes). Longer response times may still mitigate effects of ongoing fires or toxic releases.
14.6 Emergency Depressurizing/Deinventorying
This method reduces the amount and rate of release. Like emergency isolation, the emergency depressurizing and/or deinventory should be achieved within a few minutes to affect explosion/fire risk.
14.7 Modify Process
Mitigation of the primary source of consequence may be achieved by changing the process towards less hazardous conditions. As with physical modifications, any process changes should be conducted only after the application of a rigorous MOC process. Some examples include:
a) reduce temperature to below atmospheric pressure boiling point to reduce size of cloud;
b) substitute a less hazardous material (e.g. high flash solvent for a low flash solvent);
c) use a continuous process instead of a batch operation, where applicable;
d) dilute or eliminate hazardous substances.
Mitigation of the sources of corrosion can be achieved by changing the process towards less corrosive conditions. Some examples include:
a) process water washing to remove corrosive materials (e.g. salts);
b) addition of neutralizing or inhibitor chemicals;
c) removal of contaminants with process equipment (e.g. absorbers, filters);
d) protection of downtime corrosion (e.g. PTASCC protection).
14.8 Establish IOWs
IOWs should be established for process parameters (both physical and chemical) that could impact equipment integrity if not properly controlled. Examples of the process parameters include temperatures, pressures, fluid velocities, pH, flow rates, chemical or water injection rates, levels of corrosive constituents, chemical composition, etc. Key process parameters for IOWs should be identified and implemented, upper and lower limits established, as
Copyright American Petroleum Institute Provided by IHS under license with API
Not for ResaleNo reproduction or networking permitted without license from IHS
--`,,```,,,,````-`-`,,`,,`,`,,`---
//^:^^#^~^^"~~:~"~$$"~$^"#:*~:^#~#~^~@~:^:#*:^$:$~:*"\\

70 API RECOMMENDED PRACTICE 580
needed, and deviations from these limits should be brought to the attention of inspection/engineering personnel. Particular attention to monitoring IOWs should also be provided during start-ups, shutdowns and significant process upsets.
14.9 Reduce Inventory
This method reduces the magnitude of consequence. Some examples include:
a) reduce/eliminate storage of hazardous feedstocks or intermediate products;
b) modify process control to permit a reduction in inventory contained in surge drums, reflux drums or other in-process inventories;
c) modify process operations to require less inventory/hold-up;
d) substitute gas phase technology for liquid phase.
14.10 Water Spray/Deluge
This method can reduce fire damage and minimize or prevent escalation. A properly designed and operating system can greatly reduce the probability that a vessel exposed to fire will BLEVE.
14.11 Water Curtain
Water sprays entrap large amounts of air into a cloud. Water curtains mitigate water soluble vapor clouds by absorption as well as dilution and insoluble vapors (including most flammables) by air dilution. Early activation is required in order to achieve significant risk reduction. The curtain should preferably be between the release location and ignition sources (e.g. furnaces) or locations where people are likely to be present. Design is critical for flammables, since the water curtain can enhance flame speed under some circumstances.
14.12 Blast-resistant Construction
Utilizing blast resistant construction provides mitigation of the damage caused by explosions and may prevent escalation of the incident. When used for buildings (see API 752), it may provide personnel protection from the effects of an explosion. This may also be useful for equipment critical to emergency response, critical instrument/control lines, etc.
14.13 Others
a) spill detector;
b) steam or air curtains;
c) fireproofing;
d) instrumentation (interlocks, shutdown systems, alarms, etc.);
e) inerting/gas blanketing;
f) ventilation of buildings and enclosed structures;
g) piping redesign;
Copyright American Petroleum Institute Provided by IHS under license with API
Not for ResaleNo reproduction or networking permitted without license from IHS
--`,,```,,,,````-`-`,,`,,`,`,,`---
//^:^
^#^~
^^"~
~:~"
~$$"
~$^"
#:*~
:^#~
#~^~
@~:
^:#*
:^$:
$~:*
"\\
RISK-BASED INSPECTION 71
h) mechanical flow restriction;
i) ignition source control;
j) improved design, assembly and installation standards;
k) improvement in PSM program;
l) emergency evacuation;
m) shelters (safe havens);
n) toxic scrubbers on building vents;
o) spill detectors and containment;
p) facility siting and/or layout;
q) condition monitoring;
r) improved training and procedures;
s) emergency feed stops;
t) improved fire suppression systems.
15 Reassessment and Updating RBI Assessments
15.1 RBI Reassessments
RBI is a dynamic tool that can provide current and projected future risk evaluations. However, these evaluations are based on data and knowledge at the time of the assessment. As time goes by, changes are inevitable and the results from the RBI assessment should be updated.
It is important to maintain and update an RBI program to ensure that the most recent inspection, process, and maintenance information is included. The results of inspections, changes in process conditions and implementation of maintenance practices can all have significant effects on risks, and therefore the inspection plan and can trigger the need to perform a reassessment.
15.2 Why Conduct an RBI Reassessment?
15.2.1 General
There are several events that will change risks and make it prudent to conduct an RBI reassessment. It is important that the facility have an effective MOC process that identifies when a reassessment is necessary. Sections 15.2.2 through 15.2.5 provide guidance on some key factors that could trigger an RBI reassessment.
15.2.2 Damage Mechanisms and Inspection Activities
Many damage mechanisms are time dependent. Typically, the RBI assessment will project deterioration at a continuous rate. In reality, the deterioration rate may vary over time. Through inspection activities, the rate of deterioration (both short-term and long-term) may be better defined.
Copyright American Petroleum Institute Provided by IHS under license with API
Not for ResaleNo reproduction or networking permitted without license from IHS
--`,,```,,,,````-`-`,,`,,`,`,,`---
//^:^
^#^~
^^"~
~:~"
~$$"
~$^"
#:*~
:^#~
#~^~
@~:
^:#*
:^$:
$~:*
"\\

72 API RECOMMENDED PRACTICE 580
Some damage mechanisms are independent of time (i.e. they occur only when there are specific conditions present). When those intermittent conditions occur, then an RBI reassessment may be appropriate. As part of the reassessments, it is important to review the operating histories over the past run, including exceedances and trends, to better predict if non-time dependent damage mechanisms could have occurred.
Inspection activities will increase information on the condition of the equipment. When inspection activities have been performed, the results should be reviewed to determine if an RBI reassessment is necessary.
15.2.3 Process and Hardware Changes
Changes in process conditions and hardware, such as equipment modifications or replacement, frequently can significantly alter the risks, and dictate the need for a reassessment. Process changes, in particular, have been linked to equipment failure from rapid or unexpected corrosion or cracking. This is particularly important for damage mechanisms that depend heavily on process conditions. Typical examples include chloride stress corrosion cracking of stainless steel, wet H2S cracking of carbon steel, and accelerated corrosion at points of salt deposition or at dew points and sour water corrosion. In each case, a change in process conditions can dramatically affect the corrosion rate or cracking tendencies. Hardware changes can also have an effect on risk. For example:
a) the POF can be affected by changes in the design of internals in a vessel or size and shape of piping systems that accelerate velocity related corrosion effects;
b) the COF can be affected by the relocation of a vessel to an area near an ignition source;
c) process conditions can be changed by hardware modifications, additions, deletions, or by-passing.
15.2.4 RBI Assessment Premise Change
The premises for the RBI assessment could change and have a significant impact on the risk results. Some of the possible changes could be:
a) increase or decrease in population density in the process unit,
b) change in construction material and repair/replacement costs,
c) change in product values,
d) revisions in safety and environmental laws and regulations,
e) revisions in the users risk management plan (such as changes in risk criteria),
f) change in feed amount or composition,
g) changes in operating conditions,
h) change in unit operating lengths between maintenance turnarounds.
15.2.5 The Effect of Mitigation Strategies
Strategies to mitigate risks such as installation of safety systems, repairs etc. should be monitored to ensure that they have successfully achieved the desired mitigation. Once a mitigation strategy is implemented, a reassessment of the risk may be performed to update the RBI program with the new current risks.
Copyright American Petroleum Institute Provided by IHS under license with API
Not for ResaleNo reproduction or networking permitted without license from IHS
--`,,```,,,,````-`-`,,`,,`,`,,`---
//^:^
^#^~
^^"~
~:~"
~$$"
~$^"
#:*~
:^#~
#~^~
@~:
^:#*
:^$:
$~:*
"\\
RISK-BASED INSPECTION 73
15.3 When to Conduct an RBI Reassessment
15.3.1 After Significant Changes
As discussed in 15.2, significant changes in risk can occur for a variety of reasons. Qualified personnel should evaluate each significant change to determine the potential for a change in risk. It may be desirable to conduct an RBI reassessment after significant changes in process conditions, damage mechanisms/rates/severities or RBI premises.
15.3.2 After a Set Time Period
Although significant changes may not have occurred, over time many small changes may occur and cumulatively cause significant changes in the RBI assessment. Users should set default maximum time periods for reassessments. The governing inspection codes (such as API 510, API 570, and API 653) and jurisdictional regulations, if any, should be reviewed in this context.
15.3.3 After Implementation of Risk Mitigation Strategies
Once a mitigation strategy is implemented, it is prudent to determine how effective the strategy was in reducing the risk to an acceptable level. This should be reflected in a reassessment of the risk and appropriate update in the documentation.
15.3.4 Before and After Maintenance Turnarounds
As part of the planning for a maintenance turnaround, it is usually useful to perform an RBI reassessment. This can become a first step in planning the turnaround to ensure that the work effort is focused on the higher risk equipment items and on issues that might affect the ability to achieve the premised operating run time in a safe, economic, and environmentally sound manner.
Since a large number of inspection, repairs, and modifications are performed during a typical maintenance turnaround, it may be useful to update an assessment soon after the turnaround to reflect the new risk levels.
16 Roles, Responsibilities, Training, and Qualifications
16.1 Team Approach
RBI requires data gathering from many sources, specialized analysis, such as risk analysis, financial analysis, materials and corrosion engineering, mechanical engineering, inspection, etc. followed by risk management decision-making. Generally, one individual does not have the background or skills to single-handedly conduct the entire study effectively. Usually, a team of people, with the requisite skills and background, is needed to conduct an effective RBI assessment. RBI analyses should be conducted as a project with plant management as stakeholders and a project team composed of the types of members depicted in 16.2.2 through 16.2.10.
16.2 Team Members, Roles, and Responsibilities
16.2.1 General
Depending on the application, some of the disciplines listed below may not be required. Some team members may be part-time due to limited input needs. It is also possible that not all the team members listed may be required if other team members have the required skill and knowledge of multiple disciplines. It is usually useful to have one of the team members serve as a facilitator for discussion sessions and team interactions.
Copyright American Petroleum Institute Provided by IHS under license with API
Not for ResaleNo reproduction or networking permitted without license from IHS
--`,,```,,,,````-`-`,,`,,`,`,,`---
//^:^^#^~^^"~~:~"~$$"~$^"#:*~:^#~#~^~@~:^:#*:^$:$~:*"\\
74 API RECOMMENDED PRACTICE 580
16.2.2 Team Leader
The team leader may be any one of the below mentioned team members. The team leader should be a full-time team member, and should preferably be a stakeholder in the facility/equipment being analyzed. In cases where the team leader is unfamiliar with the facility to be evaluated, he or she should be familiar with the RBI methodology employed and the types of processes to be assessed. The team leader may be knowledgeable in one of the specialized fields required for RBI. The main function of the team leader should be to integrate the inputs, outputs, organizational structure, communications, etc. of the assessment team and to carry out the following responsibilities:
a) formation of the team and verifying that the team members have the necessary skills, experience and knowledge;
b) assuring that the study is conducted properly:
— data gathered is accurate,
— assumptions made are logical and documented,
— appropriate personnel are utilized to provide data and assumptions,
— appropriate quality and validity checks are employed on data gathered and on the data analysis;
c) preparing a report on the RBI assessment and distributing it to the appropriate stakeholders whom are either responsible for decisions on managing risks or responsible for implementing actions to mitigate the risks;
d) following up to assure that the appropriate risk mitigation actions have been implemented.
16.2.3 Equipment Inspector or Inspection Specialist
The equipment inspector or inspection specialist is generally responsible for gathering data on the condition and history of equipment in the study. This condition data should include the new/design condition and current condition. Generally, this information will be located in equipment inspection and maintenance files. If condition data are unavailable, the inspector/specialist, in conjunction with the corrosion specialist, should provide predictions of the current condition. The inspector/specialist and materials and corrosion specialist are also responsible for assessing the effectiveness of past inspections. The equipment inspector/inspection specialist is usually responsible for implementing the recommended inspection plan derived from the RBI assessment.
16.2.4 Corrosion Specialist
The corrosion specialist is responsible for assessing the types of damage mechanisms and their applicability and severity to the equipment considering the process conditions, environment, metallurgy, age, etc., of the equipment. This specialist should compare this assessment to the actual condition of the equipment, determine the reason for differences between predicted and actual condition, and provide guidance on damage mechanisms, rates or severity to be used in the RBI assessment. Part of this comparison should include evaluating the appropriateness of the inspections in relation to the damage mechanism. This specialist also should provide recommendations on methods of mitigating the POF (such as changes in metallurgy, addition of inhibition, addition of coatings/linings, etc.) and methods of monitoring the process for possible changes in damage rates (such as pH monitoring, corrosion rate monitoring, contaminant monitoring, etc.).
16.2.5 Process Specialist
The process specialist is responsible for the provision of process condition information. This information generally will be in the form of process flow sheets. The process specialist is responsible for documenting variations in the process conditions due to normal occurrences (such as start-ups and shutdowns) and abnormal occurrences. The process specialist is responsible for describing the composition and variability of all the process fluids/gases as well as their
Copyright American Petroleum Institute Provided by IHS under license with API
Not for ResaleNo reproduction or networking permitted without license from IHS
--`,,```,,,,````-`-`,,`,,`,`,,`---
//^:^
^#^~
^^"~
~:~"
~$$"
~$^"
#:*~
:^#~
#~^~
@~:
^:#*
:^$:
$~:*
"\\
RISK-BASED INSPECTION 75
potential toxicity and flammability. The process specialist should evaluate/recommend methods of risk mitigation (probability or consequence) through changes in process conditions.
16.2.6 Operations and Maintenance Personnel
Operations personnel are responsible for verifying that the facility/equipment is being operated within the parameters set out in the process operating window. They are responsible for providing data on occurrences when process deviated from the limits of the operating windows, and on any trends in the operating data over the past unit run, including IOW parameters. They are also responsible for verifying that equipment repairs/replacements/additions have been included in the equipment condition data supplied by the equipment inspector. Operations and maintenance are responsible for implementing recommendations that pertain to process or equipment modifications and monitoring.
16.2.7 Management
Management’s role is to provide sponsorship and resources (personnel and funding) for the RBI assessment. They are responsible for making decisions on risk management, establishing risk acceptance criteria and/or providing the framework/mechanism for others to make these decisions based on the results of the RBI assessment. Finally, management is responsible for providing the resources and follow-up system to implement the risk mitigation decisions.
16.2.8 Risk Analyst
This person(s) is responsible for assembling all of the data and carrying out the RBI analysis. This person(s) could be a separate specialist or one of the above team members and is typically responsible for:
a) defining data required from other team members,
b) defining accuracy levels for the data,
c) verifying through quality checks the soundness of data and assumptions,
d) inputting/transferring data into the computer program and running the program (if one is used),
e) quality control of data input/output,
f) manually calculating the measures of risk (if a computer program is not used),
g) displaying the results in an understandable way and preparing appropriate reports on the RBI analysis.
Furthermore, this person(s) should be a resource to the team conducting a cost/benefit analysis if it is deemed necessary.
16.2.9 Environmental and Safety Personnel
This person(s) is responsible for providing data on environmental and safety systems and regulations. He/she also is responsible for assessing/recommending ways to mitigate the COFs.
16.2.10 Financial/Business Personnel
This person(s) is responsible for providing data on the cost of the facility/equipment being analyzed and the financial impact of having pieces of equipment or the facility shut down. He/she also should recommend methods for mitigating the financial COF.
Copyright American Petroleum Institute Provided by IHS under license with API
Not for ResaleNo reproduction or networking permitted without license from IHS
--`,,```,,,,````-`-`,,`,,`,`,,`---
//^:^^#^~^^"~~:~"~$$"~$^"#:*~:^#~#~^~@~:^:#*:^$:$~:*"\\

76 API RECOMMENDED PRACTICE 580
16.3 Training and Qualifications for RBI Application
16.3.1 Risk Assessment Personnel
This person(s) should have a thorough understanding of risk analysis by education, training, and/or experience. He/she should have received detailed training on the RBI methodology and on the procedures being used for the RBI assessment so that he/she understands how the program operates and the vital issues that affect the final results.
Contractors that provide risk assessment personnel for conducting RBI analysis should have a program of training and be able to document that their personnel are suitably qualified and experienced. Facility owners that have internal risk assessment personnel to conduct RBI analysis should have a procedure to document that their personnel are sufficiently qualified. The qualifications and training of the risk assessment personnel should be documented.
16.3.2 Other Team Members
The other team members should receive basic training on RBI methodology and on the software program(s) being used, to the extent they need to understand software to make their contribution. This training should be geared primarily to an understanding and effective application of RBI, as well as an understanding of how the data quality that is input by other team members can affect the results. This training could be provided by the risk assessment personnel on the RBI Team or by another person knowledgeable on RBI methodology and on the program(s) being used.
17 RBI Documentation and Recordkeeping
17.1 General
It is important that sufficient information is captured to fully document the RBI assessment. Typically, this documentation should include the following data and information:
a) the type of assessment, objectives, and boundaries;
b) a procedure for how the selected RBI methodology will be applied at the site (e.g. how to deal with all the options provided by the methodology);
c) team members performing the assessment and their skill set relative to RBI;
d) time frame over which the assessment is applicable;
e) the inputs and sources used to determine risk;
f) assumptions made during the assessment;
g) the risk assessment results (including information on probability and consequence);
h) follow-up mitigation strategy, if applicable, to manage risk;
i) the mitigated risk levels (i.e. residual risk after mitigation is implemented);
j) references to in-service codes or standards being applied.
Ideally, sufficient data should be captured and maintained such that the assessment can be recreated or updated at a later time by others who were not involved in the original assessment. To facilitate this, it is preferable to store the information in a computerized database. This will enhance the analysis, retrieval, and stewardship capabilities. The
Copyright American Petroleum Institute Provided by IHS under license with API
Not for ResaleNo reproduction or networking permitted without license from IHS
--`,,```,,,,````-`-`,,`,,`,`,,`---
//^:^^#^~^^"~~:~"~$$"~$^"#:*~:^#~#~^~@~:^:#*:^$:$~:*"\\

RISK-BASED INSPECTION 77
usefulness of the database will be particularly important in stewarding recommendations developed from the RBI assessment, and managing overall risk over the specified time frame.
17.2 RBI Methodology
The methodology used to perform the RBI analysis should be documented so that it is clear what type of assessment was performed. The basis for both the probability and consequences of failure should be documented. If a specific software program is used to perform the assessment, this also should be documented. The documentation should be sufficiently complete so that the basis and the logic for the decision making process can be checked or replicated at a later time.
17.3 RBI Personnel
The assessment of risk will depend on the knowledge, experience and judgment of the personnel or team performing the analysis. Therefore, a record of the team members involved should be captured, as well as the skill set that they bring to the team for RBI purposes. This will be helpful in understanding the basis for the risk assessment when the analysis is repeated or updated.
17.4 Time Frame
The level of risk is usually a function of time. This either is as a result of the time dependence of a damage mechanism, or simply the potential for changes in the operation of equipment. Therefore, the time frame over which the RBI analysis is applicable should be defined and captured in the final documentation. This will permit tracking and management of risk effectively over time.
17.5 Basis for the Assignment of Risk
The various inputs used to assess both the probability and COF should be captured. This should include, but not necessarily be limited to, the following information:
a) basic equipment data and inspection history critical to the assessment (e.g. operating conditions, materials of construction, service exposure, corrosion rate, inspection history, etc.);
b) operative and credible damage mechanisms;
c) criteria used to judge the severity of each damage mechanism;
d) anticipated failure mode(s) (e.g. leak, crack, or rupture);
e) key factors used to judge the severity of each failure mode;
f) criteria used to evaluate the various consequence categories, including safety, health, environmental and financial;
g) risk criteria used to evaluate the acceptability of the risks.
17.6 Assumptions Made to Assess Risk
Risk analysis, by its very nature, requires that certain assumptions be made regarding the nature and extent of equipment deterioration. Moreover, the assignment of failure mode and the severity of the contemplated event will invariably be based on a variety of assumptions, regardless of whether the analysis is quantitative or qualitative. To understand the basis for the overall risk, it is essential that these factors be captured in the final documentation.
Copyright American Petroleum Institute Provided by IHS under license with API
Not for ResaleNo reproduction or networking permitted without license from IHS
--`,,```,,,,````-`-`,,`,,`,`,,`---
//^:^
^#^~
^^"~
~:~"
~$$"
~$^"
#:*~
:^#~
#~^~
@~:
^:#*
:^$:
$~:*
"\\

78 API RECOMMENDED PRACTICE 580
Clearly documenting the key assumptions made during the analysis of probability and consequence will greatly enhance the capability to either recreate or update the RBI assessment.
17.7 Risk Assessment Results
The probability, consequence and risk results should be captured in the documentation. For items that require risk mitigation, the recommendations for and results after mitigation should be documented as well.
17.8 Mitigation and Follow-up
One of the most important aspects of managing risk through RBI is the development and use of mitigation strategies. Therefore, the specific risk mitigation required to reduce either probability or consequence should be documented in the assessment. The mitigation “credit” assigned to a particular action should be captured along with any time dependence. The methodology, process and person(s) responsible for implementation of any mitigation should also be documented.
17.9 Applicable Codes, Standards, and Government Regulations
Since various codes, standards and governmental regulations cover the inspection for most pressure equipment, it will be important to reference these documents as part of the RBI assessment. This is particularly important where implementation of RBI is used to reduce either the extent or frequency of inspection. See Section 3 for a listing of some relevant codes and standards.
18 Summary of Risk-Based Inspection Pitfalls
18.1 General
The following is a bulletized summary list of potential pitfalls covered in previous sections of this RP that could lead to less than adequate risk management results from using RBI. It can be used as checklist to review the RBI work process or to audit the effectiveness of an RBI program.
18.2 Planning
— Not defining clear objectives and goals for the RBI process.
— Not screening multi-units to know where to use RBI first.
— Not defining the physical and operating boundaries adequately.
— Not defining the operating time period for the risk assessment.
— Not adequately defining the time required and resources needed for the project.
— Not having full management support for the necessary RBI resources.
— Unrealistic expectations for the results of RBI.
Copyright American Petroleum Institute Provided by IHS under license with API
Not for ResaleNo reproduction or networking permitted without license from IHS
--`,,```,,,,````-`-`,,`,,`,`,,`---
//^:^^#^~^^"~~:~"~$$"~$^"#:*~:^#~#~^~@~:^:#*:^$:$~:*"\\
RISK-BASED INSPECTION 79
18.3 Data and Information Collection
— Not understanding all the data needs.
— Not identifying all the appropriate sources of data/information.
— Failing to collect all the data/information needed.
— Dealing with poor quality data.
— Not verifying the data to ensure quality.
18.4 Damage Mechanisms and Failure Modes
— Not identifying all the probable and credible damage mechanism and failure modes.
— Improperly ruling out damage mechanisms thought to be inactive.
— Operating outside the established IOWs or not properly identifying the correct IOW limits.
— Not understanding the impact of damage mechanisms on pressure equipment resulting from operating outside the IOW.
— Using software or methodologies that do not cover all active damage mechanisms.
— Inadequate definition of failure modes associated with each damage mechanism.
— Inadequate definition of damage rates for each damage mechanism.
18.5 Assessing POF
— Not addressing all probably and credible damage mechanisms when determining POF.
— Not understanding the interaction of multiple damage mechanisms in each piece of equipment.
— Not defining the specific POF units of measure to be used.
— Not using the most appropriate POF methodology for the situation.
— Using generic POFs instead of equipment specific POFs.
— Inadequate assessment of past inspection effectiveness.
— Inadequate assessment of susceptibility to each damage mechanism.
— Inadequate assessment of damage rates.
18.6 Assessing COF
— Not identifying all the appropriate incidents/events/outcomes of a failure.
— Not identifying all the appropriate consequences of each incident.
Copyright American Petroleum Institute Provided by IHS under license with API
Not for ResaleNo reproduction or networking permitted without license from IHS
--`,,```,,,,````-`-`,,`,,`,`,,`---
//^:^^#^~^^"~~:~"~$$"~$^"#:*~:^#~#~^~@~:^:#*:^$:$~:*"\\
80 API RECOMMENDED PRACTICE 580
— Not selecting the appropriate consequence assessment methodology.
— Not associating the right consequence with each failure mode.
— Not using the right units of measure for COF.
— Not knowing the right volume of fluid that can potentially be released.
— Not understanding the most likely release rate.
— Not understanding the likely form of discharge (i.e. gas, liquid, vapor).
— Not accounting for likely dispersion.
— Not adequately dealing with the all the potential hazards i.e. flammable, toxic, other effects.
— Inadequate knowledge of the effectiveness of hazard detection and mitigation systems installed.
— Not considering all potential impacts (i.e. safety, environmental, business, and repair).
— Not appreciating that consequence categories are typically relative measures, not absolute.
— Not adequately accounting for the full series of events that may lead to the full consequence.
— Not dealing with potential effects on other process units or facilities (i.e. “knock-on” effects).
18.7 Risk Determination, Assessment, and Management
— Using “black box” software without understanding all the calculations and algorithms.
— Failure to identify the specific consequence for each probable failure from each damage mechanism.
— Using inadequate assumptions in place of nonexisting or poor quality data/information.
— Using over or under estimated POFs/COFs in the risk determination.
— Not adequately handling uncertainties.
— Inadequate risk presentation or communication to stakeholders.
— Not having risk acceptance criteria/thresholds.
— Inappropriate or untimely risk management activities.
— Not understanding the real risk drivers (i.e. COF, POF, or both).
Copyright American Petroleum Institute Provided by IHS under license with API
Not for ResaleNo reproduction or networking permitted without license from IHS
--`,,```,,,,````-`-`,,`,,`,`,,`---
//^:^^#^~^^"~~:~"~$$"~$^"#:*~:^#~#~^~@~:^:#*:^$:$~:*"\\
RISK-BASED INSPECTION 81
18.8 Risk Management with Inspection Activities
— Inadequate inspection planning based on the risk assessment results.
— Lack of inspection plans for each probable/credible damage mechanism.
— Lack of an objective, structured inspection planning process for the risk results.
— Not appreciating when inspection activities have little or no value in risk mitigation.
— Not choosing the most appropriate inspection technique for risk reduction.
— Not choosing the right combination of inspection frequencies, techniques and practices.
— Lack of appropriate or timely mitigation based on the inspection findings.
— Inadequate planning for the resources necessary to implement the RBI plans.
18.9 Other Risk Management Activities
— Not appreciating the need for and implementing risk management activities other than inspection.
— Not communicating with other stakeholders about potential for other risk management activities.
18.10 Reassessment and Updating RBI Assessment
— Not appreciating the dynamic aspects of risks (i.e. changing with time).
— Not knowing when to do RBI reassessments and updates.
— Not having a good connection between MOC and RBI reassessments.
— Not doing reassessments on a timely basis.
— Not identifying impact of operational changes that may affect the IOW.
18.11 Roles, Responsibilities, Training, and Qualifications for RBI Team Members
— Not having specific designated roles for each RBI team member.
— Not having all the right RBI team members.
— Having team members with inadequate skills, experience, or knowledge.
— Inadequate training on the RBI work process.
— Not having an effective team leader.
— Not having a skilled risk analyst.
— Handing over the RBI project to consultants without adequate integration and overview.
Copyright American Petroleum Institute Provided by IHS under license with API
Not for ResaleNo reproduction or networking permitted without license from IHS
--`,,```,,,,````-`-`,,`,,`,`,,`---
//^:^
^#^~
^^"~
~:~"
~$$"
~$^"
#:*~
:^#~
#~^~
@~:
^:#*
:^$:
$~:*
"\\
82 API RECOMMENDED PRACTICE 580
18.12 RBI Documentation and Recordkeeping
— Not appreciating the value/need for full RBI documentation.
— Not understanding what needs to be documented.
— Not documenting all the assumptions made during the process and reasons therefore.
Copyright American Petroleum Institute Provided by IHS under license with API
Not for ResaleNo reproduction or networking permitted without license from IHS
--`,,```,,,,````-`-`,,`,,`,`,,`---
//^:^
^#^~
^^"~
~:~"
~$$"
~$^"
#:*~
:^#~
#~^~
@~:
^:#*
:^$:
$~:*
"\\

83
Bibliography
The following publications are offered as a guide to assist the user in the development of RBI programs. These references have been developed specifically for determining risk of process units and equipment, and/or developing RBI programs for process equipment. In these references, the user will find many more references and examples pertaining to risk assessments of process equipment.
[1] ASME PCC-3-2007, Inspection Planning Using Risk Based Methods
[2] API Publication 581, Base Resource Document on Risk-Based Inspection
[3] Risk-Based Inspection, Applications Handbook, American Society of Mechanical Engineers
[4] Risk-Based Inspection, Development of Guidelines, CRTD, Volumes 20 to 23, American Society of Mechanical Engineers, 1994
[5] Risk-Based Inspection, Development of Guidelines, CRTD, Volumes 20 to 22, American Society of Mechanical Engineers, 1992
[6] Guidelines for Quantitative Risk Assessment, Center for Chemical Process Safety, American Institute of Chemical Engineers, 1989
[7] A Collaborative Framework for Office of Pipeline Safety Cost-Benefit Analyses, September 2, 1999
[8] Economic Values for Evaluation of Federal Aviation Administration Investment and Regulatory Programs, FAA-APO-98-8, June 1998
The following references are more general in nature, but provide background development in the field of risk analysis and decision making, while some provide relevant examples.
[1] Pipeline Risk Management Manual, Muhlbauer, W.K., Gulf Publishing Company, Second Edition, 1996
[2] Engineering Economics and Investment Decision Methods, Stermole, F.J., Investment Evaluations Corporation, 1984
[3] Introduction to Decision Analysis, Skinner, D.C., Probabilistic Publishing, 1994
[4] Center for Process Safety, American Institute of Chemical Engineers (AIChE), Guidelines for Evaluating the Characteristics of Vapor Cloud Explosions, Flash Fires, and BLEVEs, New York: AIChE, 1994
[5] Center for Process Safety, American Institute of Chemical Engineers (AIChE), Guidelines for Use of Vapor Cloud Dispersion Models, New York, AIChE, 1987
[6] Center for Process Safety, American Institute of Chemical Engineers (AIChE), International Conference and Workshop on Modeling and Mitigating the Consequences of Accidental Releases of Hazardous Materials, September 26 to 29, 1995, New York: AIChE, 1995
[7] Federal Emergency Management Agency, U.S. Department of Transportation, U.S. Environmental Protection Agency, Handbook of Chemical Hazard Analysis Procedures, 1989
[8] Madsen, Warren W. and Robert C. Wagner, “An Accurate Methodology for Modeling the Characteristics of Explosion Effects,” Process Safety Progress, 13 (July 1994), pp. 171 to 175
Copyright American Petroleum Institute Provided by IHS under license with API
Not for ResaleNo reproduction or networking permitted without license from IHS
--`,,```,,,,````-`-`,,`,,`,`,,`---
//^:^
^#^~
^^"~
~:~"
~$$"
~$^"
#:*~
:^#~
#~^~
@~:
^:#*
:^$:
$~:*
"\\

84 API RECOMMENDED PRACTICE 580
[9] Mercx, W.P.M., D.M. Johnson, and J. Puttock, “Validation of Scaling Techniques for Experimental Vapor Cloud Explosion Investigations,” Process Safety Progress, 14 (April 1995), p. 120
[10] Mercx, W.P.M., R.M.M. van Wees, and G. Opschoor, “Current Research at TNO on Vapor Cloud Explosion Modeling, Process Safety Progress,” 12 (October 1993), p. 222
[11] Prugh, Richard W., “Quantitative Evaluation of Fireball Hazards”, Process Safety Progress, 13 (April 1994), pp. 83 to 91
[12] Scheuermann, Klaus P., “Studies About the Influence of Turbulence on the Course of Explosions,” Process Safety Progress, 13 (October 1994), p. 219
[13] TNO Bureau for Industrial Safety, Netherlands Organization for Applied Scientific Research, Methods for the Calculation of the Physical Effects of the Escape of Dangerous Material (Liquids and Gases), Voorburg, the Netherlands: TNO (Commissioned by Directorate-General of Labour), 1980
[14] TNO Bureau for Industrial Safety, Netherlands Organization for Applied Scientific Research, Methods for the Determination of Possible Deterioration to People and Objects Resulting from Releases of Hazardous Materials, Rijswijk, the Netherlands: TNO (Commissioned by Directorate-General of Labour), 1992
[15] Touma, Jawad S., et al., “Performance Evaluation of Dense Gas Dispersion Models,” Journal of Applied Meteorology, 34 (March 1995), 603 to 615
[16] U.S. Environmental Protection Agency, Federal Emergency Management Agency, U.S. Department of Transportation, Technical Guidance for Hazards Analysis, Emergency Planning for Extremely Hazardous Substances, December 1987
[17] U.S. Environmental Protection Agency, Office of Air Quality Planning and Standards, Workbook of Screening Techniques for Assessing Impacts of Toxic Air Pollutants, EPA-450/4-88-009, September 1988
[18] U.S. Environmental Protection Agency, Office of Air Quality Planning and Standards, Guidance on the Application of Refined Dispersion Models for Hazardous/Toxic Air Release, EPA-454/R-93-002, May 1993
[19] U.S. Environmental Protection Agency, Office of Pollution Prevention and Toxic Substances, Flammable Gases and Liquids and Their Hazards, EPA 744-R-94-002, February 1994
[20] MTI Publication: Implementing and Evergreening Risk-Based Inspection in Process Plants, 2005
Copyright American Petroleum Institute Provided by IHS under license with API
Not for ResaleNo reproduction or networking permitted without license from IHS
--`,,```,,,,````-`-`,,`,,`,`,,`---
//^:^^#^~^^"~~:~"~$$"~$^"#:*~:^#~#~^~@~:^:#*:^$:$~:*"\\

Copyright American Petroleum Institute Provided by IHS under license with API
Not for ResaleNo reproduction or networking permitted without license from IHS
--`,,```,,,,````-`-`,,`,,`,`,,`---
//^:^^#^~^^"~~:~"~$$"~$^"#:*~:^#~#~^~@~:^:#*:^$:$~:*"\\

Additional copies are available through IHSPhone Orders: 1-800-854-7179 (Toll-free in the U.S. and Canada)
303-397-7956 (Local and International)Fax Orders: 303-397-2740Online Orders: global.ihs.com
Information about API Publications, Programs and Servicesis available on the web at www.api.org
1220 L Street, NWWashington, DC 20005-4070USA
202.682.8000
Product No. C58002Copyright American Petroleum Institute Provided by IHS under license with API
Not for ResaleNo reproduction or networking permitted without license from IHS
--`,,```,,,,````-`-`,,`,,`,`,,`---
//^:^^#^~^^"~~:~"~$$"~$^"#:*~:^#~#~^~@~:^:#*:^$:$~:*"\\