risk-based sdv approaches-pros & cons, 2010
TRANSCRIPT

R E G U L A T O R Y A F F A I R S 745
Vadim Tantsyrra, MS, MA, DrPH (c)
Director, Data Management, Infinity Pharmaceuticals
Imogene Grimes, PhD Vice President. Statistics and Data Management, Infinity Pharmaceuticals
Jrlrs Mitchel, PhD, MBA President. Target Health Inc
Kayo Fendt, MSPH Director, Regulatory and
Quality. Duke Clinical Research Institute
Sorgiy Sirichenko, MS Data Strategist, PAREXEL
International
Joel Waters, MBA Associate Director, PDG
Technical Support. PAREXEL International
Jim Crowe, MS Director, Clinical and Nonclinical Statistics,
PAREXEL International
Barbara Tardiff, MD, MBA Corporate Vice President, Data Sciences, PAREXEL
lnterna tional
Key Words Source data verification;
Data quality; Site monitoring; Risk-based
approach; Key variables
Carrespondonce Address Vadim Tantsyura. MS. MA, DrPH (c), 68 Judith Drive,
Danbury. CT 068 I I (email: vadim. tantsyura @gmail
.corn).
Risk-based Source Data Verification Approaches: Pros and Cons
The high cost of source data vmjication (SDV), particulariy in large trials, has made it a target of scrutiny over the last decade. In addition, the positive impact (ie, cost-benefit ratio of SDV) on overall data quality is often ques- tioned. As a result, regulators and industry groups have started looking at alternative SDV approaches. This article evaluates the FDA- supported risk-based approach to SDV and provides a proposal on how to modifv the SDV process without undermining the validity and
integrity of the trial data. It summarizes alter- native approaches to 100% SDV and evalu- ates the advantages and disadvantages of risk- based SDV (rSDV). The regulatory, data quality, and cost implications of each approach are considered. The economics of rSDV are dis- cussed and the cost implications of rSDV are presented based on the results of exploratory analyses for four hypothetical trials in cardiol- ogy and oncology.
I N T R O D U C T I O N Source data verification (SDV) is one of many quality steps employed by sponsors and CROs to ensure clinical trial data validity. Other steps include training of clinical investigators and study personnel on the protocol and case re- port forms (CRFs), data validation procedures using programmed and manual data reviews, and, finally, audits of clinical sites. SDV, in par- ticular, allows for the evaluation of the confor- mity of clinical trial data presented in the CRF with data collected in the study subject source record at the clinical trial research site. SDV also ensures that "the reported trial data are ac- curate, complete, and verifiable from source documents" (1). As a component of study qual- ity management, SDV adds to the scientific and ethical integrity of the clinical trial. The extent of the SDV is often debated, as the GCP (ICH E6, 5.18.3 Extent and Nature of Monitoring) language leaves much room for interpretation:
The sponsor should ensure that the trials are ad- equately monitored. The sponsor should deter- mine the appropriate extent and nature of moni- toring. The determination of the extent and na- ture of monitoring should be based on considerations such as the objective, purpose, de- sign, complexity, blinding, size, and endpoints of the trial. In general there is a need for on-site
monitoring, before, during, and after the trial; however in exceptional circumstances the spon- sor may determine that central monitoring in conjunction with procedures such as investiga- tors training and meetings, and extensive written guidance can assure appropriate conduct of the trial in accordance with GCF! Statistically con- trolled sampling may be an acceptable method for selecting the data to be veri$ed. [Authors' emphasis]
Clinical site monitoring can consume up to 30% of overall trial costs (2). This high cost, particularly in large trials, has made it a target of criticism over the last decade. In addition, the positive impact (ie. cost-benefit ratio of SDV) on overall data quality is often questioned. For instance, significant resources are dedicat- ed to SDV of data that have no or minimal im- pact on study conclusions (eg, physical exami- nation, medical history, or vital signs, especially when they are not analysis variables). Second, SDV is a manual review process, and it has been well documented that the human review pro- cess is only 85% accurate (3). Third, while SDV is an effective way to capture certain types of errors such as protocol violations, transcription errors, and human errors in reading equipment or printouts, it is not as effective and efficient in dealing with other factors, such as transcrip- tion errors within the source document, infor-
Drug Information Journnl. Vd. 44,pp. 745-756.2010. 0092-8615/2010 Printed in the USA. All rights reserved. Copyright 0 2010 Drug Information Association. Inc.
Submitted for publication: March 25,2010 Accepted for publication: July 19, 2010 by guest on June 4, 2015dij.sagepub.comDownloaded from

Tantsyura et al. 746 R E G U L A T O R Y A F F A I R S
mation the study subject did not report or mis- reported, data the subject reported but site staff considered of no consequence, errors in the data that the monitor did not review, and fraud. Furthermore, "it [is] also observed that current monitoring processes often involve time- and labor-intensive techniques that are not actually required by regulations" (4). There- fore, it is not unreasonable to assume that when a focused SDV approach is used, there will be an increase in data quality since the site moni- tors will be able to focus their attention on criti- cal data elements that are vital for the analysis of the study data rather than being box check- ers. As a result, regulators and the industry alike have started looking at alternative SDV ap- proaches. This article summarizes current alter- native approaches to SDV and:
1. Critically evaluates the relative value of verifica- tion against source documents and records by data category, and evaluates the risks of not source verifying.
2. Evaluates the FDA-supported risk-based approach
3. Identifies alternative approaches to 100% SDV and evaluates the advantages, disadvantages, and risks associated with each approach.
4. Provides a proposal on how to modify the SDV pro- cess without undermining the validity and integri- ty of the clinical trial data.
to SDV.
L I T E R A T U R E R E V I E W A recent literature review found only 21 print sources in which monitoring objectives for clin- ical trials were mentioned (4). None of these publications provided a standard for reduced SDV. However, reduction in SDV is encouraged where it is solidly grounded on a risk-based ap- proach and other scientific principles.
EXTENT OF MONITORING Khosla et al. (5) cite "British standard specifica- tions for SDV," which are based on a random sample of 65 data points from 100 CRFs for 100 patients. If fewer than three errors are identi- fied, the data are accepted. If three or more er-
rors are identified, then the batch is rejected and the data are verified in greater detail. FDA (6) provides the following guidance:
From a scientific standpoint . . . it is recognized that the extent of documentation necessary de- pends on the particular study, the types of data involved, and the other evidence available to sup- port the claim. Therefore, the Agency is able to ac- cept different levels of documentation of data quality, as long as the adequacy of the scientific evidence can be assured.. . .
Industry-sponsored studies typically use exten- sive on-site and central monitoring and auditing procedures to assure data quality. Studies sup- ported by other sponsors may employ less strin- gent procedures and may use no on-site monitor- ing at all. An International Conference on Harmonization guideline on good clinical prac- tices, recently accepted internationally, empha- sizes that the extent of monitoring in a trial should be based on trial-specific factors ( e g , design, complexity, size, and type of study outcome mea- sures) and that different degrees of on-site moni- toring can be appropriate. In recent years, many credible and valuable studies conducted by gov- ernment or independent study groups, often with important mortality outcomes, had very little on- site monitoring. These studies have addressed quality control in other ways, such as by close control and review of documentation and exten- sive guidance and planning efforts with investiga- tors.
The FDA concept paper "Quality in FDA-Regu- lated Clinical Research" (7) suggests looking for alternative models for on-site monitoring:
For commercial studies done to develop pharma- ceutical products, on site monitoring of perfor- mance has become the rule, with sponsors visiting essentially all sites every 4 to 8 weeks to assure performance. This is costly, of course, and while it contributes to aspects of study quality, it is not re- ally practicable for large outcome trials, and has failed to detect real fraud. As interest in large trials grows, it is becoming apparent that the industry model is not feasible, without modification, for those trials.
by guest on June 4, 2015dij.sagepub.comDownloaded from

Risk-based Source Data Verification R E G U L A T O R Y A F F A I R S 747
ACCEPTABILITY OF SOME ERRORS AND
"Quality in FDA-Regulated Clinical Research" (7) recommends that sponsors "consider imple- menting risk-based approach to data collection, analysis, and monitoring." "It is commonly un- derstood that risk is defined as the combination of the probability of occurrence of harm and the severity of that harm. However, achieving a shared understanding of the application of risk management among diverse stakeholders is dif- ficult because each stakeholder might perceive different potential harms, place a different probability on each harm occurring, and attri- bute different severities to each harm" (8). "In- cluded in the risk assessment should be a dis- cussion of how the study design impacts the de- gree of monitoring needed and endpoints war- ranting active monitoring and review. For example, large simple trials with mortality end- points may require less monitoring and audit- ing than a randomized clinical trial with surro- gate endpoints or subjective endpoints" (section, Possible Steps Towards Better Quality in the Clinical Research Enterprise). Further- more, a risk-management approach assumes "certain characteristics of a clinical trial may trigger additional scrutiny e.g., no preceding experience with a country or sponsor, a spon- sor-investigator (individual investigator) clinical trial, or a clinical trial with a vulnerable subject population."
In an unpublished summary document (4) from a meeting of the Clinical Trials Transfor- mation Initiative (CTTI; https://www.trialstrans formation.org/) held in Washington, DC, on No- vember 4, 2009, the question was posed as to whether some level of error is acceptable within a clinical trial data set and, if so, whether inten- sive monitoring efforts-such as repeated site visits, source document verification, and CRF review-might be reduced or avoided with the understanding that these errors would not af- fect study results in any meaningful way. It was noted that, in trials attempting to demonstrate superiority of one treatment over another, ran- dom (ie, undirected) error in the effectiveness
RISK-BASED APPROACH assessments or, possibly, in meeting entry crite- ria will bias the results toward the null (ie, to- ward a finding of no difference), making a false positive finding unlikely but increasing the chance of a false negative. There is clearly a ma- jor interest in minimizing such errors. On the other hand, random error in a noninferiority trial will bias the results toward the alternative hypothesis (that there is no difference between the treatments), a major concern of regulators. The safety aspects of studies have properties similar to noninferiority studies, so that errors in critical safety assessments are very impor- tant. It was noted that important safety and ef- fectiveness conclusions can turn on a small number of cases, again suggesting major inter- est in ensuring accuracy of the important effec- tiveness and safety end points. It was proposed that data, such as covariate data describing pa- tient subsets, are almost always less critical to main study results and that a modest error rate could be acceptable in these data sets; for ex- ample, in data concerning date of birth or age, other illnesses, concomitant drugs unrelated to the disease being studied, non-endpoint evalu- ations, and less critical secondary endpoints. In light of these remarks, meeting participants came to a tentative consensus that some degree of error in noncritical data may be acceptable as long as important effectiveness and safety endpoints have been verified. In addition, risk- based monitoring, focusing on defects that would make a critical difference to data quality and patient safety, might be considered as a means of efficiently ensuring the data quality and subject protection without requiring inten- sive effort and incurring unnecessary costs.
FOCUS ON CRITICAL VARIABLES ICH E9 (9) suggests that "the form and content of the information collected.. . should focus on the data necessary to implement the planned analysis." The GCDMP (3) suggests focusing the quality checks on the variables that are "critical to the analysis," and the Assuring Data Quality section of GCDMP also suggests focus- ing resources on "only data that are essential
Drug Information Journal by guest on June 4, 2015dij.sagepub.comDownloaded from

Tantsyura et al. 748 R E G U L A T O R Y A F F A I R S
for the interpretation of trial results." The GCDMP adds, "It is not practical to design a qual- ity check for every possible error. Quality checks performed as part of data processing, such as data validation checks or edit checks should tar- get fields critical to the analysis, where errors are expected to be frequent, and it is reasonable to expect a high percent of error resolution."
Khosla et al. (5) recommend identifying some different categories of data, for example, critical and noncritical data, and to focus the SDV pro- cess on critical variables. Critical variables are the data that are focal to the aims and objec- tives of the study, and which must be correct. The noncritical data should also be correct, but if an item of such data is in error, it is not criti- cal to the outcome of the study. The authors recommend:
100% of the critical data should be verified against the source documents for every patient in the trial. Examples of critical data that should be checked for each subject include the following:
1. Informed consent to participate in the study; 2. Physician . . . notes, preferably on the hospi-
taVclinical stationery; 3. Primary efficacy end points; 4. Secondary efficacy end points; 5. Recording and reporting of serious adverse
events; 6. A confirmation in medication history or else-
where that the study drug was prescribed and in the specified dosage;
7. Conformance to the patient inclusion / exclu- sion criteria;
8. Visit dates as per the window period specified in the protocol of the study.
Non-critical data can be checked for a proportion of CRFs. The percentage varies from trial to trial and company to company. Generally it is 15 to 25%. (5)
EARLY ERROR DETECTION "Careful monitoring can ensure that difficulties are noticed early and their occurrence or recur- rence minimised" (9). This suggests that the SDV (and monitoring activities in general)
should not be evenly distributed over the course of a study, but skewed toward the earlier visits (eg, screening and baseline). CTTI echoes ICH in stating that "monitoring is most useful when it identifies errors early so that corrective training can be carried out" (4).
A L T E R N A T I V E S D V A P P R O A C H E S The following discussion covers five SDV ap- proaches for consideration. The first approach is a classic full-scale SDV that involves manual verification of 100% of the collected data against the source documents and records. The other four methods allow some reduction in SDV using different algorithms.
STANDARD (100%) SDV APPROACH The standard 100% SDV approach assumes that all the study data are verified against source documents and records. The major advantage is that there is the perception, at least, that this approach guarantees the highest data quality. However, because this approach lacks a formal and systematic risk assessment, this perception is not necessarily supported by the evidence or documented in the scientific literature. The ma- jor disadvantage of this approach is that its im- plementation is both resource and time inten- sive.
RANDOM SDV APPROACH The random SDV approach has two steps. This approach assumes starting (step 1) SDV at a low level (eg, only 10-20% of subjects, sites, or data points are randomly selected for SDV). The first step may include very few visits-screening and baseline, for instance. Then the quality of step 1 data is evaluated using either error rates or oth- erwise predetermined criteria, and the decision is made about adjusting the SDV level up (to SO-loo%), if necessary. Figure 1 outlines the process.
The major advantage of this approach is the possibility of significantly reducing the number of monitoring visits and their associated costs. However, the somewhat limited amount of data that the SDV adjustment decision is based upon may make it difficult to define the adequate lev- el of SDV. Also, random monitoring, without fo-
by guest on June 4, 2015dij.sagepub.comDownloaded from

Risk-based Source Data Verification R E G U L A T O R Y A F F A I R S 749
If data qwl i i isrues ore identified, then SDV k dusted to
a hiik bvel
Otherwise SDV ot
(1 0-20%1 the original level
t
cus on key variables, will most likely lead to low return on investment of monitoring time. In ad- dition, there are some anecdotal reports that European regulatory authorities have refused to accept a study for a major sponsor company that was using a random-like approach where there was no requirement to check screening or eligibility visits unless they appeared in the sta- tistical sample to be monitored. In this study, 28 out of 40 randomized subjects were found to be ineligible for the study.
DECLINING SDV APPROACH The declining SDV approach is a reverse ver- sion of the random SDV approach. The initial (screening and baseline) visits are verified at a 100% level and, if no significant issues are iden- tified (to be defined), then the adjustment to perform less SDV is made. Figure 2 outlines the process.
This approach may be viewed as an improved version of the random SDV approach, since the declining SDV approach improves the detection of early errors or issues relative to the random SDV approach. However, the return on invest- ment is still suboptimal due to inefficient re-
source utilization; that is, no distinction is made between high-value variables (ie, key safe- ty and efficacy) and low-value variables. In addi- tion, reducing SDV from 100% to 10-20% is not a trivial decision and could add complexity to the monitoring process, and may also require extensive negotiations with a regulatory agency such as the FDA. Finally, the resource utilization using this approach is highly variable and, thus, unpredictable. This fact alone makes the de- clining SDV approach extremely challenging in terms of planning and execution as well as re- source allocation and is ultimately least practi- cal from the monitoring perspective (especially if the monitoring is outsourced).
THREE-TIERED SDV APPROACH The underlying premise of the three-tiered SDV approach is that the level of SDV is commensu- rate with the value of the particular data points within the study. Figure 3 outlines the process.
The three-tiered SDV approach, at least theo- retically, leads to the most cost-effective utiliza- tion of site-monitoring time. Data quality is likely to be improved and, because of the more focused approach, site monitors can direct their
F I G U R E 1
Random SDV approach.
Drug lnformatton Journal by guest on June 4, 2015dij.sagepub.comDownloaded from

750 R E G U L A T O R Y A F F A I R S T a n t s p et al.
F I G U R E 2
Declining SDV approach.
F I G U R E 3 ~ ~
Three-tiered approach.
100% SDV I , Decision Point ' 4 10-20% SDV ,-
Sponsar sign-Off
> , 0 4 I , W: 100% SDV
(Ex: AEs, Dates, Dosing, I , Key Voriables of Analysis) I ,
0 rsr_2: 10-20% SDV I ,
, c of variables to be included in (Ex: Vtol Signs, ConMed, Lobs)
0 ,
I M: 0% SDV , (Ex: Physical Exam, Med. Hx) I ,
I ,
0 ,
I '
~
Sponsor Sign-Off
attention and efforts to the CRFs and data points that matter the most, and do not need to monitor the less important data. However, the complexity associated with the implementation of this approach may slow the acceptance of such a method.
MIXED APPROACH The mixed approach attempts to capitalize on the strengths of the declining SDV and three-
tiered SDV approaches, while at the same time reducing the complexity of the three-tiered SDV approach, and may be more feasible. The underlying premise of the three-tiered SDV ap- proach that the level of SDV should be com- mensurate with the value of the particular data points for the study is further extended by stressing the critical importance of the baseline and study endpoint values. In the mixed ap- proach, screening, baseline and study endpoint
by guest on June 4, 2015dij.sagepub.comDownloaded from

Risk-based Source Data Verikation R E G U L A T O R Y A F F A I R S 751
I I l00XsDV I
- 1 I
visits require 100% SDV. while all other CRFs require less extensive SDV. Other than the key value variables such as efficacy outcomes (ad- verse events, dosing information, visit dates, etc), most other variables could be monitored remotely, making it more appealing when elec- tronic data capture (EDC) is used. Figure 4 out- lines the process.
This approach should be easier for the site monitors to implement than the three-tiered SDV approach. The reason is twofold: first, the number of tiers is reduced from three to two, and second, for screening, baseline, and end- point visits, site monitors will review all data points, and thus do not need to remember which forms and data points are required for SDV and which are not.
The remote (or centralized) monitoring com- ponent, if employed, should further reduce monitoring costs without having a negative im- pact on data quality. Some data, such as hema- tology, chemistry, and urinalysis, are more con- ducive to remote monitoring than others. That is why the study team, in the monitoring plan, should make study-specific assessments whether to employ virtual monitoring and, if so. for what type of data. Based on this risk-based SDV (rSDV) approach, the baseline and study endpoints are deemed to be the most important, and these vis- its require on-site monitoring. All other visits
may (or may not) be considered by study teams as candidates for virtual monitoring.
The major objection to this methodology comes from the inability of the currently uti- lized EDC systems to support this rSDV ap- proach. If future EDC systems will support more flexible (data-point) SDV, that will likely accel- erate the acceptance of this particular rSDV ap- proach.
ECONOMICS OF RSDV For all of the approaches that result in reduced SDV, the following conclusions can be made:
Initial (fixed, per study) costs are increased be- cause of an additional investment of time and re- sources for risk assessment and SDV plan develop- ment. Variable (per study subject) costs, which are pro- portionate to the number of data points to be SDVed, are decreased due to the reduction in SDV from 100% to x%.
Based on personal experience of the authors and statements by the FDA at scientific meet- ings that typically only 30% of submitted data are the most essential for drug approvals, it is estimated that it is reasonable to expect a 50- 70% reduction [ie, x = 1 - (50 + 70%) = 30 + 50%) in the number of data points required for SDV. However, to verify this assessment, an ad-
F I G U R E 4
Mixed approach.
~~
Drug Information Journal by guest on June 4, 2015dij.sagepub.comDownloaded from
752 R E G U L A T O R Y A F F A I R S
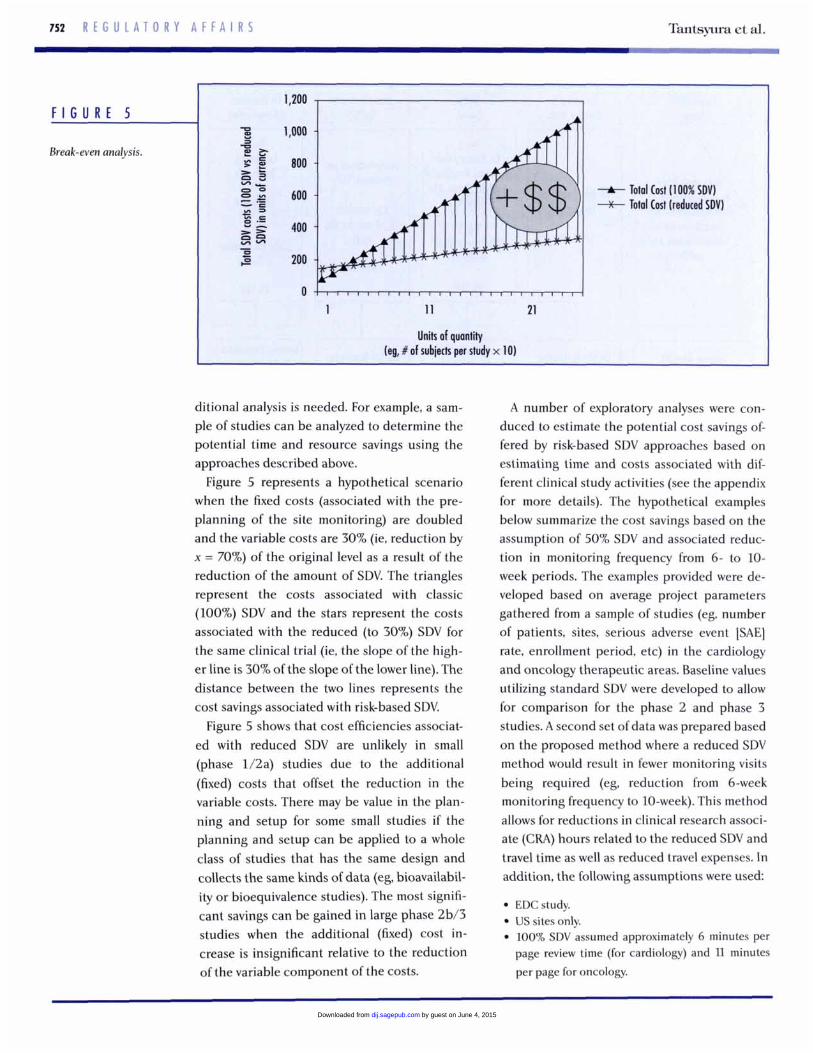
F I G U R E 5
Break-even analysis.
Tantsy~ua et al.
1,200
3 1
r E 800 B E n B zcs = P > > 400 852
200
>
-A- Total Cost (100% SDVI -x- Total Cost (reduced SDVI 600 - = gg
- e s
Units of quantity (eg, # of subiects per study x 10)
ditional analysis is needed. For example, a sam- ple of studies can be analyzed to determine the potential time and resource savings using the approaches described above.
Figure 5 represents a hypothetical scenario when the fixed costs (associated with the pre- planning of the site monitoring) are doubled and the variable costs are 30% (ie. reduction by x = 70%) of the original level as a result of the reduction of the amount of SDV. The triangles represent the costs associated with classic (100%) SDV and the stars represent the costs associated with the reduced (to 30%) SDV for the same clinical trial (ie, the slope of the high- er line is 30% of the slope of the lower line). The distance between the two lines represents the cost savings associated with risk-based SDV.
Figure 5 shows that cost efficiencies associat- ed with reduced SDV are unlikely in small (phase 1/2a) studies due to the additional (fixed) costs that offset the reduction in the variable costs. There may be value in the plan- ning and setup for some small studies if the planning and setup can be applied to a whole class of studies that has the same design and collects the same kinds of data (eg, bioavailabil- ity or bioequivalence studies). The most signifi- cant savings can be gained in large phase 2b/3 studies when the additional (fixed) cost in- crease is insignificant relative to the reduction of the variable component of the costs.
A number of exploratory analyses were con- duced to estimate the potential cost savings of- fered by risk-based SDV approaches based on estimating time and costs associated with dif- ferent clinical study activities (see the appendix for more details). The hypothetical examples below summarize the cost savings based on the assumption of 50% SDV and associated reduc- tion in monitoring frequency from 6- to 10- week periods. The examples provided were de- veloped based on average project parameters gathered from a sample of studies (eg, number of patients, sites, serious adverse event [SAE] rate, enrollment period, etc) in the cardiology and oncology therapeutic areas. Baseline values utilizing standard SDV were developed to allow for comparison for the phase 2 and phase 3 studies. A second set of data was prepared based on the proposed method where a reduced SDV method would result in fewer monitoring visits being required (eg, reduction from 6-week monitoring frequency to 10-week). This method allows for reductions in clinical research associ- ate (CRA) hours related to the reduced SDV and travel time as well as reduced travel expenses. In addition, the following assumptions were used
EDCstudy. US sites only. 100% SDV assumed approximately 6 minutes per page review time (for cardiology) and 11 minutes per page for oncology.
by guest on June 4, 2015dij.sagepub.comDownloaded from

Risk-based Source Data Verification R E G U L A T O R Y A F F A I R S 753
study PhaM 2 3 2 3 Study subiects (completed) 238 1,282 100 460 Study cost reduction 1 1.6% 14.3% 16.7% 23.5%
50% SDV assumed 1.5 minutes per page review time for pages that are not included in the SDV plan.
As indicated in Table 1, the expected savings are 11.6% for a typical cardiology phase 2 study (238 subjects) and 16.7% for a typical oncology phase 2 study (100 subjects). The potential sav- ings in a typical cardiology phase 3 trial (1,282 subjects) are expected to be 14.3%, and 23.5% in a typical oncology phase 3 trial (460 sub- jects). The impact of the reduced SDV on the costs comes from the reduction of per-page re- view time and resulting reduction of on-site time, assuming that on-site time is highly cor- related with per-page review time.
Exploratory analyses for phase 1 studies indi- cate that it is not realistic to expect a noticeable reduction in monitoring frequency for very ear- ly phase studies. As a result, the potential sav- ings from the reduced amount of SDV will be much smaller in phase 1 than the 11.6-16.7% in phase 2 and 14.3-23.5% in phase 3. Given the relatively modest monitoring budgets for phase 1 studies, the investment in the new pro- cess may not be justified. Thus, the standard 100% SDV approach may still be appropriate for phase 1 studies.
PReLIMINARY QUALITY ANALYSIS OF SDV REDUCTION The impact of SDV reduction on quality is con- troversial. It is often assumed that a higher de- gree of SDV correlates with higher data quality: however, no empirical or statistical evidence supports this hypothesis. In the final analysis, the focused approach to SDV grounded in a carefully executed risk assessment should gen- erate at least the same level of data quality. Ide-
ally, data quality benchmarks should be devel- oped and data collected over time for the ongoing assessment of the selected approach. Different data quality benchmarks may be needed in the different phases of drug develop- ment.
IMP LEM E N T A T l O N A P P R O A C H E S Proper risk assessment and management is a critical component of any rSDV approach. Study teams need to consider themselves in the position of regulatory medical and statistical reviewers and ask what data are most critical to evaluate for subject safety and evaluation from the efficacy perspective. The answers to these questions should guide the study team in devel- oping their study monitoring or SDV plan.
To implement the rSDV approach, it is neces- sary to address the following:
1. The rationale behind the classification and divi- sion of data elements into tiers.
2. The decision whether CRF-level or data-point-lev- el rSDV is appropriate. rSDV can be executed in two distinct flavors: (a) at the CRF level-when ei- ther all or none of the data points on a CRF are source verified, or (b) at the data-point level- when some data points on a CRF are verified and the other data points on the same CRF are not verified. From the efficiency perspective, the smaller studies are better suited for the CRF-level rSDV, and the larger studies are better suited for the data-point-level SDV.
3. Training, tools, and other strategies needed to en- sure that the study monitors know exactly what data are to be verified and what they need to focus on in verifying data (eg, subject eligibility during verification of screening and baseline data).
4. The impact of potential data errors (eg. random-
Drug Information Journal by guest on June 4, 2015dij.sagepub.comDownloaded from

714 R E G U L A T O R Y A F F A I R S Tantsyura et al.
ization and primary endpoint data) and prioritiza- tion and redundant approaches (eg, source verifi- cation plus data validation checks plus statistical consistency checks) on the final data-based deci- sions.
5. The larger set of strategies to ensure data quality and fraud detection. This should be emphasized in both communication and execution.
6. The activities associated with preparing for source data review (traveling to site, gathering docu- ments) in addition to that associated with verifica- tion of each data element.
7. The impact of e-source data and the electronic health record when data cannot be source verified in the classical sense. Under this scenario, these data need to be specified prospectively in the pro- tocol.
An appropriate organizational governance and operating model, with both steering and opera- tions components and allowing for participa- tion of relevant functions including medical, clinical, data management, statistics, project management, quality assurance, and regulatory affairs, is required to support planning and exe- cution.
Key artifacts should be prepared as documen- tation of planned approach and to guide execu- tion:
1. The SDV approach (100% SDV vs rSDV) that has been determined to be appropriate and feasible (eg, 100% SDV may be selected for phase 1/2a studies and rSDV for phase 2b/3)
2. A critical data point specification providing the
3. An overall risk-based monitoring plan (that in- necessary details at the data point level
cludes the rSDV specification document)
The following changes are foreseen in the clinical and data management practices that will accompany a wider spread of rSDV ap- proaches:
1. A high-level risk-based monitoring section of the protocols.
2. Training of clinical personnel in the risk-based monitoring plan.
3. Dissemination of the critical data point specifica- tion through data management will occur as part of the study team to facilitate the development of the data validating specification (DVS), data man- agement plan (DMP), quality plan, and other rele- vant documents.
C O N C L U S I O N 1. Clear understanding of risks and benefits of vari-
ous SDV and monitoring practices is necessary for identification of the most efficient and effective technique for a specific study.
2. The standard 100% SDV (option 1) is feasible and may be optimal for early phase studies because the relative value of each data point in early phase studies is much higher (given the small sample size).
3. Although the random SDV approach (option 2) appears to be the simplest to implement. it is the riskiest from the scientific and regulatory perspec- tives, and the implementation of this approach is not recommended.
4. The rSDV approaches (options 3-5: declining SDV, three-tiered, or mixed approaches) should lead to improved data quality and potentially re- duced time to database lock. There should be sig- nificant cost efficiencies in large (phase 2b/3) studies, and these approaches should be seriously considered for these clinical trials.
5. The mixed approach (option 5) has potential to become widely used. This approach appears to be most practical from a resource perspective due to minimal variability of resource demand over the course of a study relative to the other approaches (2-4).
A P P E N D I X : C O S T C A L C U L A T I O N S - T H R E E H Y P O T H E T I C A L S C E N A R I O S This section provides the details of the cost comparison for three hypothetical scenarios. Scenario 1 reflects a standard monitoring process with 100% SDV and the monitoring visits occurring every 6 weeks. Scenario 2 reflects the reduced (by 50%) SDV, but no reduction in the frequency of moni- toring visits (once per 6 weeks). Scenario 3 reflects the reduced (by 50%) SDV and the reduced
by guest on June 4, 2015dij.sagepub.comDownloaded from

Risk-based Source Data Vcrification R E G U L A T O R Y A F F A I R S 755
frequency of monitoring visits (once per 10 weeks). Each scenario considers four hypothetical US studies (two in cardiology and two in oncology).
The examples or scenarios provided are developed based on average project parameters gathered from a sample of proposals (eg, number of subjects, sites, SAE rate, enrollment period, etc) in the cardiology and oncology therapeutic areas. These parameters (carried through all three scenarios) are displayed in the following table.
w Area b r d i d o g y c a r d k l o s r o - b Y ~ Study PLan 2 3 2 3
S u b (enrdled) 276 1,389 120 543 subiects ~completed) 238 1,282 100 460 Shtdy sites (US) 28 106 28 75
subieashmened) 373 1,593 147 654
Enrdlment (weeks) 40 52 53 70 Treatment (weeks) 24 30 46 82 SAE rate (%) 0.41 0.53 0.83 0.83 Unique CRFs 22 19 30 30 CRFs per SUM 72 73 128 139 Minutes per poge 8 8 15 14
The first scenario assumes a standard monitoring visit frequency of one visit every 6 weeks.
TlmaPrrtkh ( a d l d o g y - o - b Y - StudypLaw 2 3 2 3 Monitoring frequency 6.0 6.0 6.0 6.0 Time on-site (hours) 8.0 8.2 7.2 7.9
The following table summarizes the changes in the parameters and assumptions for scenario 2 relative to standard (100%) SDV, scenario 1. As demonstrated below, if the monitoring frequency remains unchanged, the reduced SDV does not lead to a significant cost reduction.
I StudvPLaw 2 3 2 3 Monioringfreqwncy 6.0 6.0 6.0 6.0 I Time on-site (hours) 5.5 5.7 4.7 5.1
I
I Direct (SDV) cost reduction 3.1 % 1.9% 4.8% 6.9% I
I Travel expense reduction 0.0% 0.0% 0.4% 0.1 % I
I overall (total study cost) reduction 2.7% 1.7% 4.3% 6.1 % I
All the expense reductions in scenario 2 are relative to scenario 1.
Drug Momation Journal by guest on June 4, 2015dij.sagepub.comDownloaded from

Tantsyura et al. 716 R E G U L A T O R Y A F F A I R S
The final table was prepared based on the method where a reduced SDV approach would result in fewer monitoring visits being required (eg, reduction from 6-week to 10-week monitoring frequen- cy). This method allows for reductions in CRA hours related to the reduced SDV and travel time as well as reduced travel expenses.
‘ V k O-baYO-baY 2 3 2 3
~
S * h l - n a h 10.6 10.0 10.0 10.5 Time on-site (hours) 7.0 8.0 7.0 7.8 Direct (SDV) cost reduaion 10.4% 12.7% 15.2% 22.1% ldexpenser#ludion 21.6% 25.8% 27.5% 33.5% ovemu (tot01 study cost) red- 11.6% 14.3% 16.7% 23.5%
All expense reductions in scenario 3 are relative to scenario 1. As demonstrated in the table above, a reduction in SDV coupled with a reduction in monitoring frequency leads to significant (11.6- 23.5%) cost savings.
R E F E R E N C E S 1. International Conference on Harmonisation. ICH
Topic E6 (Rl) Guideline for good clinical prac- tice, July 2002.
2. Institute of Medicine. Assuring Data Quality and Validity in Clinical Trials for Regulatory Decision Mak- ing. Workshop Report. Washington, DC National Academies Press; 1999.
3. Society for Clinical Data Management. Good Clini- cal Data Management Practices, Version 5.2005.
4. Summary document-Workstream 2, Effective and efficient monitoring as a component of quali- ty in the conduct of clinical trials. Paper present- ed at meeting of Clinical Trials Transformation Initiative, Rockville, MD, November 4,2009.
5. Khosla R. Verma DD, Kapur A, Khosla S. Efficient source data verification. Indian J Pharmacol. 200032:180- 186.
6. US Food and Drug Administration. Guidance for industry: providing clinical evidence of effective- ness for human drug and biological products. May 1998.
Z US Food and Drug Administration. Concept pa- per: quality in FDA-regulated clinical research background to HSP/BIMO Workshop 5/10- 5/11/07. April 26, 2007. http://www.fda.gov/oc/ initiatives/criticalpath/clinicalresearch.html (ac- cessed May 25,2009).
8. International Conference on Harmonisation. ICH Q9: ICH harmonised tripartite guideline: quality risk management. November 9,2005. http://www .ich.org/LOB/media/MEDlA1957.pdf (accessed February 1,2009).
9. International Conference on Harmonisation. ICH topic E9: statistical principles for clinical trials. September 1998.
The authors report no relevant relationships to disclose.
by guest on June 4, 2015dij.sagepub.comDownloaded from