risk classification in animal disease...
TRANSCRIPT

Risk Classification in Animal Disease Prevention:
Who Benefits from Differentiated Policy?
Jarkko K. Niemi1), Tapani Lyytikäinen
2), Leena Sahlström
2),
Terhi Virtanen2) and Heikki Lehtonen
1)
1) MTT Agrifood Research Finland, Economic Research,
Luutnantintie 13, FI-00410 Helsinki, Finland
e-mail: [email protected]
2) Finnish Food Safety Authority Evira, Risk Assessment Unit,
Mustialankatu 3, FI-00790 Helsinki, Finland
e-mail: [email protected]
Selected Paper prepared for presentation at the Agricultural & Applied Economics
Association 2009 AAEA & ACCI Joint Annual Meeting, Milwaukee, Wisconsin, July
26-29, 2009
Authors gratefully acknowledge Ministry of Agriculture and Forestry and the National
Emergency Supply Agency for funding.
Copyright 2009 by Jarkko Niemi, Tapani Lyytikäinen, Leena Sahlström, Terhi Virtanen and
Heikki Lehtonen. All rights reserved. Readers may make verbatim copies of this document for
non-commercial purposes by any means, provided this copyright notice appears on all such
copies.

2
Risk classification of livestock farms can help stakeholders design and implement risk
management measures according to the possessed risk. Our goal is to examine how
differently pig farms may contribute to the societal costs of an animal disease outbreak,
how valuable this information is to different stakeholders, and how it can be used to
target risk management measures. We show that the costs of an outbreak starting from a
certain farm can be quantified for the entire sector using bio-economic models. In further
studies, this quantified risk can be differentiated so that farms and slaughterhouses
internalise the full cost of risk in production decisions and inhibit animal densities,
animal contact structures or other characteristics which pose a threat to the sector.
Potential benefits due to risk classification could be received by society and producers,
and in the long run also by consumers.
Key words: Risk classification, animal disease, simulation, partial-equilibrium, losses.
Introduction
Highly contagious animal diseases such as foot and mouth disease (FMD) have the
potential to cause devastating damage. Besides costly eradication measures an outbreak
can lead to problems in animal production: interruptions in production on uninfected
farms and unexpected reductions of animal product exports for an unknown period
followed by a drop in product prices in the short run (e.g. Paarlberg et al. 2008;

3
Schoenbaum and Disney 2003). As costs can be prohibitive, it is important that economic
agents take sufficient preventive measures to reduce the potential magnitude of
consequences.
Risk classification of livestock farms can help stakeholders to design and implement
risk management measures according to the possessed risk. For instance, society can
direct surveillance and early warning systems towards high-risk farms and promote
measures which reduce the farm’s risk to spread or receive a disease. Besides regulations,
society can use economic incentives to urge high-risk producers to apply stringent
biosecurity measures (c.f. Hennessy 2007a; Gramig, Horan, and Wolf 2009). Policies can
be designed so that farms are liable for outbreak costs in proportion to the risk which they
are predicted to pose to society. When doing so, policies can alter production decisions so
that production would not be excessively concentrated in high-risk areas (cf. Jansson,
Norell, and Rabinowicz 2005). This is due to the fact that producers can take true costs
into account in production decisions and hence production is decreased if a farm is
benefiting from a non-differentiated policy.
Regional herd density and animal transports are known to be critical determinants for
outbreak size and disease spread. However, focusing only on infected premises can result
in suboptimal policy, because consequential effects of disease can be decisive for the
choice of an economic disease policy. This article contributes an extension to previously
presented epidemiological risk classification (Lyytikäinen and Kallio 2008) by presenting
an approach which can quantify economic effects of farm-related risk. We aim to
quantify differences in risk to the extent that these differences are caused by variation

4
between farms in their characteristics such as regional herd density and contact patterns
affecting the magnitude of an outbreak. In developed approach, farms are divided into
four epidemiological risk categories and direct and indirect economic effects of disease
risk posed to public funds, producers and consumers, including the effects of trade
distortions, are estimated for each farm and risk class. We show that the costs of an
outbreak starting from a certain farm can be calculated for the entire sector by the joint
use of epidemiological and economic models. In further studies, this quantified risk can
be differentiated so that farms and slaughterhouses internalise the full cost of risk in
production decisions and inhibit animal densities and animal contact structures which
pose a threat to the sector. Finally, we contribute to the discussion about the role of
economic incentives in animal disease risk management.
Our goal is to analyze how differently pig farms may contribute to societal costs of an
animal disease outbreak, how valuable this information is to different stakeholders, and
how it can be used to target risk management measures. For clarity, we focus on a single
disease, FMD, but limit our analysis solely on the pig sector. The effects are simulated
conditional on the first infected farm by using numerical dynamic epidemiological and
economic models. This approach allows us to study how a certain farm contributes to
disease losses, including consequential effects due to disease spread and export
distortions, when it is the first farm which becomes infected in the country. Classification
uses data linked to risk factors which are of primary concern for the government when it
aims at mitigating disease. Finally, an analysis is made of the type of welfare effects
which farms belonging to certain risk class can cause.

5
Model
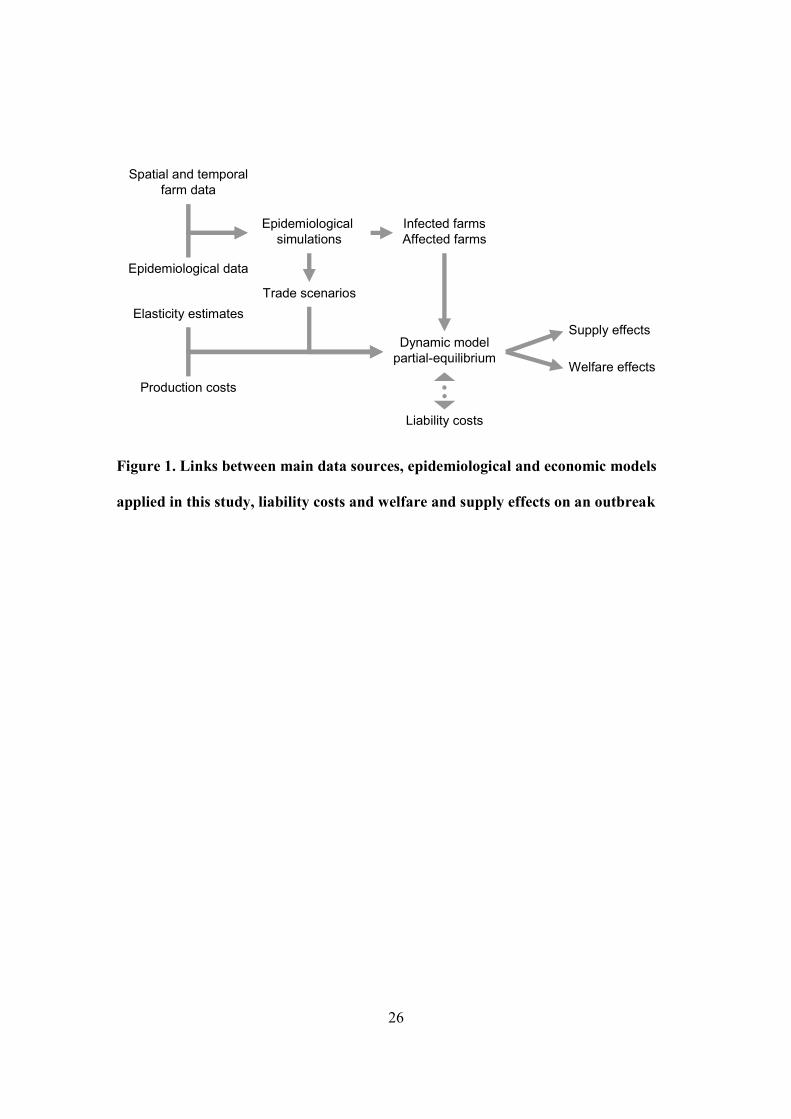
The spread of FMD among pig farms in Finland was simulated using an epidemiological
Monte Carlo simulation model which produced the number of infected farms at the end
of each outbreak, the duration of the outbreak and the identity of infected farms. These
data are further used in related economic models (figure 1). The analysis explored the
influences within the pig sector whereas possible other routes and spreading by other
production sectors were ignored. The model is described in more detail by Lyytikäinen
and Kallio (2008). The developed model resembles simulation models which have been
previously used to study the FMD control policies (e.g. Harvey et al. 2007; Mourits,
Nielen, and Léon 2002; Sanson 1993; Velthuis and Mourits 2007). These models use the
concept of transmission probabilities and contacts to estimate the number of infections.
Economic effects of an outbreak were estimated with a partial-equilibrium stochastic
dynamic programming model which has been previously presented by Niemi and
Lehtonen (2008). The model maximised the value of pig production to the society. It
solved demand, supply and market clearing price for each month endogenously. Demand
for pigmeat was stratified into domestic demand, two separate export markets and import
demand. Besides impacts on animal stock, an outbreak was assumed to reduce export
demand for pigmeat and meat intended for export markets to be consumed domestically.
The analysis took into account that prices and production were adjusted when export
distortions with unknown duration occurred. In each time period, the market was either in
state 1) ‘an outbreak with a full trade ban’, or in state 2) ‘no outbreak, no trade ban’.

6
Disease losses were calculated as the difference in the simulated value of the pig
production sector between these two market states. When the time elapsed, the state of
market was able to switch between these two alternatives and decisions could be updated
according to the observed state of nature. Other variables characterising the state of
market were the numbers of pigs in stock.
Epidemiological model
In the epidemiological model, disease transmission can occur when the susceptible farm
receives at least one infective contact. Five different categories and probabilities of a
contaminated contact to result in an infection were included in the model. These were 1)
the receiving of live pigs (a high-risk contact), 2) a visit by a livestock transportation
vehicle, 3) a person visiting animal holdings (a medium-risk contact), 4) a person visiting
at the farm (a low-risk contact), and 5) having an infected farm within a 1.5 km or a 1.5
to 3.0 km radius of the farm. The last contact type is often referred to as the
neighbourhood transmission, where the vector of spread is unknown and disease spread is
associated to the herd density in the region.
In contrast with some previous models, the applied model employed event-based
information as to the frequency of potential contacts and potential targets of contacts in
time and space. The model used an actual animal registry database in order to
characterise spatial and temporal patterns of animal transportation events including
animal transports between farms and between farm and slaughterhouse. The registry

7
provided data also for indentifying farms which were visited by certain animal
transportation vehicle during the same day, but the order of the visits was unknown.
Other personal contacts were constructed by two-mode networks connected by a separate
factor, where the temporal component is described as Poisson process.
The epidemiological simulation started from a situation where one randomly selected
farm had become infected with the disease but no other farm in the country was infected
and ended when all infected farms were detected and disinfected. Each infected farm
could induce further infections. Each farm’s infective period began 7 and ended 28 days
after it became infected. Approximately 278 iterations per primary infected farm, 0.9
million iterations in total, were performed.
The first detection took place on the primary farm whereas other farms could be
detected by producer, contact tracing or clinical and/or serological screening measures,
which are taken in a 3 km protection zone and in a surveillance zone with a 3 to 10 km
radius around each infected farm according to European Union (EU) legislation
(European Council 2003). Once detected, pigs kept on an infected farm were culled and
premises are cleaned and disinfected under the same Directive. The probability of disease
spread decreased after detection because in the established restriction zones, the contacts
were limited, the producers were obliged to inform the officials of any signs of disease,
and farms located in the restriction zones were visited by a screening team. Contact farms
outside the restriction zones could also face restriction measures.

8
Classification of farms
Farms were classified into four risk classes using an iterative K-means clustering method
as applied by Lyytikäinen and Kallio (2008). The risk classification was based on the
simulated results regarding 1) the probability of further spread from each primary farm,
2) the mean, and 3) the maximum number of subsequently infected farms during an
epidemic, and 4) the duration of the epidemic. These variables were log-transformed and
standardised with respect to their standard deviation before clustering.
Partial-equilibrium model
In this model, the social planner maximises the Bellman equation:
(1)
))}((),(
),,(),,(
),,(),,({max)(
1
rowrowrowEUEUEU
imp
q
impimpdom
q
domdom
}{
impdom
1ttt
tttt
ttttu
t
xux
uxux
uxuxxt
+++−
++
+= ∫∫
tt
tttttt
t
D
ttt
D
ttt
VEC
QQPQQP
dQQPdQQPVtt
β
,
where t=0,…,T, },,{ ban tradepigsowttt xxx=tx and },{ weightserve
tt uu=tu ,
s.t. )()1( sowservesowsow6 tttt xurxx δ−+−=+ (sow stock dynamics),
)( pigpigsowpig6 ttt xyxx δ−=+ (young animal stock),
)(Pr ban tradeban trade1 tt xx =+ (trade ban imposed / not imposed),
sowtx , pig
tx , bantx and )( TxTV are given,

9
where )( txtV is the maximised net present value of domestic pigmeat market (i.e.
consumer surplus plus producer profits); t is the time index measured in months; tx is the
vector of state variables; tu is the decision rule; ),,( domdomtt uxtt QP is the inverse demand
function for domestic demand which is used when integrating the area from q to market
allocation domtD below the demand curve; ),,( impimp
tt uxtt QP is the inverse demand
function for import demand which is used when integrating the area from q to market
allocation imptD below the demand curve minus purchase cost of imported meat;
),,( EUEUtt uxtt QP is the export price at the EU market as a function of the state and
control variables and quantity EUtQ exported to the EU market; ),,( rowrow
tt uxtt QP is the
export price at the non-EU market as a function of the state and control variables and
quantity rowtQ exported to the market outside the EU; )( tt u,xtC characterises production
costs incurred at period t; β is the discount factor; )(•E is the expectations operator;
)( 11 ++ txtV is the value of sector in the next period; ban tradetx is the state variable
characterising whether export market are closed at period t; sowtx is the number of sows
which farrowed at period t; pigtx is the number of pigs which are allocated to reproduction
or slaughtered at period t and which depends on the past number of sows; the functions
)( pigtxδ and )( sow
txδ indicate how the epidemic affects the number of pigs and sows on
farms; servetu is the control variable characterising the number of pigs currently allocated
to reproduction; weighttu is the decision variable characterising slaughter weight per hog; r

10
is the share of sows removed from the stock each period; pigy is the effective piglet yield
per sow; )(Pr ban tradetx characterises the probability of a trade ban occurring in the next
period as a function of the current period trade ban status; and )( TxTV is the value
function at the terminal period t=T. The time horizon was set large enough so that the
choice of T did not affect results.
The supply of pigmeat was determined by the decision vector and the disease:
(2) )())((),( sowsowsowweightpigservepigttttttt xrryxuxuxS δδ −+−−=tt ux ,
where ),( tt uxtS is the aggregate quantity of domestic pigmeat supplied to markets, sowy
is carcass weight of a sow and the other variables are as defined above. Production
adjustments in the short run were limited, because it takes time to grow pigs and it is
costly for a producer to remove animals prematurely.
The quantity of domestic pigmeat sold at different markets was set equal to the
production of pigmeat in the same period whereas imported meat was considered an
imperfect substitute for domestic meat. Hence, domestic meat prices adjusted and
markets cleared each month and also in the event of a trade distortion. Inverse demand
functions used to derive the market clearing price were based on four equations. These
equations represented domestic demand domtD , export demand to EU countries EU
tD and
non-EU countries rowtD , and import demand imp
tD :

11
(3) ),,( iiiittt pfD z= for i={dom, EU, row, imp},
where superscript i indicates respective market equation, itp is the price of pigmeat
demanded at market i, itz is a vector of predetermined variables such as substitute prices,
pigmeat prices in major import sources and seasonal and event-specific demand shifters
(dummy variables) which were held constant in the present analysis.
Due to biological constraints and marketing contracts between retailing and meat
processing, supply, demand and prices are quite inelastic in the very short run. If meat
deliveries to retail chains are agreed some months ahead of time, then large price changes
in the short term are mitigated by contracts. This aspect was taken into account in the
model as a factor limiting price changes in the very short run.
Although an outbreak was deemed quite short, trade distortions were able to last
several months and their duration was unknown. The probability that the trade distortions
are imposed in the period t+1 was modelled as a Poisson process which suits the logic of
dynamic programming (cf. Dixit and Pindyck 1994, pp. 85-87):
(4)
−−
=
imposed,not isban tradeif /1
exceedednot duration minimum and imposed isban tradeif 1
exceededduration minimum and imposed isban tradeif)/(11
)(Pr ban trade
λ
md
xt
where d is the expected duration (months) of trade distortions, m is the minimum duration
of the trade distortions and λ is the duration of period (months) that the country is

12
expected to stay disease-free when there is neither disease nor a trade ban imposed at the
moment. The minimum duration was associated to the hypothesis that trade restrictions
can be lifted after the disease has been eradicated from the country. Based on the World
Organisation for Animal Health recommendations (OIE 2007), it was assumed that they
are lifted on average 3 months after the cleaning, disinfection and screening measures in
the lastly detected farm have been completed. λ was zero in the present analysis.
Market parameter values
The model was parametrised and calibrated for the year 2006. Elasticity estimates were
the key variables in the demand system, because prices and quantities in the demand
equations were used in the logarithmic transformation. The following elasticity estimates
with respect to Finnish pigmeat price (+processor’s margin in export equations) were
applied: -0.14 for domestic demand, 0.87 for import demand, and -0.51 for export
demand to non-EU and -0.97 for export demand to EU destinations. Piglet production
costs were obtained from ProAgria1. The costs of hog productions were simulated using
the Finnish feeding recommendations and a growth model by Niemi (2006).
Direct costs of disease eradication
Official measures were implemented along the basic requirement defined by EU
regulations (European Council 2003). The material resources for each task were

13
estimated according to the terms of reference for veterinary officers with regard to a
FMD outbreak in Finland. Labour requirements for which expenditures are paid out of
public funds were estimated mainly by using data provided by Risk Solutions (2005) for
the United Kingdom. Unit prices for each resource were collected from official statistics
or requested from officials and firms capable of executing measures. The following costs
were used to calculate direct costs: €286 586 per infected farm + €6 029 per uninfected
farm in the protection zone + €467 per uninfected farm in the surveillance zone + €258
per culled hog + €827 per culled sow (including costs related to piglets). These figures
excluded compensations paid to producers.
Results
The probability of an epidemic outbreak increased with the risk class. While in class 1 the
disease spread from the primary farm only in 19% iterations, in class 4 it spread in 94%
iterations. Moreover, the number of infected farms and the duration of an outbreak also
increased with the risk class (table 1). The number of farms as well as the number of pigs
located in infected farms, protection and surveillance zones were simulated to increase
when the risk class was raised from class 1 to class 4.

14
Estimated losses and their variation according to risk measure of a farm
An outbreak was simulated to incur on average €21.1 (standard deviation €2.9 million)
million per outbreak in incidental losses to society. Producers and public funds suffered
losses whereas consumers were able to gain from an outbreak (table 2). However,
estimates were not normally distributed (see figure 2). There was quite a little overlap
between loss distributions simulated for risk classes 1 and 4, whereas distributions of
intermediate classes overlapped with those of other classes.
Average total losses (including producers, consumers, public funds and other
stakeholders) simulated for different risk classes were less than 10% of the market value
of annual pigmeat production. The losses were mainly caused by simulated decrease in
the pigmeat price which was due to export distortions. Trade losses were related to the
duration and the size-measures of an outbreak. However, even a very small and short
outbreak was able to incur more than €17 million in losses to society. Price reductions
were not necessarily larger in outbreaks associated to risk class 4 farms than in outbreaks
associated to risk class 1 farms, but export distortions were projected to last longer in
class 4 than in class 1.
Economic welfare losses and gains increased when a severe outbreak was considered
instead of an average outbreak. The severity of an outbreak was defined by using size
measures in table 1. It was defined for each farm as an average-sized outbreak caused by
that farm plus three times the standard deviation simulated for each item measured in
table 1. In the event of a severe outbreak, consumers gained on average €2.5 million more

15
per outbreak than in the average outcome, whereas producers lost 15.4, public funds €3.5
and society in total €16.4 million more per outbreak than in the average outcome.
There was a pattern in how the risk class affected stakeholders. In an average
outbreak, farms belonging to risk classes 1 and 2 (3 and 4) caused less (more) incidental
losses to producers, public funds and society in total than the average of all farms. On the
contrary consumers gained less (more) due to incidental trade restrictions when an
outbreak began from class 1 or 2 (3 or 4) farm than when the average of all farms was
counted.
Class 1 farms (low-risk farms) and class 4 farms (very high-risk farms) represented
the extreme results. Expected societal welfare losses simulated for farms belonging to
risk class 4 were €8.0 million (45%) higher than those simulated for farms belonging to
risk class 1. Risk class 4 farms incurred on average 22% higher incidental welfare losses
to producers and 20% higher incidental gains to consumers than farms belonging to risk
class 1. The largest, 18-fold, relative increase was simulated for public fund expenditures.
When epidemics became larger than the expected size of an outbreak, differences in
euro per outbreak loss between risk classes increased. For instance, a severe outbreak
beginning from a farm belonging to risk class 4 was able to incur 134% higher incidental
losses to society than a severe outbreak beginning from a farm belonging to risk class 1.
Although losses per primary infected farm were larger in risk class 4 than in risk class
1 (table 2), societal losses per animal kept in the primary infected farm could be smaller
when the farm belonged to risk class 4 than when it belonged to risk class 1. This result
was observed in the event of both an average and a severe outbreak. However,

16
expenditures of public funds per animal could be larger in risk class 4 than in risk class 1.
These results were due to the fact that the primary infected farm in class 4 had on average
3.5 times more hogs and 8.0 times more sows than an average primary farm in class 1. As
very high-risk farms (class 4) were on average larger than low-risk farms (class 1), they
may have economies of scale in disease prevention.
An increase in the probability of a further spread of the disease or in the expected
number of infected farms contributed to the farm’s probability to belong to risk class 4.
The probability of a further disease spread from the primary infected farm was associated
to the number of contacts leaving the farm within a certain time period. Moreover, it was
directly linked to farm density in the region. However, disease spread appeared to be an
inadequate statistics when forecasting disease losses, because the number of further
infected farms also affected losses (cf. figure 3). Although figure 3 suggests that the
relationship between the probability of a further spread and welfare effects could be non-
linear, a linear model with two mutually correlated variables, i.e. the probability of
further spread and expected outbreak size, already explained welfare effects of an
outbreak quite well (R2>80%). The relationship between these variables and welfare
effects to consumers and producers was nonlinear. The explanatory power of the model
was significantly reduced when the expected size of an outbreak was eliminated from the
model.

17
The effects of a liability cost imposed to the sector
Estimated economic losses can be allocated to the sector. Besides losses per outbreak, the
cost that a sector can be liable is affected by the probability of an occurrence of disease.
Next we illustrate how an increase in the liability costs internalised by the sector was
able to affect welfare in the long run, when the country is disease-free. As a partial result,
we examined a flat-rate cost to entire production volume. Our model suggested that when
the average cost of liability increased (ceteris paribus) by €10 per tonne of pigmeat
produced, society lost on average €0.7 million per year and equilibrium production
decreased by approximately 0.2%. The larger fee, the more production decreased and the
larger were losses. The effects were nonlinear and the losses were suffered by consumers.
The result was due to the fact that producers could ask a higher price for pigmeat when
the cost of risk increased. Due to different time scope, this result did not conflict with the
result that consumers were able to incidentally gain if an outbreak occurs.
Besides the effort put on preventive measures and funding outbreak losses, the model
can examine discrete events such that liability is imposed only when an outbreak occurs.
Discussion and conclusions
Results suggest that outbreak costs depend heavily on market effects of the disease.
Market effects further depend on export distortions and their duration, price elasticity of

18
demand and volume of production affected by restrictive measures. The role of market
effects is in line with previous studies on highly contagious animal diseases (e.g. Mangen
and Burrell 2003; Paarlberg et al. 2008; Schoenbaum and Disney 2003). Another major
factor affecting disease losses is the probability of disease introduction into the country.
This factor was not examined in here.
The results highlight the value of being able to identify farms according to their risk
in contrast to solely estimating average results. Variation in losses between farms is
considerable. For instance, the most risky farm was expected to incur producer losses
worth over half the annual operating margin of the sector whereas average losses in four
risk classes were 35% to 43% of the annual operating margin. Moreover, classification
criteria can be complex. Lyytikäinen and Kallio (2008) show that even if differences in
the average farm size between risk classes may exists, farm size is not a particularly good
indicator for the risk of spread of posed by a farm.
The quantification of differences in risk between farms requires that the risk is
analysed explicitly in both epidemiological and economic models. Models applied here
focused only on pig production. This may affect the consequences of a simulated
outbreak. Because the present simulation of a spread of FMD exclude ruminants, the
results presented here should be considered as an illustration of possible differences
between farms (but not their absolute scale). If the spread within the pig production
sector would be amplified by the other production sectors affected by the disease, the
differences between the primary infected farms could be even larger than presented here.
Nevertheless, the results show that there is a pattern between the probability of disease

19
spread, outbreak magnitude and welfare effects in the sector, and that differences
between farms in these items can be quantified.
Results suggest that it can be rational to consider the targeting of surveillance systems
and other risk management measures according to the risk category. If risk management
is stratified according to the risk posed by a farm, a high-risk farm could be required to
ensure higher than average effort for disease costs, because society could benefit from the
reduction of risk class. Farms which are able to spread disease rapidly can increase
outbreak expenditures of public funds considerably. If an outbreak occurs, reduced trade
distortions in the low-risk case would benefit also producers as a group, whereas
consumers might not benefit as much from excess supply during an outbreak. Differences
between risk classes even increase when the worst-case outcome for each farm is
analysed, which highlights the targeting of preventive efforts into high-risk farms.
Measures to reduce the risk level of high-risk farms could be related to issues such as the
intensity of surveillance, adjustments in the frequency or the routing of animal transports
from the farm or the introduction of more stringent bio-security practices.
Low-risk farms, consumers and society can be able to accrue further benefits over
time when differentiated liability decreases outbreak costs and re-allocates production to
farms with reduced costs (cf. Jansson, Norell, and Rabinowicz 2005). Information about
the risk posed by a certain farm is particularly valuable to low-risk farms. They could use
information about their low expected outbreak costs in order to reduce their production
costs, such as to justify certain preventive measures or reduced insurance fees per farm.

20
Ultimately, consumers and society as a whole can benefit if differentiated measures are
able to decrease the overall risk-rated unit production cost of pigmeat efficiently.
If the elevated liability cost would be imposed on high-risk farms, it could reduce
their profits and production. However, farms do not belong to the most risky class only
because of their own actions but also because of actions taken by other stakeholders,
including their slaughterhouse, animal trading partners and other farms located in the
vicinity. This highlights the production chain as an entity and suggests that increased
costs could be shared between contributors of the risk.
The rationale behind differentiating liability is to motivate high-risk farms and other
stakeholders which influence their risk to take measures which would reduce their risk
exposure. However, differentiation can result in a moral hazard problem, an adverse
selection problem, and discussion on moral or legal justification of the policy. Proper
analysis on incentive mechanisms therefore requires a decentralised setting such as the
one of Gramig, Horan and Wolf (2009) or Hennessy (2007b). The principal-agent
approach where stakeholders can choose from risk level-related compensation options is
useful as far as an agent can endogenously adjust the risk. On top of that, appropriately
targeted (public) measures are valuable to producers who are unable to reduce their risk.
In conclusion, further research based on risk classification offers opportunities to
design more cost-efficient preventive measures to combat contagious animal diseases. In
particular, it can increase stakeholder engagement in disease prevention by providing
more detailed economic criteria to stratify preventive efforts and economic bonuses or
fees according to the risk exposure factors.

21
References
Dixit, A.K., and R.S. Pindyck. 1994. Investment Under Uncertainty. New Jersey:
Princeton University Press.
European Council 2003. “Council Directive 2003/85/EC of 29 September 2003 on
Community Measures for the Control of Foot-and-mouth Disease Repealing
Directive 85/511/EEC and Decisions 89/531/EEC and 91/665/EEC and Amending
Directive 92/46/EEC.” Official Journal of the European Union L306:1-87.
Gramig, B.M., R.D. Horan, and C.A. Wolf. 2009. “Livestock Disease Indemnity Design
When Moral Hazard Is Followed by Adverse Selection.” American Journal of
Agricultural Economics in press.
Harvey, N., A. Reeves, M.A. Schoenbaum, F.J. Zagmutt-Vergara, C. Dube, A.E. Hill,
B.A. Corso, W.B McNab, C.I. Cartwright, and M.D. Salman, 2007. “The North
American Animal Disease Spread Model: A Simulation Model to Assist Decision
Making in Evaluating Animal Disease Incursions.” Preventive Veterinary Medicine
82:176-197.
Hennessy, D.A. 2007a. "Biosecurity and Spread of an Infectious Disease." American
Journal of Agricultural Economics 89:1226-1231.
—. 2007b. "Behavioral Incentives, Equilibrium Endemic Disease, and Health
Management Policy for Farmed Animals." American Journal of Agricultural
Economics 89:698–711.

22
Jansson, T., B. Norell, and E. Rabinowicz. 2006. “Modelling the Impact of Livestock
Disease Insurance in the European Union.” In D.L. Hoag, D.D. Thilmany, and S.R.
Koontz, eds. The economics of livestock insurance: concepts, issues and international
case studies. Cambridge: CABI Publishing. pp. 233-251.
Lyytikäinen, T., and E. Kallio. 2008. ”Risk Classification of Finnish Pig Farms by
Simulated Foot and Mouth Disease Spread.” In E.J. Peeler, L. Alban, A. Russell, and
the SVEPM Executive Committee, Eds. Society for Veterinary Epidemiology and
Preventive Medicine, Proceedings of a Meeting held at Liverpool, UK 26th-28th of
March 2008. pp. 285-300.
Mangen, M.-J.J., and A.M. Burrell. 2003. “Who Gains, Who Loses? Welfare Effects of
Classical Swine Fever Epidemics in the Netherlands.” European Review of
Agricultural Economics 30:125-154.
Mourits, M.C.M., M. Nielen, and C.D. Léon. 2002. “Effect of Control Measures on the
Course of Simulated Foot and Mouth Disease Epidemics Started on Different Farm
Types in Various Dutch Areas.” In F.D. Menzies, and S.W.J. Reid. Society for
Veterinary Epidemiology and Preventive Medicine Twentieth Anniversary
Proceedings of a Meeting held at University of Cambridge, UK, 3rd-5th April, 2002.
pp.190-200.
Niemi, J.K. 2006. “A Dynamic Programming Model for Optimising Feeding and
Slaughter Decisions Regarding Fattening Pigs. Agricultural and Food Science 15
(Supplement 1):1-121. Available at: http://urn.fi/URN:ISBN:951-729-997-4.

23
Niemi, J.K., and H. Lehtonen. 2008. “The Value of Market Uncertainty in a Livestock
Epidemic.” Poster paper presented at AAEA annual meeting, Orlando, FL, 27-29 July
2008. Available at: http://purl.umn.edu/6158
OIE 2007. Terrestrial Animal Health Code, 2007. Paris.
Paarlberg, P. L., A.H. Seitzinger, J.G. Lee, and K.H. Jr. Mathews. 2008. Economic
mpacts of foreign animal disease. Washington DC: U.S. Department of Agriculture,
ERS Econ. Res. Rep. No. 57, May.
Risk Solutions. 2005. “FMD CBA Epidemiological Model Specification and
Description.” A report for Defra, May 2005. Available at:
http://www.defra.gov.uk/animalh/diseases/fmd/pdf/epidem_model.pdf.
Sanson, R.L. 1993. “The Development of Decision Support System for an Animal
Disease Emergency. Ph.D. Thesis, Massey University, Palmerston North, New
Zealand.
Schoenbaum, M.A., and W.T. Disney. 2003. “Modeling Alternative Mitigation Strategies
for a Hypothetical Outbreak of Foot-and-mouth Disease in the United States.”
Preventive Veterinary Medicine 58:25-52.
Velthuis, A.G.J., and M.C.M. Mourits. 2007. “Effectiveness of Movement-prevention
Regulations to Reduce the Spread of Foot-and-mouth Disease in The Netherlands.”
Preventive Veterinary Medicine 82:262-281.
1 Production cost calculations for agricultural products obtained from ProAgria Association of Rural
Advisory Centres are in Finnish and available at: http://www.agronet.fi/cgi-bin/mkl/julk/malli.cgi

24
Table 1. Epidemiological outcomes of simulated outbreaks on average in each four
risk class and in all farms on average
Risk class 1 2 3 4 All
Probability of an epidemic 0.19 0.49 0.80 0.94 0.66
Expected number of infected farms1) 0.36 1.43 3.34 7.33 3.12
Number of farms in the risk class 340 1,093 1,196 598 3,227
Expected duration of an outbreak 32 35 40 45 38
Number of sows in the primary farm 15 29 59 119 55
Number of hogs in the primary farm 117 224 306 404 276
Total number of hogs in infected farms 29 100 241 554 229
Total number of sows in infected farms 221 756 1,684 3,773 1,602
Number of farms in protection zone 1 4 11 24 10
Number of sows in protection zone 47 237 629 1 418 581
Number of hogs in protection zone 264 1,422 3,835 9,026 3,602
Number of farms in surveillance zone 10 27 52 93 47
Number of sows in surveillance zone 520 1,571 3,237 5,926 2,884
Number of hogs in surveillance zone 2,892 8,618 17,730 31,617 15,649
1) In addition to primary infected farm

25
Table 2. Simulated welfare effects (€ million per average outbreak and € million per
severe outbreak) caused by a disease outbreak to Finnish pig producers, consumers,
public funds and society in total, and segregated according to the risk class of the
primary infected farm and on average in all pig farms
a) Welfare effects associated to a specific farm in an average outbreak
Risk class Consumers Producers Public funds Society in total
1 5.6 -23.2 -0.2 -17.8
2 6.0 -24.4 -0.8 -19.2
3 6.4 -26.1 -1.9 -21.5
4 6.8 -28.4 -4.2 -25.8
No classification 6.3 -25.6 -1.8 -21.1
b) Welfare effects associated to a specific farm in a severe outbreak1)
Risk class Consumers Producers Public funds Society in total
1 7.5 -29.2 -1.5 -23.2
2 8.5 -35.9 -3.4 -30.8
3 9.1 -43.0 -5.6 -39.5
4 9.1 -53.2 -10.1 -54.2
No classification 8.7 -41.0 -5.3 -37.5
1) Severe outbreak is defined as an outbreak having magnitude mean outbreak
+ three standard deviations in terms of the number of infected farms, the number
of uninfected farms and animals, and outbreak duration.
26
Spatial and temporal
farm data
Epidemiological data
Epidemiological
simulations
Trade scenarios
Infected farms
Affected farms
Elasticity estimates
Production costs
Dynamic model
partial-equilibriumWelfare effects
Supply effects
Liability costs
Figure 1. Links between main data sources, epidemiological and economic models
applied in this study, liability costs and welfare and supply effects on an outbreak

27
Figure 2. The distribution of simulated welfare effects which an average-sized
outbreak initiating from a certain farm (an average-sized outbreak according to
that farm) is expected to incur to producers, consumers, public funds and society in
total: note the differences in the horizontal axis

28
Figure 3. Differences ‘expected welfare effects to consumers, producers and public
funds (€ million per outbreak) simulated for an outbreak beginning from a certain
primary infected farm (dot=one farm)’ minus welfare effects simulated on average
for all farms and presented in relation to the probability of further spread and the
number of infected farms associated to the primary infected farm