risk, infrastructure and industry evolution - agecon search: home
TRANSCRIPT
Risk, Infrastructure and Industry EvolutionProceedings of a conference June 24-25, 2008, in Berkeley, California
Edited by
Burton C. EnglishDepartment of Agricultural Economics
The University of TennesseeKnoxville, TN
R. Jamey MenardDepartment of Agricultural Economics
The University of TennesseeKnoxville, TN
Kim JensenDepartment of Agricultural Economics
The University of TennesseeKnoxville, TN
Sponsored by
Farm FoundationUSDA’s Office of Energy Policy and New Uses
USDA Economic Research ServiceEnergy Biosciences Institute

119
Risk, Infrastructure and Industry Evolution
Infrastructure for the Bioeconomy
BackgroundWell before the recent rapid expansion in U.S. ethanol
production, the voice of agricultural had expressed concerns about the state of infrastructure necessary to support grain transportation (Frittelli, 2005). Different modes (truck, rail, or barge) have advantages in export or domestic movements of grain. Policy debates about transportation tend to focus on a particular mode, while the grain supply chain is multi-modal and extremely competitive by nature. Investment in rail infrastructure is typically market driven because Class I railroads2 own their right-of-way. In contrast, trucking and barge firms operate over publicly supported infrastructure and thus, policy concerns drive questions for highway invest-ment or refurbished locks and dams. The policy debate is further complicated because most grain first moves over local roads and bridges. Other governmental transportation poli-cies influencing the movement of grain include programs to maintain short line railroads and to improve access to inter-modal ports, thereby facilitating the growth of export grain shipment via containers.
History has taught us that changes in federal transportation policy have important ramifications upon the grain marketing system. Grain moves from the field to end users seeking a minimum cost solution over a complex network of highways, railways, or waterways. The flow of grain is dependent upon the location and size of grain elevators, the receiving capabil-ity of grain buyers, the availability of trucks, rail or barges and power units, and rate structures, as well as the transporta-tion infrastructure.
For example, grain flows shifted following truck and rail deregulation in 1980. Over the next decade, the U.S. rail sys-tem was reshaped through mergers, rail line abandonments, the creation of short line railroads, and changes in rail rate structures favoring multiple-car train movements of com-modities like grain. In response, the grain marketing sys-
2 U.S. Class I Railroads are line haul freight railroads with 2006 operating revenue in excess of $346.8 million (Association of American Railroads, 2008).
Frank Dooley1
1 Dooley is a Professor in the Department of Agricultural Economics at Purdue Uni-versity, West Lafayette, Indiana.
tem adjusted by constructing new elevators designed to load multicar shipments. With reductions in shipping rates of 30 percent or more for volume shipments, more grain moved through these elevators.
The extensive public debate preceding passage of the de-regulation legislation led to careful planning for changes in the grain and transportation systems. The academic commu-nity was an important part of this discussion with studies like Fedeler and Heady (1976) and many others outlining poten-tial outcomes. This is not to say that the resulting change was not disruptive, but rather that it was anticipated.
The growth of the ethanol industry has been closely tied to agricultural and energy policies since 1978. Policies sup-porting ethanol have served various legislative purposes over time, including rural economic development, energy indepen-dence, clean air as a substitute for methyl tertiary-butyl ether (MTBE), and national security. The oil price increases since 2004 have once again led to legislation supporting ethanol as a gasoline alternative, most recently underscored by the expansion of the Renewable Fuels Standards in the Energy Independence and Security Act of 2007.
In short order, the proportion of the U.S. corn crop used for ethanol went from 11 percent in 2004 to 33 percent in 2008. Thus, once again the grain and transportation systems are in a process of readjustment as the location of markets for corn has suddenly shifted and new markets arose for etha-nol and dried distillers grains with solubles (DDGS). Unlike prior shifts in grain utilization or transportation policy, there is scant evidence of careful consideration of this change upon the grain transportation system or infrastructure. For example, a recent report by the Congressional Budget Office (2006) on long term issues for rail freight does not consider ethanol. One additional key difference is that unlike the 1980s, the transportation system has less ability to adjust because it is already running near capacity (Denifcoff, 2007).
Given the concerns about transportation capacity, the fo-cus of this paper is to consider how the sudden increase in ethanol production affects demands on transportation modes

119
Risk, Infrastructure and Industry Evolution
cent of grain movements. Rail tonnage is up slightly from 1991 to 2004, from 128 to 136 million tons, while barge ton-nage slightly declined, from 70 to 67 million tons.
Corn accounted for 61 percent of all grain movements in 2004, at 242 million tons (Marathon, VanWechel, and Vachal, 2006). Modal splits for corn are similar for all grains, with truck gaining in importance over time. Approximately 20 percent of the corn is exported each year, moving to ports by barge (68 percent) and rail (30 percent). The production of corn has greater transportation requirements than other grains simply because the yield per acre is much higher. For ex-ample, in 2007, the average yield of corn was 151 bushels per acre compared to yields of 74, 60, 60, and 41 bushels per acre for sorghum, barley, soybeans, and wheat respectively (USDA-NASS, 2008). The higher yield per acre means there is much more grain to be hauled when raising corn as op-posed to other grains. An acre of corn has twice the volume of grain compared to sorghum, 2.5 times the volume of bar-ley and soybeans, and 3.7 times the volume of wheat. Thus, changes in corn production lead to much greater impacts on transportation requirements than other grains simply because of volume.
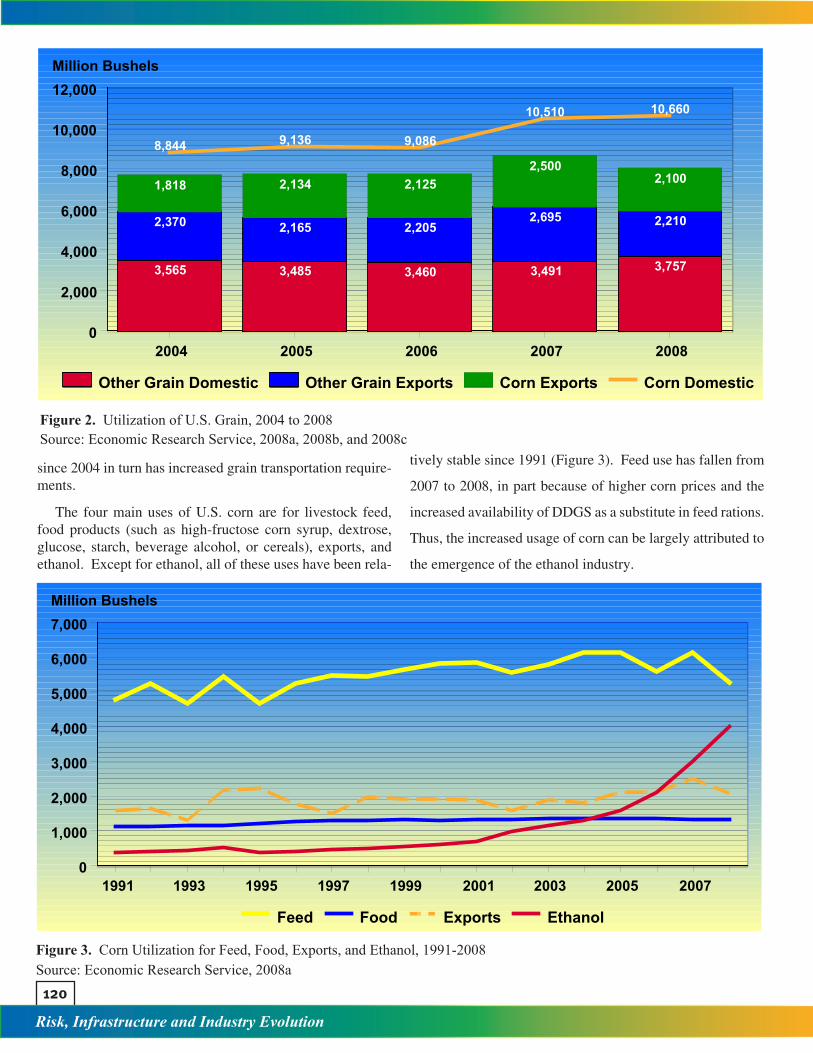
From 2004 to 2008, utilization of U.S. grain rose around 15 percent, from 16.6 billion bushels to almost 19 billion bushels (Figure 2). The increase has arisen almost exclusively from a growth of 1.8 billion bushels in domestic corn utilization. Growth in domestic and export utilization of other grains (wheat, soybeans, sorghum, and barley), as well as export corn, has been relatively flat. The surge in grain utilization
and infrastructure for grain, ethanol, and DDGS. The paper is organized into five sections. First, historic modal splits for grain transportation are reviewed. Second, demands for grain transportation are considered in light of the expansion in ethanol production since 2004. Next, a transportation flow model is constructed to portray adjustments facing the trans-portation system. After considering the implications of these adjustments for corn, ethanol, and DDGS, the paper ends with a prognosis.
Historical Modal Splits for Grain Transpor-tation
Every six years, the USDA publishes a modal report for grain movements (Marathon, VanWechel, and Vachal, 2006). Data from various sources are reconciled to estimate tonnage movements by mode for export and domestic markets for corn, wheat, soybeans, sorghum, and barley. The modes are the final movements by rail, barge, and truck.
Total U.S. grains transported increased from 327 million tons in 1991 to 393 million tons in 2004 (Marathon, Van-Wechel, and Vachal, 2006). Around 70 percent of the total tonnage is shipped to domestic markets, with the remaining grain shipped to export markets. Virtually all of the growth over this 14 year period was in domestic traffic. Most of this growth was captured by truck, as the modal share for truck transportation grew from 40 to 50 percent (Figure 1). Truck transportation is especially important for domestic move-ments of grain. Overall rail moves 33 percent of all grain movements, while barge accounts for the remaining 18 per-
1991 1992 1993 1994 1995 1996 1997 1998 1999 2000 2001 2002 2003 20040%
10%
20%
30%
40%
50%
60%Percent
Rail Barge Truck
Figure 1. Modal Shares for U.S. Grains, 1991-2004Source: Marathon, VanWechel, and Vachal, 2006
120
Risk, Infrastructure and Industry Evolution
since 2004 in turn has increased grain transportation require-ments.
The four main uses of U.S. corn are for livestock feed, food products (such as high-fructose corn syrup, dextrose, glucose, starch, beverage alcohol, or cereals), exports, and ethanol. Except for ethanol, all of these uses have been rela-
tively stable since 1991 (Figure 3). Feed use has fallen from
2007 to 2008, in part because of higher corn prices and the
increased availability of DDGS as a substitute in feed rations.
Thus, the increased usage of corn can be largely attributed to
the emergence of the ethanol industry.
8,844 9,136 9,086
10,510 10,660
1,818 2,134 2,1252,500
2,100
2,370 2,165 2,2052,695 2,210
3,565 3,485 3,460 3,491 3,757
2004 2005 2006 2007 20080
2,000
4,000
6,000
8,000
10,000
12,000Million Bushels
Other Grain Domestic Other Grain Exports Corn Exports Corn Domestic
Figure 2. Utilization of U.S. Grain, 2004 to 2008Source: Economic Research Service, 2008a, 2008b, and 2008c
1991 1993 1995 1997 1999 2001 2003 2005 20070
1,000
2,000
3,000
4,000
5,000
6,000
7,000Million Bushels
Feed Food Exports Ethanol
Figure 3. Corn Utilization for Feed, Food, Exports, and Ethanol, 1991-2008Source: Economic Research Service, 2008a

121
Risk, Infrastructure and Industry Evolution
The 1.8 billion bushels is equivalent to 50.8 million tons of additional corn utilized in domestic markets, or a level almost equal to total annual barge shipments of grain. In 2004, the modal splits for domestic corn shipments were 66.4, 31.8, and 1.8 percent for truck, rail, and barge respectively (Marathon, VanWechel, and Vachal, 2006). The capacity of a truck, rail hopper rail car, and barge are 26, 100, and 1,500 tons respec-tively (Denicoff, 2007). If the traditional modal split holds, this expansion in corn utilization has generated new traffic of 1.3 million truckloads, 160,000 rail carloads, and 588 barges. In addition, new ethanol and DDGS traffic is generated.
Yet it is suggested that traditional flows will be altered and most corn will be shipped to ethanol plants by truck (Deni-coff, 2007). In addition, the United States may be more de-pendent on truck to move ethanol and DDGS to final mar-kets because of capacity constraints for rail and barge traffic (Pentland, 2008). However, to date, rail appears to be the most important carrier for ethanol, while truck is of greater importance for DDGS (Table 1).
Modeling Transportation FlowsUnfortunately, the next USDA modal split analysis will
not be published until sometime in 2012. This information is of great value as industry and governmental planners con-sider investments in equipment and infrastructure. Thus, a model is developed to provide some initial perspective about the shifts in corn, ethanol, and DDGS movements. The model does not compare in complexity to the intricate and detailed mathematical programming models built prior to rail deregu-lation. Nevertheless, it does consider the magnitude of the new traffic upon the existing network, as well as providing an initial consideration as to the geographic locations for corn, ethanol, and DDGS production and consumption. In turn, ef-fects on transportation requirements are inferred based upon whether the consumption is within a state’s borders. Corn, DDGS, and ethanol produced and consumed within a state are assumed to move by truck, while surplus production from a state is assumed to move by rail or barge.
The model captures the flow of corn to two end uses, as ethanol and livestock feed (Figure 4). Two separate flows
CornProduction
Ethanol Plant
LivestockFeed Use
Fuel Use
Corn
DDGS
Ethanol
Figure 4. Flows of Corn, Ethanol, and DDGS
Table 1. Estimated Modal Shares for Ethanol and DDGS, 2005 and 2007
Product Ethanol DDGS
2005a 2007b 2005a 2007b
Truck 30% 25.0 to 26.3% 84% 43.5%
Rail 60% 66.0 to 73.7% 14% 56.5%
Barge 10% 0 to 9.0% 2% 0%
Total 100% 100% 100% 100%
Sources: aDenicoff (2007) and bWu (2008).

122
Risk, Infrastructure and Industry Evolution
are tracked from the ethanol plant, first, as ethanol to terminal blenders, and second, as DDGS to feed livestock. Secondary data represent state level activity, with snapshots presenting flows for 2004, 2007, and 2010. The 2004 model provides a baseline consistent with the last USDA transportation modal analysis report and also reflects the market before the recent expansion in ethanol. The 2007 model captures the effect of first wave of ethanol construction and the growth in corn production. The 2010 model anticipates the further expan-sion of ethanol capacity, and ethanol demand encountering the “blending wall” associated with a usage of a 10 percent blend of ethanol in gasoline.
Corn production data are from the Economic Research Service (ERS) (2008a) of the USDA. Data for 2004 are the average corn production from crop years 2003 and 2004, and for 2007 are the average from crop years 2006 and 2007. The
forecast for 2010 is based on the USDA projections for 2009 and 2010. State level values from 2007 are inflated propor-tionally to reach the estimated U.S. total production for 2010. Assumed total production is 10.9, 11.8, and 13.4 billion bush-els for 2004, 2007, and 2010 respectively (Table 2). Corn production is heavily concentrated in the Midwest states, with Census Regions 3 and 4 accounting for 87.5 percent of all corn production. Five states - Illinois, Indiana, Iowa, Min-nesota, and Nebraska - account for 65 percent of U.S. corn production.
Plant capacities, locations, and year of entry are obtained from Ethanol Producer Magazine (2008). In 2004, 66 plants operated 4.1 billion gallons of capacity. At the end of 2007, 137 plants were in operation with 8.2 billion gallons of capac-ity. By 2010, 195 plants will operate 13.2 billion gallons of production capacity. Over 90 percent of the ethanol produc-
Table 3. Assumed Ethanol Production and Region Share, by Year
Census Region States 2004 2007 2010
Region Share
000 gallons1 CT, MA, ME, NH, RI, VT 0 0 0 0.0%
2 NJ, NY, PA 0 0 150,000 0.6%
3 IL, IN, MI, OH, WI 1,037,000 2,132,000 3,401,000 25.8%
4 IA, KS, MN, MO, ND, NE, SD 3,023,500 5,475,500 8,246,000 65.8%
5 DE, FL, GA, MD, NC, SC, VA, WV 0 0 160,000 0.6%
6 AL, KY, MS, TN 33,000 93,000 193,000 1.3%
7 AR, LA, OK, TX 0 100,000 340,000 1.7%
8 AZ, CO, ID, MT, NM, NV, UT, WY 0 202,000 262,000 1.8%
9 CA, OR, WA 0 203,000 415,000 2.4%
USA 4,093,500 8,205,500 13,167,000 100.0%
Source: Ethanol Produceer Magazine, (2008)
Table 2. Assumed Corn Production and Region Share, by Year
Census Region States 2004 2007 2010
Region Share
000 bushels1 CT, MA, ME, NH, RI, VT 0 0 0 0.0%
2 NJ, NY, PA 185,490 196,418 222,843 1.7%
3 IL, IN, MI, OH, WI 3,912,425 4,184,035 4,746,940 35.5%
4 IA, KS, MN, MO, ND, NE, SD 5,684,025 6,141,190 6,967,404 52.0%
5 DE, FL, GA, MD, NC, SC, VA, WV 273,157 294,256 333,844 2.5%
6 AL, KY, MS, TN 333,558 341,870 387,864 2.9%
7 AR, LA, OK, TX 348,010 410,075 465,245 3.4%
8 AZ, CO, ID, MT, NM, NV, UT, WY 164,910 182,964 207,579 1.5%
9 CA, OR, WA 46,580 53,573 60,780 0.4%
USA 10,948,154 11,804,381 13,392,500 100.0%
Source: USDA, Economic Research Service, (2008a)
123
Risk, Infrastructure and Industry Evolution
tive capacity is found in Census Regions 3 and 4 (Table 3). Iowa and Nebraska alone account for 40 percent of industry capacity. Plants were found in 12, 20, and 26 states in 2004, 2007, and 2010 respectively.
Thus, ethanol plants can be described as origin mills as production capacity is heavily concentrated in the same geo-graphic area as the feedstock. Each bushel of corn is assumed to produce 2.79 gallons of denatured ethanol and 17.5 pounds of DDGS. Thus, ethanol plants consume 1.5, 2.9, and 4.7 billion bushels of corn, while producing 12.8, 25.7, and 41.2 million tons of DDGS in 2004, 2007, and 2010 respectively.
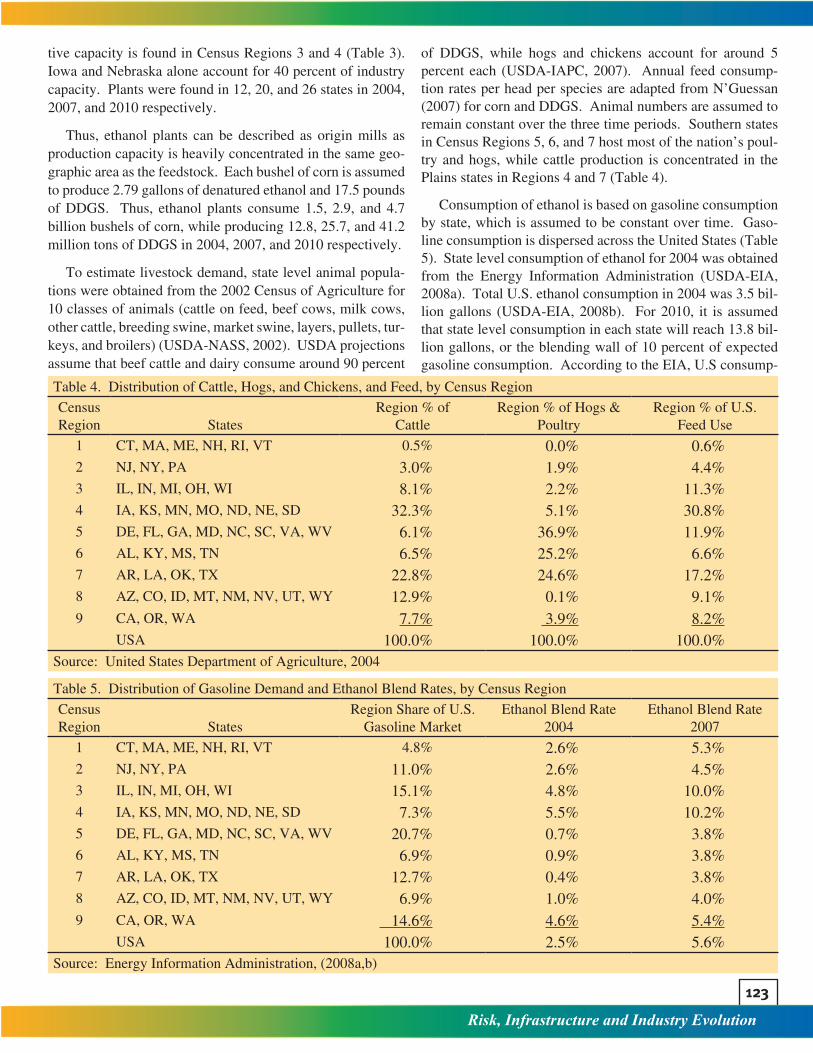
To estimate livestock demand, state level animal popula-tions were obtained from the 2002 Census of Agriculture for 10 classes of animals (cattle on feed, beef cows, milk cows, other cattle, breeding swine, market swine, layers, pullets, tur-keys, and broilers) (USDA-NASS, 2002). USDA projections assume that beef cattle and dairy consume around 90 percent
of DDGS, while hogs and chickens account for around 5 percent each (USDA-IAPC, 2007). Annual feed consump-tion rates per head per species are adapted from N’Guessan (2007) for corn and DDGS. Animal numbers are assumed to remain constant over the three time periods. Southern states in Census Regions 5, 6, and 7 host most of the nation’s poul-try and hogs, while cattle production is concentrated in the Plains states in Regions 4 and 7 (Table 4).
Consumption of ethanol is based on gasoline consumption by state, which is assumed to be constant over time. Gaso-line consumption is dispersed across the United States (Table 5). State level consumption of ethanol for 2004 was obtained from the Energy Information Administration (USDA-EIA, 2008a). Total U.S. ethanol consumption in 2004 was 3.5 bil-lion gallons (USDA-EIA, 2008b). For 2010, it is assumed that state level consumption in each state will reach 13.8 bil-lion gallons, or the blending wall of 10 percent of expected gasoline consumption. According to the EIA, U.S consump-
Table 4. Distribution of Cattle, Hogs, and Chickens, and Feed, by Census Region
Census Region States
Region % of Cattle
Region % of Hogs & Poultry
Region % of U.S. Feed Use
1 CT, MA, ME, NH, RI, VT 0.5% 0.0% 0.6%2 NJ, NY, PA 3.0% 1.9% 4.4%3 IL, IN, MI, OH, WI 8.1% 2.2% 11.3%4 IA, KS, MN, MO, ND, NE, SD 32.3% 5.1% 30.8%5 DE, FL, GA, MD, NC, SC, VA, WV 6.1% 36.9% 11.9%6 AL, KY, MS, TN 6.5% 25.2% 6.6%7 AR, LA, OK, TX 22.8% 24.6% 17.2%8 AZ, CO, ID, MT, NM, NV, UT, WY 12.9% 0.1% 9.1%9 CA, OR, WA 7.7% 3.9% 8.2%
USA 100.0% 100.0% 100.0%Source: United States Department of Agriculture, 2004
Table 5. Distribution of Gasoline Demand and Ethanol Blend Rates, by Census Region
Census Region States
Region Share of U.S. Gasoline Market
Ethanol Blend Rate 2004
Ethanol Blend Rate 2007
1 CT, MA, ME, NH, RI, VT 4.8% 2.6% 5.3%2 NJ, NY, PA 11.0% 2.6% 4.5%3 IL, IN, MI, OH, WI 15.1% 4.8% 10.0%4 IA, KS, MN, MO, ND, NE, SD 7.3% 5.5% 10.2%5 DE, FL, GA, MD, NC, SC, VA, WV 20.7% 0.7% 3.8%6 AL, KY, MS, TN 6.9% 0.9% 3.8%7 AR, LA, OK, TX 12.7% 0.4% 3.8%8 AZ, CO, ID, MT, NM, NV, UT, WY 6.9% 1.0% 4.0%9 CA, OR, WA 14.6% 4.6% 5.4%
USA 100.0% 2.5% 5.6%Source: Energy Information Administration, (2008a,b)
124
Risk, Infrastructure and Industry Evolution
tion of ethanol for 2007 was expected to total 7.7 billion gal-lons. States in Census Regions 3 and 4 were assumed to use a 10 percent blend of ethanol, while states in the rest of the country used ethanol at the either the maximum of the state level blend rate in 2004 or 3.8 percent (Table 5).
After all data calculations were completed, state level con-sumption was subtracted from state level production for corn, ethanol, and DDGS, for each year. This determines whether a state has a surplus or deficit of corn, ethanol, or DDGS. The changes are compared over time to identify the effects of shifts in corn utilization and ethanol production.
Model ResultsCorn Movements
In 2004, the 48 contiguous states produced 10.9 billion bushels of corn (Table 2). Of this total, 5.9 and 1.5 billion bushels were used for feeding livestock and ethanol produc-tion respectively. To determine corn flows, Net Corn is de-fined:
Net Corni,t = Corn Production
i,t - Corn for Livestock
i,t -
Corn for Ethanoli,t
where i is a state among the 48 continental U.S. states and t is time period (2004, 2007, or 2010). If Net Corn is greater than zero, the state has a surplus of corn that can be shipped to states with a deficit, used for food production, or exported. In contrast, states with a negative Net Corn balance must import corn to meet livestock and ethanol corn demands.
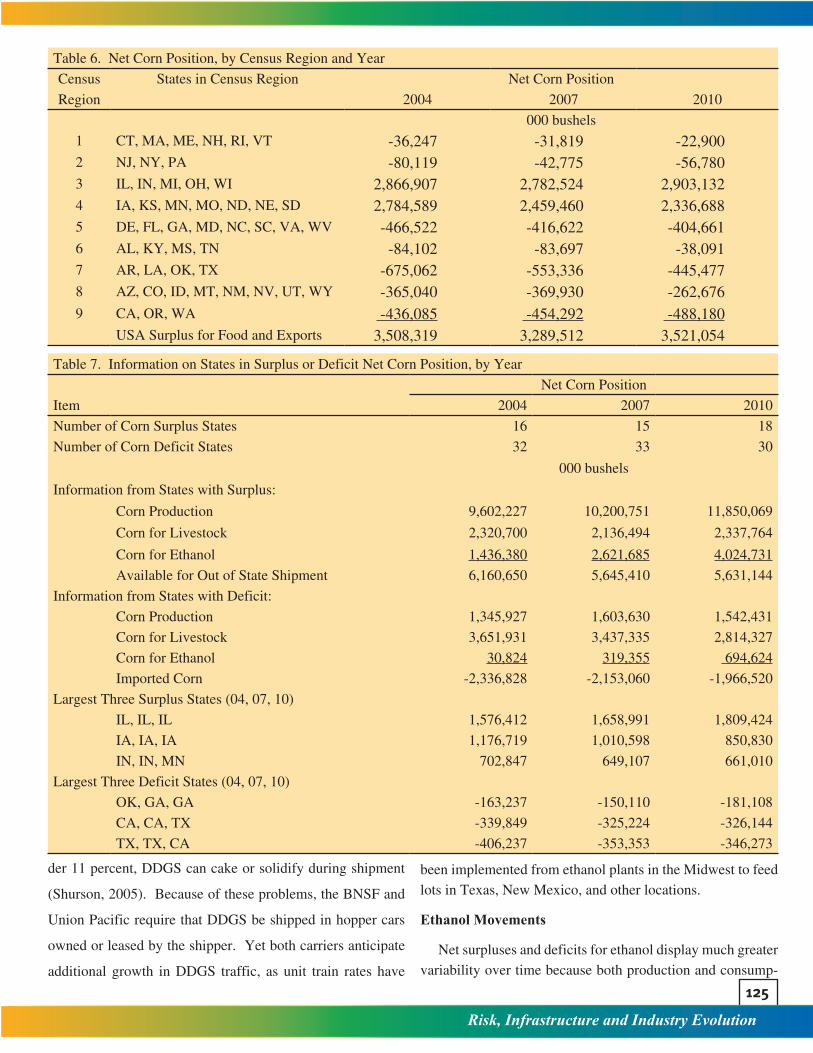
Nationwide, the United States had a net corn surplus of 3.5 billion bushels of corn in 2004 (Tables 6 and 7). However, this calculation ignores U.S. utilization of corn for food pro-cessing and exports, which have been as high as 3.5 billion bushels in recent years (Figure 3). Sixteen states ran a corn surplus in 2004, with Illinois, Iowa, Indiana, and Minnesota accounting for most of the surplus. The 16 corn surplus states produced 9.6 billion bushels of corn, using 2.3 billion bushels to feed livestock, 1.4 billion bushels for ethanol.
The 32 corn deficit states in 2004 produced 1.3 billion bushels of corn, but consumed 3.6 billion bushels to feed live-stock and 31 million bushels for ethanol production (Table 7). Most likely the locally produced and consumed corn moved by truck, while most of the 2.3 billion bushels of imported corn moved by rail or barge. The largest importing states in 2004 were Texas, California, and Oklahoma.
From 2004 to 2007, total U.S. corn production increased from 10.9 to 11.8 billion bushels (Table 2). Although corn production is growing across the United States, the growth in production is concentrated in the Corn Belt states of the Midwest. While total production grew, the nationwide corn surplus fell by 219 million bushels (Table 7). The number of surplus states fell to 15, as Tennessee moved to a corn deficit.
The 15 surplus states produced 10.2 billion bushels, while consuming 2.1 and 2.6 billion bushels for livestock and etha-nol. Thus, 5.6 billion bushels were available for shipment from the surplus states. The pattern for the 33 corn deficit states was similar to 2004, with the deficit states running a shortage of 2.2 billion bushels. States with the largest sur-pluses remained the same as in 2004, while Georgia replaced Oklahoma as having the third largest corn deficit.
The change in corn utilization will likely follow a similar path from 2007 to 2010. Corn production will reach 13.4 billion bushels in 2010 (Table 2). The net corn balance will return to 3.5 billion bushels by 2010 (Table 6). Thus, given the corn used for food processing and historic levels of ex-ports, the United States will use virtually all of its corn in the near future.
In 2010, 18 states run a corn surplus, producing 11.9 bil-lion bushels, while consuming 2.2 and 4.0 billion bushels for livestock and ethanol (Table 7). Over 5.6 billion bushels re-main available for shipment from the surplus states. The corn deficit falls for the 30 corn deficit states. While the consump-tion of corn for ethanol in deficit states grows from 319 to 694 million bushels, this is offset as less corn is fed to livestock due to as increased DDGS utilization in animal diets.
DDGS Movements
As a coproduct of ethanol production, DDGS produc-tion tracks the expansion in ethanol production. In 2004, the 12 states with ethanol plants produced 12.8 million tons of DDGS (Table 9). With the expansion of ethanol production to 20 and 26 states in 2007 and 2010, respectively, DDGS production increases to 22.9 and 35.2 million tons. Thus, over time DDGS will become more geographically disperse, thereby reducing the distance for DDGS transportation from surplus to deficit states.
In 2004, the seven DDGS surplus states consumed 5.1 mil-lion tons and shipped 7.4 million tons of DDGS elsewhere, of which 868,000 tons was exported (Table 9). The 41 DDGS deficit states only produced 270,000 tons of DDGS. By 2007, U.S. consumption of DDGS grew to 23.1 million tons. Con-sumption is expected to grow to 34.9 million tons by 2010, when U.S. markets will be close to the saturation point. The level of exports is expected to reach 2.6 and 6.4 million tons in 2007 and 2010 respectively.
States with the greatest surplus of DDGS mirror states with the greatest ethanol production. In 2010, Iowa, Nebras-ka, and Illinois, will account for over 60 percent of the nation-wide surplus in DDGS (see Table 9). States with the largest deficits in 2010 are Texas, Oklahoma, and California.
Shipment of DDGS via rail or barge initially encountered difficulties related to flowability, a factor related to the mois-ture content. Unless the moisture content of DDGS is un-
125
Risk, Infrastructure and Industry Evolution
der 11 percent, DDGS can cake or solidify during shipment
(Shurson, 2005). Because of these problems, the BNSF and
Union Pacific require that DDGS be shipped in hopper cars
owned or leased by the shipper. Yet both carriers anticipate
additional growth in DDGS traffic, as unit train rates have
been implemented from ethanol plants in the Midwest to feed lots in Texas, New Mexico, and other locations.
Ethanol Movements
Net surpluses and deficits for ethanol display much greater variability over time because both production and consump-
Table 6. Net Corn Position, by Census Region and Year
Census States in Census Region Net Corn Position
Region 2004 2007 2010
000 bushels
1 CT, MA, ME, NH, RI, VT -36,247 -31,819 -22,9002 NJ, NY, PA -80,119 -42,775 -56,7803 IL, IN, MI, OH, WI 2,866,907 2,782,524 2,903,1324 IA, KS, MN, MO, ND, NE, SD 2,784,589 2,459,460 2,336,6885 DE, FL, GA, MD, NC, SC, VA, WV -466,522 -416,622 -404,6616 AL, KY, MS, TN -84,102 -83,697 -38,0917 AR, LA, OK, TX -675,062 -553,336 -445,4778 AZ, CO, ID, MT, NM, NV, UT, WY -365,040 -369,930 -262,6769 CA, OR, WA -436,085 -454,292 -488,180
USA Surplus for Food and Exports 3,508,319 3,289,512 3,521,054
Table 7. Information on States in Surplus or Deficit Net Corn Position, by Year
Item
Net Corn Position
2004 2007 2010
Number of Corn Surplus States 16 15 18
Number of Corn Deficit States 32 33 30
000 bushels
Information from States with Surplus:
Corn Production 9,602,227 10,200,751 11,850,069
Corn for Livestock 2,320,700 2,136,494 2,337,764
Corn for Ethanol 1,436,380 2,621,685 4,024,731
Available for Out of State Shipment 6,160,650 5,645,410 5,631,144
Information from States with Deficit:
Corn Production 1,345,927 1,603,630 1,542,431
Corn for Livestock 3,651,931 3,437,335 2,814,327
Corn for Ethanol 30,824 319,355 694,624
Imported Corn -2,336,828 -2,153,060 -1,966,520
Largest Three Surplus States (04, 07, 10)
IL, IL, IL 1,576,412 1,658,991 1,809,424
IA, IA, IA 1,176,719 1,010,598 850,830
IN, IN, MN 702,847 649,107 661,010
Largest Three Deficit States (04, 07, 10)
OK, GA, GA -163,237 -150,110 -181,108
CA, CA, TX -339,849 -325,224 -326,144
TX, TX, CA -406,237 -353,353 -346,273

126
Risk, Infrastructure and Industry Evolution
tion are experiencing dramatic change. Ethanol capacity has
grown from 4.0 to 8.2 to 13.2 billion gallons in 2004, 2007,
and 2010, respectively, as the number of states with ethanol
plants grew from 12 to 20 to 26 (see Table 3). However,
even with plants across the country, ethanol production is
heavily concentrated in the Corn Belt states. With respect to
consumption, the blend rate of ethanol in gasoline has grown
from 2.5 percent in 2004 to 5.6 percent in 2007 to 10 per-
cent in 2010 (see Table 5) as blenders have sought to replace MTBE as an oxygenate and oil prices have risen in price.
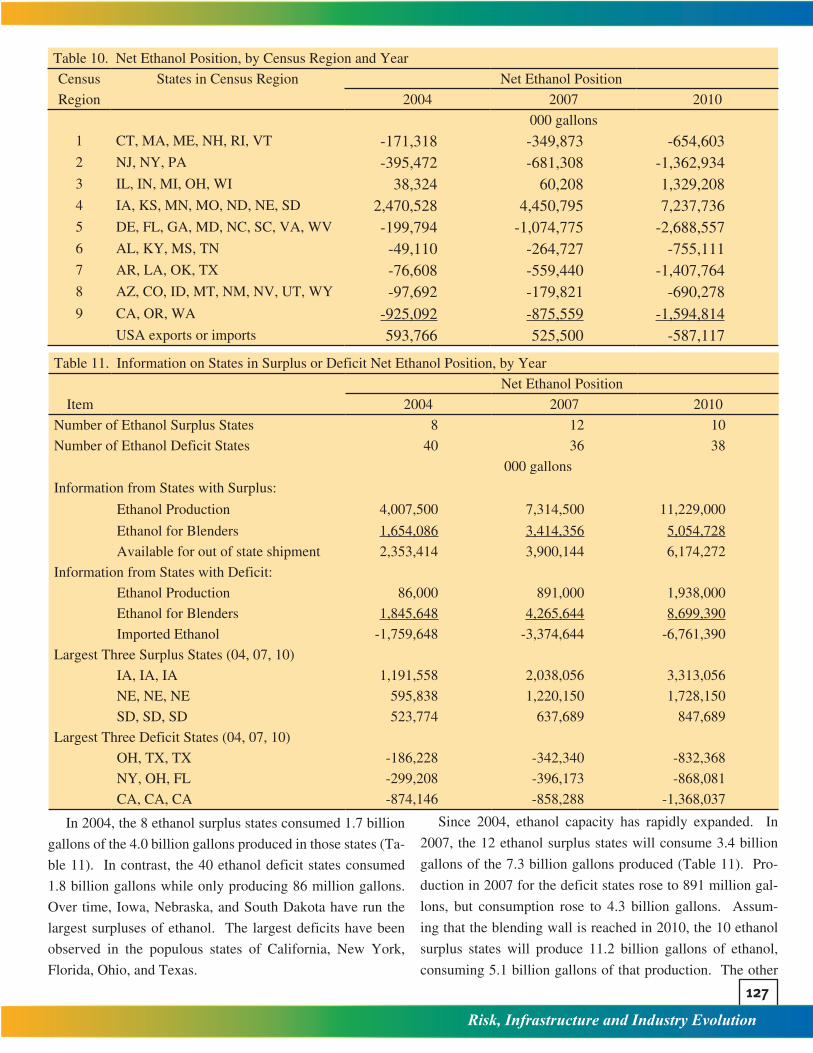
Nationwide, the United States had ethanol surpluses of 594 million gallons in 2004 and 526 million gallons in 2007 (Table 10). A deficit of 587 million gallons is anticipated in 2010. However, imports are not included as part of the avail-able ethanol stock. Thus, the nation is on track to reach suffi-cient productive capacity to meet the blending wall by 2010.
Table 8. Net DDGS Position, by Census Region and Year
Census States in Census Region Net DDGS Position
Region 2004 2007 2010
000 tons
1 CT, MA, ME, NH, RI, VT -87 -211 -4612 NJ, NY, PA -520 -1,260 -1,1633 IL, IN, MI, OH, WI 1,887 4,300 7,9294 IA, KS, MN, MO, ND, NE, SD 5,141 10,128 17,5845 DE, FL, GA, MD, NC, SC, VA, WV -567 -1,374 -1,7046 AL, KY, MS, TN -308 -501 -1,1807 AR, LA, OK, TX -2,121 -4,482 -7,6138 AZ, CO, ID, MT, NM, NV, UT, WY -1,459 -2,210 -4,9389 CA, OR, WA -1,097 -1,792 -2,104
Available to Export from the USA 868 2,598 6,350
Table 9. Information on States in Surplus or Deficit Net DDGS Position, by Year
Net DDGS Position
Item 2004 2007 2010
Number of DDGS Surplus States 7 9 13
Number of DDGS Deficit States 41 39 35
000 tons
Information from States with Surplus:
DDGS Production 12,568 22,940 35,216
DDGS for Livestock 5,147 8,587 12,119
Available for Out of State Shipment 7,421 14,353 23,097
Information from States with Deficit:
DDGS Production 270 2,794 6,078
DDGS for Livestock 6,822 14,549 22,825
Imported DDGS -6,553 -11,755 -16,748
Largest Three Surplus States (04, 07, 10)
IA, IA, IA 2,725 5,516 9,514
NE, IL, NE 1,830 1,931 3,346
IL, NE, IL 1,774 1,753 3,028
Largest Three Deficit States (04, 07, 10)
KS, OK, CA -629 -905 -1,940
CA, CA, OK -801 -1,548 -1,976
TX, TX, TX -1,562 -3,127 -4,657
127
Risk, Infrastructure and Industry Evolution
In 2004, the 8 ethanol surplus states consumed 1.7 billion
gallons of the 4.0 billion gallons produced in those states (Ta-
ble 11). In contrast, the 40 ethanol deficit states consumed
1.8 billion gallons while only producing 86 million gallons.
Over time, Iowa, Nebraska, and South Dakota have run the
largest surpluses of ethanol. The largest deficits have been
observed in the populous states of California, New York,
Florida, Ohio, and Texas.
Since 2004, ethanol capacity has rapidly expanded. In
2007, the 12 ethanol surplus states will consume 3.4 billion
gallons of the 7.3 billion gallons produced (Table 11). Pro-
duction in 2007 for the deficit states rose to 891 million gal-
lons, but consumption rose to 4.3 billion gallons. Assum-
ing that the blending wall is reached in 2010, the 10 ethanol
surplus states will produce 11.2 billion gallons of ethanol,
consuming 5.1 billion gallons of that production. The other
Table 10. Net Ethanol Position, by Census Region and Year
Census States in Census Region Net Ethanol Position
Region 2004 2007 2010
000 gallons
1 CT, MA, ME, NH, RI, VT -171,318 -349,873 -654,6032 NJ, NY, PA -395,472 -681,308 -1,362,9343 IL, IN, MI, OH, WI 38,324 60,208 1,329,2084 IA, KS, MN, MO, ND, NE, SD 2,470,528 4,450,795 7,237,7365 DE, FL, GA, MD, NC, SC, VA, WV -199,794 -1,074,775 -2,688,5576 AL, KY, MS, TN -49,110 -264,727 -755,1117 AR, LA, OK, TX -76,608 -559,440 -1,407,7648 AZ, CO, ID, MT, NM, NV, UT, WY -97,692 -179,821 -690,2789 CA, OR, WA -925,092 -875,559 -1,594,814
USA exports or imports 593,766 525,500 -587,117
Table 11. Information on States in Surplus or Deficit Net Ethanol Position, by Year
Net Ethanol Position
Item 2004 2007 2010
Number of Ethanol Surplus States 8 12 10
Number of Ethanol Deficit States 40 36 38
000 gallons
Information from States with Surplus:
Ethanol Production 4,007,500 7,314,500 11,229,000
Ethanol for Blenders 1,654,086 3,414,356 5,054,728
Available for out of state shipment 2,353,414 3,900,144 6,174,272
Information from States with Deficit:
Ethanol Production 86,000 891,000 1,938,000
Ethanol for Blenders 1,845,648 4,265,644 8,699,390
Imported Ethanol -1,759,648 -3,374,644 -6,761,390
Largest Three Surplus States (04, 07, 10)
IA, IA, IA 1,191,558 2,038,056 3,313,056
NE, NE, NE 595,838 1,220,150 1,728,150
SD, SD, SD 523,774 637,689 847,689
Largest Three Deficit States (04, 07, 10)
OH, TX, TX -186,228 -342,340 -832,368
NY, OH, FL -299,208 -396,173 -868,081
CA, CA, CA -874,146 -858,288 -1,368,037
128
Risk, Infrastructure and Industry Evolution
38 states will increase production to 1.9 billion gallons, as consumption rises to 8.7 billion gallons.
Modal Shares
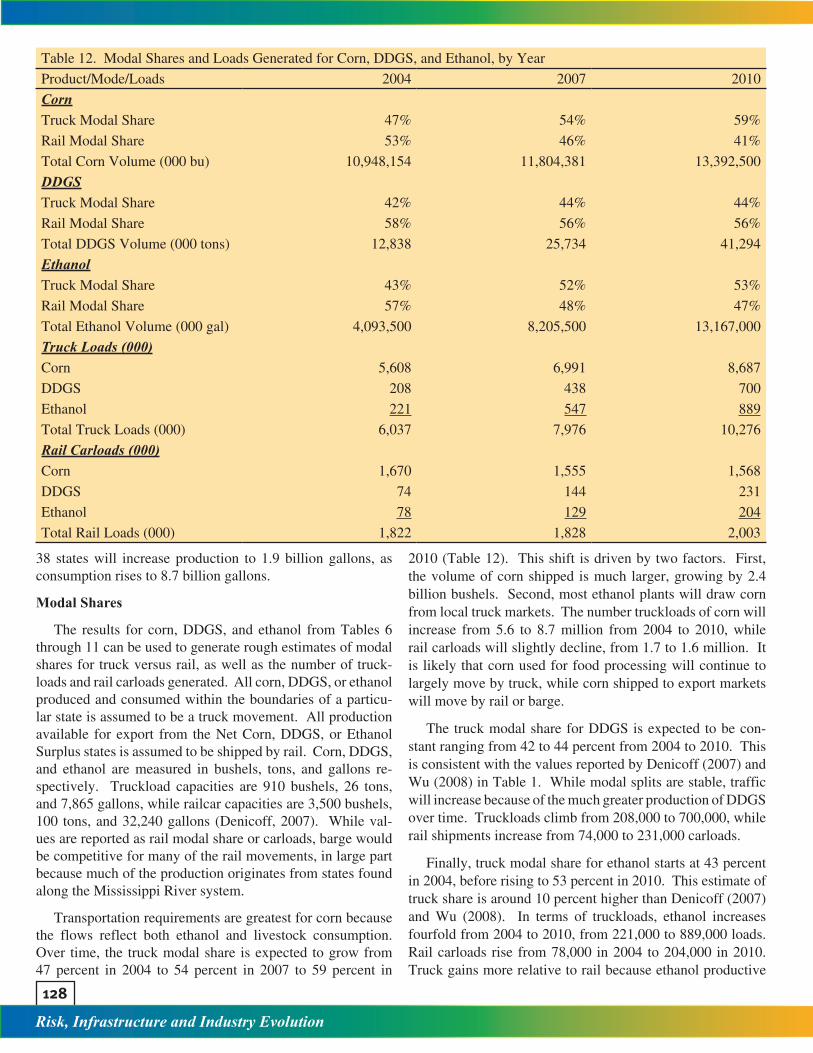
The results for corn, DDGS, and ethanol from Tables 6 through 11 can be used to generate rough estimates of modal shares for truck versus rail, as well as the number of truck-loads and rail carloads generated. All corn, DDGS, or ethanol produced and consumed within the boundaries of a particu-lar state is assumed to be a truck movement. All production available for export from the Net Corn, DDGS, or Ethanol Surplus states is assumed to be shipped by rail. Corn, DDGS, and ethanol are measured in bushels, tons, and gallons re-spectively. Truckload capacities are 910 bushels, 26 tons, and 7,865 gallons, while railcar capacities are 3,500 bushels, 100 tons, and 32,240 gallons (Denicoff, 2007). While val-ues are reported as rail modal share or carloads, barge would be competitive for many of the rail movements, in large part because much of the production originates from states found along the Mississippi River system.
Transportation requirements are greatest for corn because the flows reflect both ethanol and livestock consumption. Over time, the truck modal share is expected to grow from 47 percent in 2004 to 54 percent in 2007 to 59 percent in
2010 (Table 12). This shift is driven by two factors. First, the volume of corn shipped is much larger, growing by 2.4 billion bushels. Second, most ethanol plants will draw corn from local truck markets. The number truckloads of corn will increase from 5.6 to 8.7 million from 2004 to 2010, while rail carloads will slightly decline, from 1.7 to 1.6 million. It is likely that corn used for food processing will continue to largely move by truck, while corn shipped to export markets will move by rail or barge.
The truck modal share for DDGS is expected to be con-stant ranging from 42 to 44 percent from 2004 to 2010. This is consistent with the values reported by Denicoff (2007) and Wu (2008) in Table 1. While modal splits are stable, traffic will increase because of the much greater production of DDGS over time. Truckloads climb from 208,000 to 700,000, while rail shipments increase from 74,000 to 231,000 carloads.
Finally, truck modal share for ethanol starts at 43 percent in 2004, before rising to 53 percent in 2010. This estimate of truck share is around 10 percent higher than Denicoff (2007) and Wu (2008). In terms of truckloads, ethanol increases fourfold from 2004 to 2010, from 221,000 to 889,000 loads. Rail carloads rise from 78,000 in 2004 to 204,000 in 2010. Truck gains more relative to rail because ethanol productive
Table 12. Modal Shares and Loads Generated for Corn, DDGS, and Ethanol, by Year
Product/Mode/Loads 2004 2007 2010
CornTruck Modal Share 47% 54% 59%
Rail Modal Share 53% 46% 41%
Total Corn Volume (000 bu) 10,948,154 11,804,381 13,392,500
DDGSTruck Modal Share 42% 44% 44%
Rail Modal Share 58% 56% 56%
Total DDGS Volume (000 tons) 12,838 25,734 41,294
EthanolTruck Modal Share 43% 52% 53%
Rail Modal Share 57% 48% 47%
Total Ethanol Volume (000 gal) 4,093,500 8,205,500 13,167,000
Truck Loads (000)Corn 5,608 6,991 8,687
DDGS 208 438 700
Ethanol 221 547 889
Total Truck Loads (000) 6,037 7,976 10,276
Rail Carloads (000)Corn 1,670 1,555 1,568
DDGS 74 144 231
Ethanol 78 129 204
Total Rail Loads (000) 1,822 1,828 2,003

129
Risk, Infrastructure and Industry Evolution
capacity is found in 26 states in 2010 compared to only 12 in 2004. However, it may be necessary to rail corn to etha-nol plants in Arizona, California, Colorado, Georgia, Idaho, Kentucky, Michigan, Missouri, North Carolina, New Mexi-co, New York, Oregon, Tennessee, Texas, Washington, and Wyoming. An additional factor constraining rail shipment is that only 10 percent of the terminal blenders have rail receiv-ing capacity (Quear, 2008). Furthermore, only a handful of the blenders in the country, probably less ten, can receive unit train shipments of ethanol (Knight, 2007).
Overall transportation requirements will increase for both trucks and rail because of the influx of ethanol production and consumption. Total truck loads will rise from 6.0 mil-lion in 2004 to 10.3 million in 2010, while railcar shipments climb from 1.8 million to 2.0 million (see Table 12). The 9.9 percent increase in railroad traffic encompasses a reduction in corn traffic offset by increases in DDGS and ethanol. The railroads seemingly have the ability to manage this change. On its face, the 77.7 percent increase in truck traffic will likely create greater equipment and infrastructure challenges, especially at the local level.
PrognosisAfter 15 years of relative calm, transportation is once
again emerging as an issue of concern for agricultural ship-pers and receivers, transportation firms, and public policy makers. The pace of change caused by the growth in ethanol is rapid. Five observations are made.
First, the effects of ethanol and related products on trans-portation equipment and infrastructure are large in magni-tude. In the short run, ethanol firms, truckers, and railroads are experiencing order backlogs for new hopper and tanker cars or difficulties in shipping DDGS. While challenging, these likely reflect short term adjustments as opposed to long term concerns.
Second, the effects of increased truck traffic are felt most in the communities and surrounding areas with the new etha-nol plants. A 100 million gallon per year ethanol plant re-quires 110 truckloads of corn per day, while generating 35 truckloads each of ethanol and DDGS. While the economic development associated with new ethanol plants is welcome in rural communities, the increase in truck traffic may be straining local highway maintenance budgets. The problem may be more serious in regions with bridges in poor condi-tion.
Third, compared to the traditional grain sector, many etha-nol plants have relatively little storage for corn and outputs. With as little as 10 days to 2 weeks of storage capacity, these plants are reliant on dependable providers of transportation service. As a corollary, railroads might increase their equip-ment utilization when shipping ethanol and DDGS as com-
pared to grain. The predictable, steady nature of shipments from ethanol plants stands in sharp contrast to the seasonality associated with shipping grain.
Fourth, once 13.4 billion gallons of ethanol capacity is reached, the industry will face the blending wall. Yet the Re-newable Fuels Standards mandate consumption of 35 billion gallons of ethanol by 2022. The pathway to achieving this is only beginning to be contemplated, but likely involves invest-ment in infrastructure to supply E85, a blend of 85 percent ethanol with gasoline. E85 requires an entirely different sys-tem of pumps and alternative fuel vehicles.
Finally, while transportation challenges in expanding etha-nol production certainly exist, there are also several examples of innovative responses to the challenges by entrepreneurs. For example, a train loading ethanol terminal, Manly Termi-nal, opened in December 2007 in Manly, Iowa. Gateway Ter-minals LLC in Sauget, Illinois is set to open in the summer of 2008, with the capability to load either unit trains or barges of ethanol. In Florida, Kinder Morgan is retrofitting a 102 mile pipeline to ship ethanol. Finally, in Kankakee, Illinois and elsewhere, shippers are loading DDGS in containers for shipment to Asia.
Overall, the prognosis for ethanol is seemingly positive. As an industry in the midst of rapid expansion, uncertainty is high. Additional investment in transportation infrastructure and equipment will be required, especially for trucks and lo-cal highways. It may also be wise to consider a comprehen-sive analysis of the grain transportation and marketing sys-tem. The research done during the last major restructuring of the grain industry in the 1970s provided important insights for industry and government. A better understanding of the transition related to ethanol would likely lead to better plan-ning in the current environment as well.
ReferencesAssociation of American Railroads. 2008. "Overview of America’s Freight
Railroads." Policy and Economics Department. Available at http://www.aar.org/~/media/AAR/BackgroundPapers/775.ashx.
Congressional Budget Office. 2006. "Freight Rail Transportation Issues: Long Run Issues." Available at http://www.cbo.gov/ftpdocs/70xx/doc7021/01-17-Rail.pdf.
Denicoff, M. 2007. Expansion of U.S. Corn-based Ethanol from the Agricultural Transportation Perspective. "Ethanol Transportation Backgrounder." Washington, DC: United States Department of Agriculture, Agricultural Marketing Service. Available at http://www.ams.usda.gov/AMSv1.0/getfile?dDocName=STELPRDC5063605&acct=atpub.
Ethanol Producer Magazine. 2008. “Ethanol Plant List.” Available at http://ethanolproducer.com/plant-list.jsp.
Fedeler, J., and E. Heady. 1976. “Grain Marketing and Transportation Interdependencies: A National Model.” American Journal of Agricultural Economics 58(2):224-235.
Frittelli, J. 2005. Grain Transport: Modal Trends and Infrastructure Implications. Congressional Research Service Reports, CRS Report Number RL32720.

130
Risk, Infrastructure and Industry Evolution
Available at http://digital.library.unt.edu/govdocs/crs/data/2005/meta-crs-9124.tkl.
Knight, B. 2007. “Rail Transportation of Resources Critical To the Nation's Energy Supply.” Comments of the U.S. Department of Agriculture Before the Surface Transportation Board, STB Ex Parte No. 672. Available at http://www.ams.usda.gov/AMSv1.0/getfile?dDocName=STELPRDC5062572&acct=atpub.
Marathon, N., T. VanWechel, and K. Vachal. 2006. "Transportation of U.S. Grains: A Modal Share Analysis, 1978-2004." United States Department of Agriculture, Agricultural Marketing Service. Available at http://209.85.165.104/search?q=cache:lAbqWGZQSlkJ:151.121.3.151/tmd/TSB/Modal_Share.pdf+Transportation+of+U.S.+Grains+A+Modal+Share+Analysis+1978-2004+marathon&hl=en&ct=clnk&cd=4&gl=us.
N’Guessan, Y. 2007. “Economic Impact of Ethanol Production on U.S. Livestock Sector: A Spatial Analysis of Corn and Distillers Grain Shipment.” Ph.D. dissertation, Kansas State University, Manhattan, December. Available at http://krex.k-state.edu/dspace/handle/2097/397.
Pentland, W. 2008. “Ethanol: Getting There Is None Of The Fun.” Forbes.com. Available at http://www.forbes.com/2008/05/15/ethanol-logistics-energy-biz-logistics-cx_wp_0516ethanol.html.
Quear, J. 2008. “The Impacts of Biofuel Expansion on Transportation and Logistics in Indiana.” MS thesis, Purdue University, West Lafayette.
Shurson, G. 2005. “Issues and Opportunities Related to the Production and Marketing of Ethanol By-Products.” Paper presented at the 2005 Agricultural Outlook Forum, Arlington, Virginia, February 24-25. Available at http://www.ddgs.umn.edu/articles-proc-storage-quality/2005-Shurson-%20AgOutlookForum-Feb05.pdf.
United States Department of Agriculture, Economic Research Service (ERS). 2008a. "Feed Grains Database: Yearbook Tables." Available at http://www.ers.usda.gov/data/feedgrains/StandardReports/YBtable4.htm.
United States Department of Agriculture, Economic Research Service (ERS). 2008b. "Feed Outlook." Available at http://usda.mannlib.cornell.edu/MannUsda/viewDocumentInfo.do?documentID=1273.
United States Department of Agriculture, Interagency Agricultural Projections Committee (IAPC). 2007. USDA Agricultural Projections to 2016. Long-term Projections Report OCE-2007-1. Available at http://www.ers.usda.gov/publications/oce071/oce20071.pdf.
United States Department of Agriculture, National Agricultural Statistics Service (NASS). 2004. "The 2002 Census of Agriculture." Available at http://www.agcensus.usda.gov/Publications/2002/index.asp.
United States Department of Agriculture, National Agricultural Statistics Service (NASS). 2008. "Quick Stats - U.S. & All States Data – Crops." Available at http://www.nass.usda.gov/QuickStats/Create_Federal_All.jsp.
United States Department of Energy, Energy Information Administration (EIA). 2008b. "U.S. Total Production and Consumption of Ethanol." Available at http://www.eere.energy.gov/afdc/data/docs/ethanol_production_consumption.xls.
Wu, M. 2008. “Analysis of the Efficiency of the U.S. Ethanol Industry 2007.” U.S. Department of Energy, Argonne National Laboratory, Center for Transportation Research. Paper Delivered to Renewable Fuels Association on March 27. Available at http://www1.eere.energy.gov/biomass/pdfs/anl_ethanol_analysis_2007.pdf.