risk management in water and wastewater utilities prof. simon pollard centre for water science...
TRANSCRIPT

Risk management in water and wastewater utilities
Prof. Simon Pollard
Centre for Water ScienceCranfield University, [email protected]
Presented at the LNECRisk Management in Civil EngineeringAdvanced Course, November, 2008

Context
• Growth in enterprise risk management since 1990’s• Paradox of ‘putting assets at risk to protect public health’• Nagging prevalence of water quality incidents• Stakeholder society has meant a re-interpretation of the
‘licence to operate’ (confidence)• Risk, innovation and opportunity• Rediscover our sector’s ‘basic assumption’ (why we are in
business) – the Bonn Charter

Safe drinking water - a public healthservice
© United Water (Suez), Hoboken water service, US
0
5
10
15
20
25
30
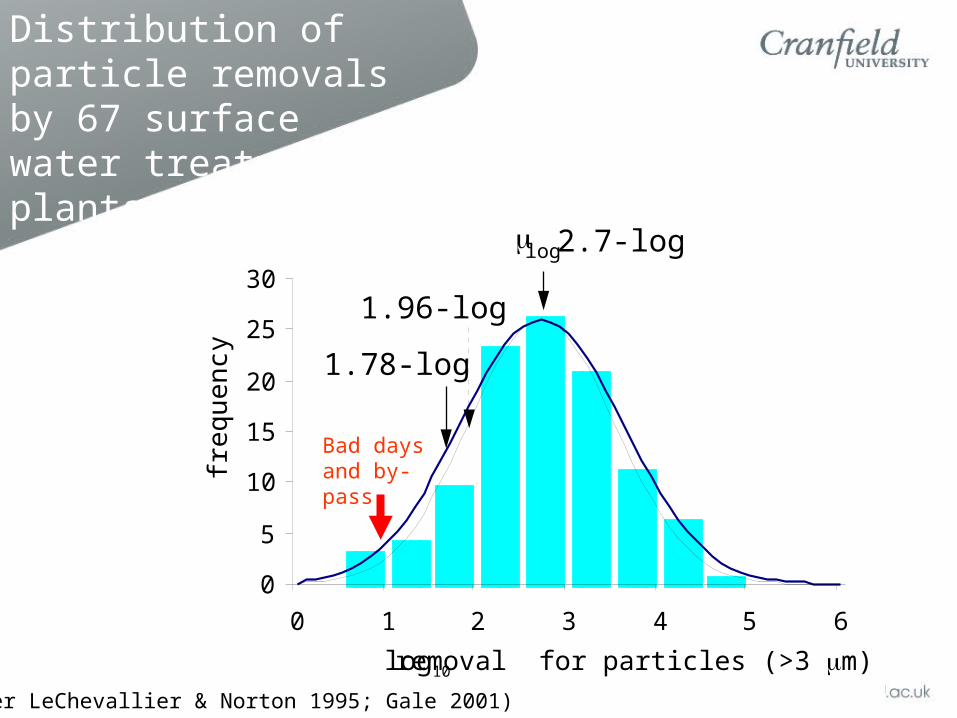
0 1 2 3 4 5 6
log10removal for particles (>3 m)
freq
uen
cy
1.96-log
1.78-log
log 2.7-log
Distribution of particle removals by 67 surface water treatmentplants
Bad daysand by-pass
(after LeChevallier & Norton 1995; Gale 2001)
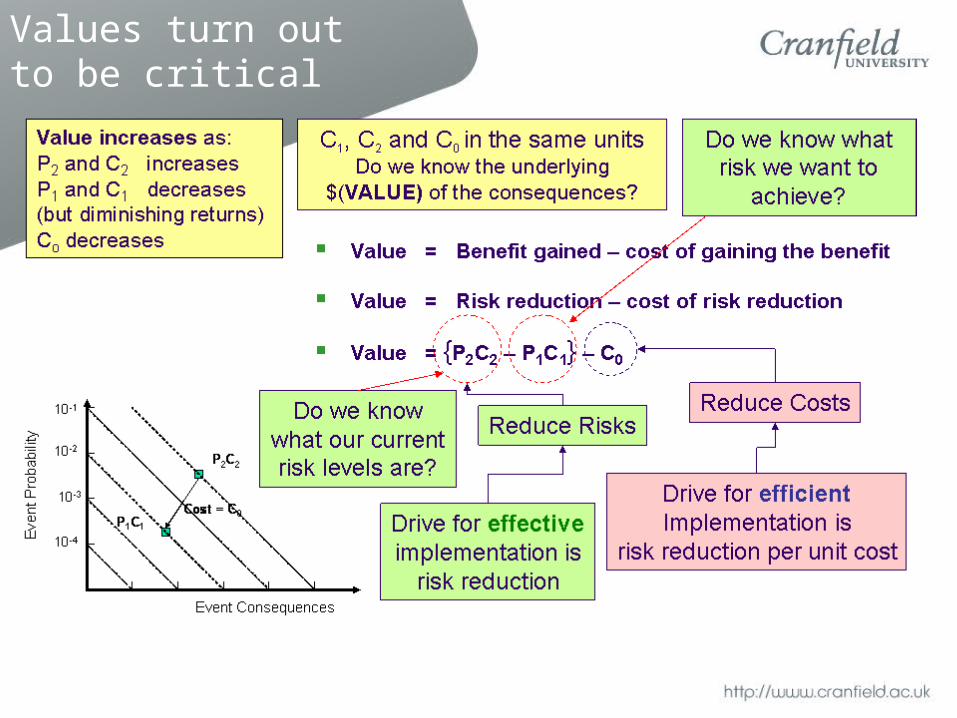
Values turn out to be critical

Capital investment
A 2 stage investment
process
Shareholders (and others)invest in company
Company invests inportfolio of projects
In a perfectly competitive market the portfolio of projects
achieves exactly the return demanded by shareholders and
other sources of finance; i.e. no value is created
(adapted from Srikanthan, 2007)

Business reality
Reduced risk more than return
Shareholder’s risk/return line
Increase return more than risk
Any strategy that moves below the line, reduces shareholder value
Risk
Return
XStart point

Time
Con
dit
ion
Inspect
Assessment of residual life (tr)
Remaining useful life (tU)
Inspection interval (tI) depends on: Current condition – condition assessment Rate of deterioration – time to failure Condition threshold - criticality
Projected
Good
Poor
Observed ‘Condition threshold’varies depends on criticality
The ‘well-being’ of assets

marg
inal
Healthy (assets, organisations, teams, individuals)
failed
Retain organisation redundancy if moving to ‘lean’
Reduce costs, more efficient
The danger is one of becoming failure tolerant. This not only increases failures, but makes them acceptable.
Before you go here, have you shared your appetite for risk?

20-30%Metrics for managerial resilience
• Safety ‘climate surveys’• Upward appraisal on safety • Situational judgement interviewsAccident
causation
Human factors
Safety culture
Operator error
Technical factors
+=
80-70%
~ 80% ~ 20%
Accidents and safety culture
(after Flin, 2005)

Well #5
Farm
Farm Manure contamination (i.e. chlorine demand)
overwhelmed chlorine dose, eliminating any effective disinfection
Chlorine residual was the only “real time” measure in place to detect organic contamination
chlorine residual = chlorine dose – chlorine demand
Heavy rains washed manure from barnyard into Well by penetration of the shallow soil cover Well 5 was being operated with a chlorine dose below 0.5 mg/L, despite a requirement to keep chlorine residual above 0.5 mg/L
What Happened at Well 5, Walkerton, Ontario?
(Hrudey, 2006)

Widespread illness began to emerge on May 18, with ~20 children absent from school and 2 children admitted to Owen Sound Hospital, ~65 km away, with bloody diarrhea
On May 19 a GI outbreak was evident in a retirement home, the Walkerton Hospital was overwhelmed with sick people and an investigation was launched by the local health unit suspecting a foodborne outbreak
May 2000 Walkerton, Ontario
(Hrudey, 2006)

• 7 people died from this outbreak• Mary Rose Raymond, a 2.5 year old, died on Tuesday, May 23.
She came from a nearby town to Walkerton for Mothers Day and drank only 1 glass of water
• An estimated 2,300 individuals were ill with gastroenteritis (half the town’s population)
• 65 patients were hospitalized • 27 developed haemolytic uremic syndrome (HUS)• 52 % of HUS cases were between 1 and 4 yrs• There is continuing illness in Walkerton today
Consequences

INCIDENT OCCURS
inadequate training
poor communication of importance of chlorine residual
absence of near miss reporting
rapid deterioration in raw water quality
loss of chlorine residual
operational procedures absent
Latent and active flaws lie dormant, or “if you don’t actively manage risk, it doesn’t go away, it just builds up”.
(after Reason, 2000)
How could this have happened in an affluent country?

1
2
3
4
5 SRP
ERAC
RA
RBDM
RR
RM IRM
SCRM
CRM
E&T
RKM
Class Processes
Core Strategic risk planning (SRP)
Establishing risk acceptance criteria (ERAC)
Risk analysis (RA)
Risk based decision making and review (RBDM)
Risk response (RR)
Risk monitoring (RM)
Integrating risk management (IRM)
Supporting
Supply chain risk management (SCRM)
Change risk management (CRM)
Long-term
Education and training in risk management (E&T)
Risk knowledge management (RKM)
Risk knowledge management andsupply chain risk management
Improving
How good are we, really, at preventatively managing risk?
(MacGillivray et al., 2007a, b)

Data Evidence
Information
Knowledge
simulations/ analysesexperimentstests & observationsmonitoring operationsbenchmarking
Decision making
Observation, reflection,and analysis
Justification
of decision
s
Organisational learning
‘Lessons Learnt’
knowledge base
input
The learningorganisation

Symbols• Risk management logo
•Management involvement inincident response
• Cleanliness of assets• Management performance
measured
Power structure• Reporting to a CEO led steering group• Decisions not solely cost- based• Dissenting voices heard and deference to expertise
Rituals & routines• High quality staff released to the project• Promotions on return to main business
• Risk becomes ‘business as usual’
Organisational structure• Specialist risk team• Group risk manager
• ‘Getting started’ on the risk management journey
Control systems• Training programme for
operational staff• Awareness programme
or company wide IT system• No blame attributed to
reported incidents or near misses
Risk culture• Open risk reporting• Proactive approach to risk• Risk taking and its rewards• ‘7 habits’ of good risk management• Explaining ‘why’ manage risk
Stories• Cataloguing major incidents from the past• Demonstrating the value of risk management• Graphics/pictures• Risks taken that paid off
(after Johnson, 1992; Content, 2005)
‘Culturalitems’
Getting the risk culture,Getting the culture right

Opportunities
Loss (€)
Implementation (years)
Safety culture: factor of 5-10improvement demonstrated
Risk management culture:additional factor of 3-5 believed
€ € € €
€
☺
☺
0 5 10
☺
Risk mature, self learning organisations

Lessons from safety cultures
• Contributory preconditions: - A combination of factors, each of which would be
unlikely, singly, to defeat the system.• Incubation period:
- A period of time between the first fault initiation and the failure during which time communication problems and noise can blend with signals to mask warnings.
- Concealed faults, incidents or partially understood events build up in a way at odds with existing beliefs and norms.
• Precipitating event- A catalyst without which the event would not occur at
that time and location.

Four key themes:(i) preventing harm to people, property or the
environment;(ii) operating core processes at the required
capacity - this time, next time and every time;(iii) minimizing the number of errors per unit of
activity;(iv) consistently meeting social and political
demands for performance – leadership and committment.
Can the water sector become a high reliability sector?

Risk management process
Strategic risk planning
Establishing risk acceptance criteria
Risk analysis
Risk based decision making and review
Risk response
Risk monitoring and feedback
Integrating risk management
Supply chain risk management
Change management
Education and training in risk management
Risk knowledge management
Risk capability maturity level1 2 3 4 5
Future focus

Summary
• Risk – integrated, holistic and concerned with opportunities, whilst not losing sight of the ‘basic assumption’ – public health protection
• Vigilance is a key ‘cultural item’• Managing risk knowledge is critical to becoming
a learning, high reliability organisation
• The new IWA Bonn Network as one vehicle to assist this – a one-stop shop, focused on better risk management for safe drinking water

“Risk analysis tools, risk management frameworks, risk champions, risk matrices and risk committees are
important organisational commitments …
… but alone, they are not enough to secure a risk management culture within
an organisation”.
Conclusion

References
Pollard, S., et al. (2007) Risk analysis strategies for credible and defensible utility decisions, Awwa Research Foundation Research Report 91168, Denver, CO, Ref 1P-3.25C-91168-02/07-NH, 88pp.
B.H. MacGillivray, J.V. Sharp, J.E. Strutt, P.D. Hamilton and S.J.T Pollard (2007) Benchmarking risk management within the international water utility sector. Part II: a survey of eight water utilities, J. Risk Research 10(1): 105-123
Pollard, S.J.T. (ed.) (2008) Risk management for water and wastewater utilities, IWA Publishing, London, 175pp.