risk management > interest rate risk
TRANSCRIPT

Copyright © 1996-2006 Investment Analytics Slide: 1Interest Rate Risk
Risk Management
Interest Rate RiskCopyright © 1996-2006
Investment Analytics

Copyright © 1996-2006 Investment Analytics Slide: 2Interest Rate Risk
AgendaBasic Concepts
Bond Values & Interest Rate RiskInterest Rate Risk Measurement
DurationImmunizationConvexityMulti-factor Duration Models
Advanced Interest Rate Risk ModelingIndex Rate DurationInterest Rate OptionsDeterministic & Simulation Analysis

Copyright © 1996-2006 Investment Analytics Slide: 3Interest Rate Risk
Bond Values and Interest Rates
What is the relationship between a bond’s price and interest rates?How does this sensitivity depend on the maturity of the bond?Are coupon bonds more sensitive to interest rates than zero coupon bonds?

Copyright © 1996-2006 Investment Analytics Slide: 4Interest Rate Risk
Interest Rate Risk - Example
Interest rate changes cause bond prices to fluctuate:Example: 8% coupon bond
• If rates are at 8%, it will sell at par• If rates rise to 9% , price must fall below par
– no-one will want to hold the bond at par value, so price will fall– must have expected capital gain to compensate for coupon below
market rate
• If rates fall to 7%, price will rise above par– everyone will bid for bond paying above market rate– forces price up & builds in expected capital loss to offset coupon
above current market rate
Copyright © 1996-2006 Investment Analytics Slide: 5Interest Rate Risk
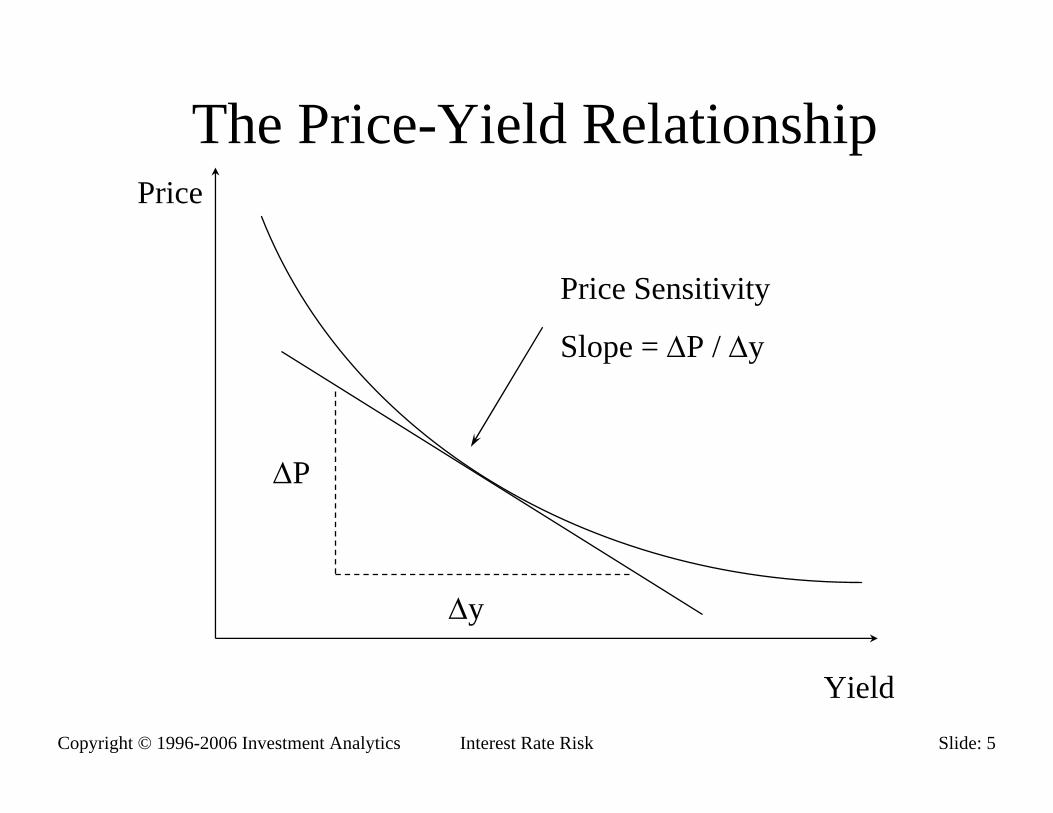
The Price-Yield RelationshipPrice
Yield
∆P
∆y
Price Sensitivity
Slope = ∆P / ∆y

Copyright © 1996-2006 Investment Analytics Slide: 6Interest Rate Risk
Worked Exercise:Bond Values & Interest Rates
Start Bond TutorSubject: Bond Values & Interest RatesFollow worked exercise

Copyright © 1996-2006 Investment Analytics Slide: 7Interest Rate Risk
Factors Affecting Interest Rate Sensitivity
TermLong term bonds are more sensitive than short term bonds
CouponLow (Zero) coupon bonds are more sensitive than high coupon bonds
Yieldbonds at lower yields are more sensitive than at higher yields
Copyright © 1996-2006 Investment Analytics Slide: 8Interest Rate Risk
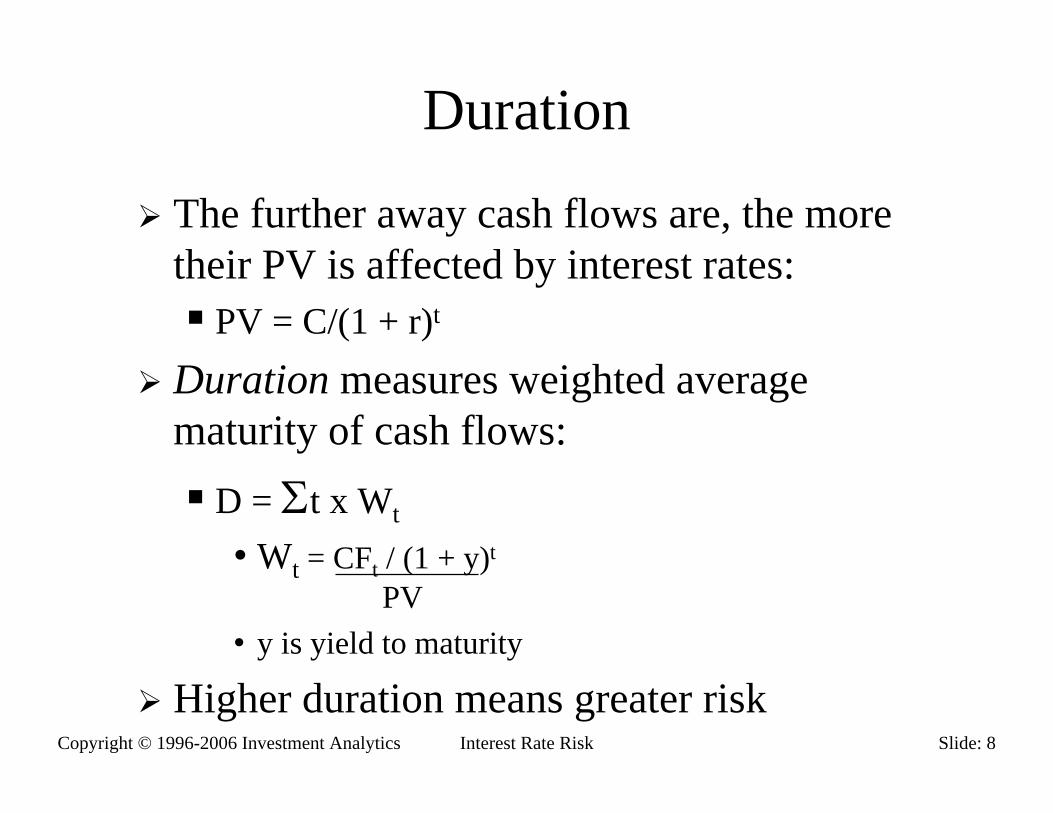
Duration
The further away cash flows are, the more their PV is affected by interest rates:
PV = C/(1 + r)t
Duration measures weighted average maturity of cash flows:
D = Σt x Wt
• Wt = CFt / (1 + y)t
PV• y is yield to maturity
Higher duration means greater risk

Copyright © 1996-2006 Investment Analytics Slide: 9Interest Rate Risk
Duration & Risk
Impact of changes in YTM:• ∆P = -[D / (1 + y)] x P x ∆y• D / (1 + y) is known as modified duration D*• D* = [∆P / P] x (1 / ∆y)• Percentage price change [∆P / P] = D* x ∆y
Limitations:Small changes in yParallel changes in yield curve
Copyright © 1996-2006 Investment Analytics Slide: 10Interest Rate Risk
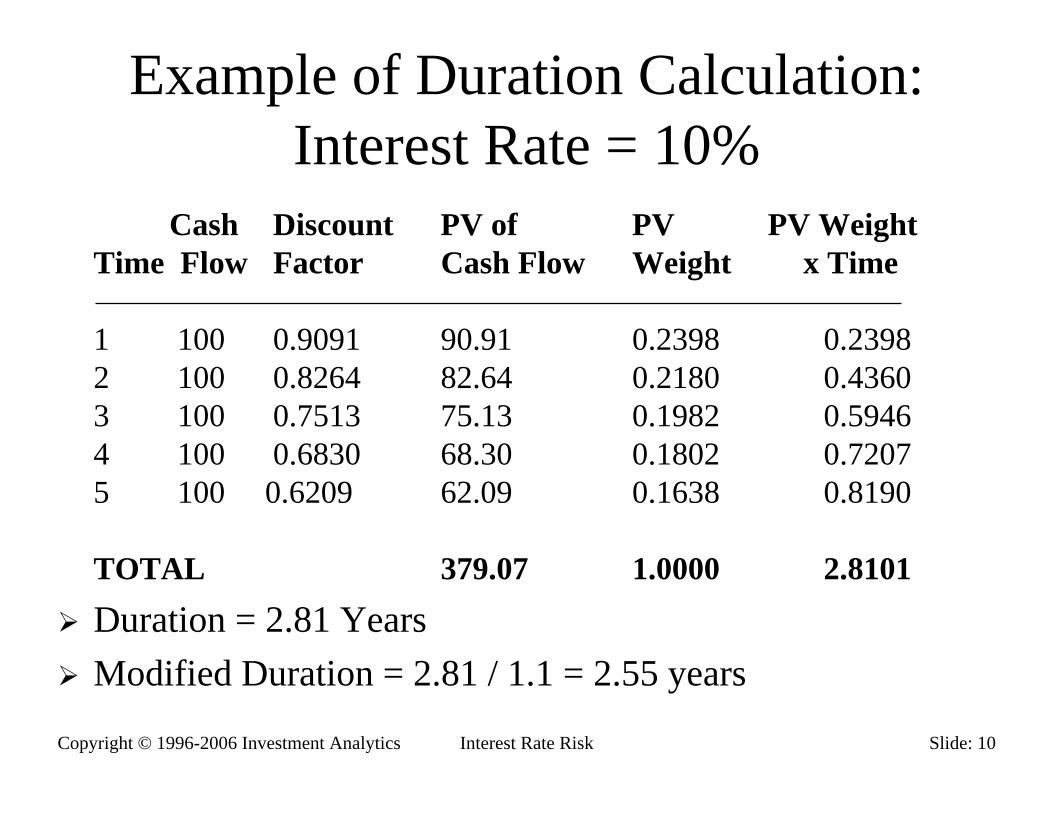
Example of Duration Calculation: Interest Rate = 10%
Cash Discount PV of PV PV WeightTime Flow Factor Cash Flow Weight x Time
1 100 0.9091 90.91 0.2398 0.23982 100 0.8264 82.64 0.2180 0.43603 100 0.7513 75.13 0.1982 0.59464 100 0.6830 68.30 0.1802 0.72075 100 0.6209 62.09 0.1638 0.8190
TOTAL 379.07 1.0000 2.8101
Duration = 2.81 YearsModified Duration = 2.81 / 1.1 = 2.55 years
Copyright © 1996-2006 Investment Analytics Slide: 11Interest Rate Risk
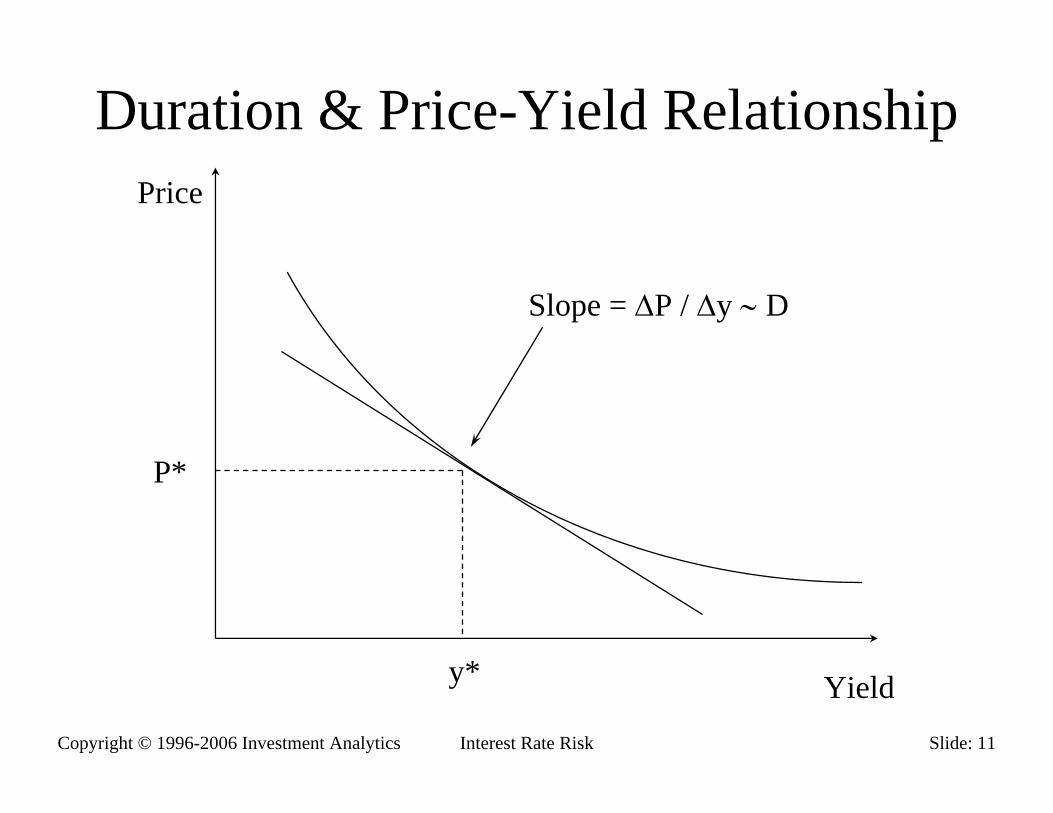
Duration & Price-Yield RelationshipPrice
Yield
P*
y*
Slope = ∆P / ∆y ∼ D

Copyright © 1996-2006 Investment Analytics Slide: 12Interest Rate Risk
Two Ways to Think About Duration
Weighted Average Time to MaturityWeight the time of each cashflow by proportion of total NPV it represents
As the sensitivity of a security’s PV to change in interest rates
Sensitivity = δP/δy = -Σt [CFt / (1 + y)t] x 1/P

Copyright © 1996-2006 Investment Analytics Slide: 13Interest Rate Risk
Immunization
If duration of assets = duration of liabilitiesvalue of assets = value of liabilities
Portfolio is “immunized”Portfolio value will be unchanged
for small, parallel changes in yield

Copyright © 1996-2006 Investment Analytics Slide: 14Interest Rate Risk
Worked Exercise on Duration
Start Bond TutorSubject: DurationFollow worked exercise

Copyright © 1996-2006 Investment Analytics Slide: 15Interest Rate Risk
Trading Case B04
Flat yield curve 25%Can move to: 5% to 45%You have a liability/asset which you cannot tradeMust try and preserve value of portfolio
Copyright © 1996-2006 Investment Analytics Slide: 16Interest Rate Risk
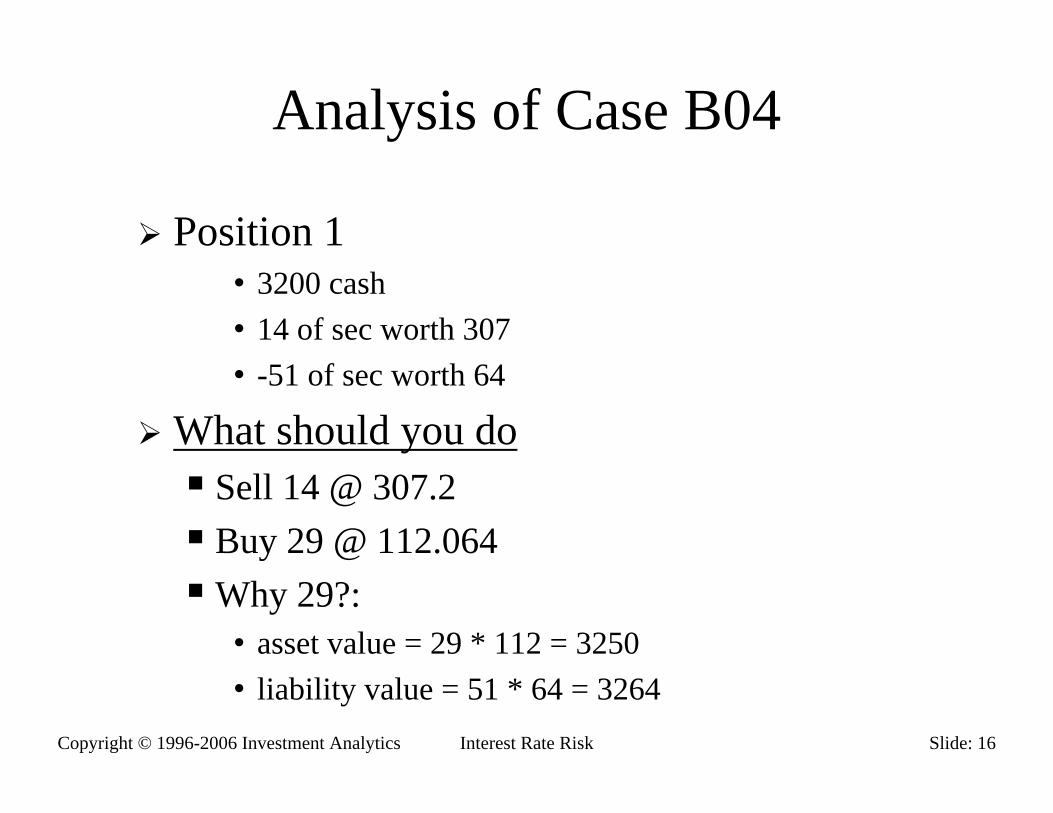
Analysis of Case B04
Position 1• 3200 cash• 14 of sec worth 307• -51 of sec worth 64
What should you doSell 14 @ 307.2Buy 29 @ 112.064Why 29?:
• asset value = 29 * 112 = 3250• liability value = 51 * 64 = 3264

Copyright © 1996-2006 Investment Analytics Slide: 17Interest Rate Risk
Analysis of Case B04
Note: cash = 4250 after trade
“instantaneous exposure”

Copyright © 1996-2006 Investment Analytics Slide: 18Interest Rate Risk
Analysis of case B04Exposure at end of period
Copyright © 1996-2006 Investment Analytics Slide: 19Interest Rate Risk
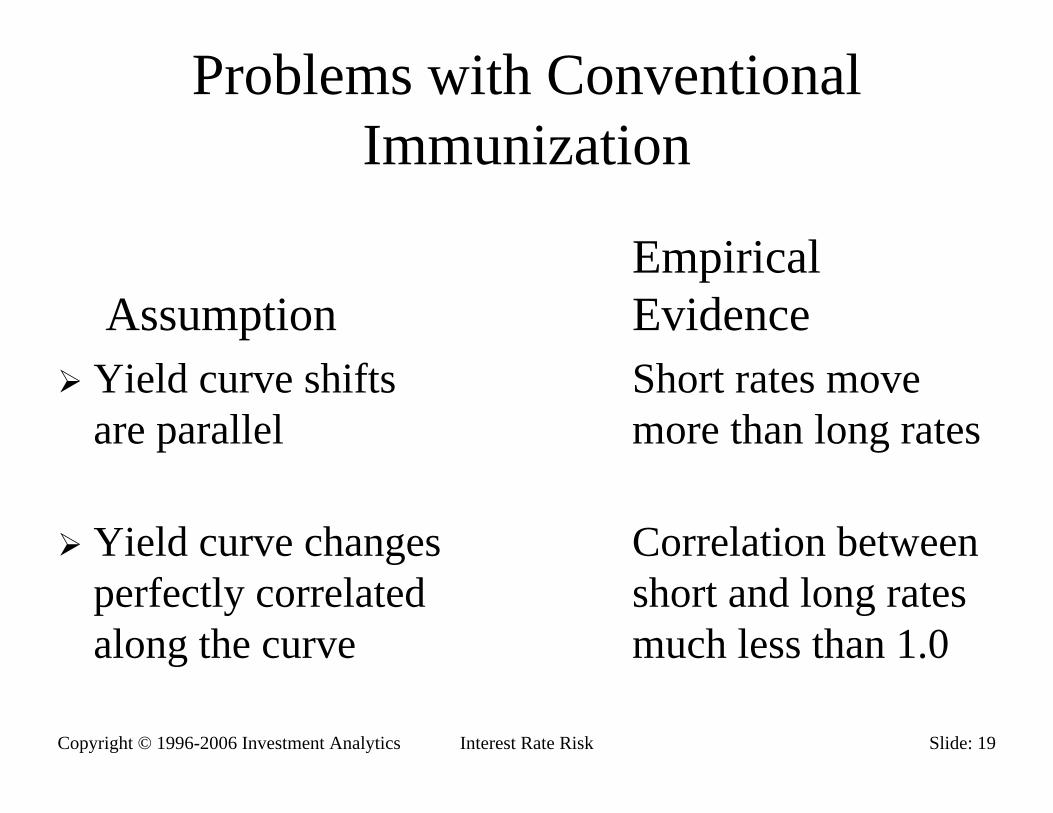
Problems with Conventional Immunization
EmpiricalAssumption Evidence
Yield curve shifts Short rates moveare parallel more than long rates
Yield curve changes Correlation betweenperfectly correlated short and long ratesalong the curve much less than 1.0

Copyright © 1996-2006 Investment Analytics Slide: 20Interest Rate Risk
Price Approximation Using DurationPrice
Yield
P*
y*
Error in estimating price based on duration
y1 y2
Actual Price

Copyright © 1996-2006 Investment Analytics Slide: 21Interest Rate Risk
Convexity
Duration assumes linear price-yield relationshipDuration proportional to the slope of the tangent lineAccurate for small changes in yield
Convexity recognizes that price-yield relationship is curvilinear
Important for large changes in yield

Copyright © 1996-2006 Investment Analytics Slide: 22Interest Rate Risk
Convexity Formula
Dollar Convexity:• δ2P / δy2 = ΣCFt x t(t+1) / (1 + y)t+2
Price change due to convexity:• ∆P = Dollar Convexity x (∆y)2
Convexity = [δ2P / δy2] x (1 / P)Percentage price change due to convexity:• ∆P / P = 0.5 x Convexity x (∆y)2

Copyright © 1996-2006 Investment Analytics Slide: 23Interest Rate Risk
Convexity Adjustment: ExampleStraight Bond
• 6% coupon, 25yr, yield 9%• Modified Duration =10.62• Convexity = 182.92
% Price Change:Yield Duration Convexity TotalMove (D* ∆y) 0.5 x C (∆y)2
+200bp -21.24% 3.66% -17.58%-200bp +21.24% 3.66% +24.90%

Copyright © 1996-2006 Investment Analytics Slide: 24Interest Rate Risk
Summary: Interest Rates & Risk
How interest rates affect bond pricesDurationImmunizationConvexity

Copyright © 1996-2006 Investment Analytics Slide: 25Interest Rate Risk
A Two Factor Model of Yield Curve Changes
Change in Change Changespot rate = At x in short rate + Bt x in long rate
= αt x Change + βt x Change inin spread long rate
Spread: (Long rate - Short rate)Two factor Model:αT : sensitivity of T-period spot rate to changes in spreadβT: sensitivity of T-period spot rate to changes in long rate
Copyright © 1996-2006 Investment Analytics Slide: 26Interest Rate Risk
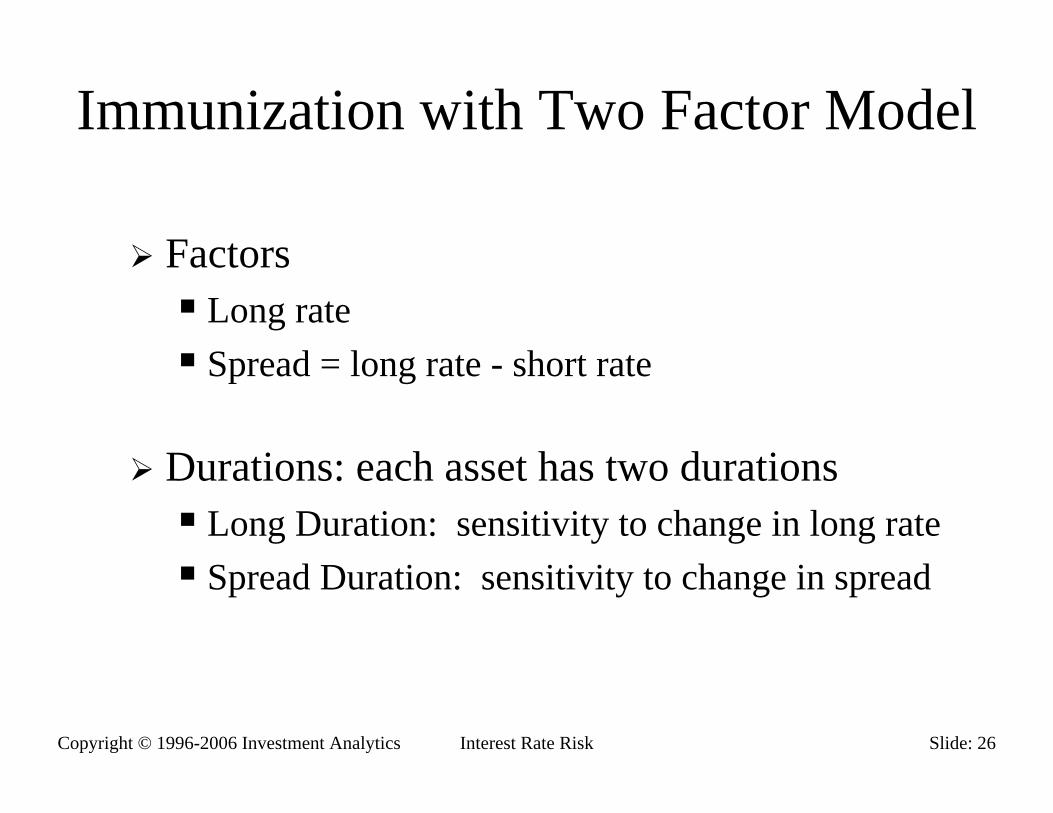
Immunization with Two Factor Model
FactorsLong rateSpread = long rate - short rate
Durations: each asset has two durationsLong Duration: sensitivity to change in long rateSpread Duration: sensitivity to change in spread

Copyright © 1996-2006 Investment Analytics Slide: 27Interest Rate Risk
Computing Two Factor Durations
Duration formula:DS = -ΣTi αTi[cie-RTi/PV]
DL = -ΣTi βTi[cie-RTi/PV]
Regression Analysis∆RT = AT + αT∆S + βT∆L + εT

Copyright © 1996-2006 Investment Analytics Slide: 28Interest Rate Risk
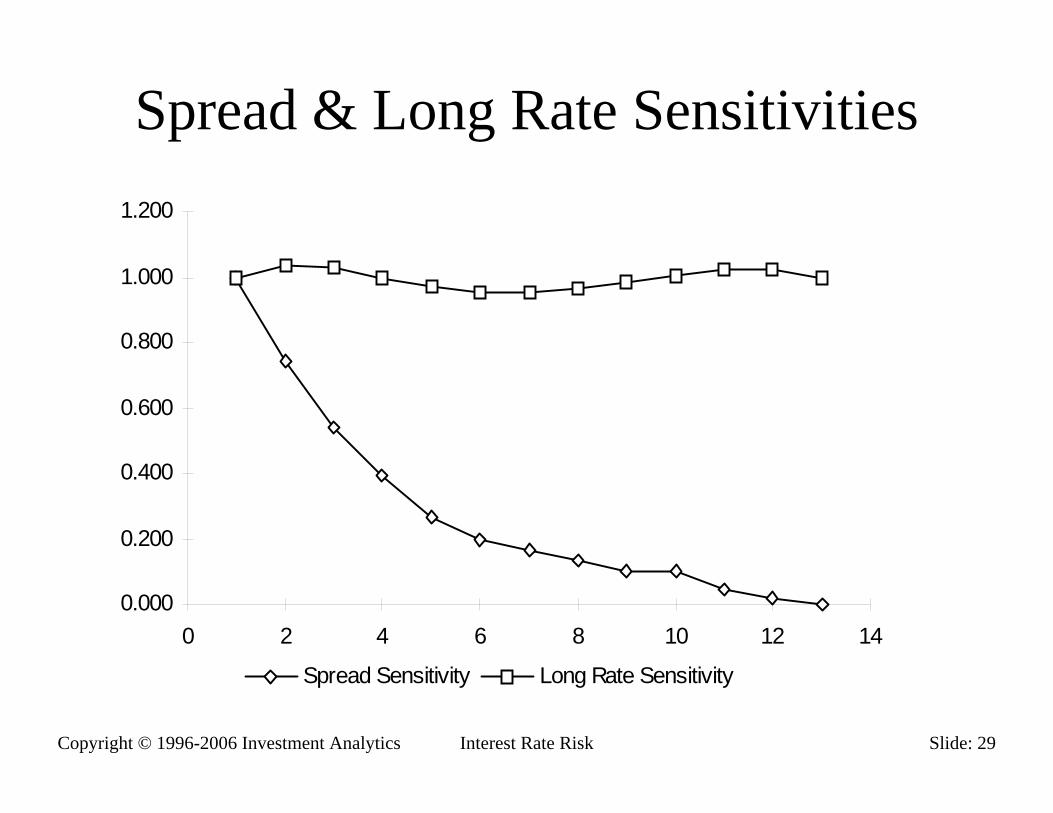
Estimated Long Rate & Spread Sensitivities (Nelson/Schaefer)
Maturity (Years)
Spread Sensitivity
Long Rate Sensitivity
1 1.000 1.0002 0.743 1.0363 0.542 1.0264 0.391 0.9975 0.269 0.9706 0.200 0.9537 0.163 0.9508 0.131 0.9629 0.100 0.983
10 0.100 1.00511 0.043 1.02212 0.019 1.02213 0.000 1.000
Copyright © 1996-2006 Investment Analytics Slide: 29Interest Rate Risk
Spread & Long Rate Sensitivities
0.000
0.200
0.400
0.600
0.800
1.000
1.200
0 2 4 6 8 10 12 14
Spread Sensitivity Long Rate Sensitivity

Copyright © 1996-2006 Investment Analytics Slide: 30Interest Rate Risk
Implied Spot Rates: Relative Importance of Factors
% of Total Explained Variance Accounted for by
MaturityTotal Variance
Explained Factor 1 Factor 2 Factor 36 Months 99.5 79.5 17.2 3.31 year 99.4 89.7 10.1 0.22 years 98.2 93.4 2.4 4.25 years 98.8 98.2 1.1 0.78 years 98.7 95.4 4.6 0.010 years 98.8 92.9 6.9 0.214 years 98.4 86.2 11.5 2.218 years 93.5 80.5 14.3 5.2
Average 98.4 89.5 8.5 2.0
Source: Journal of Fixed Income, “Volatility and the Yield Curve”, Litterman, Scheinkman & Weiss
Copyright © 1996-2006 Investment Analytics Slide: 31Interest Rate Risk
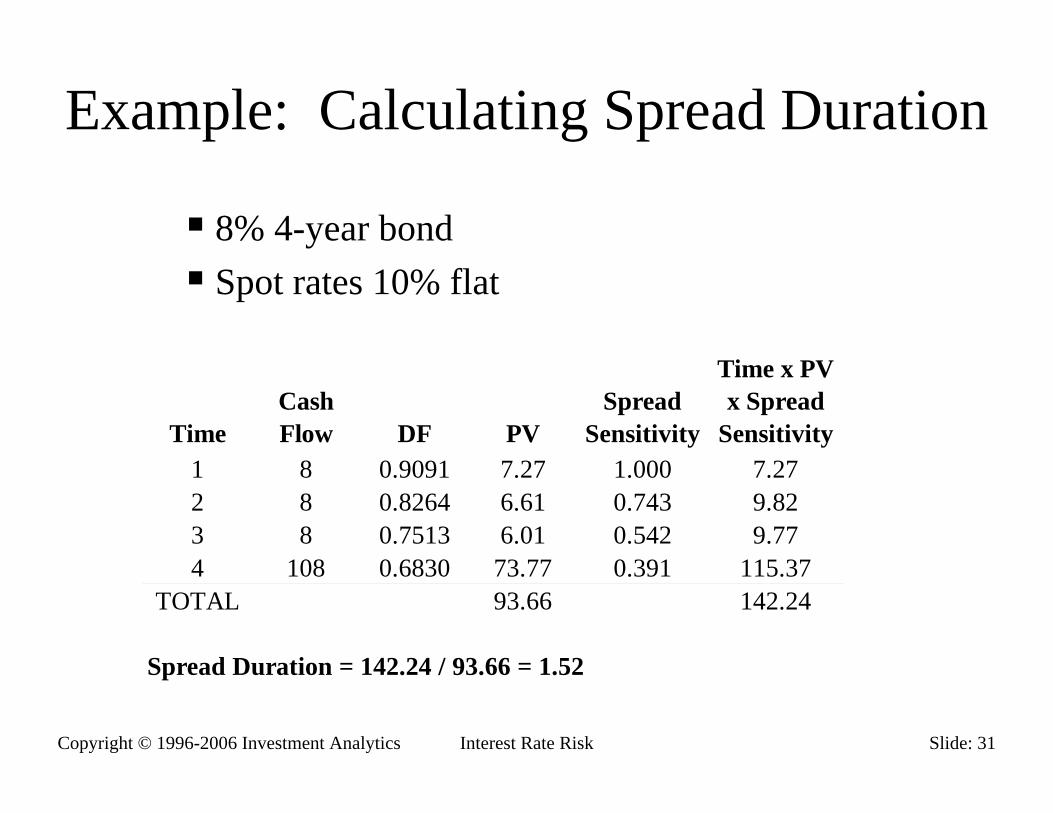
Example: Calculating Spread Duration
8% 4-year bondSpot rates 10% flat
TimeCash Flow DF PV
Spread Sensitivity
Time x PV x Spread
Sensitivity1 8 0.9091 7.27 1.000 7.272 8 0.8264 6.61 0.743 9.823 8 0.7513 6.01 0.542 9.774 108 0.6830 73.77 0.391 115.37
TOTAL 93.66 142.24
Spread Duration = 142.24 / 93.66 = 1.52

Copyright © 1996-2006 Investment Analytics Slide: 32Interest Rate Risk
Immunization ConditionsPortfolio Weights add to OneMatch Spread Duration
Weighted average of spread duration of assets = spread duration of liabilities
Match Long DurationWeighted average of long duration of assets = long duration of liabilities
Equationsw1 + w2 + w3 = 1w1D1S + w2D2S + w3D3S = DS
w1D1L + w2D2L + w3D3L = DL
Copyright © 1996-2006 Investment Analytics Slide: 33Interest Rate Risk
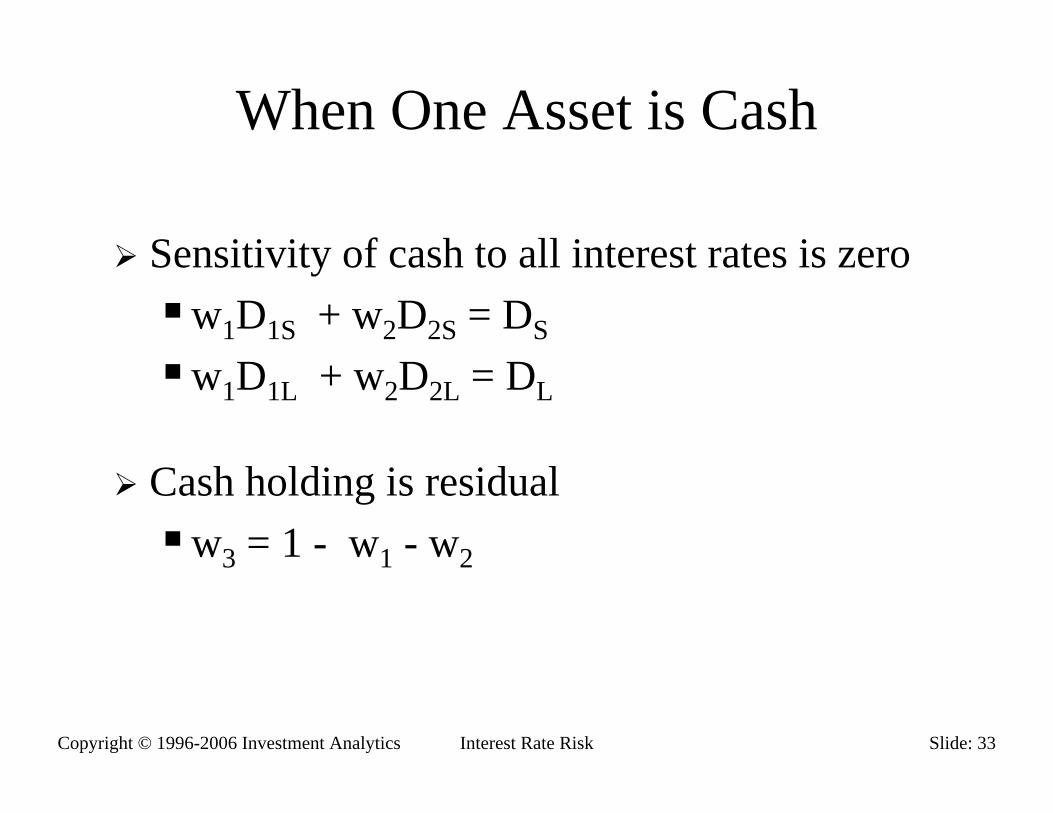
When One Asset is Cash
Sensitivity of cash to all interest rates is zerow1D1S + w2D2S = DS
w1D1L + w2D2L = DL
Cash holding is residualw3 = 1 - w1 - w2

Copyright © 1996-2006 Investment Analytics Slide: 34Interest Rate Risk
Lab: Bond Hedging ExerciseWorksheet: Bond HedgingScenario:
You have a short position in 8-year bondsHave to hedge using 3 and 15 year bonds
HedgingCreate conventional duration hedgeTest under 4 scenariosCreate 2-factor duration hedgeRepeat test & compare
See Notes & Solution

Copyright © 1996-2006 Investment Analytics Slide: 35Interest Rate Risk
Solution: Bond Hedging ExerciseHedge Structure Method Holdings
Cash 3yr 8yr 15yrConventional 0.00 0.3538 -1.000 0.6462Two-Factor -.0089 0.4599 -1.000 0.5490
Hedge Performance (Profit/Loss)Scenario Conventional 2-Factor
I -27bp 3bpII -29bp 3bpIII 28bp 2bpIV 25bp 2bp

Copyright © 1996-2006 Investment Analytics Slide: 36Interest Rate Risk
Advanced Interest Risk Modeling
Index rate contingent cash flowsKey Treasury Rate Duration
Interest rate optionsOption-adjusted duration
Analytical methodsDeterministicMonte Carlo simulation

Copyright © 1996-2006 Investment Analytics Slide: 37Interest Rate Risk
Duration Risk MeasurementRecall: (dP/P) = - D* x drModified Duration D* = -(dP/dr) x 1/P
For swaps & derivatives concept of duration is ambiguous
Need to measure sensitivity to changes in:Index Rate
DURINDEX = -(dP/drindex) x 1/P
Discount RateDURDISC = -(dP/drdisc) x 1/P
Copyright © 1996-2006 Investment Analytics Slide: 38Interest Rate Risk
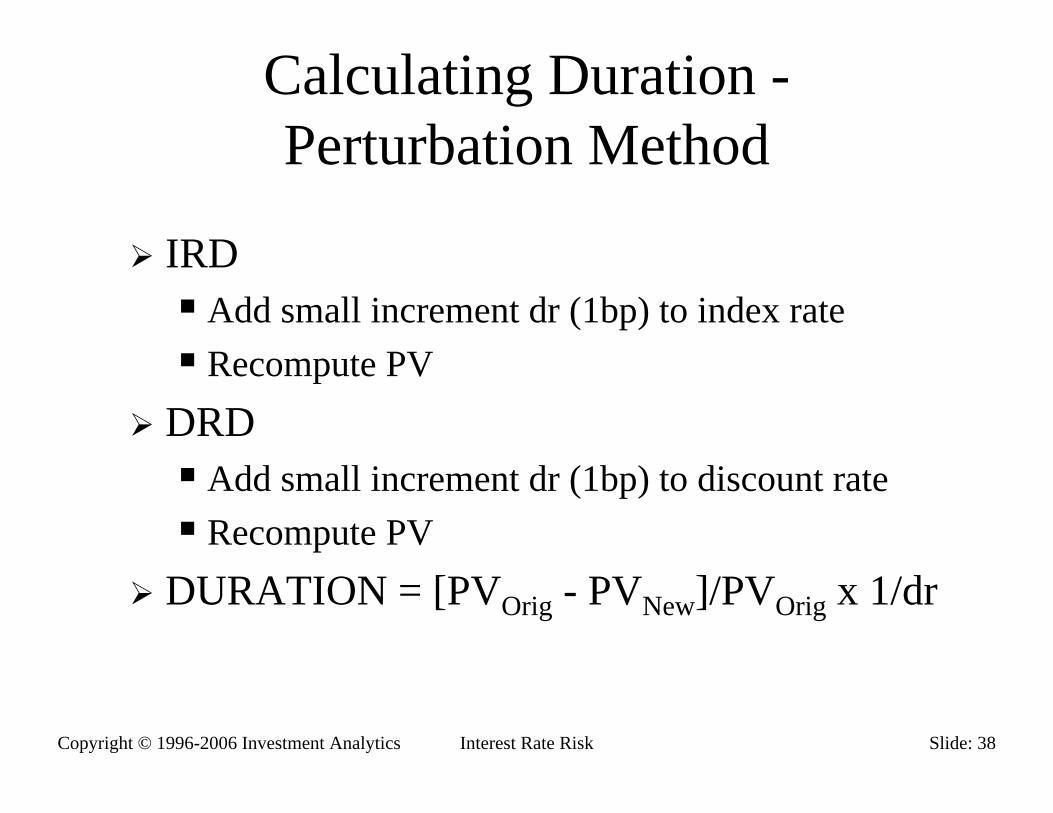
Calculating Duration -Perturbation Method
IRDAdd small increment dr (1bp) to index rateRecompute PV
DRD Add small increment dr (1bp) to discount rateRecompute PV
DURATION = [PVOrig - PVNew]/PVOrig x 1/dr

Copyright © 1996-2006 Investment Analytics Slide: 39Interest Rate Risk
Discount Rate
Can be found by assuming cash flows are non-contingentYTM of comparable fixed coupon note of same maturityHence DURDISC = Duration of vanilla note
E.g. for 3-yr note DRD = 2.8 yrsException: Note which has indeterminate maturity

Copyright © 1996-2006 Investment Analytics Slide: 40Interest Rate Risk
Index rateE.g. 3-yr FRNCoupon = 3-month LIBOR, paid quarterlyWhat is appropriate index rate?
NOT 3-month LIBORAggregate of all floating rate components
• 12 different IR’s in this example
Solution: swap rateSummarizes entire LIBOR cash flow streamExpressed as a spread over 3-year treasury rateHence DURINDEX = -2.8 approx.
Copyright © 1996-2006 Investment Analytics Slide: 41Interest Rate Risk
Net Duration
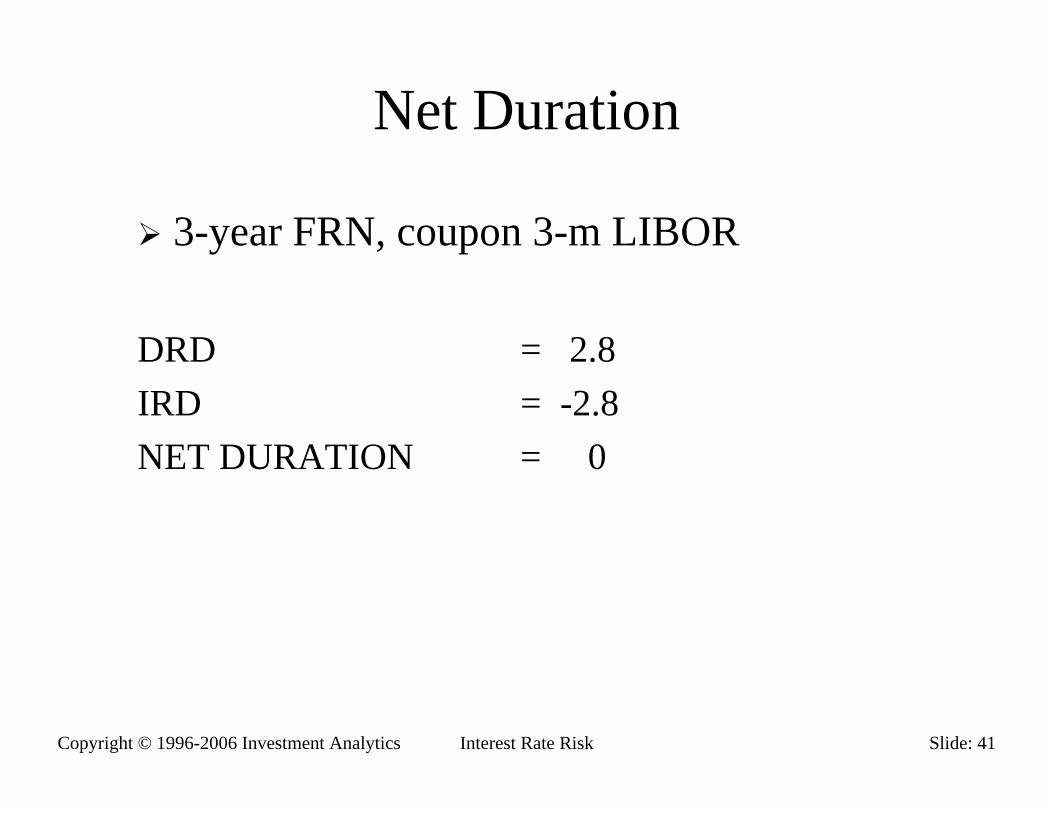
3-year FRN, coupon 3-m LIBOR
DRD = 2.8IRD = -2.8NET DURATION = 0

Copyright © 1996-2006 Investment Analytics Slide: 42Interest Rate Risk
Key Treasury Rate Duration (KTRD)
Calculates change in price wrt change in one segment of the Treasury curve.Used when Index rate and Discount rate are not equal
Copyright © 1996-2006 Investment Analytics Slide: 43Interest Rate Risk
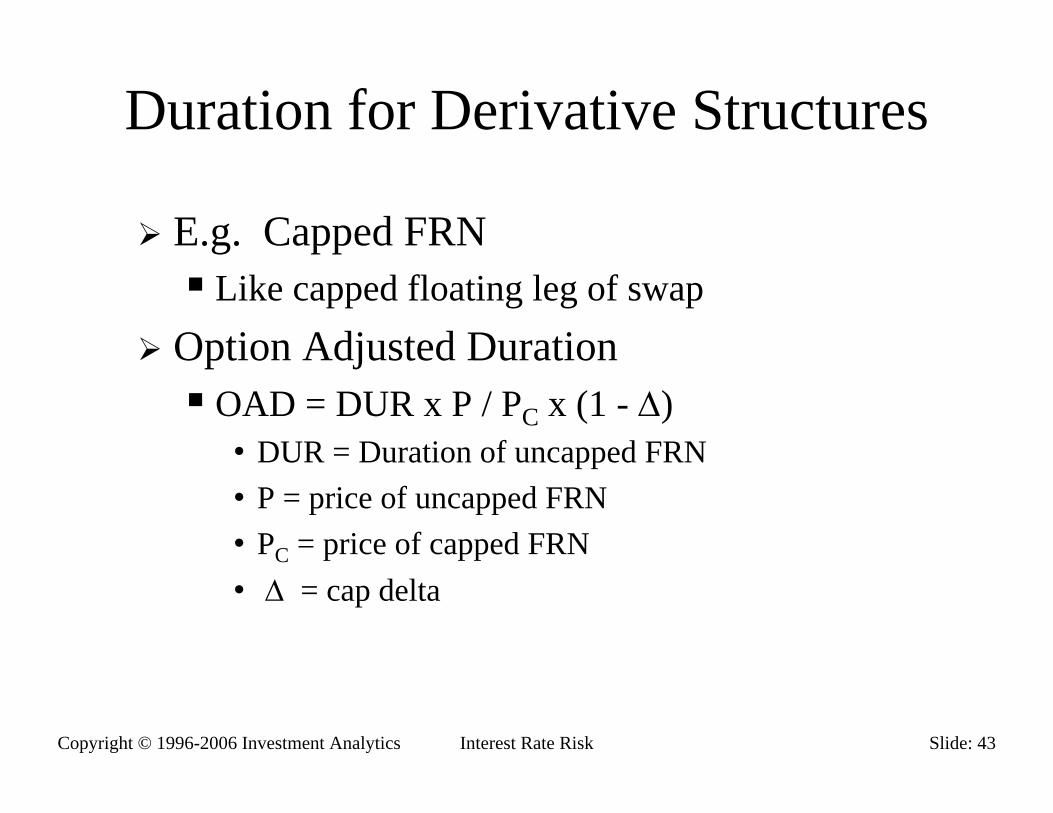
Duration for Derivative Structures
E.g. Capped FRNLike capped floating leg of swap
Option Adjusted DurationOAD = DUR x P / PC x (1 - ∆)
• DUR = Duration of uncapped FRN• P = price of uncapped FRN• PC = price of capped FRN• ∆ = cap delta

Copyright © 1996-2006 Investment Analytics Slide: 44Interest Rate Risk
Deterministic Analysis & Option Delta
0.0
1.0
K
Delta
Deterministic analysisOption analysis
Deterministic analysis underestimates delta
Deterministic analysis overestimates delta

Copyright © 1996-2006 Investment Analytics Slide: 45Interest Rate Risk
Volatility Duration
Applies to securities with embedded optionalityDURVOL = - (1/P) x (dP/dσ)
= - (1/P) x VegaVega greatest for ATM options

Copyright © 1996-2006 Investment Analytics Slide: 46Interest Rate Risk
Cap Vega
Interest Rate Cap Vega
0
5
10
15
20
25
30
K
Veg
a
Copyright © 1996-2006 Investment Analytics Slide: 47Interest Rate Risk
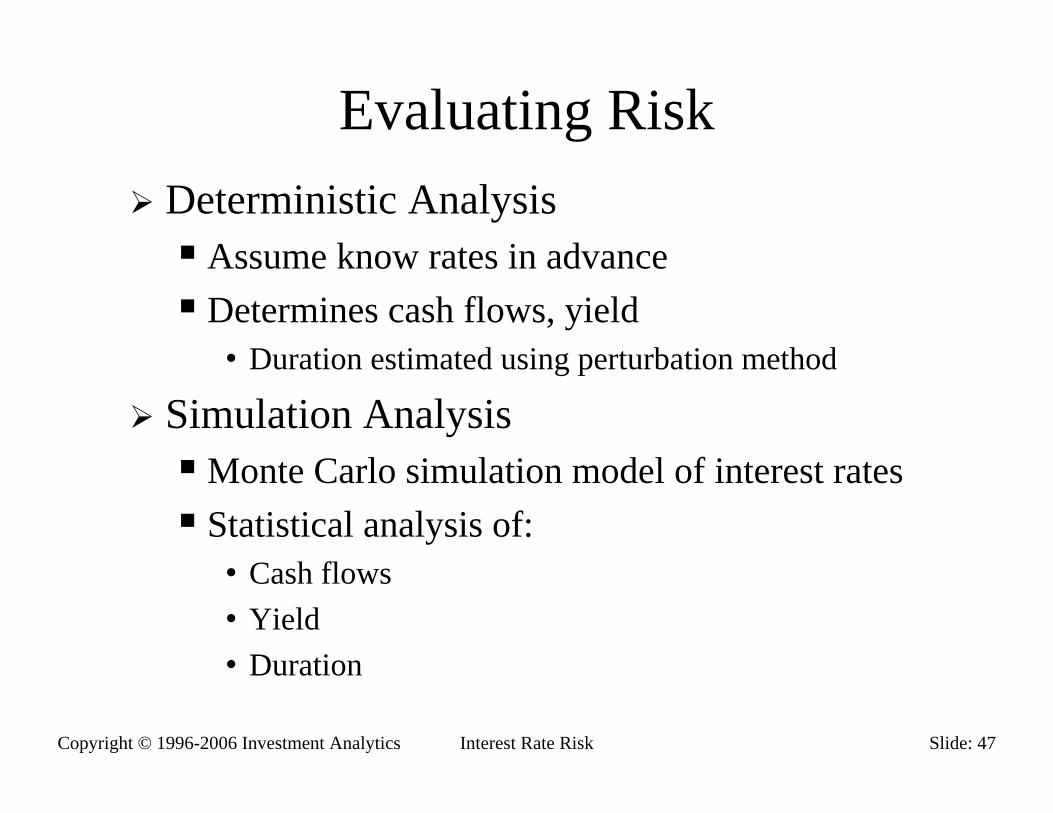
Evaluating RiskDeterministic Analysis
Assume know rates in advanceDetermines cash flows, yield
• Duration estimated using perturbation method
Simulation AnalysisMonte Carlo simulation model of interest ratesStatistical analysis of:
• Cash flows• Yield• Duration

Copyright © 1996-2006 Investment Analytics Slide: 48Interest Rate Risk
Deterministic Analysis
Forward AnalysisAssumes index spot rates move to forwardsProblem of bias
• Forward rates typically exceed future spot rates
Expectation analysisProjects ‘expected’ spot rates
Copyright © 1996-2006 Investment Analytics Slide: 49Interest Rate Risk
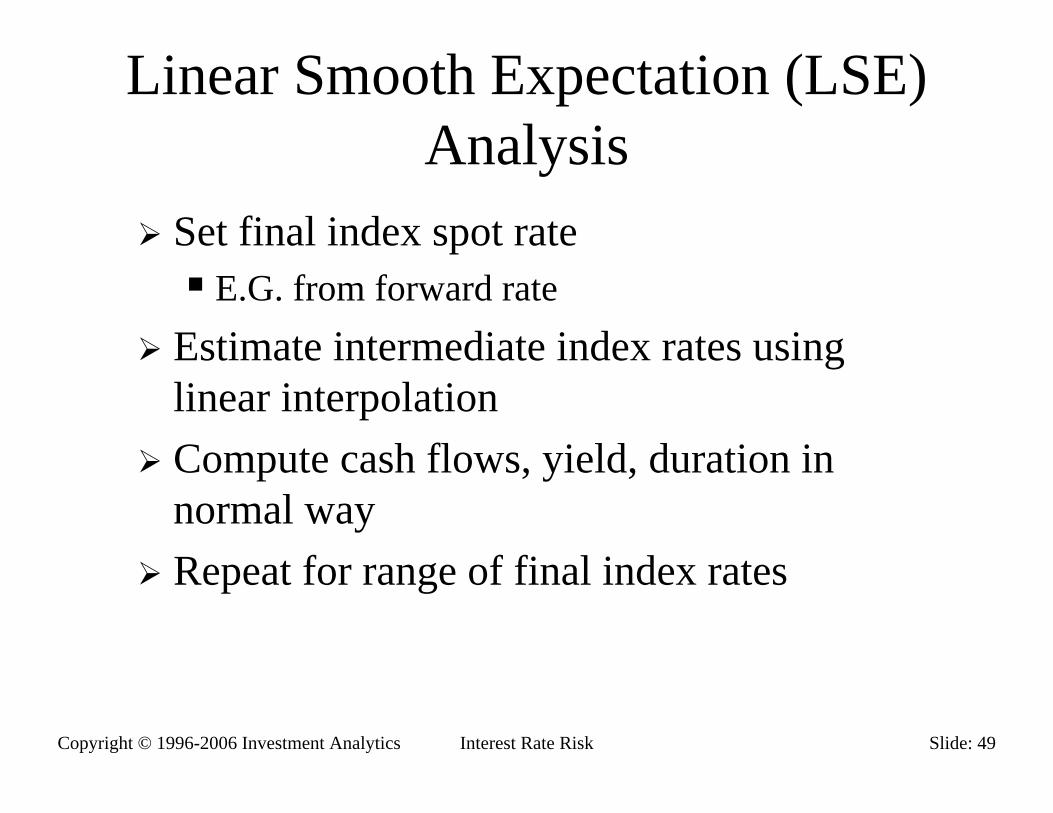
Linear Smooth Expectation (LSE) Analysis
Set final index spot rateE.G. from forward rate
Estimate intermediate index rates using linear interpolationCompute cash flows, yield, duration in normal wayRepeat for range of final index rates

Copyright © 1996-2006 Investment Analytics Slide: 50Interest Rate Risk
Monte-Carlo Methodology
Simulate movement in index ratesCalculate cash flows, PV’s, yield, durationRepeat large no of timesCreate histogram of yield, duration values
Calculate average yield, duration

Copyright © 1996-2006 Investment Analytics Slide: 51Interest Rate Risk
Generating Simulated Index RatesR + ∆R = R x Exp[(µ−σ2/2)∆t + σ∆z]
• ∆R is change in index rate• µ is drift factor• σ is volatility• ∆Z = ε(∆t)1/2
• ε is normal random variable, No(0,1)
Procedure:Generate ε (random)Compute new index rates, cash flows, etcEstimate duration using perturbation methodRepeat many times (10,000+)

Copyright © 1996-2006 Investment Analytics Slide: 52Interest Rate Risk
ExampleYTM Probability Distribution
0.00%
2.00%
4.00%
6.00%
8.00%
10.00%
12.00%
3.45
%
3.68
%
3.91
%
4.14
%
4.37
%
4.60
%
4.83
%
5.06
%
5.29
%
5.52
%
5.75
%
Mor
e
YTM
Freq
uenc
y

Copyright © 1996-2006 Investment Analytics Slide: 53Interest Rate Risk
Lab: Capped FRNStart with simple 3-year FRN, quarterly LIBOR
Confirm IRD = - DRDFRN Coupon LIBOR + 0.5%, 5.5% Cap
Calculate IRD, DRD, Net DurationUse simulation analysis to estimate yield, durationUse LSE analysis to compute yield, durationCompare LSE & simulation analysisCompare OAD with deterministic & simulation analysis

Copyright © 1996-2006 Investment Analytics Slide: 54Interest Rate Risk
Solution: Capped FRN
Duration Estimates
0.00
0.50
1.00
1.50
2.00
2.50
3.5% 4.5% 5.5% 6.5% 7.5% 8.5% 9.5% 10.5% 11.5% 12.5%
LIBOR at Maturity
Dur
atio
n LSE DUR
SIM DUR
OAD
Copyright © 1996-2006 Investment Analytics Slide: 55Interest Rate Risk
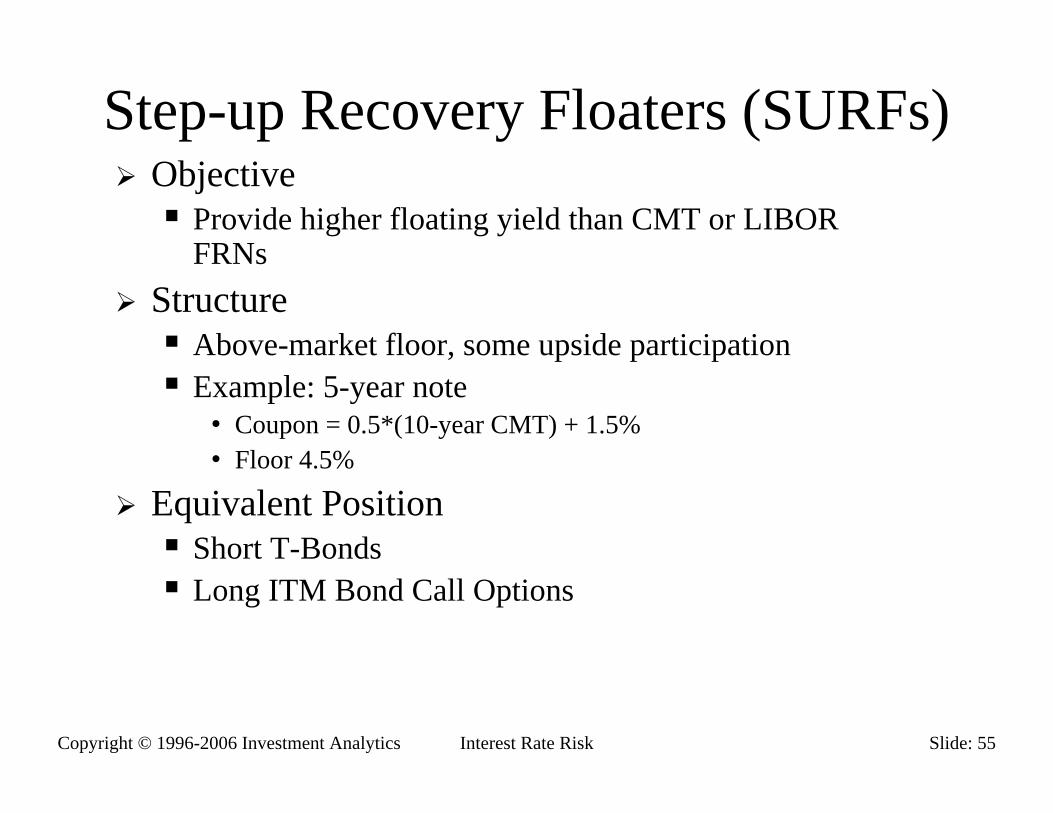
Step-up Recovery Floaters (SURFs)Objective
Provide higher floating yield than CMT or LIBOR FRNs
StructureAbove-market floor, some upside participationExample: 5-year note
• Coupon = 0.5*(10-year CMT) + 1.5%• Floor 4.5%
Equivalent PositionShort T-BondsLong ITM Bond Call Options
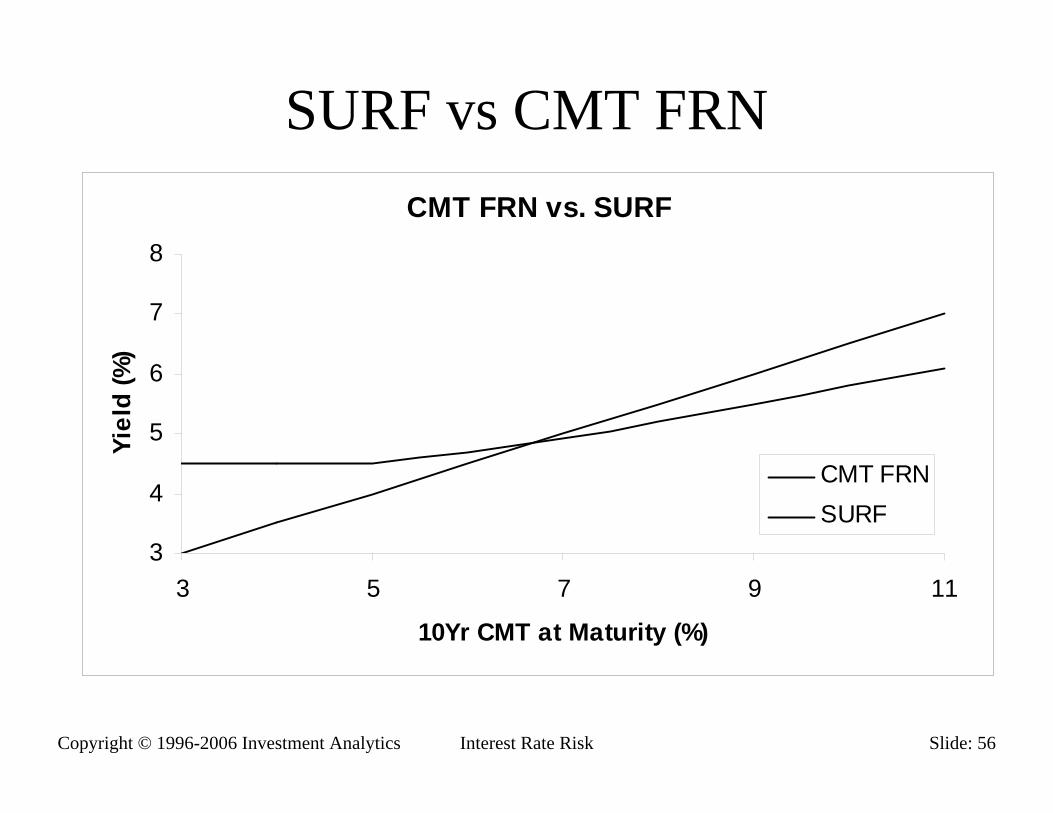
Copyright © 1996-2006 Investment Analytics Slide: 56Interest Rate Risk
SURF vs CMT FRNCMT FRN vs. SURF
3
4
5
6
7
8
3 5 7 9 11
10Yr CMT at Maturity (%)
Yiel
d (%
)
CMT FRNSURF

Copyright © 1996-2006 Investment Analytics Slide: 57Interest Rate Risk
SURF Risk FactorsNet Duration
A lower rates, behaves like a fixed income security• Due to coupon floor• Hence higher duration a low rates
At higher rates, behaves more like an FRN• Hence lower duration at high rates
Volatility DurationLong a floor option, positive VegaHence negative Vol. DurationValue of floor (and note) increases with volatility

Copyright © 1996-2006 Investment Analytics Slide: 58Interest Rate Risk
SURF - Net DurationNet Duration of SURF
2.0
2.5
3.0
3.5
4.0
4.5
3 4 5 6 7 8 9 10 1110Yr CMT at Maturity
Dura
tion

Copyright © 1996-2006 Investment Analytics Slide: 59Interest Rate Risk
SURF - Volatility DurationVolatility Duration
-10
-8
-6
-4
-2
03 5 7 9 11
10Yr CMT at Maturity (%)
Vol
atili
ty D
urat
ion
(bps
/vol
)
Copyright © 1996-2006 Investment Analytics Slide: 60Interest Rate Risk
Range Floaters / LIBOR Enhanced Accrual Notes (LEANs)
Typical Structure4 Year FRNCoupon LIBOR + 50bp
• Only paid if LIBOR in rangeYear 1-2 range 5% - 6%Year 3-4 range 6% - 7%
• Ranges increase due to upward sloping forward curve
Investor has written series of binary calls and puts• Compensated by higher spread• Taking advantage of high implieds• Betting that volatility will be lower than anticipated
Copyright © 1996-2006 Investment Analytics Slide: 61Interest Rate Risk
LEANs - Risk FactorsNet Duration
Close to zero within rangeChanges dramatically outside range
• Negative below range – note value rises with rates
• Positive above range (>> maturity)– -note value falls as rates rise
Volatility DurationPositive in range
• Note loses value if volatility increasesNegative outside range
• Note gains in value if volatility rises

Copyright © 1996-2006 Investment Analytics Slide: 62Interest Rate Risk
Multi-Index Notes
Coupon based on sum or difference between multiple indicesMost common structures:
CMT-LIBOR Differential NotesPrime-LIBOR Differential Notes

Copyright © 1996-2006 Investment Analytics Slide: 63Interest Rate Risk
Example: CMT-LIBOR Diff. NoteNote features:
Issuer: US AgencyMaturity: 3 yearsAnnual Coupon: (10-year CMT - 12m LIBOR) +2.00%
Discount Rate DurationDR is to-maturity Treasury rateHence DRD = 2.8 years approx.
Index Component10-year CMTLIBOR

Copyright © 1996-2006 Investment Analytics Slide: 64Interest Rate Risk
CMT-LIBOR Diff. Note -Overview
Investor OutlookAchieve higher coupon than either CMT or LIBOR
RiskYield curve flattening will rapidly erode the note’s yield advantage
Equivalent Position:Long CMT FRNLong Eurodollar Futures

Copyright © 1996-2006 Investment Analytics Slide: 65Interest Rate Risk
CMT-LIBOR Diff. Note
10-Year CMT:
1bp change in T10 produces approx. 1bp change in 10-year forward rate T1,10Hence value of note will increase by PV01 in each year
33
10,32
2
10,21
1
10,1
)1()1()1( rT
rT
rT
CouponPV+
++
++
=

Copyright © 1996-2006 Investment Analytics Slide: 66Interest Rate Risk
CMT-LIBOR Diff. Note:Key Treasury Rate Durations
Key Rate PV01 Duration
T10 -1/(1+T1)1 -0.95T11 -1/(1+T2)2 -0.91T12 -1/(1+T3)3 -0.86
Copyright © 1996-2006 Investment Analytics Slide: 67Interest Rate Risk
CMT-LIBOR Diff. Note:LIBOR Component
Equivalent to 3-year swapCorresponds to to-maturity Treasury rateHence duration is equiv. to fixed coupon 3-year noteKTRD for LIBor component is 2.8 years

Copyright © 1996-2006 Investment Analytics Slide: 68Interest Rate Risk
CMT-LIBOR Diff Note: KTRD’sComponent Index KTR KTRD
Index rate 10-yr CMT T10 -0.95T11 -0.91T12 -0.86
12-m LIBOR T3 2.8
Discounting To-maturity T3 2.8Rate Treasury

Copyright © 1996-2006 Investment Analytics Slide: 69Interest Rate Risk
CMT-LIBOR Diff Note:KTRD Spectrum
CMT-LIBOR Diff Note - Key Rate Duration Spectrum
-2
-1
0
1
2
3
4
5
6
3 4 5 6 7 8 9 10 11 12
Maturity
Key
Rat
e D
urat
ion
(yea
rs)
LIBORDiscountingCMT

Copyright © 1996-2006 Investment Analytics Slide: 70Interest Rate Risk
Summary: Risk Management
Risk MeasurementDuration ConceptsIndex Rate DurationKey Treasury Rate Duration
Risk AnalysisDeterministicSimulation