risk management issues in european equity funds management issues in european equity funds ......
TRANSCRIPT

1
Risk Management Issues in European Equity Funds
Andrew Clare1, Miguel Corte-Real
2, Natasa Todorovic
3
Abstract
This paper provides a comprehensive analysis of current risk management practices of
active European equity long-only funds and hedge funds. Using a unique
questionnaire survey we reveal many issues for the industry ranging from insufficient
financial commitment of funds to risk management and risk managers not being
independent enough and assuming additional roles to the fact that important types of
risks (such as style or size risk) are not accounted for and portfolio holdings are
infrequently assessed. However, efforts have been made by funds to allocate more
resources to risk management since the start of the recent financial crisis. Further, we
find that hedge funds tend to be more risk aware than long only institutions and that
spending more on risk management is more likely to improve funds‟ performance
rankings.
1 Professor in Asset Management, Cass Business School, 106 Bunhill Row, London EC1Y 8TZ, UK,
email: [email protected] 2 PhD Candidate, Cass Business School, 106 Bunhill Row, London EC1Y 8TZ, UK, email:
[email protected] 3 Corresponding author. Senior Lecturer in Investment Management, Cass Business School, 106
Bunhill Row, London EC1Y 8TZ, UK, email: [email protected]

2
1. Introduction
Rebonato (2007) describes risk management as the discipline that involves assessing
the probability of and, most importantly, reacting to and planning for uncertain
events. The last two crises in financial markets, the dotcom bubble burst (2000-2003)
and the more recent financial crisis (2008-2009), have made it obvious that no robust
contingency plans were in place by many financial institutions. This made the
industry and investors rethink many of the paradigms and beliefs fundamental to the
crises.
Specifically, the 2008-2009 financial crisis highlighted the lack of effective risk
management in the asset management industry, with 1471 hedge funds being
liquidated in 2008 and 1023 in 20094, and with asset managers experiencing negative
asset growth of €1.4 trillion in 2008. Furthermore, there was a lack of transparency
and feasibility in the quantitative tools used to compute the value and risk
management for the exotic credit derivatives products. Clearly, risk management was
not well understood or used properly by financial companies that operated in this
turbulent environment. Bender and Nielson (2009) state that being prepared for
unlikely events is the most important lesson learnt from financial crises and advocate
proactive risk management of both market and non-market type risks.
This study aims to present an overview of the extent risk management is used in
European fund management industry post financial crisis, both in the active long-only
equity funds and equity hedge funds. It assesses the level of commitment that funds
have made to manage the risk and establishes whether improvements can be made
before further financial crises take place. Using a unique questionnaire survey, we
determine which risk management systems, structure and tools are currently in use
and how they have changed following the start of 2008 financial crisis. Further, the
study evaluates whether the funds with smaller assets under management (AUM)
spend less on risk management. Finally, we ascertain the link between the amount
spent on risk management and the performance of the fund. To the best of our
4 HFR Global hedge fund industry Report, First Quarter 2010 (www.hedgefundresearch.com)

3
knowledge, this is the first comprehensive study of current risk management practices
within active European equity funds.
Our findings reveal that risk management in European active equity funds has a
number of flaws, which are particularly prominent among long-only funds. The flaws
range from over 70% of the funds using identical risk management system and not
accounting for some relevant types of risks (such as size or style risk), to risk
managers assuming additional roles and not being independent enough, infrequent
revision of a portfolio‟s top/bottom holdings, insufficient allocation of resources to
risk management relative to company size etc. The survey also highlights the
tendency of smaller funds to spend less on risk management functions. Further, we
show that the relation between performance ranking and amount spent on risk
management is negative (more spent on risk management indicates better (lower)
performance rank), albeit insignificant. Following the start of the financial crisis, the
funds are currently more aware of these problems and they are placing more emphasis
on risk management by increasing allocation of funds to risk functions. Further
research may confirm whether indeed this will prove beneficial and whether the trend
is likely to continue in the future.
The paper is organised as follows: Section 2 provides review of relevant literature,
Section 3 outlines the methodology, in Section 4 we demonstrate our main findings
and Section 5 concludes the paper.
2. Review of Literature
2.1. The importance of risk management
According to Martellini (2010) the raison d’etre of the investment industry is not to
generate alpha or design complex structured products, but to serve investors‟ needs by
helping them find solutions to their problems, i.e. provide diversification through
asset allocation, and hedging and insurance through adequate risk management.
Bender and Nielsen (2009) argue that a successful investment process requires a risk
management structure that addresses multiple sources of risk, for instance market risk,
sector risk, credit risk and interest rate risk amongst others, which calls for portfolio
risk decomposition analysis. The authors lay out a „best risk management practice‟
framework, that rests on 3 pillars: risk measurement (using the right tools accurately

4
to quantify risk from various perspectives), risk monitoring (tracking the output from
the tools and flagging anomalies on a regular and timely basis) and risk-adjusted
investment management (uses the information from measurement and monitoring to
align the portfolio with expectations and risk tolerance). Therefore, portfolio
management that relies on successful application of risk management tools and
monitoring is of essence for investors. This study aims to assess whether asset
management firms in the aftermath of the initial financial crisis period act in
accordance with the three principals outlined by Bender and Nielson (2009).
Within asset management industry, the importance of managing risk becomes even
more evident since equity portfolio returns are maximized by using different hedging
strategies. The review of the literature on hedging can be found in Judge (2006), who
emphasizes that the rapid growth in the studies on hedging over the last decade is
motivated firstly by the development of a theoretical framework and secondly by the
availability of public data. Recent developments in accounting standards regulation
have resulted in an increase in the quantity of risk management data and an
improvement in the quality of data disclosed in financial statements. These
developments have acted as a catalyst and facilitated the recent growth in empirical
studies (e.g. Goto and Xu 2010). The empirical examination of hedging theories has
been hindered by the general unavailability of data on hedging activities. Until
recently, information on a firm‟s exact position in hedging and its methods of hedging
(for example, use of derivatives) was closely guarded because it was deemed to be of
strategic importance to that firm. It is only recently that firms have been encouraged
to disclose information on their hedging policies and their methods of hedging in their
annual reports. In the absence of this information, most of the earlier empirical
studies used survey data to examine the determinants of corporate hedging (Nance,
Smith and Smithson, 1993 and Dolde, 1995). As disclosure of hedging practices in
financial reports improved several studies began to search reports for qualitative
disclosures (see for instance Francis and Stephan,1993, Wysocki, 1996, Mian, 1996).
Large number of investors incorrectly assumes that that the purpose of risk
management is to minimize risk, and that this may erode their potential returns
(Litterman, 2003). In fact, equity portfolio risk is a necessary driver of returns and
investors/portfolio managers with strong risk management controls ought to feel

5
comfortable targeting and maintaining a higher overall level of risk, thus leading to
higher, rather than lower, returns over time. According to Litterman (2003), portfolio
managers need to address three main considerations within their risk components: 1)
country/sector/large, mid, small capitalization/high, low beta 2) risk objectives and 3)
the long-run rate of return of the portfolio. These components are critical in defining
portfolio‟s risk profile. Furthermore, the author recognizes the relevance of both the
implementation and monitoring of portfolio asset allocations relative to that of the
benchmark, as nowadays most of the equity mix within an equity portfolio is
conditioned to the benchmark. Since this research focuses on risk management within
active equity portfolios, we aim to investigate to which extent the active risk (implied
by overweighting equity positions relative to the benchmark) is monitored.
2.2. Problems within risk management
Brandolini et al (2000) identify three key reasons why asset managers have
insufficient risk management practices: 1) Institutional investors manage third party
funds so eventual liabilities are those of other people; 2) Losses, therefore, have no
immediate impact on the balance sheet of an institutional investor and 3) Most fund
managers are concerned with returns relative to a benchmark instead of absolute
returns so their portfolio risk analysis often ignores broad market downturns, like
those witnessed in 2008.
There is evidence that companies with strong risk management culture suffered
relatively less during the 2008-2009 crisis period. Eppler and Aeschmann (2009)
identify Goldman Sachs as one such example. Further, Buehler et al (2008) document
that the regular communication through daily risk reports and weekly meetings of the
firm-wide risk committee enabled Goldman Sachs to withstand the crisis relatively
better than their competitors. This puts emphasis on importance of risk management
communication particularly during turbulent periods in financial markets.
Darnell (2009) argues that during low probability high-tail risk events such as the
recent financial crisis, long volatility positions would have been highly successful.
By having limited protection against loss in many portfolios, investors were net short
volatility. Since most investors look for strategies that have recently provided
positive, consistent, risk-adjusted returns, these short volatility biases looked very

6
attractive to investors, as they had experienced positive performance over the prior 20
years. However, it was this growing short volatility bias that created so many
problems in the recent downturn.
Risk models by their nature make some simplifying assumptions. In the event of a
large percentage of companies relying on the same risk model and treating it as a
black box (accepting risk estimates they generate without any questioning), we may
observe buying or selling clusters in the market. Therefore, a real problem is inherent
in the fact that companies may not use further research but take the results of risk
management model as granted. However, according to Brown (2008), there is a
danger of investing in risk management departments who build complex models
without achieving the desired results, because too much emphasis is placed on the
findings of the model. Darnell (2009) asserts that risk models are helpful in judging
risk exposures under typical situations, but no substitute for investment judgement
exists when it comes to anticipating how portfolios will respond to tail events.
Danielsson et al (2006) remind us that financial returns tend to exhibit fat tails, which
makes preparation for those tail events even more pressing. Risk models are
generally based on a normal distribution but if the distribution is platykurtic, then
these tail events are more likely to happen. Darnell (2009), however, concludes that it
was not the risk models that failed, but rather the inability to solve the limitations of
risk models and investment judgement based on an incomplete assessment of risk.
This brings us to the fact that perhaps too much focus has been put on the quantitative
side of risk management and the new generation of complex risk models
(Blommestein, 2010), without considering the qualitative issues.
Another significant problem in the area of asset and risk management is identified by
Brown (2008), who finds that one in five fund managers who invested in complex
financial instruments admitted to having no in-house specialists with relevant
experience. Further, institutional investors who invest in derivatives, collateralized
debt obligations (CDOs) or structured products seem to be at a greater risk; with one
in three saying they have no in-house experience regarding these investments. This
implies that managing the risk of such products is not serviced either.

7
Finally a problem may occur if risk managers role is shared and/or if they are not
independent enough. Golub and Crum (2010) observe that risk managers can only be
truly effective when they are independent from the risk takers, even if those risk
takers are highly risk aware. Further, they recommend that the risk management
function must be at least of equal standing to the investment function. The head of
the risk management department should report directly to the CEO of the company,
and not to the CIO.
2.3. Risk Management Surveys
Surveys are not ordinarily used method in financial risk management literature. To the
best of our knowledge, there are no academic papers that survey risk management
practices in financial institutions. Nevertheless, Price Waterhouse Coopers completed
a survey on valuation and risk management of 68 US, European, Asian and Canadian
hedge funds5. They find that for majority of funds some areas of risk management are
not sufficiently considered such as counterparty risk and approval of new instruments.
They document that hedge funds have diverse view of who should bare prime
responsibility for risk management in the company (General Partner, Board of
Directors, Senior Portfolio Manager, Independent Risk Manager, CFO etc.). Further,
almost 70% of surveyed funds do not have a risk management committee and only
31% have an independent risk manager. Additionally, substantial proportion of
respondents (33%) believes that tools used for risk management in hedge funds are
not that strong, while 11% considers that risk management process is relatively weak.
Finally, it was revealed that performance of only 50% of portfolio managers is made
on a risk-adjusted basis, taking into account adequate risk measures. Ernst and
Young‟s Risk Management for Asset Management Survey (2011)6 is based on
interviewing a very small sample of around 30 UK and European large, medium,
small (by assets under management) and alternative asset management firms. They
find that, in general, risk management practices in 2011 are improving relative to
previous years. Some other interesting findings reported suggest that managing
liquidity risk is priority for most of the firms, that investment risk (deviation from an
expected return, i.e. volatility) is well managed, that 65% of respondents used Value
5http://www.pwc.com/en_GX/gx/financialservices/pdf/globalhedgefundsurvey.pdf
6http://www.ey.com/Publication/vwLUAssets/Risk_management_for_AM_2011Survey/$FILE/Risk_m
anagement_for_AM_2011Survey.pdf

8
at Risk (VaR) to model market risk and that 45% of respondents have increased the
size of their risk management team. Further, the survey also assesses respondents
view on counterparty risk, operational risk and various aspects of regulation.
To conclude, it is evident from both academic and practitioner point of view that risk
management is a very important activity for a financial institution and many of its
flaws became obvious during the financial crisis of 2008-2009. Although
practitioners‟ surveys have addressed some of the issues that asset management
industry is facing in terms of risk management, such as adjustments to the new
regulation or allocating additional resources to risk management, improvement of
communication etc., the existing surveys, we believe, are not comprehensive enough.
They do not attempt to show which specific aspects of financial risk management
need improvement, or whether the amount spent on risk management improves funds‟
performance. Also, the surveys are applied on the small sample of respondents, which
cannot be deemed representative of the asset management industry as a whole.
3. Data and Methodology
3.1. Data
This survey focuses on the initial sample of 840 European equity funds, which
includes traditional open-ended equity mutual funds and hedge funds. A total of 743
equity mutual funds and their assets under management (AUM) are obtained from
FundFile database from Lipper Fund Management Information (Lipper FMI). A
universe of 97 hedge funds is from Morningstar Direct7database.
Figure 1 illustrates the criteria applied to form the sample of 840 funds. In the case of
traditional open-ended mutual funds8, the ten largest European domiciles by equity
assets under management were taken, namely: Luxembourg, United Kingdom,
France, Ireland, Sweden, Germany, Switzerland, Netherlands, Italy and Norway. This
screening process enables us to get a suitable coverage of the largest equity funds in
Europe incorporating both funds in “offshore centres” as well as those funds
7 Morningstar has been expanding their hedge fund coverage by acquiring businesses and databases,
such as InvestorForce, which includes the Altvest™ hedge fund database that allows screening of one
of the largest proprietary global hedge fund databases available. Hence, these credentials and coverage
of the hedge fund universe makes this source suitable for this study. 8 Closed-end funds are excluded.

9
domiciled in each local market, accounting for 93% of total assets domiciled in
Europe.
Figure 1: Screening process for funds
Bond funds, fund of funds (both fettered/unfettered), mixed asset funds, money
market, money market enhanced and property funds9 are excluded, as well as equity
funds following a passive policy (exchange traded funds and index trackers), leaving
only active equity funds in the sample. Note that the sample does include some funds
that are classified as pure long-only, but pursue full UCITS III powers and hence have
the ability to use derivatives to create synthetic shorts or write covered call options to
enhance income. There has been no further filtering based on where underlying stocks
are listed and hence the sample includes funds investing in regions throughout the
world (UK, Europe, US, Asia, Japan, Emerging Markets, sector specific funds etc). In
the final step, for funds that have asset management subsidiaries all the data is
aggregated under the overall banner of the head company. This prevents counting
separate asset management entities of the same head company multiple times in the
final sample.
9 Property funds that invest in shares of real estate companies are included in the sample, while funds
that invest in physical property are excluded.

10
To filter the sample of hedge funds from the Morningstar Direct database, we select
hedge funds with headquarters in London, focusing only on funds that apply equity
based hedge fund strategies. Specifically, the following Morningstar Categories have
been used: Hedge Fund Developed Asia Equity, Hedge Fund Emerging Market
Equity, Hedge Fund Equity Arbitrage, Hedge Fund Equity Europe, Hedge Fund
Global Equity and Hedge Fund US Equity. As for mutual funds, the data per fund is
aggregated and used on the company level.
The AUM of this 840 funds sample totals $1.97 trillion with the largest five European
equity managers being Fidelity, Blackrock, JP Morgan, Deutsche Bank Group and
BNP Paribas10
. The top 10 groups account for 30% of total assets, indicating that
European equity asset management industry is unconcentrated.
3.2. Methodology
The methodology in this paper is based on the survey questionnaire designed
specifically for the purpose of this research. The questionnaire is composed of 24
questions, 13 of which are split into sub-sections, as shown in Appendix, leading to
56 expected response items per questionnaire. The questionnaire was designed to
provide an insight into the importance of risk management within the asset
management industry in Europe and identify possible areas of improvement. With that
in mind, the two main areas that are the focus of our scrutiny are 1) risk measurement
and 2) risk monitoring.
The survey was carried out by one-on-one interviews in the period from January to
September 2010. Interviewing was selected in an attempt to achieve a higher response
rate than a mail-out would achieve. For instance, Levich, Hayt and Ripston (1999)
received a 17.5% response rate from their 1708 surveys mailed during their study of
derivatives and risk management practices by US institutional investors. In this
survey, we have interviewed 200 respondents, representing 23% of our overall
universe of 840 funds. Our respondents include 182 long-only funds and 18 hedge
10
The assets of BNP Paribas include the recently acquired assets of Fortis. This re-emphasises the
importance of aggregating assets to the company level to avoid counting subsidiaries of groups as
separate entities.

11
funds, accounting for 91% and 9% of the sample respectively. 93% of the 200
respondents are Portfolio Managers, while the remaining 7% are Risk Officers,
Marketing Heads, Sales, and others within the asset management firm.
In terms of geographic breakdown, UK-domiciled assets represented 61% of the
AUM of all respondents, followed by France and Ireland with 9% each, Sweden and
Germany with 6% each, Switzerland with 3%, and Netherlands, Italy and Norway
with 2% each. The total AUM of the sample of 840 European equity funds is $1.97
trillion, while the total AUM of our 200 respondents is $1.55 trillion, indicating that
our respondent funds can be treated as representative of the equity fund management
industry in Europe. The average AUM of funds among our respondents is $9.023bn.
4. Findings
4.1. The Use of Risk Management Systems
Different risk systems provide diverse tools for effective risk management and they
differ in terms of assumptions and underlying risk models they use. We identify 15
risk systems (models) that funds in our sample use. Table 1 presents the proportion of
funds that employ each of those risk management systems. Note that those
proportions do not add up to 100% as 14.84% of long only funds and 33% of hedge
funds use more than one risk management system. It is evident from Table 1 that a
large majority of those 200 funds surveyed (76.5%) use Barra‟s Risk Management
system. In-house risk management tools are a distant second, employed by 19% of
respondents. The same pattern is observed for both long-only funds and hedge funds
in our sample:

12
Table 1: The use of Risk Management Tools among Surveyed Funds
Risk Management Tool Long only Funds Hedge Funds
All Funds
Barra 79.12% 50.00% 76.50%
Algorithmics 1.65% - 1.50%
APT 0.55% - 0.50%
Barrie and Hibbert 0.55% - 0.50%
Financial Analytics 1.10% - 1.00%
In-house System 18.68% 22.22% 19.00%
Sophis 4.40% 16.67% 5.50%
Morgan Stanley Risk Mgt 1.65% 22.22% 3.50%
Goldman Sachs Risk Mgt - 16.67% 1.50%
Riskmetrics 3.85% 5.56% 4.00%
Statpro 1.65% - 1.50%
EM applications 0.55% - 0.50%
Murex - 5.56% 0.50%
Sungard 0.55% - 0.50%
Deutsche Bank Risk Mgt - 5.56% 0.50%
None 0.55% - 0.50%
Note: - indicates that the corresponding system was not used by any of the funds in the group.
Percentages represent the proportion of funds that has used the system. The sum of percentages in any
of the columns does not add to 100% as 14.84% of long-only funds and 33% of the hedge funds use
more than one risk management system.
The fact that majority of funds use the same risk management tool may prove
problematic and can in fact cause contagion, particularly in the downmarket. For
instance, when the market is more volatile, portfolio managers have more pressure to
scale their positions and measure risks (DeMiguel, 2010). It is precisely their risk
system that measures what positions are riskier and which ones should be sold to
reduce the portfolio risk. If the great majority of portfolio managers use the same tool
to measure risk, that may create a selling cluster. The evidence of the worst returns
clustering can be found in Boyson, Stahel and Stalz (2008) who use monthly hedge
fund indices representing eight different styles from January 1990 to August 2007.
Although majority of the companies use the same system, given different risk profile
of long-only funds and hedge funds, the frequency at which they consult those
systems differs, as illustrated in Figures 2a and 2b.

13
Figure 2: Frequency of usage of Risk Management Systems
2a. Long-only Funds 2b. Hedge Funds
The majority (74%) of long-only portfolio managers apply their risk tools at least
once a month with only 15% resorting to this daily. A different image emerges for
hedge funds: two thirds (67%) of hedge fund managers check their risk systems on a
daily basis, while none of those surveyed use the systems less frequently than once a
month. Given that hedge funds traditionally deploy high-risk strategies, it is
reassuring to find that hedge fund managers are more concerned about understanding
their portfolio risk on a more frequent basis than long-only managers. Additionally, in
periods of high volatity, such as the period of subprime crisis that started in 2007, it is
necessary to review risk more frequently in order to make adeqaute portfolio
adjustments and avoid losses.
Further, this survey investigates the extent to which fund managers use Style
Research Ltd tool in addition to more general risk management system, as it provides
a comprehensive analysis of market risk and style factors in portfolios. This is of
particular relevance for long-only equity portfolios as many of them follow value,
growth, small capitalization or large capitalization portfolio construction approach.
Equity style investing is recognized as a profitable investment strategy by both
academics and practitioners, evidence of which can be found in influential papers
such as Banz (1981) and Fama and French (1993).
Given that Style Research Ltd. tool enables portfolio managers to track different risk
behavior, the possible change in risk premium and any style bias in their portfolios, it
is of less relevance for hedge funds who are less concerned about style bias than other
types of risks in their portfolio. Therefore, it is not surprising that only 22% of hedge
fund managers resort to it (Figure 3b). On the other hand, this tool could prove to be
66%
17%
17%
Daily Weekly Monthly Quarterly Other
15%
18%
41%
25%
1%
Daily Weekly Monthly Quarterly Other
14
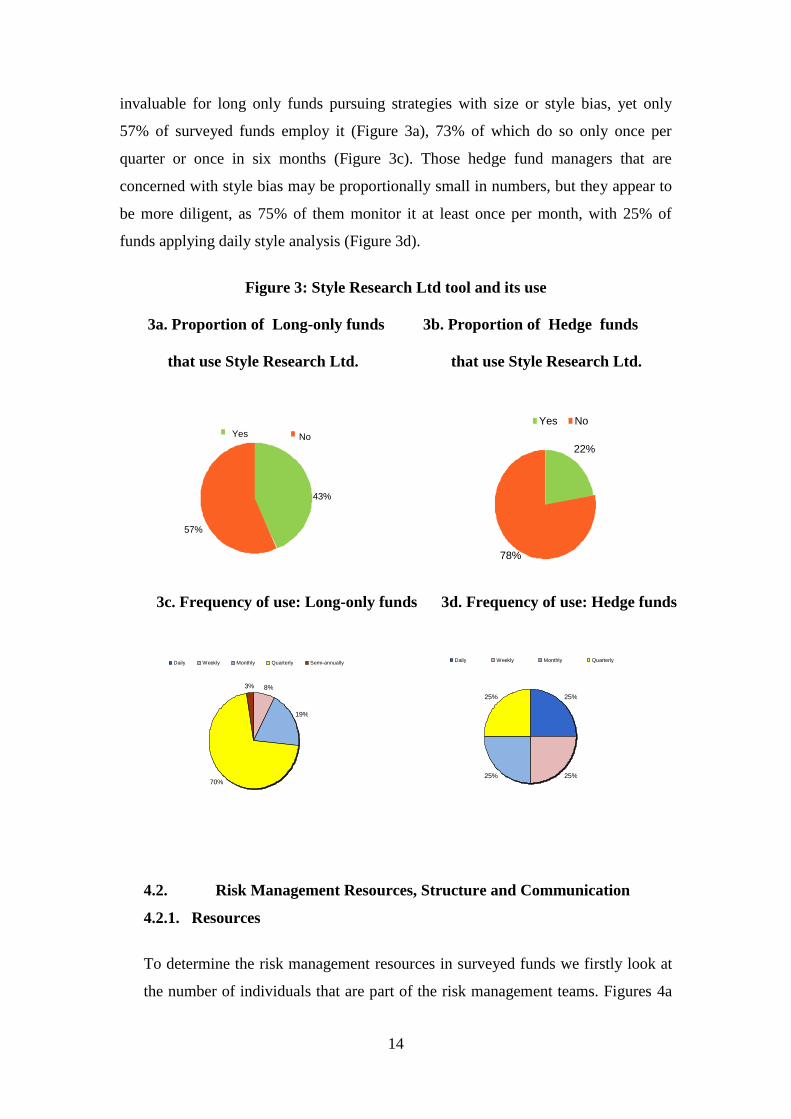
invaluable for long only funds pursuing strategies with size or style bias, yet only
57% of surveyed funds employ it (Figure 3a), 73% of which do so only once per
quarter or once in six months (Figure 3c). Those hedge fund managers that are
concerned with style bias may be proportionally small in numbers, but they appear to
be more diligent, as 75% of them monitor it at least once per month, with 25% of
funds applying daily style analysis (Figure 3d).
Figure 3: Style Research Ltd tool and its use
3a. Proportion of Long-only funds 3b. Proportion of Hedge funds
that use Style Research Ltd. that use Style Research Ltd.
3c. Frequency of use: Long-only funds 3d. Frequency of use: Hedge funds
4.2. Risk Management Resources, Structure and Communication
4.2.1. Resources
To determine the risk management resources in surveyed funds we firstly look at
the number of individuals that are part of the risk management teams. Figures 4a
25%
25% 25%
25%
Daily Weekly Monthly Quarterly
8%
19%
70%
3%
Daily Weekly Monthly Quarterly Semi-annually
22%
78%
Yes No
43%
57%
Yes No

15
and 4b reveal that only 36% of long-only funds and 28% of hedge funds has more
than 10 people in the risk management team.
Figure 4: The size of risk management teams
4a. Long-only Funds 4b. Hedge Funds
In both groups of funds the most common risk management team size is 1-5 people,
which is rather low given that the average AUM of all the funds is the sample is
$9.023bn. To examine this issue further, we present Table 2 that shows the average
AUM of our respondent firms that have small risk management teams (1-5 people),
medium risk management teams (5-10 people) and large risk management teams
(more than 10 people).
Table 2: The average AUM across different sizes of risk management teams
Size of the risk management team
Small (1-5 people) Medium (6-10 people) Large (over 10 people)
Average AUM (in $bn) 6.151 5.818 14.582
One would expect that the relationship between the size of the risk management team
and the average AUM is positive so that the companies that on the average have the
lowest AUM will also have the smallest risk management teams, and vice versa.
While this positive relationship holds for the large risk management teams, the
companies that have the fewest people managing risk are not the smallest in terms of
AUM, which in turn indicates that companies do not allocate resources to risk
management in proportion to the size of their assets.
66% 6%
28%
1 - 5 6 - 10 10+
40%
24%
36%
1 - 5 6 - 10 10+

16
Further, in order to understand the strength and dedication of the risk department in
general and risk management officer in particular, it is of importance to determine if
risk managers‟ position assumes any additional roles. We find that 88% of long-only
firms in the sample have dedicated risk managers, while the corresponding figure for
hedge funds is only 56%, as shown in Figures 5a and 5b. It can be said that a
considerably large proportion of hedge fund risk managers assumes additional roles
and are not devoted sufficiently to their primary role of managing risk.
Figure 5: Do Risk Managers Assume Additional Roles?
5a. Long-only Funds 5b. Hedge Funds
In addition, facts revealed in Figures 4b and 5b are somewhat linked: the reason why
a risk manager in a hedge fund has to undertake other duties may be linked to a small
team size (66% of hedge funds reports risk management teams of up to 5 people).
Hedge funds in our sample have considerably smaller AUM compared to long only
funds (average of $2.8bn vs. $9.7bn respectively) and therefore fewer resources to
fund larger teams in which members will assume only one role. The nature of
additional roles they execute may also be of importance as this may lead to a conflict
of interest, which will to some extent be addressed in the next section.
4.2.2. Reporting structure
The degree of independence of risk management team can be measured by assessing
the reporting relationships with the company. If the head of risk management reports
to the CEO, there may be some conflicts of interest and lack of objective judgment
when it comes to balancing risk management against reaching performance targets.
No
Yes
88%
12%
44%
56%
Yes No

17
Clearly, the role of the Chief Investment Officer and the Chief Risk Officer should be
different in aims and therefore more objective. Figure 6a and 6b show reporting
structure in funds in our sample.
Figure 6: Reporting structure
6a. Long –only funds 6b. Hedge Funds
Our survey reveals that the risk management process in 74% of of long only
institutions is more independent as they report to their Investment Risk Oversight
Committee, while 22% still shows lower degree of independence and report direct to
their CIO11
. Further, hedge funds exhibit lower degree of independence than long-
only funds as only 44% of Risk Managers in hedge funds report to their Investment
Risk Oversight Committee, while 66% report directly to their CIO. This can also be
explained by the fact that hedge funds have lower AUM on the average than long-
only funds, and therefore fewer resources to establish and run a risk oversight
committee.
Furthermore, as part of the reporting structure and decision making in the company, it
is important to identify who has the authority to make changes to the portfolio if its
risk deviates outside the set risk parameters: Portfolio Manager, Risk Manager, Head
of Equity or CIO?
11
A minority of 4% of risk managers in the long-only funds in this sample report to other authorities
within the company such as Chief Operating Officer or Head of Equities.
56%
44%
0%
CIO Investment Risk Oversight Committee Other
22%
74%
4%
CIO Investment Risk Oversight Committee Other
18
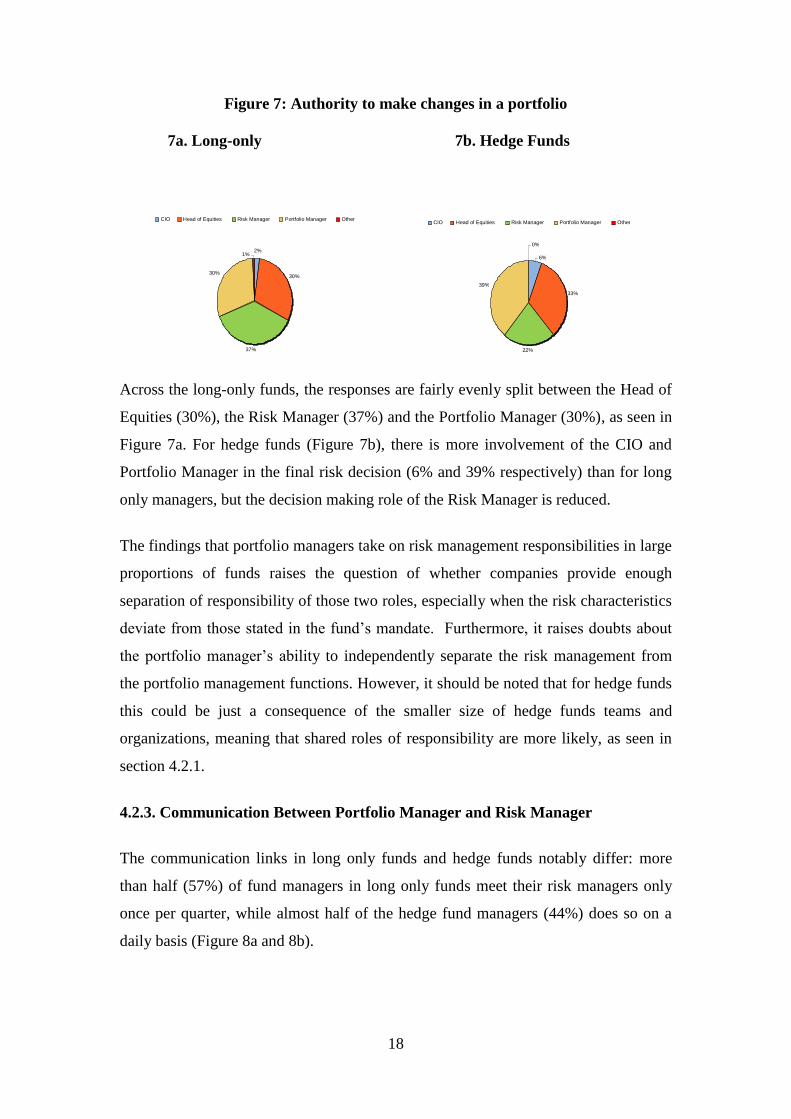
Figure 7: Authority to make changes in a portfolio
7a. Long-only 7b. Hedge Funds
Across the long-only funds, the responses are fairly evenly split between the Head of
Equities (30%), the Risk Manager (37%) and the Portfolio Manager (30%), as seen in
Figure 7a. For hedge funds (Figure 7b), there is more involvement of the CIO and
Portfolio Manager in the final risk decision (6% and 39% respectively) than for long
only managers, but the decision making role of the Risk Manager is reduced.
The findings that portfolio managers take on risk management responsibilities in large
proportions of funds raises the question of whether companies provide enough
separation of responsibility of those two roles, especially when the risk characteristics
deviate from those stated in the fund‟s mandate. Furthermore, it raises doubts about
the portfolio manager‟s ability to independently separate the risk management from
the portfolio management functions. However, it should be noted that for hedge funds
this could be just a consequence of the smaller size of hedge funds teams and
organizations, meaning that shared roles of responsibility are more likely, as seen in
section 4.2.1.
4.2.3. Communication Between Portfolio Manager and Risk Manager
The communication links in long only funds and hedge funds notably differ: more
than half (57%) of fund managers in long only funds meet their risk managers only
once per quarter, while almost half of the hedge fund managers (44%) does so on a
daily basis (Figure 8a and 8b).
6%
33%
22%
39%
0%
CIO Head of Equities Risk Manager Portfolio Manager Other
2%
30%
37%
30%
1%
CIO Head of Equities Risk Manager Portfolio Manager Other

19
Fgure 8: Frequency at which fund managers meet risk managers
8a. Long-only Funds 8b. Hedge Funds
It is of concern that 6% of hedge fund managers meet risk managers only once per
quarter, and therefore appear to be less dilligent and insufficiently prepared for
handling risk. In contrast, just 2% of long-only managers opts for daily meetings and
opportunity to have better overview of risk in their portfolios. These findings are in
line with frequency of use of risk management systems discussed in Section 4.1,
which imply that hedge fund portfolio managers are more concerned about risk in the
short run than long-only managers.
4.3. Frequency of evaluation of funds’ active positions
4.3.1. Assessing the aggressiveness of strategies
Typical measures of aggressiveness of funds‟ strategy is its divergence from a
benchmark (i.e. the size of the tracking error, a measure used for active management
in Wermers (2003)), and the comparison of portfolio vs. benchmark holdings (as for
instance an Active Share measure suggested by Cremers and Patajisto (2009) that
measures how funds overweight and underweight the portfolio holdings relative to the
benchmark). More aggressive strategies imply greater tracking error and greater
divergence from portfolio benchmark and in turn higher risk.
Given that our sample contains only active funds, one would expect that they will
review their active positions very frequently. Nevertheless, Figure 9a and 9b
exemplify that only around one fifth of long only portfolio managers evaluate their
44%
28%
6% 0%
22%
Daily Weekly Monthly Quarterly Other
2% 10%
57%
1%
30%
Daily Weekly Monthly Quarterly Other

20
active positions and tracking error on a very frequent basis. Additionally, nearly 8%
of respondents never assess thir active positions.
Figure 9: Evaluation of active positions
9a. Long-only Funds
9b. Hedge Funds
Note: n/a refers to „not applied‟ / „not relevant‟ for the fund
Hedge fund managers give binary response with regards to looking at tracking error
and active positions: they assess them either very frequently or not at all, with two-
thirds of hedge funds giving no relevance to assessing active benchmark positions at
all. This could be explained by the fact that they are not managed against traditional
benchmarks, like the FTSE or MSCI type indices, and are generally judged on an
absolute, not a relative returns basis. The same cannot be said for the long-only funds:
in spite of the fact they are benchmarked against traditional indices – the long-only
respondents do not analyse their active money as frequently as expected.
22.2%
22.2%
33.3%
11.1%
11.1%
11.1%
66.7%
66.7%
55.6%
0% 20% 40% 60% 80% 100%
Overweights vs. benchmark
Underweights vs benchmark
Ex-Ante Tracking Error (%)
very frequently frequently rarely never n/a
21.4%
21.4%
19.6%
47.8%
47.3%
49.2%
18.1%
18.7%
19.0%
7.7%
7.7%
8.4%
4.9%
4.9%
3.9%
0% 10% 20% 30% 40% 50% 60% 70% 80% 90% 100%
Overweights vs. benchmark
Underweights vs benchmark
Ex-Ante Tracking Error (%)
very frequently frequently rarely never n/a

21
4.3.2 Assessing country and sector risk exposure
Given the interconnectedness of the global economy and the recent increase in the
volatility of sovereign debt in Europe, it is important for the funds to consider their
country exposures with a greater degree of diligence. Further, as Baca, Garbe and
Weiss (2000) show that the international sector exposure contributes more to
diversification of risk than the country exposure; it adds value to assess if companies
review their foreign (and domestic) sector positions on a frequent basis. The results
of the survey are in Figure 10a and 10b, showing that hedge funds tend to be less
concerned about the country and sector relative weights than long only funds.
Figure 10: Assessing country and sector exposures and contribution to risk
10a. Long-only funds country and sector exposure
10b. Hedge funds country and sector exposure
10c: Long-only Funds: Top10/Bottom 10 countries’ and sectors’ risk
contribution as a percentage of tracking error
7.8%
8.3%
55.6%
53.6%
17.2%
17.7%
13.3%
13.3%
6.1%
7.2%
0% 20% 40% 60% 80% 100%
Sector Top 10 Bottom 10 Risk Contributors as % of Tracking Error
Countries – Top 10 Risk Contributors as % of Tracking Error
very frequently frequently rarely never n/a
38.9%
38.9%
27.8%
22.2%
27.8%
11.1%
38.9%
33.3%
61.1%
0.0%
0.0%
0.0%
0% 20% 40% 60% 80% 100%
Country breakdown vs previous quarter
Sector weight position vs. previous year
Country relative weights
very frequently frequently rarely never n/a
13.9%
14.4%
14.9%
52.2%
51.9%
51.4%
21.7%
21.5%
20.4% 7.7%
8.3%
8.3% 3.9%
3.9%
5.5%
0% 20% 40% 60% 80% 100%
Country breakdown vs previous quarter
Sector weight position vs. previous year
Country relative weights
very frequently frequently rarely never n/a

22
10d: Hedge Funds: Top10/Bottom 10 countries’ and sectors’ risk contribution as
a percentage of tracking error
Note: n/a refers to „not applied‟ / „not relevant‟ for the fund
Further, we analyse whether the surveyed funds consider the contribution of Top 10
and Bottom 10 countries (sectors) in their portfolios to the tracking error. Figure 10c
shows that most long-only funds review their country and sector contributions to risk
on a frequent basis, recording 53.6% and 55.6% of the reponses respectively.
However, over 17% of funds rarely takes these risk contributions into account, while
over 13% of funds never considers them.
Hedge funds (Figure 10d) exhibit „all or nothing‟ behaviour: around 50% of hedge
funds assign great importance to Top 10 and Bottom 10 country and sector
contributors to tracking error, reviewing them either frequently or very frequently.
The remaining 50% do not consider the contribution of country/sector positions to
their total tracking error at all, mostly because they consider it not relevant.
During the subprime crisis in the late 2000s, country risk assumed a crucial
importance. Considering that country and sector positions play an important role in
determining the performance and risk profile of the fund, portfolio managers in both
long-only and hedge funds and are still yet to consider this new reality as our findings
reveal that the risk management in this area is neglected by large proportion of funds.
4.3.3. Security selection contribution to performance and risk
It is relevant to analyse the cumulative contribution of the top 10 bets within the
portfolio since 1) they often account for a substantial portion of the performance and
the risk of the portfolio (Brandt, Santa Clara and Valkanov, 2009); and 2) they play a
significant role in determining the portfolio manager‟s total value added.
Nevertheless, the survey discloses (Figure 11a) that over 30% of long-only managers
either rarely or never considers this, while 63.1% consider this at least frequently.
27.8%
27.8%
27.8%
22.2%
38.9%
44.4% 5.6%
5.6%
0% 20% 40% 60% 80% 100%
Sector Top 10 Bottom 10 Risk Contributors as % of Tracking Error
Countries – Top 10 Risk Contributors as % of Tracking Error
very frequently frequently rarely never n/a

23
Figure 11: Performance contribution of Top 10 bets
11a. Long-only funds
11b. Hedge Funds
Note: n/a refers to „not applied‟ / „not relevant‟ for the fund
Hedge funds assign much more importance to contribution from top 10 bets than their
long-only counterparts, as seen in Figure 11b, with two-thirds of hedge fund managers
considering this on a very frequent basis, while the remaining one third frequently.
This may reflect the fact that long only managers (as opposed to hedge funds) tend to
place large bets on „long-term winners‟ and are not so concerned with short-term
“noise” affecting the performance of their top holdings.
Additionally, it is of relevance for funds to consider which stocks among the largest
and the smallest holdings are the main contributors towards performance (both over or
underperformance). To reflect this, we assess if the funds in our sample analyse
frequently enough quarterly stock contribution from Top 20 and Bottom 20 positions.
Further, given that all our funds in the sample follow active investment philosophy, it
is important to assess whether they distinguish between stock picking skills and
market behaviour (Alpha and Beta). To do that, funds can look at the Active money
vs. Beta of the portfolio. Although active money does not directly measure the risk of
a portfolio but simply represents the amount of the over/under exposure in a particular
15.6% 47.5% 24.0% 7.8% 5.0%
0% 20% 40% 60% 80% 100%
Cumulative Contribution of top 10
very frequently frequently rarely never n/a
66.7% 33.3%
0% 20% 40% 60% 80% 100%
Cumulative Contribution of top 10
very frequently Frequently Rarely Never n/a

24
stock relative to the benchmark; active money relative to beta measures whether such
over/under exposure is linked to high/low betas and in turn shows portfolio managers
the degree to which portfolio risk deviates from the benchmark. Our findings
exemplify that long-only fund managers do not really regard these factors as
important, as shown in Figure 12a. Only 14.9% of long-only portfolio managers look
at active money versus beta on a very frequent basis, a large 23.8% rarely assess it,
while 7.2% never consider it. A similar pattern is shown towards looking a relative
contribution from the top 20 and bottom 20 positions.
Figure 12: Quarterly Stock Contribution
12a. Long-only Funds
12b. Hedge Funds
Note: n/a refers to „not applied‟ / „not relevant‟ for the fund
Hedge funds show a more binary outcome when reviewing risk factors, with 44.4%
(11.1%) not considering active money versus beta (relative contribution from top 20
and bottom 20 stocks), while the rest of the funds are considering it at least
frequently, as Figure 12b illustrates.
4.3.4 Size risk
It is a stylized fact that stock size matters (Banz 1981, Dimson and Marsh, 1986).
From the risk perspective, market capitalization is considered by many academics to
be a risk factor itself, as seen in Cahart (1997) four factor model or Fama and French
(1993) three factor model. Small size stocks in particular are perceived to carry more
risk due to being associated with the lower liquidity and greater trading costs (see for
50.0%
27.8%
38.9%
27.8%
11.1%
44.4%
0% 20% 40% 60% 80% 100%
Relative contribution for Top 20, Bottom 20
Active Money vs. Beta
very frequently frequently rarely never n/a
16.0%
14.9%
48.6%
45.9%
22.1%
23.8% 7.2%
6.6% 6.6%
8.3%
0% 20% 40% 60% 80% 100%
Relative contribution for Top 20, Bottom 20
Active Money vs. Beta
very frequently frequently rarely never n/a

25
instance Stoll and Whaley, 1983); they have more cashflow problems, higher
financial leverage and generally struggle more than the large capitalisation firms
particularly during market downturns, as argued by Chan and Chen (1991). Figure 13
portrays to what extent fund managers consider size as a risk factor in their portfolios.
Figure 13: Frequency of size contribution analysis
13a. Long-only Funds
13b. Hedge Funds
Note: n/a refers to „not applied‟ / „not relevant‟ for the fund
Market capitalization distribution in the portfolio and breakdown of holdings by
capitalisation emerges as an important parameter on the back of liquidity and other
concerns, as over 54% of long-only funds (44% of hedge funds) considering the
market cap impact frequently, with another 14.5% (38.9% of hedge funds)
considering it very frequently. Still, it is of concern that 20.7% of long-only funds
(11.1% of hedge funds) only rarely look at this indicator. Although hedge funds are
more concerned about size risk and indirectly liquidity risk, there is unsettling 5.6%
of those who do not consider it relevant at all.
4.3.5. Emerging Markets risk
Emerging markets have played a central role in equity allocation in recent years, as
their risk premia is larger than on developed markets. At the same time, the main
tenet of efficient market hypotheses states that greater returns imply greater risk
(Samuelson, 1965 and Fama, 1970). Indeed, there is evidence of significant
38.9%
38.9%
44.4%
44.4%
11.1%
11.1%
5.6%
5.6%
0% 20% 40% 60% 80% 100%
breakdown by market cap
market cap distribution
very frequently frequently rarely never n/a
14.4%
14.5%
54.4%
54.2%
20.6%
20.7% 6.7%
6.7% 3.9%
3.9%
0% 20% 40% 60% 80% 100%
breakdown by market cap
market cap distribution
very frequently frequently rarely never n/a

26
relationship between mean returns and standard deviations in emerging markets (see
for instance Harvey, 2000 and Estrada 2000, 2002). The extent to which surveyed
funds evaluate the exposure to emerging markets is shown in Figure 14.
Figure 14: Frequency of analysis of the emerging markets relative bet to index
14a. Long-only funds
14b. Hedge Funds
Note: n/a refers to „not applied‟ / „not relevant‟ for the fund
With the importance of emerging markets increasing over the past two decades, and
with emerging markets projected to be a major growth driver for future returns in
markets, many managers have turned to them to generate returns and provide
diversification. Figures 14a and 14b indicate that hedge funds are less concerned
about exposure to emerging markets. Only 47.1% of hedge funds assess this exposure,
compared to 87.3 of long only funds. However, 50% of those hedge funds that do
consider this, apply the analysis on a very frequent basis, which is much higher than
their long-only funds equivalent (13.9%). It is worth noting that hedge funds in our
sample that do not find monitoring exposure to emerging markets necessary are those
that do not have exposure to those markets.
4.4. Assessing liquidity risk of portfolios
4.4.1. Number of days to liquidate the portfolio
Liquidity risk, defined by Jorion (2007) as risk arising when a forced liquidation of
assets creates unfavourable price movements, is a crucial area of risk management
23.5% 17.6% 52.9% 5.9%
0% 20% 40% 60% 80% 100%
How often do you analyze the Emerging Markets Relative Bet
to index?
very frequently frequently rarely never n/a
12.1% 52.6% 22.5% 7.5% 5.2%
0% 20% 40% 60% 80% 100%
How often do you analyze the Emerging Markets Relative Bet
to index?
very frequently frequently rarely never n/a
27
and asset management in particular. It is not possible to accurately value portfolios
without taking into account the liquidity of its positions. Many factors can shape the
liquidity of a portfolio, such as holding a large position in one stock or holding small
position in a stock that is not frequently traded.
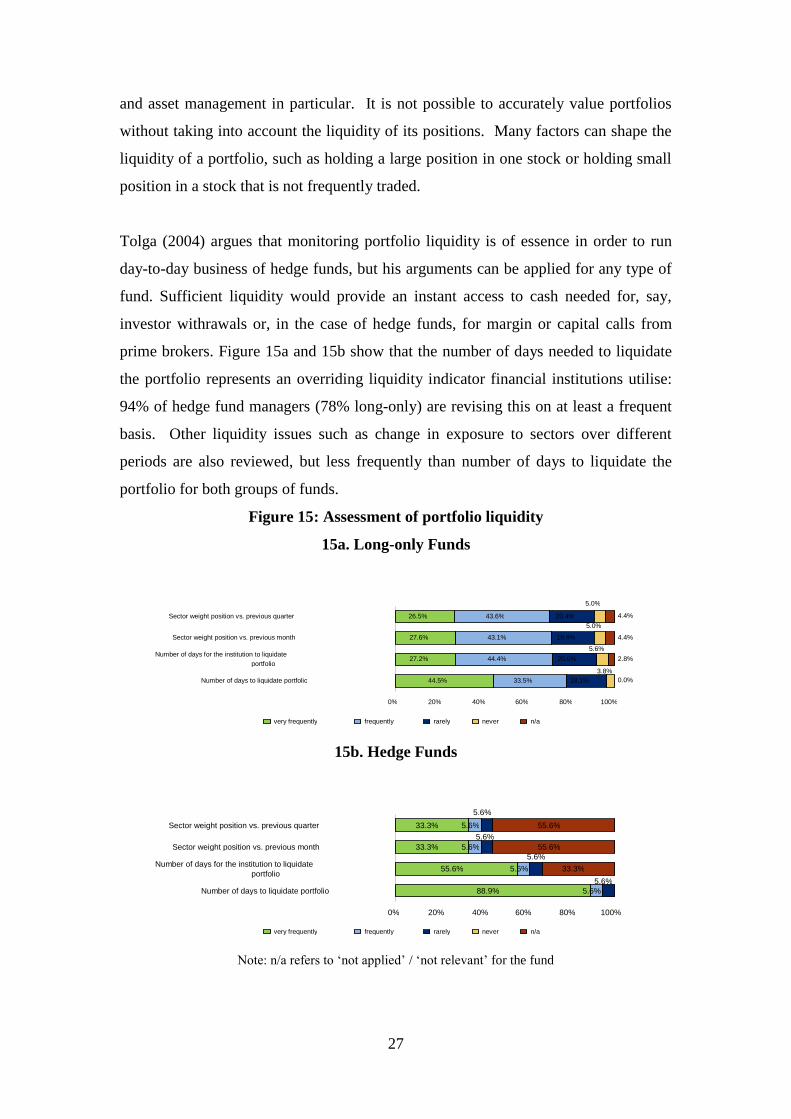
Tolga (2004) argues that monitoring portfolio liquidity is of essence in order to run
day-to-day business of hedge funds, but his arguments can be applied for any type of
fund. Sufficient liquidity would provide an instant access to cash needed for, say,
investor withrawals or, in the case of hedge funds, for margin or capital calls from
prime brokers. Figure 15a and 15b show that the number of days needed to liquidate
the portfolio represents an overriding liquidity indicator financial institutions utilise:
94% of hedge fund managers (78% long-only) are revising this on at least a frequent
basis. Other liquidity issues such as change in exposure to sectors over different
periods are also reviewed, but less frequently than number of days to liquidate the
portfolio for both groups of funds.
Figure 15: Assessment of portfolio liquidity
15a. Long-only Funds
15b. Hedge Funds
Note: n/a refers to „not applied‟ / „not relevant‟ for the fund
88.9%
55.6%
33.3%
33.3%
5.6%
5.6%
5.6%
5.6%
33.3%
55.6%
55.6% 5.6%
5.6%
5.6%
5.6%
0% 20% 40% 60% 80% 100%
Number of days to liquidate portfolio
Number of days for the institution to liquidate portfolio
Sector weight position vs. previous month
Sector weight position vs. previous quarter
very frequently frequently rarely never n/a
44.5%
27.2%
27.6%
26.5%
33.5%
44.4%
43.1%
43.6%
18.1%
19.9%
20.4%
20.0% 3.8%
5.6%
5.0%
5.0%
0.0%
2.8%
4.4%
4.4%
0% 20% 40% 60% 80% 100%
Number of days to liquidate portfolio
Number of days for the institution to liquidate portfolio
Sector weight position vs. previous month
Sector weight position vs. previous quarter
very frequently frequently rarely never n/a

28
Finally, it can be noted that hedge funds are more concerned about portfolio liquidity
than their long-only counterparts.
4.4.2. Analysis of the cash position
Cash is an important part of a portfolio. On one hand, it dampens the effect of
volatility, facilitates redemptions and generally provides instant liquidity in a portfolio
(Simutin, 2010). On the other, the returns on the cash tend to be lower than on equity,
and many portfolio managers are encouraged by their investors to put cash to work.
Figure 16: How frequently is the cash position analysed?
16a. Long-only funds 16b. Hedge Funds
It is evident from Figure 16 that an overwhelming majority (83%) of hedge funds
analyse their cash position every day, and none of those surveyed look at this less
frequently than every week. Comparatively, less than half (44%) of long-only funds
analyse their cash position daily, but nearly all do look at this at least once a month.
This corroborates the findings of section 4.4.1 that hedge funds appear more diligent
in assessing liquidity risk then long-only funds. However, this may indicate that hedge
funds may be more concerned about client redemptions, margin or capital calls from
prime brokers, for which the cash is often used.
4.5. Analysis of risk decomposition
Various types of risks can be driving returns of portfolios, such as stock specific
(idiosyncratic), country risk (including a) domestic market, i.e. systematic risk, and b)
foreign market risk), industry risk and currency risk. Benchmarking portfolio risk
against a risk index12
may also be relevant to understand risk decomposition within a
12
Examples of risk indices can be Barra Global Long term Indices based on volatility, momentum,
growth, value, liquidity, size, size nonlinearity and financial leverage factors.
17%
83%
Daily Weekly Monthly Quarterly Semi-annually Other
31%
22% 2% 1%
0%
44%
Daily Weekly Monthly Quarterly Semi-annually Other

29
portfolio. The frequency at which the surveyed funds analyse these risk parameters is
shown in Figure 17a and 17b.
Figure 17: Frequency of Analysis of Risk Decomposition Parameters
17a. Long-only Funds
17b. Hedge Funds
Note: n/a refers to „not applied‟ / „not relevant‟ for the fund
Given that all funds in our sample are active, it is surprising to see that these core
types of risks are not overly considered by either group of funds. While just over 10%
of long-only funds analyses these parameters very frequently, around 13% of them
never considers them. Therefore, it is evident that long-only funds do not consider the
parameters frequently enough, whereas around 70% of hedge funds does not consider
them at all. One third of hedge funds that does take into account risk decomposition
parameters, reviews them very frequently, applying a more sensible risk management
approach.
Furthermore, it would be of interest to address the issue of whether fund managers
consider how much some types of risks common for equity portfolios are accounted
33.3% 33.3%
27.8% 27.8%
33.3%
5.6% 5.6%
5.6% 5.6%
5.6%
61.1% 61.1%
66.7% 66.7%
61.1%
0% 20% 40% 60% 80% 100% Stock Specific Risk
Country Risk Industry Risk
Risk Index Currency Risk
very frequently frequently rarely never n/a
11.5% 12.6% 12.1% 11.6% 10.7%
34.1% 30.8% 30.8%
29.3% 31.5%
13.2% 14.8% 14.8%
16.0% 14.6%
12.6% 12.6% 13.2%
13.3% 13.5%
28.6% 29.1% 29.1% 29.8% 29.8%
0% 20% 40% 60% 80% 100% Stock Specific Risk
Country Risk Industry Risk
Risk Index Currency Risk
very frequently frequently rarely never n/a

30
for in the tracking error of their portfolios. The risks we consider are tail risk, growth,
financial leverage, liquidity, value, momentum, size and volatility. The importance of
these types of risks is well documented in academic literature. For instance,
Campbell, Lo and MacKinlay (1997) find evidence of fat tails in stock markets, which
are important to detect in order to avoid under or over-estimation of portfolio losses.
Extensive research has been done on the risk and performance of value, growth and
small size stocks (see for example Fama and French, 1992, 1996), so the contribution
of any of those groups of stocks to the risk of portfolio should not be underestimated
in any equity portfolio. Momentum has been widely accepted as a risk factor in a
portfolio, as documented by Carhart (1997). Further, leverage is of particular
importance to hedge funds that extensively use leverage in their strategies to gain
increased exposure to desired market segments. While on one hand leverage can help
increase in returns and maintenance of the desired portfolio risk, it can undoubtedly
boost the liquidity risk and counterparty risk13
. Therefore, adequate monitoring of
financial leverage is imperative for funds that apply high leverage strategies. Finally,
as seen in previous sections, liquidity is normally perceived by investors as a very
important risk factor, particularly during times of market downturns, when the
underlying equity volatility is higher. Benston and Hagerman (1974), Amihud and
Mendelson (1989) and Brunnemeier and Pedersen (2008) find that liquidity decreases
at the times of increase in market volatility. At those periods, many fund managers
sell less liquid securities in order to replace them with more liquid ones, i.e. exhibit
„flight to liquidity‟ behaviour. For instance, Acharya and Pedersen (2005) review in
detail the literature on liquidity in asset pricing and document that illiquid stocks have
liquidity risks, measured through their liquidity-adjusted CAPM model and find
evidence of „flight to liquidity‟. Therefore, given that our survey is conducted in 2010,
amid the recent financial crisis, assessing whether funds consider liquidity and
volatility as part of the tracking error is imperative. Figure 18a and 18b show to which
extent surveyed funds account for these risks.
13
http://www.edhec-risk.com/latest_news/featured_analysis/RISKArticle.2008-10-
10.2612?newsletter=yes

31
Figure 18: Frequency of analysis of contribution of various risks to the tracking
error
18a. Long-only Funds
18b. Hedge Funds
Note: n/a refers to „not applied‟ / „not relevant‟ for the fund
It can be seen that liquidity, followed by volatility, are considered the most by long
only funds, which is intuitively right as the study covers the period of bear market. It
is interesting to note that for instance style risks, such as growth, value, size or
momentum are largely ignored, although many funds in our long-only sample follow
investment strategies based on style analysis.
77.8% 29.4%
23.5% 25.0%
88.9% 37.5%
29.4% 35.3%
0.0% 0.0%
0.0% 0.0%
0.0%
11.8% 0.0%
0.0% 0.0%
0.0% 0.0%
0.0% 0.0%
0.0% 0.0%
0.0% 0.0%
0.0% 0.0%
0.0% 0.0%
0.0% 0.0%
22.2% 70.6%
76.5% 75.0%
11.1% 56.3%
58.8% 64.7%
6.3%
0% 20% 40% 60% 80% 100%
Volatility Size
Momentum Value
Liquidity Financial
Growth Tail
very frequently frequently rarely never n/a
37.8% 3.9% 4.0% 3.6%
64.1% 7.9%
4.5% 12.4%
7.8% 5.6%
4.5% 3.6%
2.8% 7.3%
6.2% 1.7%
3.3% 3.4% 5.1%
6.0% 3.3%
3.4% 2.8%
4.0%
5.6% 6.7%
6.8% 7.8%
5.0% 7.3%
6.7% 6.2%
45.6% 80.3% 79.7% 79.0%
24.9% 74.0%
79.8% 75.7%
0% 20% 40% 60% 80% 100%
Volatility Size
Momentum Value
Liquidity Financial
Growth Tail
very frequently frequently rarely never n/a

32
Comparatively, all types of risks are given greater consideration by hedge funds than
long-only funds. For example, a massive 88.9% of hedge fund managers very
frequently review the contribution of liquidity to their tracking error, while 77.8%
very frequently review volatility. It is surprising though that financial leverage is not
reviewed at all by over 60% of the funds, given that hedge funds are well known for
excessive financial leveraging.
4.6. Analysis of Portfolio Turnover and Performance
4.6.1. Frequency of Analysis of Portfolio Turnover
Portfolio turnover is important to assess how trading costs and frequent changes in a
portfolio have an effect on performance. For instance, Carhart (1997), among others,
finds that there is a negative relationship between turnover and performance,
documenting that an increase in turnover by 1% will lead to reduction of the annual
abnormal return of a mutual fund by 0.95%. The importance of turnover for cost and
risk management overall is even more magnified for hedge funds as many of them
apply highly aggressive strategies with very high daily turnover rates, as suggested by
Madhavan (2002). Therefore, fund managers who apply analysis of a fund‟s turnover
at a high frequency might help to improve portfolio performance as they would gain a
better understanding and control of their costs. Figure 19 illustrates our findings.
Figure 19: Frequency of Portfolio Turnover Analysis
19a: Long-only funds 19b: Hedge funds
50%
22%
22%
6% 0%
Daily Weekly Monthly Quarterly Semi-annually
6%
20%
43%
30%
1%
Daily Weekly Monthly Quarterly Semi-annually

33
Out of 182 long-only and 18 hedge funds, only 6% of long-only review portfolio
turnover daily, compared to 50% of hedge funds, thus making the daily turnover
assesment the most popular method for hedge funds. For long-only funds, the most
common frequency at which portfolio turnover is analysed is monthly (for 43% of the
funds in the sample). Furthermore, 2% of long-only funds consider turnover only
twice per annum. This finding leads us to conclude that long-only funds are not as
aware of the effects of the cost of portfolio rebalancing on their performance as hedge
funds.
4.6.2. Peer-group Perfomance Assessment
Peer-group benchmarking is of particular relevance for active managers as this is how
their success (or failure) is judged, both externally by clients and internally for
remuneration.
Figure 20: Frequancy of Peer-group Performance Assessment
20a: Long-only funds 20b: Hedge Funds
Figure 20 signals that a large 83% of long-only managers review their performance
versus peers on a quarterly basis, while 63% of hedge funds apply peer-group analysis
every month. This difference in frequency of comparing performance to peers may be
the result of more dynamic strategies applied by hedge funds and their tendency to
exhibit a shorter-term investment horizon than long-only funds. Nevertheless,
analysing performance vs. peers for active portfolio managers should be crucial to
help assess return and risk taken relative to the competitors in the field.
63%
32%
Monthly Quarterly Semi-annually
15%
83%
Monthly Quarterly Semi-annually

34
4.7. The Impact of 2008-2009 Financial Crisis on Investment in Risk
Management
It is interesting to examine whether there has been a change in spending on risk
management following the 2008 Lehman Brothers collapse, after which risk
management practices of financial institutions were widely criticized. Figure 21
shows the amount long-only funds and hedge funds spent on risk management per
annum in 2010.
Figure 21: The Amount Spent on Risk Management in 2010 (p.a)
21a: Long-only funds 21b: Hedge funds
Figures 21a and 21b reveal the lack of financial commitment of senior management
towards risk management for both long-only and hedge funds. Specifically, 44% of
long-only equity funds spend less than $5million on risk management annually; 35%
spend between $10million and $20million and just one fifth (21%) of long-only funds
spend more than $20million. Similarly, a considerable number of hedge funds (61%)
spend less than $5million on risk management annually, while 28% spend between
$10million and $20million. Only 11% spend more than $20million.
One may argue that amount spent on risk management is linked with the size of the
company. The total assets within the respondents sample aggregate to approximately
$1.55 trillion, but the amount spent on risk management as a percent of assets
managed still seems to be very limited. Hedge funds spend less on risk management
than long only firms in absolute terms, but on the average they have lower AUM, as
noted in section 4.2.1. At the same time, in spite of spending on risk management
61% 28%
11%
Below $5mn Between $10 to $20mn Above $20mn
44%
35%
21%
Below $5mn Between $10 to $20mn Above $20mn

35
being low, it rises with the size of AUM of the long-only funds. The same cannot be
inferred for hedge funds, as Table 3 documents.
Table 3: Amount spent on risk management (p.a) relative to average AUM of the
funds
Average AUM per type
of fund
Amount Spent on risk Management p.a.
Below $5 million $10 - $20 million Over $20 million
Long- only Funds
Average AUM (in $bn)
5.10 6.52 23.66
Hedge Funds Average
AUM (in $bn)
0.30 7.83 3.06
Given that the recent financial crisis has made investors and asset managers re-think
their attitude towards risk, we investigate further whether the amount spent on risk
management in 2010 has increased relative to previous years.
Figure 22: The Change in the Investment in Risk Management Relative to
Previous Years
22a: Long-only Funds
22b: Hedge Funds
64.7%
64.7%
64.7%
35.3%
35.3%
35.3%
0% 20% 40% 60% 80% 100%
Last year
Last 3 years
Last 5 years
Yes No
75.6%
76.7%
76.6%
24.4%
23.3%
23.4%
0% 20% 40% 60% 80% 100%
Last year
Last 3 years
Last 5 years
Yes No

36
As seen in Figures 22a and 22b, just over 3/4 of long-only firms in our sample and
just under 1/3 of hedge funds have increased the amount that they spent on risk
management compared to the last year, the last three years and the last five years.
Nevertheless, this trend points to an increasing focus and awareness of the importance
of risk management, and indicates that firms have begun to address at least some of
the issues regarding additional resources to enhance their risk management
capabilities. Even though this is the case for some of the surveyed funds, there is still
nearly a quarter of long-only and over a third of hedge funds which have made no
increase in investment in risk management at all. One possible reason why hedge
funds have not increased expenditure on risk management as much as long-only firms
is that they were already more cautious in terms of risk, finding less need to improve
and invest, compared with their long only counterparts.
To evaluate whether the recent financial crisis has changed the general attitude
towards risk in long-only funds and hedge funds, we investigate whether parameters
we have used as the determinants of risk in this survey, such as liquidity, size,
turnover, etc. are considered on a more frequent basis than in the years during and
before financial crises of 2008. Figure 23 reveals that majority of the funds became
more diligent in testing risk parameters.

37
Figure 23: Has the frequency of testing risk parameters increased over the last
one, three and five years?
23a: Long-only funds
23b: Hedge funds
Specifically, over three-quarters of long only firms surveyed have increased the
frequency at which risk parameters in this survey are checked compared to previous
one, three and five years. Similarly, the hedge funds surveyed show that while 70.6%
have seen an increase in risk management activity over the last one, three and five
years, 29.4% not seen an increase in risk management activity over the last one, three
and five years.
The findings in this section bring to light the fact that hedge funds did not change
their attitude towards risk management as much as long only asset managers.
However, regardless of this, it should be noted that the turmoil in financial markets
that started at the end of 2008 has increased the importance of risk management to
investment managers overall.
70.6% 70.6% 70.6%
29.4% 29.4% 29.4%
0% 20% 40% 60% 80% 100% Last year (2009)
Last 3 years Last 5 years
Yes No
77.1% 77.7% 77.7%
22.9% 22.3% 22.3%
0% 20% 40% 60% 80% 100%
Last year (2009) Last 3 years Last 5 years
Yes No

38
4.7. Relationship between companies’ performance and risk management
To assess whether the amount spent on risk management is related to the performance
of the fund, we run the following cross-sectional regression:
130.......1, iASbaePerformanc iiiii
Where iePerformanc is expressed as the rank of fund i obtained as weighted average
12 month absolute return for that fund. Note that some of the institutions in our
sample are hedge funds or privately owned, so the rank data is available for 130 of the
200 finds surveyed (where 1 is the highest and 130 is the lowest ranked fund). iAS is
the amount spent on risk management. Note that in our survey the mount spent on risk
management is grouped in the following categories: „$0 - $5mn‟, „$10 - $20mn‟ and
„above $20mn‟. For the purpose of this model we classify each $5mn as a unit, so that
„$0 - $5mn‟ takes value of „1‟, „$10 - $20mn‟ the value of „3.5‟ and „above $20mn‟
the value of „5‟. Table 4 lays out the result.
Table 4: Relation between Performance Rank and Amount Spent on Risk
Management
Coefficient t-statistic
Intercept 71.85 10.68***
AS -2.20 1.10
R-squared 0.009
Note: *** indicates significance at 1% level
A negative sign on the AS coefficient in the cross-sectional regression shows that
funds that have spent more on risk management should expect to be ranked better in
the performance rankings. However this result is not significant the conventional
levels of statistical significance.
5. Conclusions
This paper provides a comprehensive survey or risk management practices in 200
active European equity asset management firms, both long-only and hedge funds. Our
analysis indicates that areas for improvement are many, which is of particular

39
relevance for long only funds. Specifically, over 70% of the funds in the sample resort
to the same risk management system and many long only funds do not examine some
relevant types of risks (such as size or style risk). In both long only and hedge funds,
we find that risk managers are taking on additional roles and lacking independence
and that senior management is not well represented in the risk area. Further, long-only
funds in particular do not revise frequently enough the top/bottom holdings, among
other things. Further, we document that allocation of resources to risk management
relative to company size is rather low. Smaller funds in our sample spend
comparatively less on risk management than larger funds, which is to be expected.
Nevertheless, our study shows that those funds that spend more on risk management
are more likely to be ranked higher in the performance league tables. Overall, we find
that hedge funds tend to be more risk aware than long only institutions.
As a consequence of financial crisis, the paradigm of poor risk management in
European equity funds seems to be shifting as more funds appear to spend more effort
to improving their risk management resources. Further research may confirm whether
the trend is likely to continue in the future.

40
References:
Acharya, L.H. Pedersen (2005), “Asset Pricing with liquidity risk”, Journal of
Financial Economics 77 (2005) 375–410
Banz, R.W., 1981, “The Relationship between Return and Market Value of Common
Stocks, ”Journal of Financial Economics 9, 3-18.
Bender, Jennifer; Nielsen Frank; “Best practices for investment risk management”,
2009 - MSCI Barra Research Insights, June 2009, pp 1-12
Blommestein, Hans J., Risk Management after the Great Crash. Journal of Financial
Transformation, Vol. 28, pp. 131-137, April 2010
Brandolini Dario, Pallotta Massimiliano, Zenti Raffaele, “Risk Management in an
Asset Management Company: a practical case”, RAS Asset Management, 2000
Brown, Tom; "Beyond the credit crisis: the impact on investment management."
Global Investor 16-17., 2008
Buehler, K., Freeman, A., Hulme, R. (2008) The Risk Revolution - The Tools: The
New Arsenal of Risk Management. In: Harvard Business Review, September 2008,
pp. 1-9.
Carhart, Mark M., 1997, On The Persistence in Mutual Fund Performance, The
Journal of Finance 52, No. 1, 57 – 82.
Chan K, C, and N. Chen, 1991, Structural and return characteristics of small and large
firms, Journal of Finance 46, pp 1467-1484.

41
Cremers, K.J.M and Petajosto, A. How Active Is Your Fund Manager? A New
Measure That Predicts Performance, The Review of financial Studies, Volume 22, no.
9, 2009, pp 3329-3365.
Daniélsson Jon, Jorgensen Bjorn, Sarma M, deVries CG, Zigrand Jean-Pierre,
“Consistent Measures of Risk”, 2006, Discussion paper, 565. Financial Markets
Group, London School of Economics and Political Science, London, UK
Darnell, Max; “What Volatility tells us about diversification and risk management”
CFA Conference Porceedings Quarterly, September 2009, Vol. 26, No. 3: 57-66
DeMiguel, Victor; Plyakha, Yuliya; Uppal, Raman; Vilkov, Grigory, 2011, Improving
Portfolio Selection Using Option-Implied Volatility and Skewness, SSRN,
http://papers.ssrn.com/sol3/papers.cfm?abstract_id=1474212
Dolde, Walter, (1995), Hedging, Leverage, and Primitive Risk, The Journal of
Financial Engineering, Vol. 4, No. 2, pp. 187-216.
Eppler, Martin, Aeschimann, Markus, “A Systematic Framework for Risk
Visualisation in Risk Management and Communication”, Risk Management; 2009,
vol 11, pp. 67–89.
Estrada, J., 2000. The cost of equity in emerging markets: a downside risk approach.
In: Emerging Markets Quarterly (Fall), pp. 19–30.
Estrada, J., 2002. Systematic risk in emerging markets: the D-CAPM. Emerging
Markets Review 4, 365–379.
Fama, E. F., 1970, “Efficient Capital Markets: A Review of Theory and Empirical
Work”, The Journal of Finance 25, No. 2, 383 - 417.

42
Fama E. F., and K. R. French, 1993, Common Risk Factors in the Returns on Stocks
and Bonds, Journal of Financial Economics 33, 3 - 56.
Fama, E. F., and K. R. French, 1996, Multifactor Explanations of Asset Pricing
Anomalies, The Journal of Finance 51, No.1, 55 - 84
Francis, J. and J. Stephan, (1993), Characteristics of Hedging Firms: An Empirical
Investigation, in Robert J. Schwartz and Clifford W. Smith, Jr., eds., Advanced
Strategies in Financial Risk Management, (New York Institute of Finance), pp. 615-
635.
Golub, Bennett, Crum, Conan; "Risk Management Lessons Worth Remembering
from the Credit Crisis of 2007-2009"; Journal of Portfolio Management 36, no. 3,
2010
Goto, Shingo and Xu, Yan, On Mean Variance Portfolio Optimization: Improving
Performance Through Better Use of Hedging Relations;
Harvey, C., 2000. Drivers of expected returns in international markets. In: Emerging
Markets Quarterly (Fall), pp.32–48.
Jorion, Philippe (2007), “Value at Risk – the New Benchmark for Managing Financial
Risk” - Third Edition
Judge, Amrit, “Why Do Firms Hedge? A Review of the Evidence, Middlesex
University Business School, 2006
Litterman, Bob; “Modern investment management – an equilibrium approach”, 2003 -
Bob Litterman and the quantitative Resources Group - Goldman Sachs Asset
Management

43
Madhavan, A (2002), “Implementation of Hedge Fund Strategies”, in „Hedge Fund
Strategies: a Global Outlook‟, Institutional Investor Guides: Special issues, Vol. 2002,
No. 1: pp. 74–80
Martellini, Lionel; ”Risk Matters...”, Edhec-Risk Asset Management Research, Risk
Management, 2010a, http://www.edhec-risk.com/edito/RISKArticleEdito.2010-01-
20.5802/view
Mian, Shehzad L., (1996), Evidence on Corporate Hedging Policy, Journal of
Financial and Quantitative Analysis, Vol. 31, No. 3, pp. 419-439.
Nance, R. Deana, Smith, W. Clifford jr., Smithson, W. Charles (1993), On the
determinants of Corporate hedging. Journal of Finance Vol. XLVIII, No.1 pp. 267-
284.
Rebonato, Riccardo, “Plight of the Fortune Tellers – Why we need to manage
financial risk differently”, 2007, Princeton University Press
Samuelson, P., 1965, “Proof that Properly Anticipated Prices Fluctuate Randomly”,
Industrial. Management Review, 6:2
Sauner-Leroy, Jacques-Bernard, Managers and Productive Investment Decisions: The
Impact of Uncertainty and Risk Aversion (2004). Journal of Small Business
Management, Vol. 42, Issue 1, p. 1-18 2004.
Tolga, D. (2004), “Managing risks of long/short equity strategies”, in “The New
Generation of Risk Management for Hedge Funds and Private Equity Investments”,
Ed. By Lars Jaeger (2004), Institutional Investor books, NY.

44
Wermers, R. 2003. Are Mutual Fund Shareholders Compensated for Active
Management Bets? Working Paper,University of Maryland.
Wysocki, Peter, (1996), Managerial Motives and Corporate Use of derivatives: Some
Evidence, Working paper, Simon School of Business, University of Rochester

45
Appendix
Questionnaire:
1. Which Risk Management tool do you currently use?
Barra
AllegroDev
Mega
Other: Specify:
2. How often do your Portfolio Managers use the system?
Daily
Weekly
Monthly
Quarterly
Semi-annually
Other: Specify:
3. Is your Institution characterized by being predominantly:
Long only
Hedge Fund
Other: Specify:
4. How frequently does a Risk Manager meet with the Portfolio Manager to discuss
risks within a portfolio?
Daily
Weekly
Monthly
Quarterly
Semi-annually
Other: Specify:
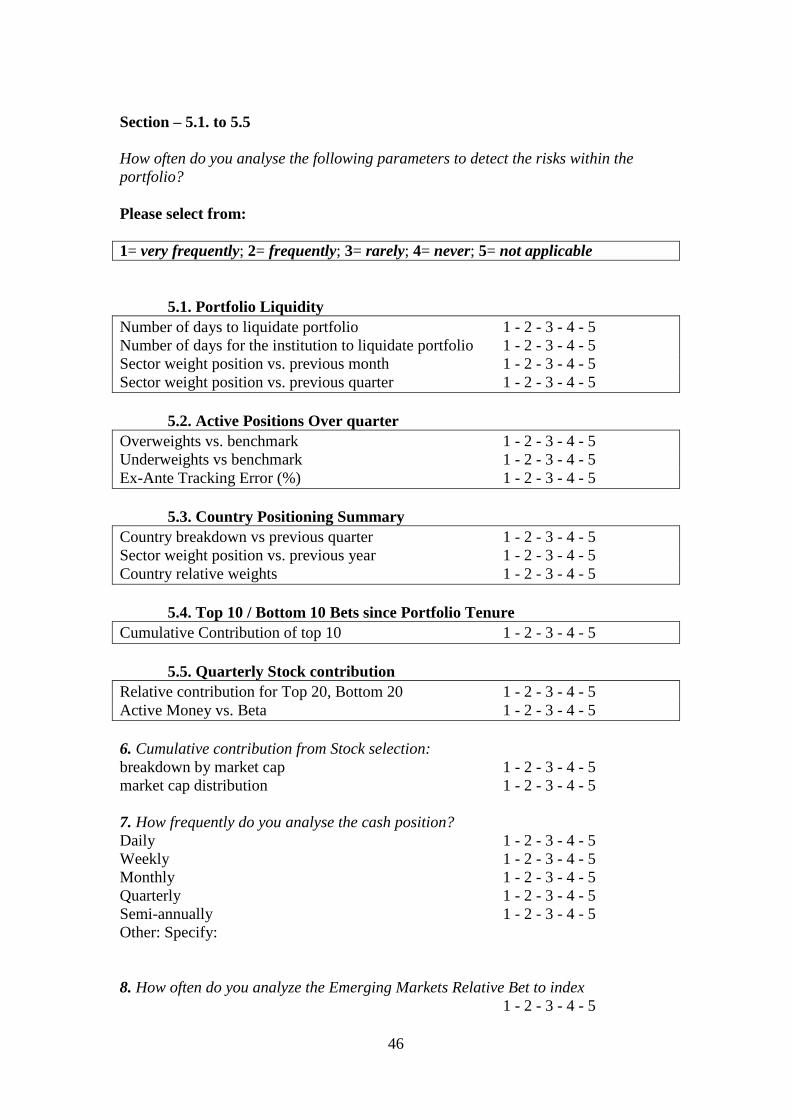
46
Section – 5.1. to 5.5
How often do you analyse the following parameters to detect the risks within the
portfolio?
Please select from:
1= very frequently; 2= frequently; 3= rarely; 4= never; 5= not applicable
5.1. Portfolio Liquidity
Number of days to liquidate portfolio 1 - 2 - 3 - 4 - 5
Number of days for the institution to liquidate portfolio 1 - 2 - 3 - 4 - 5
Sector weight position vs. previous month 1 - 2 - 3 - 4 - 5
Sector weight position vs. previous quarter 1 - 2 - 3 - 4 - 5
5.2. Active Positions Over quarter
Overweights vs. benchmark 1 - 2 - 3 - 4 - 5
Underweights vs benchmark 1 - 2 - 3 - 4 - 5
Ex-Ante Tracking Error (%) 1 - 2 - 3 - 4 - 5
5.3. Country Positioning Summary
Country breakdown vs previous quarter 1 - 2 - 3 - 4 - 5
Sector weight position vs. previous year 1 - 2 - 3 - 4 - 5
Country relative weights 1 - 2 - 3 - 4 - 5
5.4. Top 10 / Bottom 10 Bets since Portfolio Tenure
Cumulative Contribution of top 10 1 - 2 - 3 - 4 - 5
5.5. Quarterly Stock contribution
Relative contribution for Top 20, Bottom 20 1 - 2 - 3 - 4 - 5
Active Money vs. Beta 1 - 2 - 3 - 4 - 5
6. Cumulative contribution from Stock selection:
breakdown by market cap 1 - 2 - 3 - 4 - 5
market cap distribution 1 - 2 - 3 - 4 - 5
7. How frequently do you analyse the cash position?
Daily 1 - 2 - 3 - 4 - 5
Weekly 1 - 2 - 3 - 4 - 5
Monthly 1 - 2 - 3 - 4 - 5
Quarterly 1 - 2 - 3 - 4 - 5
Semi-annually 1 - 2 - 3 - 4 - 5
Other: Specify:
8. How often do you analyze the Emerging Markets Relative Bet to index
1 - 2 - 3 - 4 - 5

47
9. How often do you analyze the portfolio turnover?
Daily 1 - 2 - 3 - 4 - 5
Weekly 1 - 2 - 3 - 4 - 5
Monthly 1 - 2 - 3 - 4 - 5
Quarterly 1 - 2 - 3 - 4 - 5
Semi-annually 1 - 2 - 3 - 4 - 5
Other: Specify:
10. How often do you analyze the portfolio performance vs. peers?
Monthly 1 - 2 - 3 - 4 - 5
Quarterly 1 - 2 - 3 - 4 - 5
Semi-annually 1 - 2 - 3 - 4 - 5
Other: Specify:
Other questions:
11. How often do you analyse the following parameters to detect the risks within the
portfolio?
Active Money 1 - 2 - 3 - 4 - 5
Stocks Outside the Benchmark 1 - 2 - 3 - 4 - 5
Tracking Error 1 - 2 - 3 - 4 - 5
Beta:
% of TE from Top 10 stocks 1 - 2 - 3 - 4 - 5
How much relative performance comes from Beta 1 - 2 - 3 - 4 - 5
12. How often do you analyze the following risk decomposition parameters?
Stock Specific Risk 1 - 2 - 3 - 4 - 5
Country Risk 1 - 2 - 3 - 4 - 5
Industry Risk 1 - 2 - 3 - 4 - 5
Risk Index 1 - 2 - 3 - 4 - 5
Currency Risk 1 - 2 - 3 - 4 - 5
Other – Specify:
13. Sector Top 10 Bottom 10 Risk Contributors:
as Percentage of Tracking Error 1 - 2 - 3 - 4 - 5
14. Countries – Top 10 Risk Contributors:
as Percentage of Tracking Error 1 - 2 - 3 - 4 - 5

48
15. How often do you analyze the following risk contributors as % of tracking error:
Volatility 1 - 2 - 3 - 4 - 5
Size 1 - 2 - 3 - 4 - 5
Momentum 1 - 2 - 3 - 4 - 5
Value 1 - 2 - 3 - 4 - 5
Liquidity 1 - 2 - 3 - 4 - 5
Financial Leverage 1 - 2 - 3 - 4 - 5
Growth 1 - 2 - 3 - 4 - 5
Tail Behaviour 1 - 2 - 3 - 4 - 5
16. Do you use Style Research Ltd. tool?
Yes – No
Other – Specify
If Yes
17. How often do you use the above system?
Daily 1 - 2 - 3 - 4 - 5
Weekly 1 - 2 - 3 - 4 - 5
Monthly 1 - 2 - 3 - 4 - 5
Quarterly 1 - 2 - 3 - 4 - 5
Semi-annually 1 - 2 - 3 - 4 - 5
Other- Specify:
18. Who has the final decision regarding changes to the portfolio when the portfolio
is outside the risk parameters?
(please tick appropriate box)
CIO
Head of Equities
Risk Manager
Portfolio Manager
Other –Specify
Risk Management Process
19. How many people are in your Risk Management Team?
(please tick appropriate box)
1-5
6-10
10+
20. Does your Risk Manager accumulate other roles?
(please tick appropriate box)
Yes
No
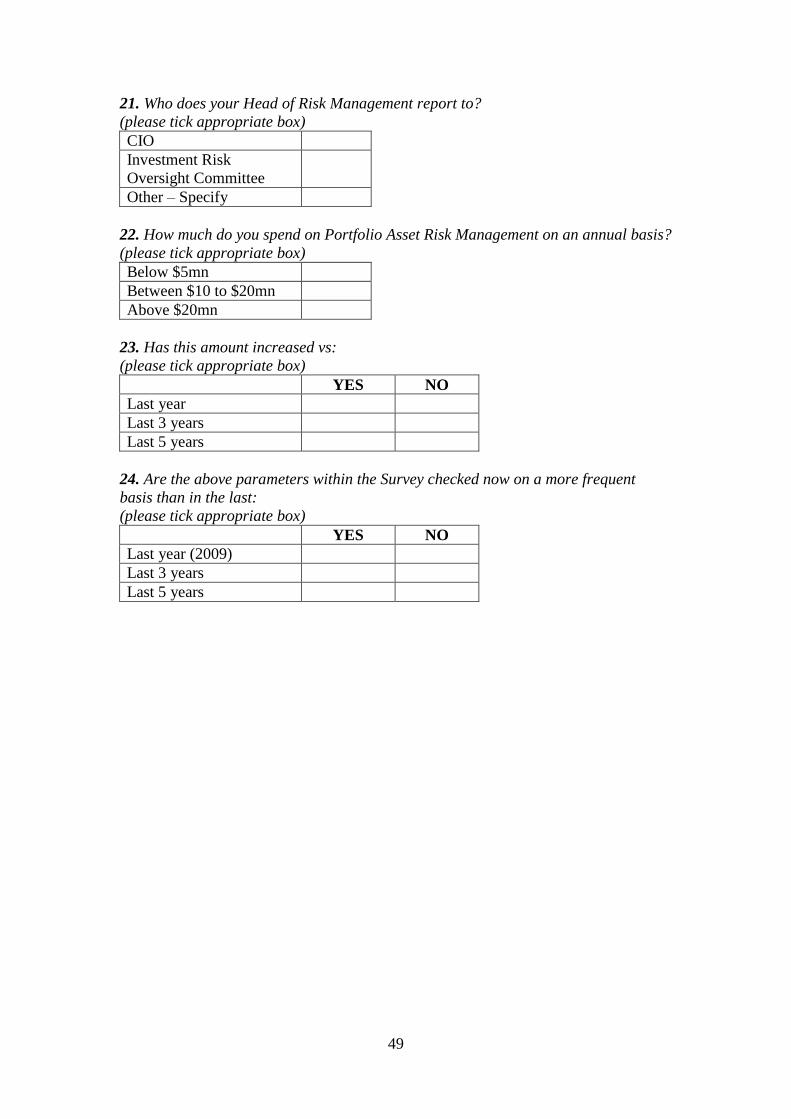
49
21. Who does your Head of Risk Management report to?
(please tick appropriate box)
CIO
Investment Risk
Oversight Committee
Other – Specify
22. How much do you spend on Portfolio Asset Risk Management on an annual basis?
(please tick appropriate box)
Below $5mn
Between $10 to $20mn
Above $20mn
23. Has this amount increased vs:
(please tick appropriate box)
YES NO
Last year
Last 3 years
Last 5 years
24. Are the above parameters within the Survey checked now on a more frequent
basis than in the last:
(please tick appropriate box)
YES NO
Last year (2009)
Last 3 years
Last 5 years