risk on the rise: understanding and managing coastal flood risk
TRANSCRIPT

1Copyright © 2015 Risk Management Solutions, Inc. All Rights Reserved. April 15, 2023
RISK ON THE RISE
UNDERSTANDING AND MANAGING COASTAL FLOOD RISK Robert Muir-Wood and Juergen Grieser
1Copyright © 2015 Risk Management Solutions, Inc. All Rights Reserved. April 15, 2023

2
MEET THE EXPERTS
Robert Muir-Wood, Ph.D.
Chief Research Officer
Juergen Grieser, Ph.D.
Director, Model Development
333
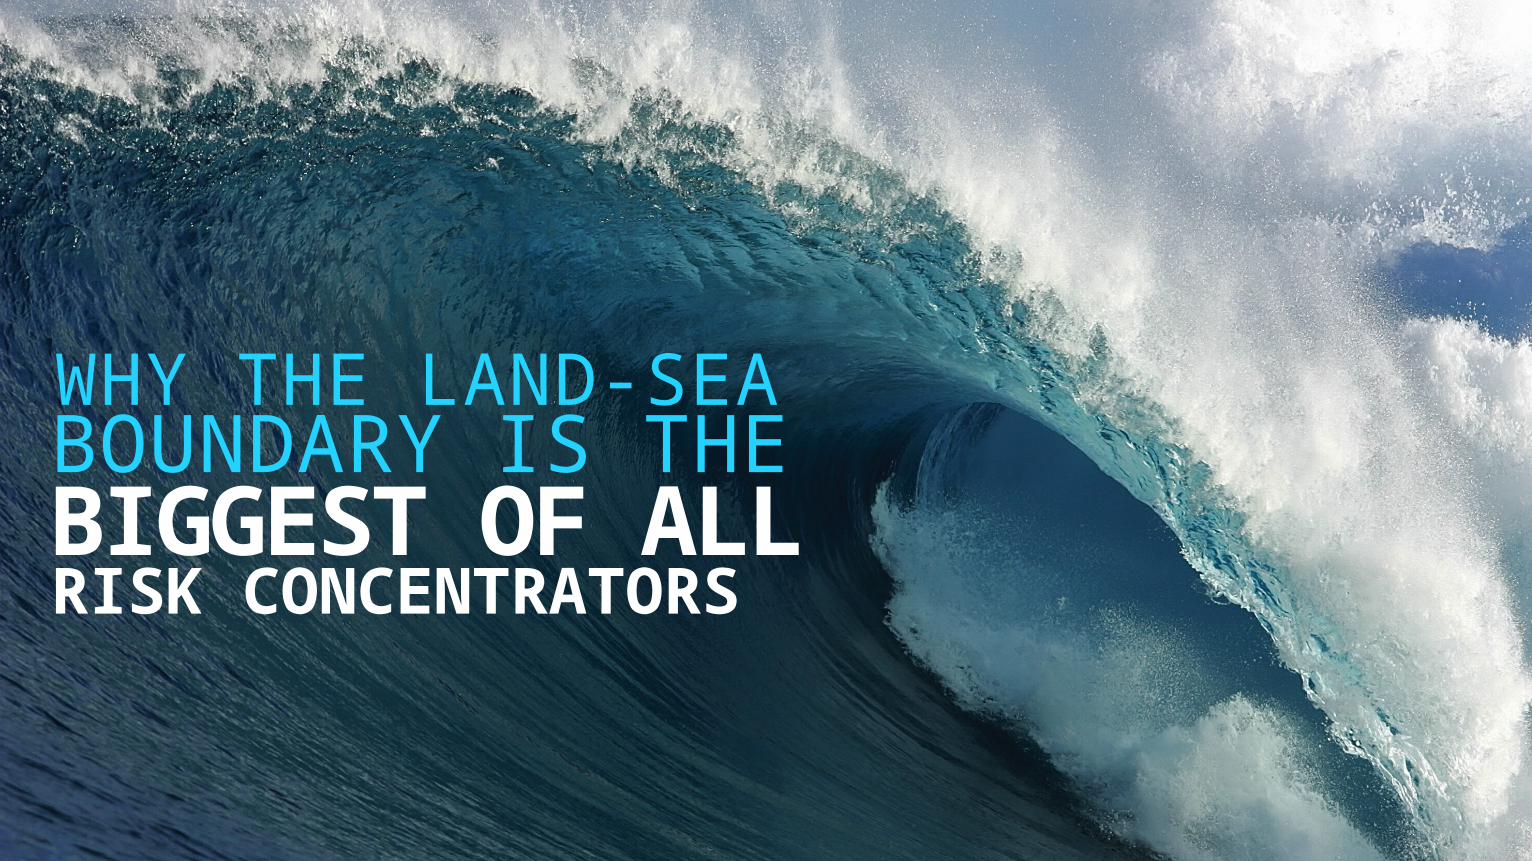
BOUNDARY IS THE
RISK CONCENTRATORS
WHY THE LAND-SEA
BIGGEST OF ALL
4
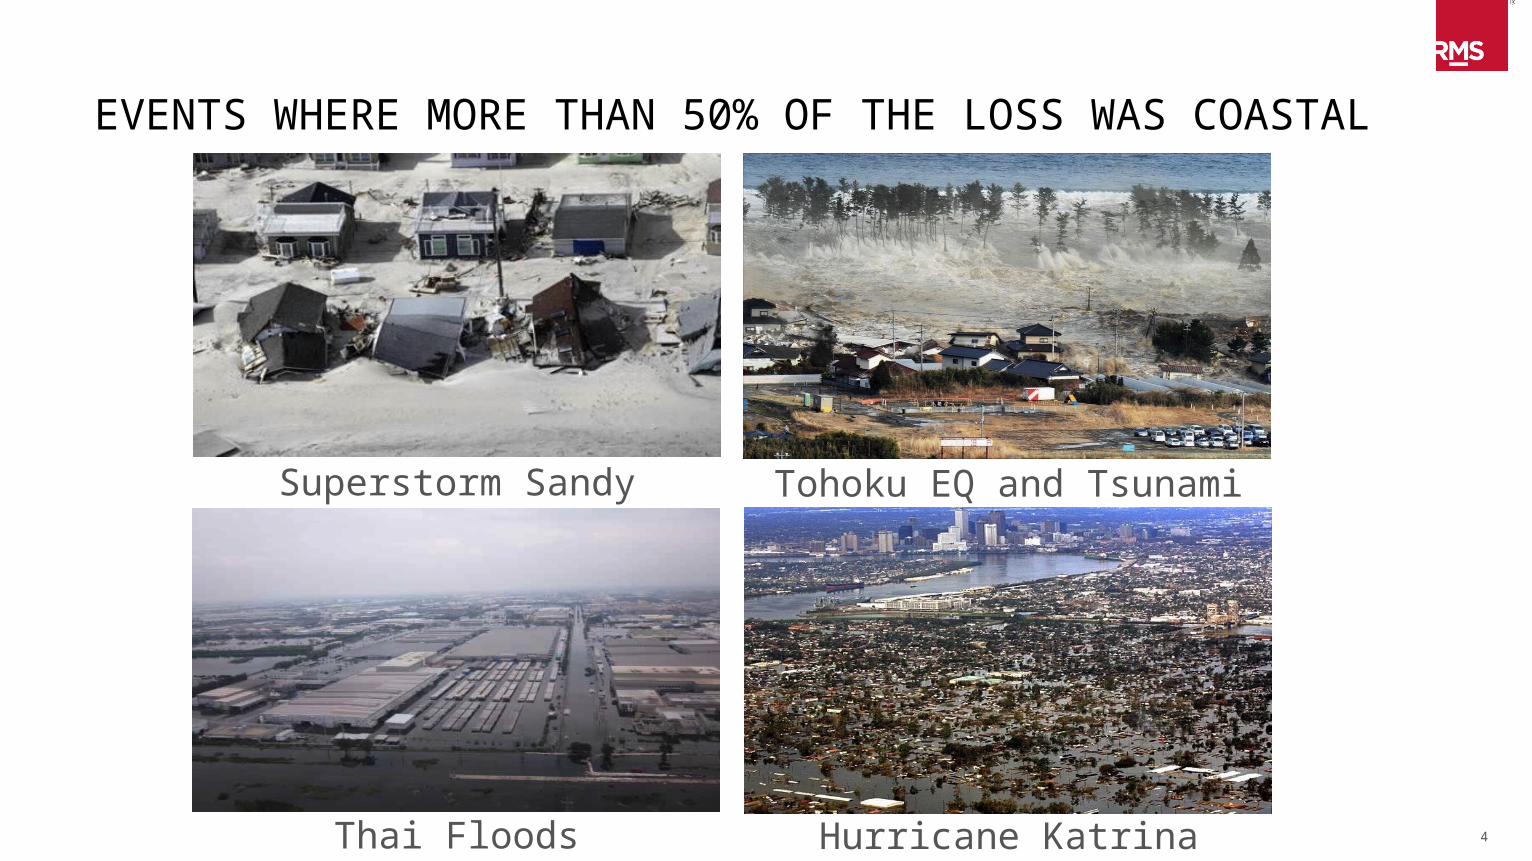
EVENTS WHERE MORE THAN 50% OF THE LOSS WAS COASTAL
Thai Floods
Superstorm Sandy Tohoku EQ and Tsunami
Hurricane Katrina

5Copyright © 2015 Risk Management Solutions, Inc.
HOW LAND VALUES INCREASE AT THE COAST
The amenity value of the same property increases significantly at the coast.
The most expensive property is then also the most vulnerable.
http://www.gradschool.psu.edu/diversity/mcnair/papers2003/majorpdf/
Data from Stone Harbor and Avalon, New Jersey, 2002/2003Photos courtesy of Airbnb.com
3
2.5
2
1.5
1
0.5
0> 2 Blocks
Back2 Blocks
BackBayfront OceanfrontBeach Block
Mul
tiple
for
res
iden
tial p
rope
rty

6
COAST-SPECIFIC EXPOSURE CATEGORIES
Hotels and condosAirports
Ports Marinas
Refineries
Power plants

7Copyright © 2015 Risk Management Solutions, Inc.
THE PDF OF GLOBAL EXPOSURE VALUE BY ELEVATION (ABOVE HIGH-WATER LEVEL)
For first meter:average value = $1Bn/mm
However, pre-existing safety marginsgive critical thresholding effects.
Reconstructed from Anthoff et al., (2006)
1000
750
500
250
0
0 2 4 6 8 10
Meters elevation asl
Billions of dollars, U.S.

8Copyright © 2015 Risk Management Solutions, Inc.
1000-YEAR WATER HEIGHTS FOR AUSTRALIA
‘Coastal’ should not be measured in ‘distance’ (D2C) but instead in elevation (H2HW).
‘Elevation at risk’ varies by location.
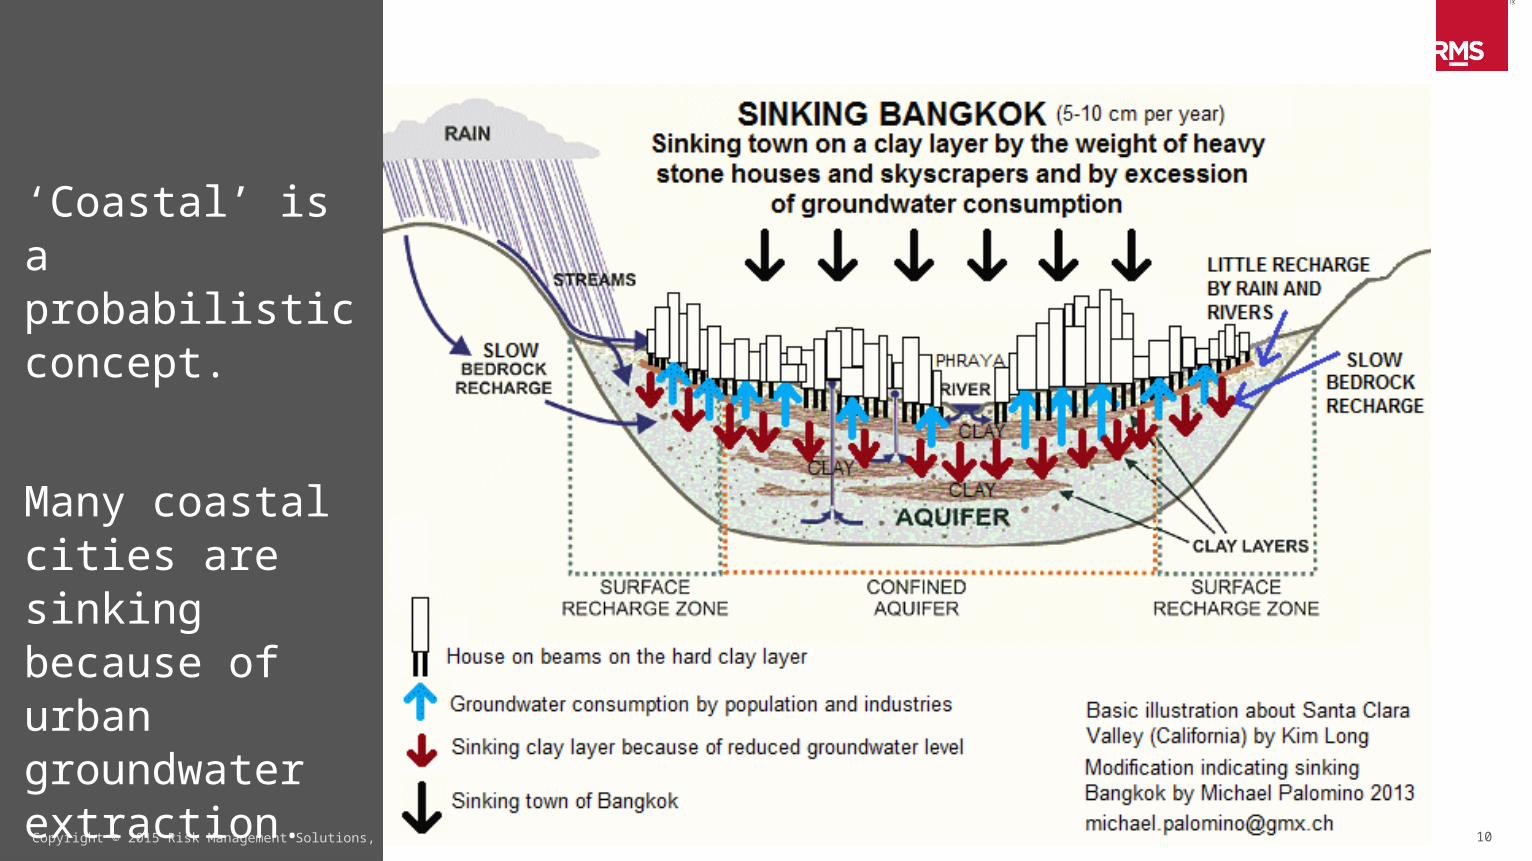
‘Coastal’ is a probabilistic concept.
9
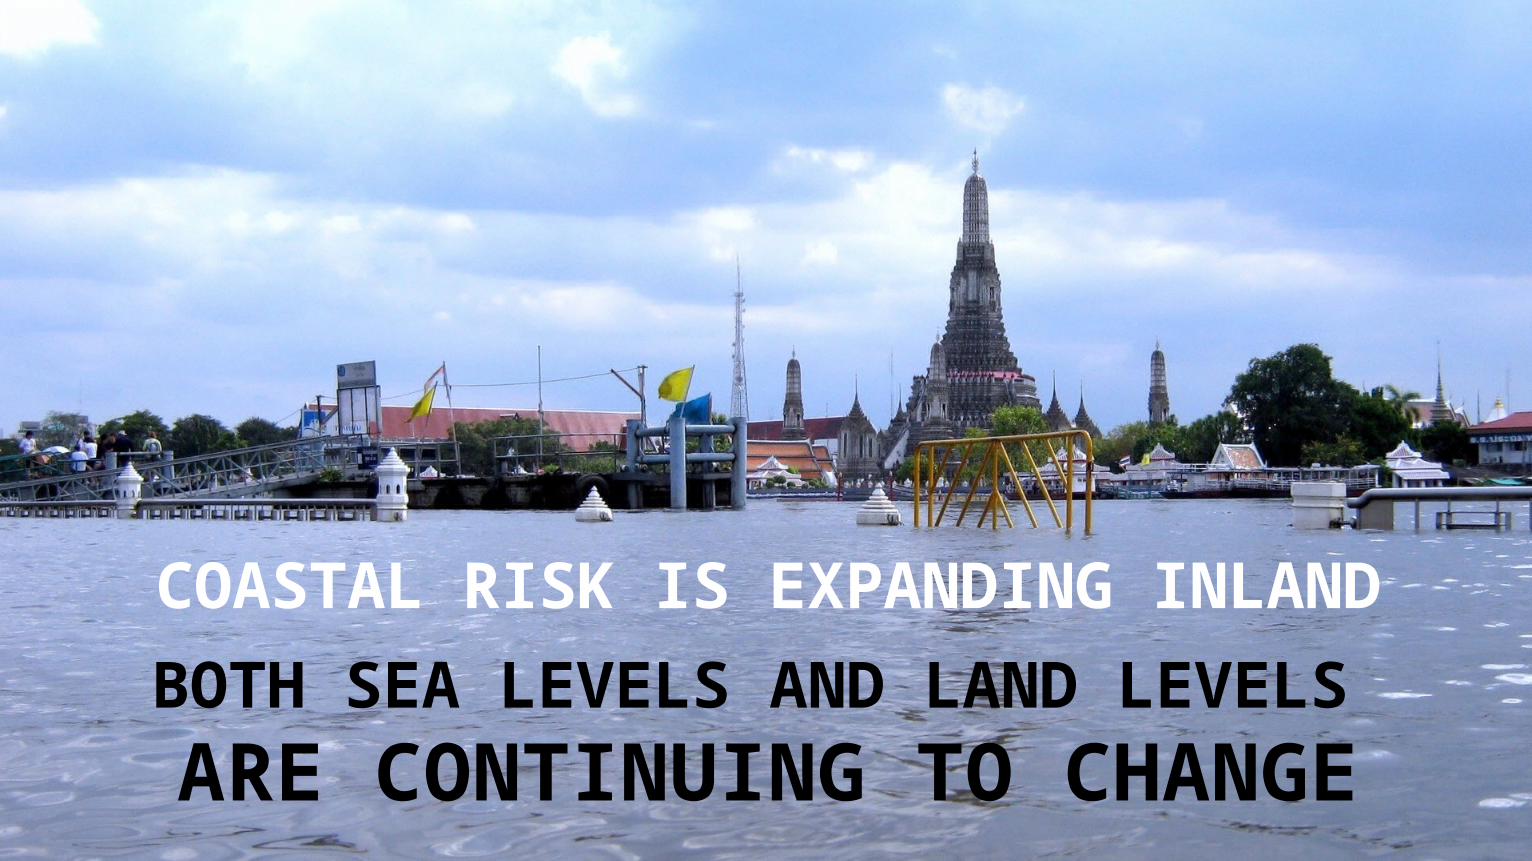
BOTH SEA LEVELS AND LAND LEVELS
COASTAL RISK IS EXPANDING INLAND
ARE CONTINUING TO CHANGE
10Copyright © 2015 Risk Management Solutions, Inc.
‘Coastal’ is a probabilistic concept.
Many coastal cities are sinking because of urban groundwater extraction.

11Copyright © 2015 Risk Management Solutions, Inc.
10-Foot Tsunami
SEVERE PHYSICAL DAMAGE POTENTIAL FROM COASTAL FLOOD HAZARDS
Damage from a 10-foot storm surge is little different from that of a 10-foot tsunami—note that debris can be a principal driver of severe damage. 10-Foot Storm Surge
12Copyright © 2015 Risk Management Solutions, Inc.
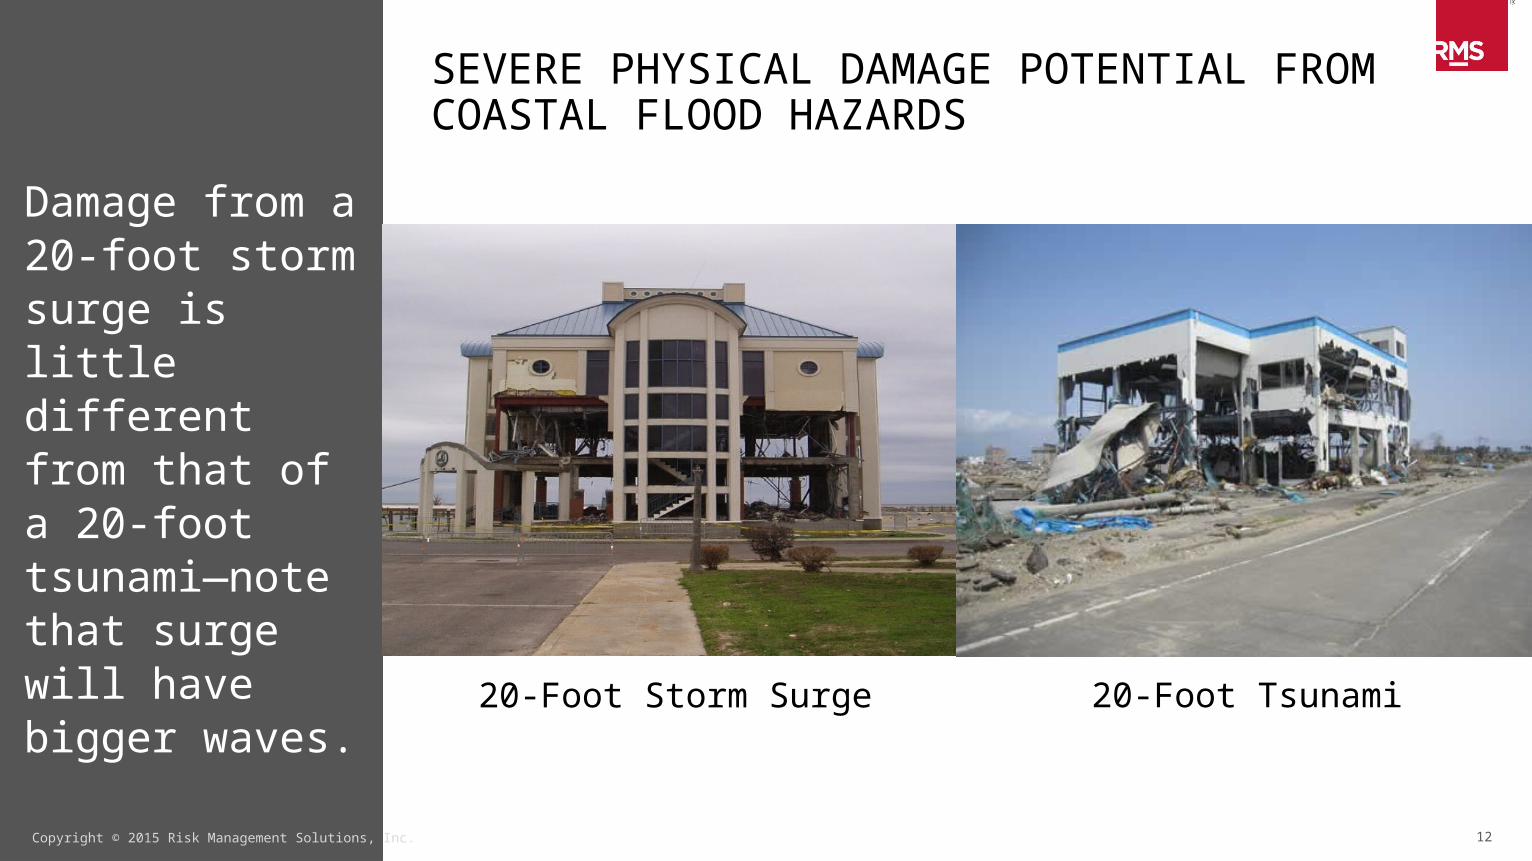
SEVERE PHYSICAL DAMAGE POTENTIAL FROM COASTAL FLOOD HAZARDS
Damage from a 20-foot storm surge is little different from that of a 20-foot tsunami—note that surge will have bigger waves.
20-Foot Storm Surge 20-Foot Tsunami
13Copyright © 2015 Risk Management Solutions, Inc.
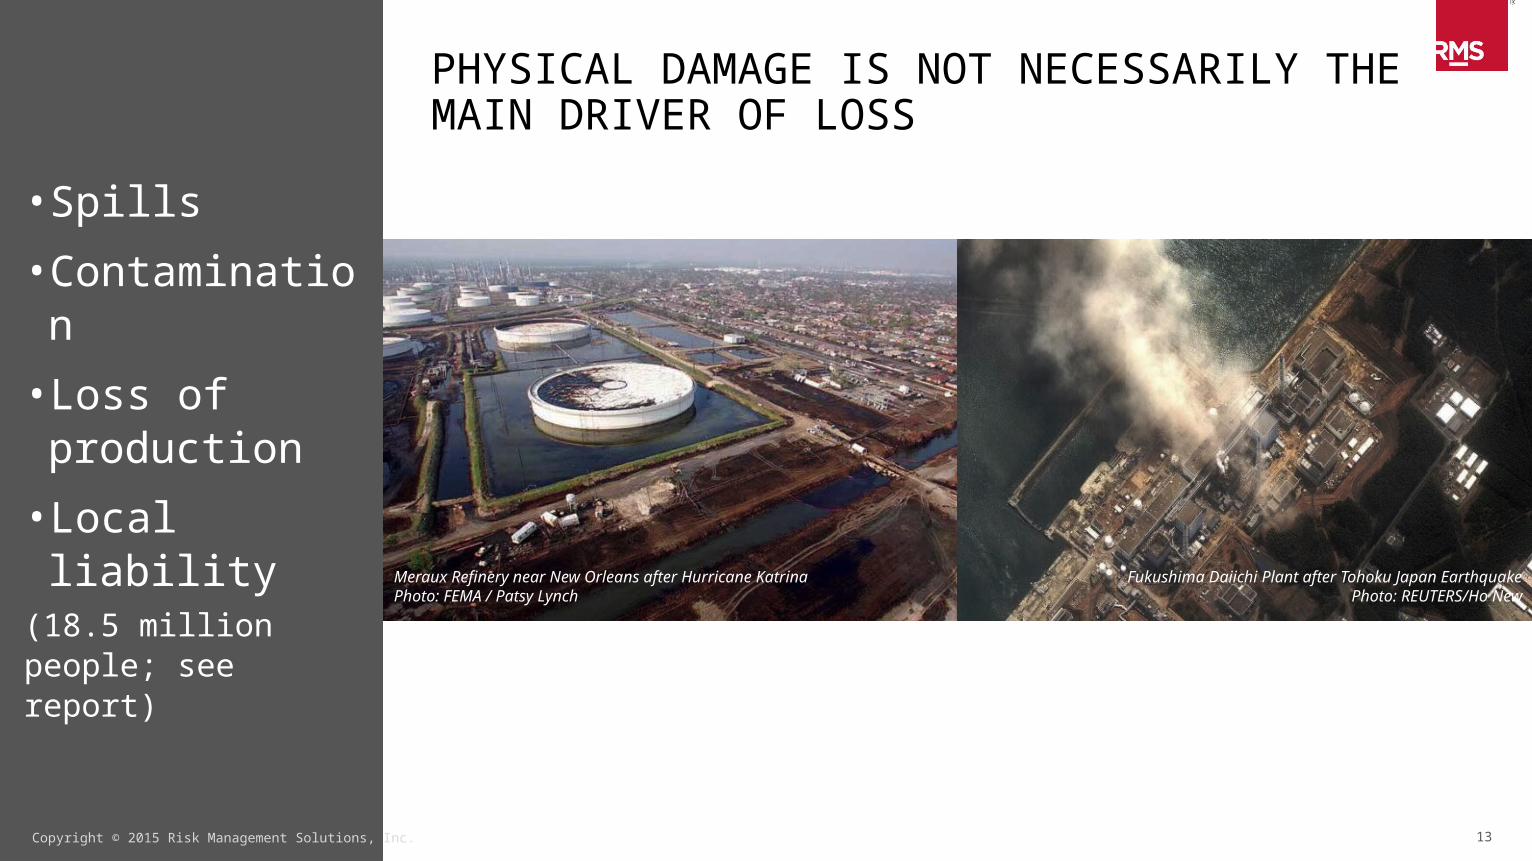
PHYSICAL DAMAGE IS NOT NECESSARILY THE MAIN DRIVER OF LOSS
• Spills
• Contamination
• Loss of production
• Local liability (18.5 million people; see report)
Meraux Refinery near New Orleans after Hurricane KatrinaPhoto: FEMA / Patsy Lynch
Fukushima Daiichi Plant after Tohoku Japan EarthquakePhoto: REUTERS/Ho New

14
YOUR FLIGHT HAS BEEN CANCELLED BY HIGH TIDE
Bangkok Sendai, 2011
Sandy, La Guardia Grand Bahama x 5 in 15 years

151515
COASTAL FLOOD HAZARDS ARE COMPLEX TO MODELWHAT DOES IT TAKE TOUNDERSTAND TSUNAMI?
16
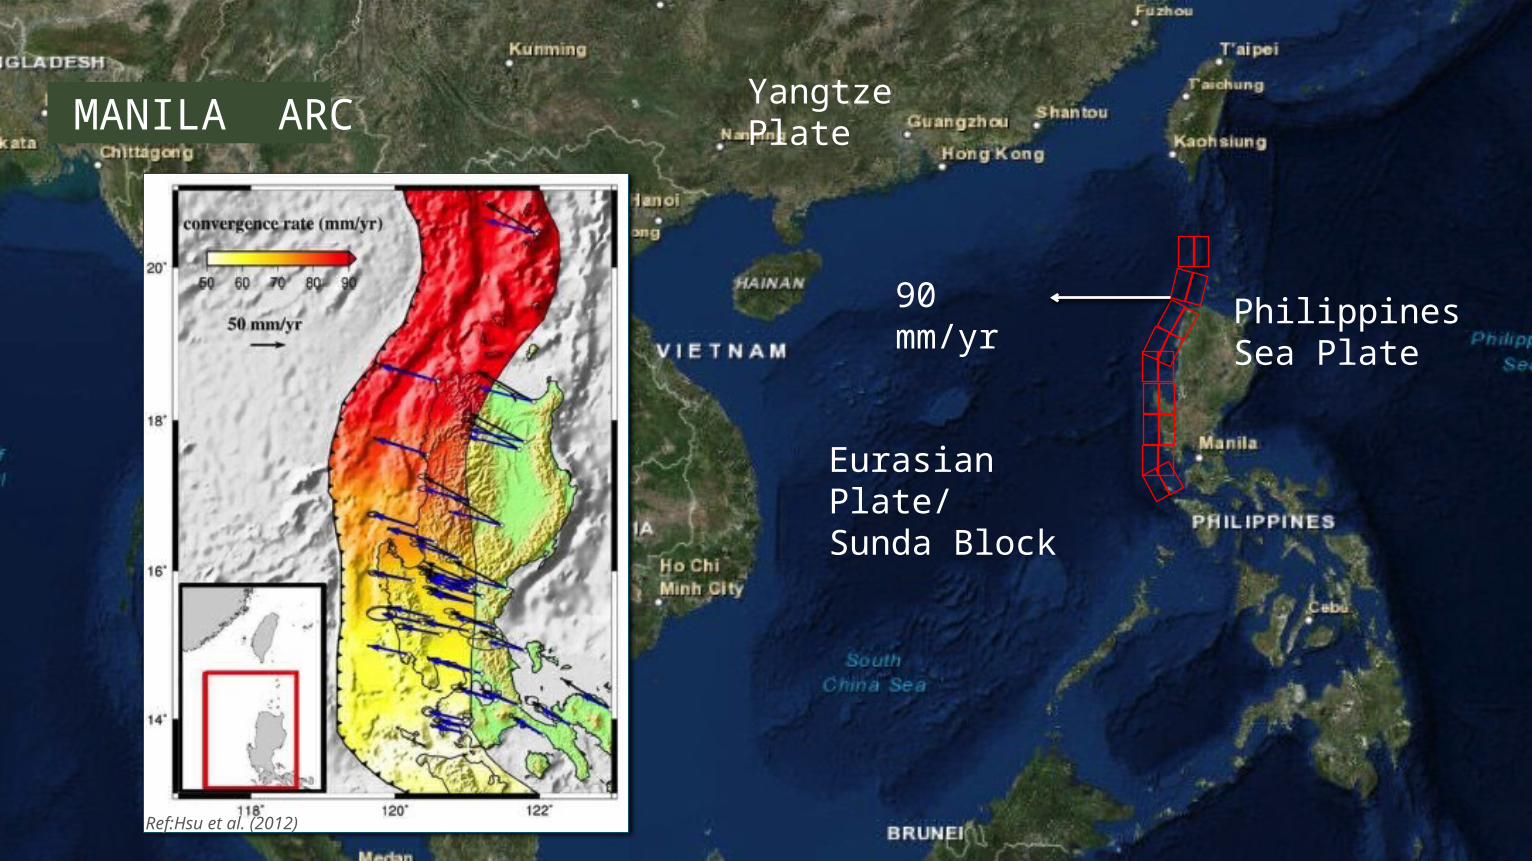
Philippines Sea Plate
Eurasian Plate/ Sunda Block
Yangtze Plate
90 mm/yr
MANILA ARC
Ref:Hsu et al. (2012)
17
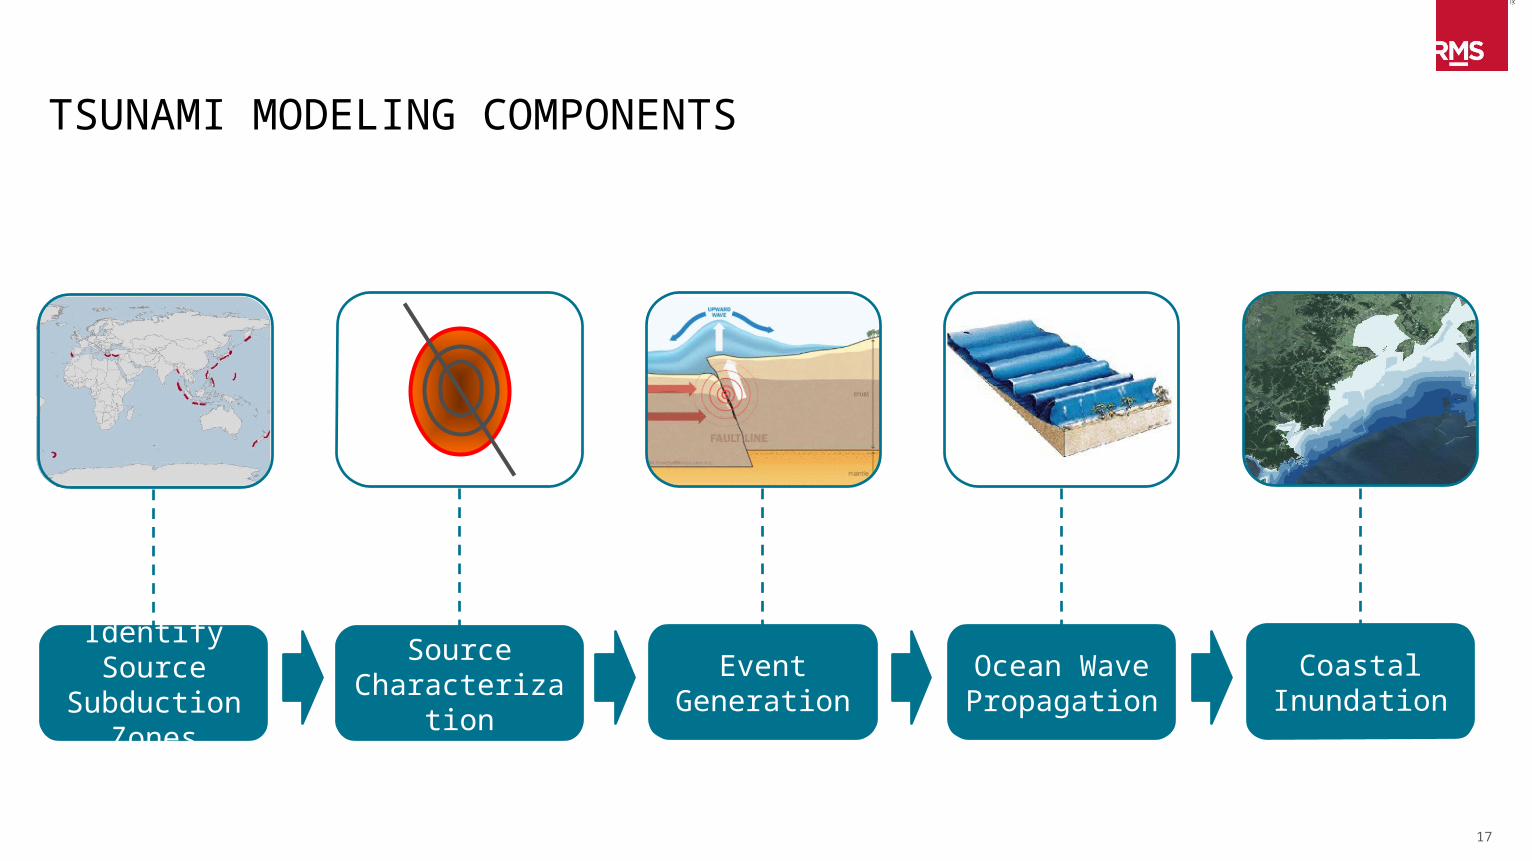
TSUNAMI MODELING COMPONENTS
Identify Source Subduction
Zones
Event Generation
Ocean Wave Propagation
Coastal Inundation
Source Characterization

18
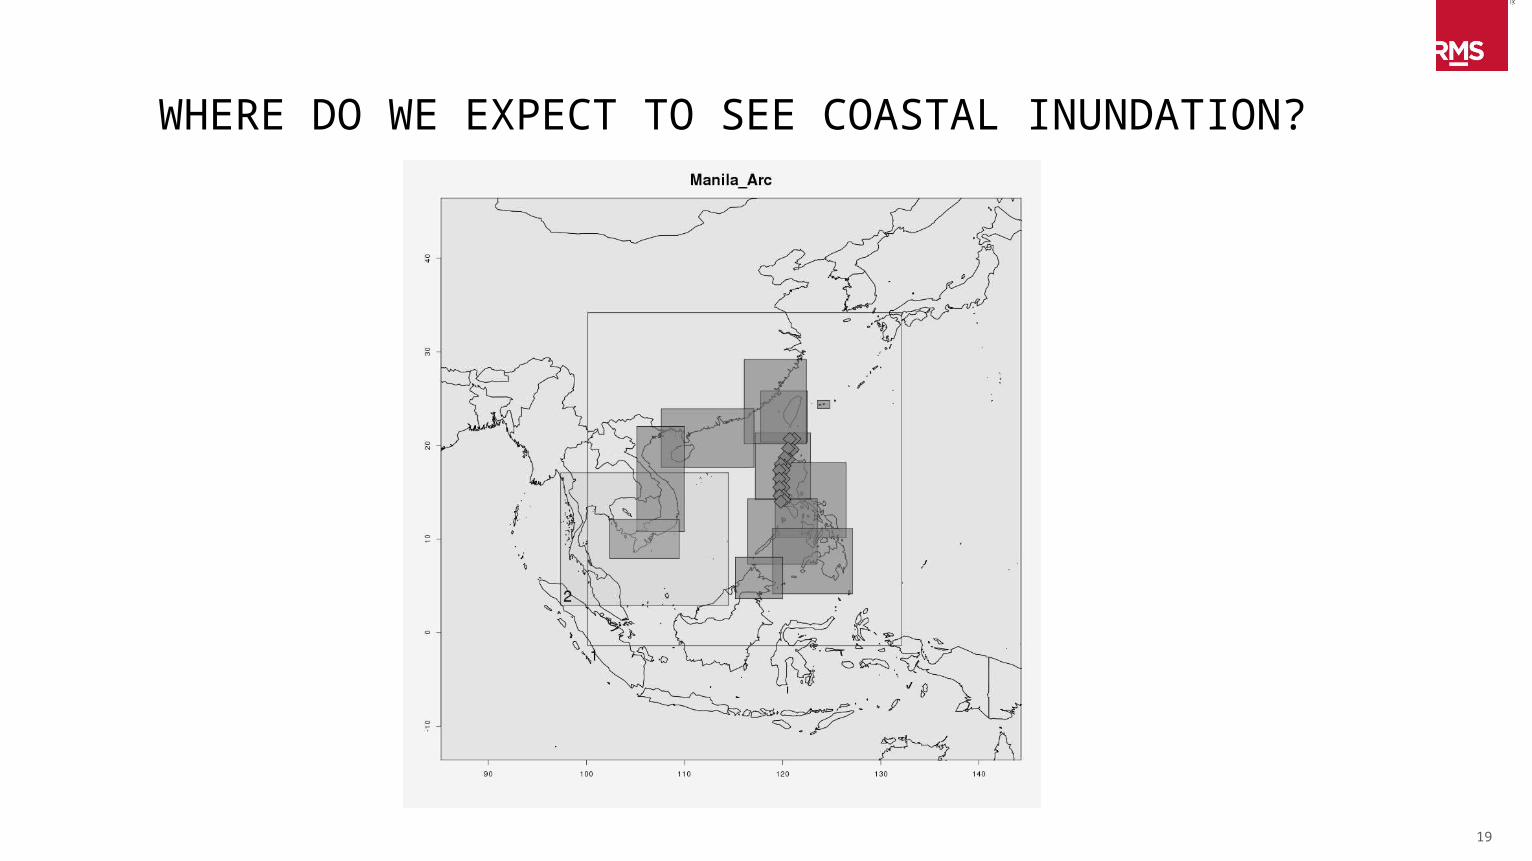
WHERE DO WE EXPECT TO SEE COASTAL INUNDATION?
Image: S. Astill et al (2013)
19
WHERE DO WE EXPECT TO SEE COASTAL INUNDATION?

20

21
Hong Kong
MW9 TSUNAMI FROM THE SOUTHERN LUZON ARC SUBDUCTION ZONE – SOUTHERN CHINA & HONG KONG
0.1 - 1.5 m
1.5 - 3.0 m
3.0 - 4.5 m
4.5 - 6.0 m
Industries
Tsunami height
Source: Esri, DigitalGlobe,DeoEye, I-cubed, Earthstar Geographic, CNES/Airbus DS, USDA, USGS, AEX, Getmapping, Aerogrid, IGN, OISP, swisstopo, and the GIS User Community
22
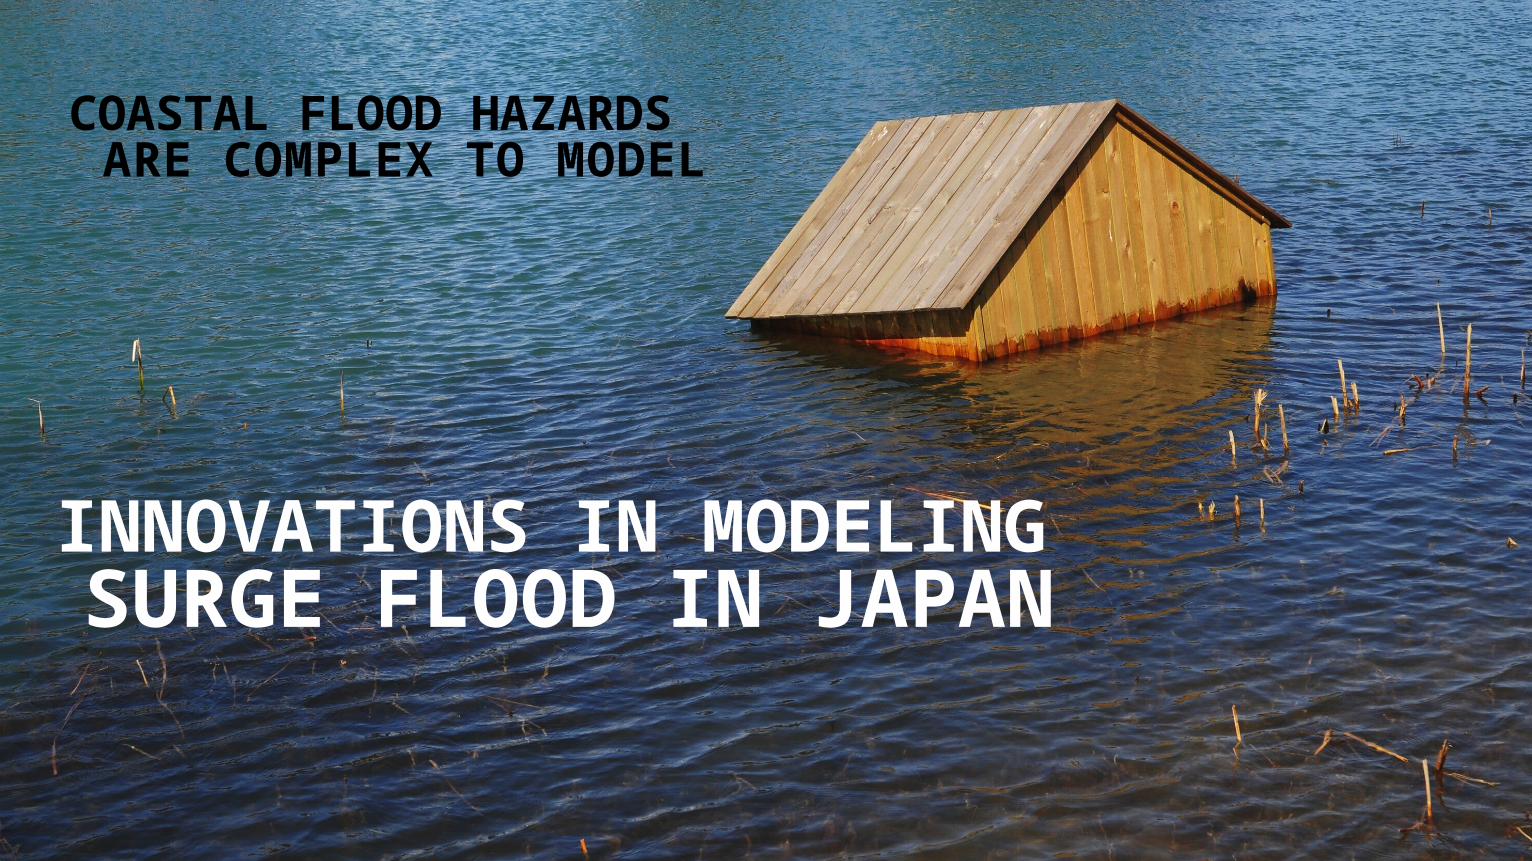
COASTAL FLOOD HAZARDS
INNOVATIONS IN MODELING
ARE COMPLEX TO MODEL
SURGE FLOOD IN JAPAN

23Copyright © 2015 Risk Management Solutions, Inc.
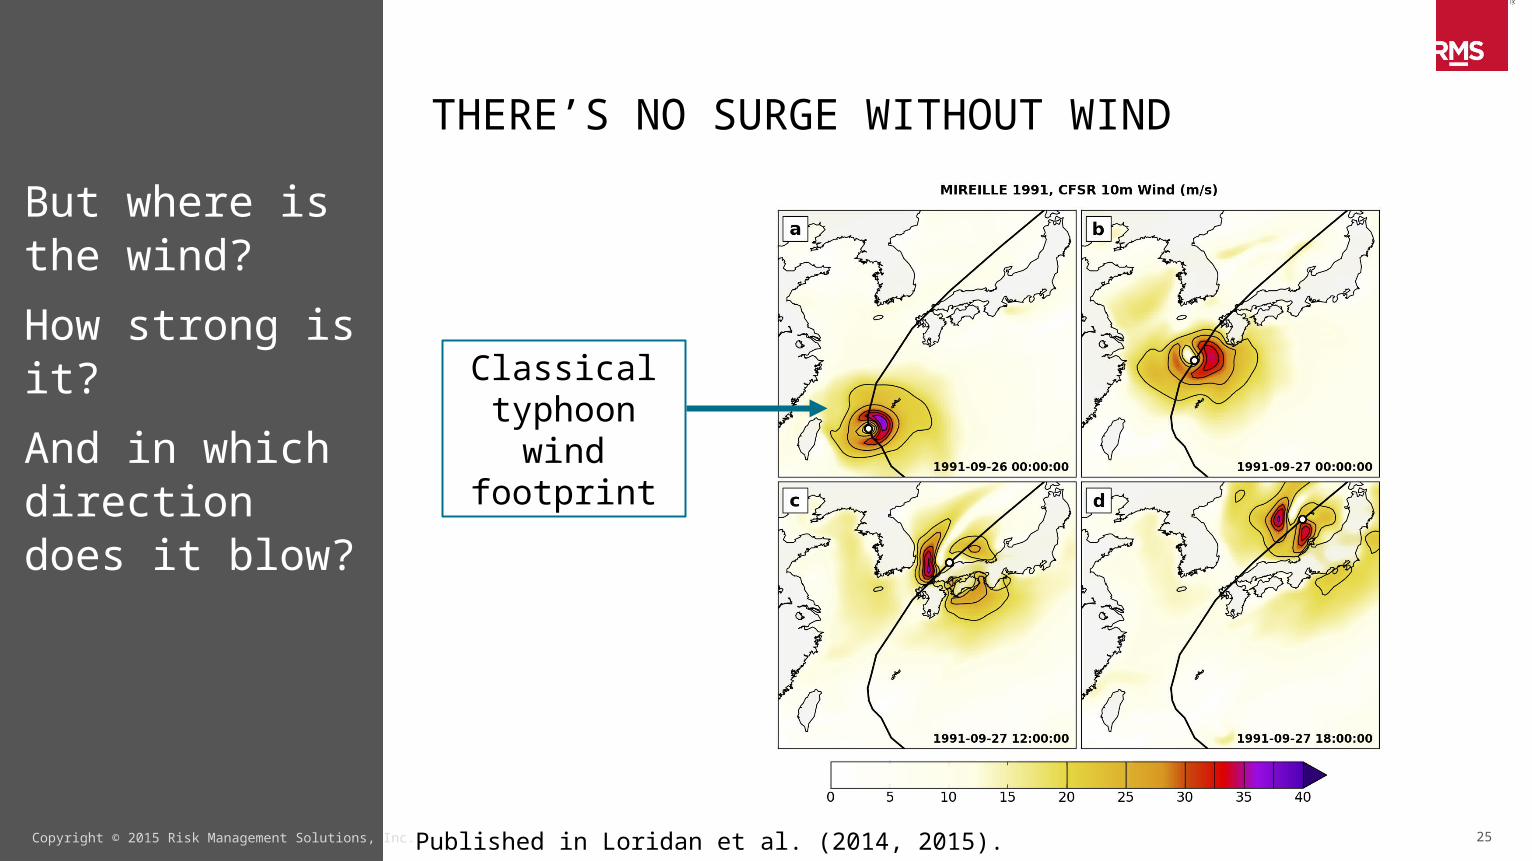
THERE’S NO SURGE WITHOUT WIND
Most of the typhoons hitting Japan have already started transitioning to extratropical storms.
Disregarding transitioning can lead to errors in maximum surge height of up to 1.5 m.

24Copyright © 2015 Risk Management Solutions, Inc.
THERE’S NO SURGE WITHOUT WIND
Most of the typhoons hitting Japan have already started transitioning to extratropical storms.
Disregarding transitioning can lead to errors in maximum surge height of up to 1.5 m.
Reliable wind modeling including extratropical transition is crucial.
25Copyright © 2015 Risk Management Solutions, Inc.
THERE’S NO SURGE WITHOUT WIND
But where is the wind?
How strong is it?
And in which direction does it blow?
Classical typhoon wind
footprint
Published in Loridan et al. (2014, 2015).
26Copyright © 2015 Risk Management Solutions, Inc.
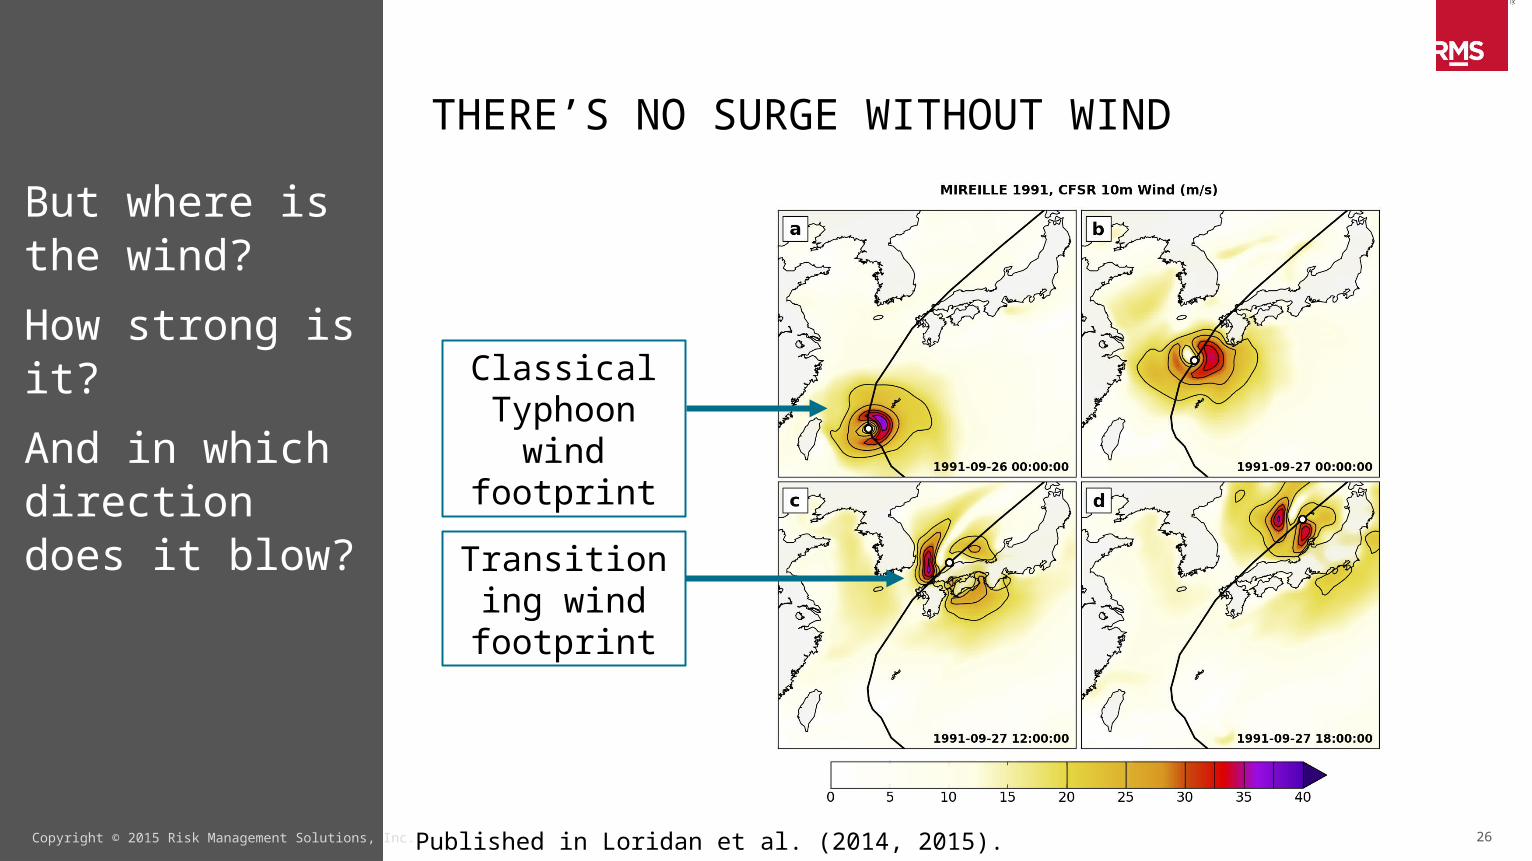
THERE’S NO SURGE WITHOUT WIND
But where is the wind?
How strong is it?
And in which direction does it blow?
Classical Typhoon wind
footprint
Transitioning wind footprint
Published in Loridan et al. (2014, 2015).
27Copyright © 2015 Risk Management Solutions, Inc.
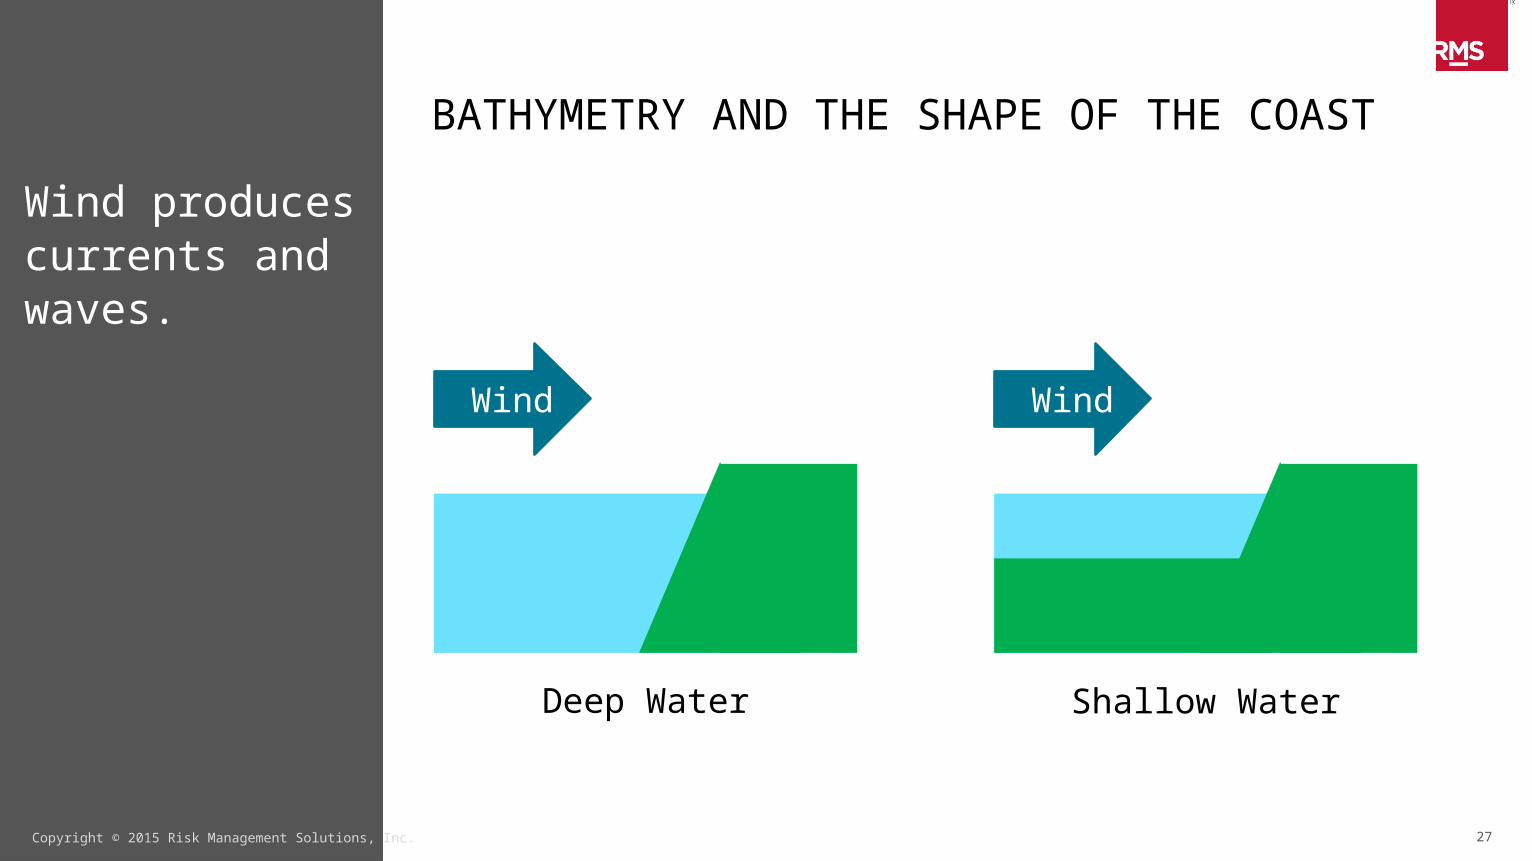
BATHYMETRY AND THE SHAPE OF THE COAST
Wind produces currents and waves.
Deep Water Shallow Water
WindWind

28Copyright © 2015 Risk Management Solutions, Inc.
BATHYMETRY AND THE SHAPE OF THE COAST
Wind produces currents and waves.
The coast produces the surge.
Deep Water Shallow Water
Low Surge
WindWind

29Copyright © 2015 Risk Management Solutions, Inc.
BATHYMETRY AND THE SHAPE OF THE COAST
Wind produces currents and waves.
The coast produces the surge.
Deep Water Shallow Water
Low Surge High Surge
WindWind

30Copyright © 2015 Risk Management Solutions, Inc.
BATHYMETRY AND THE SHAPE OF THE COAST
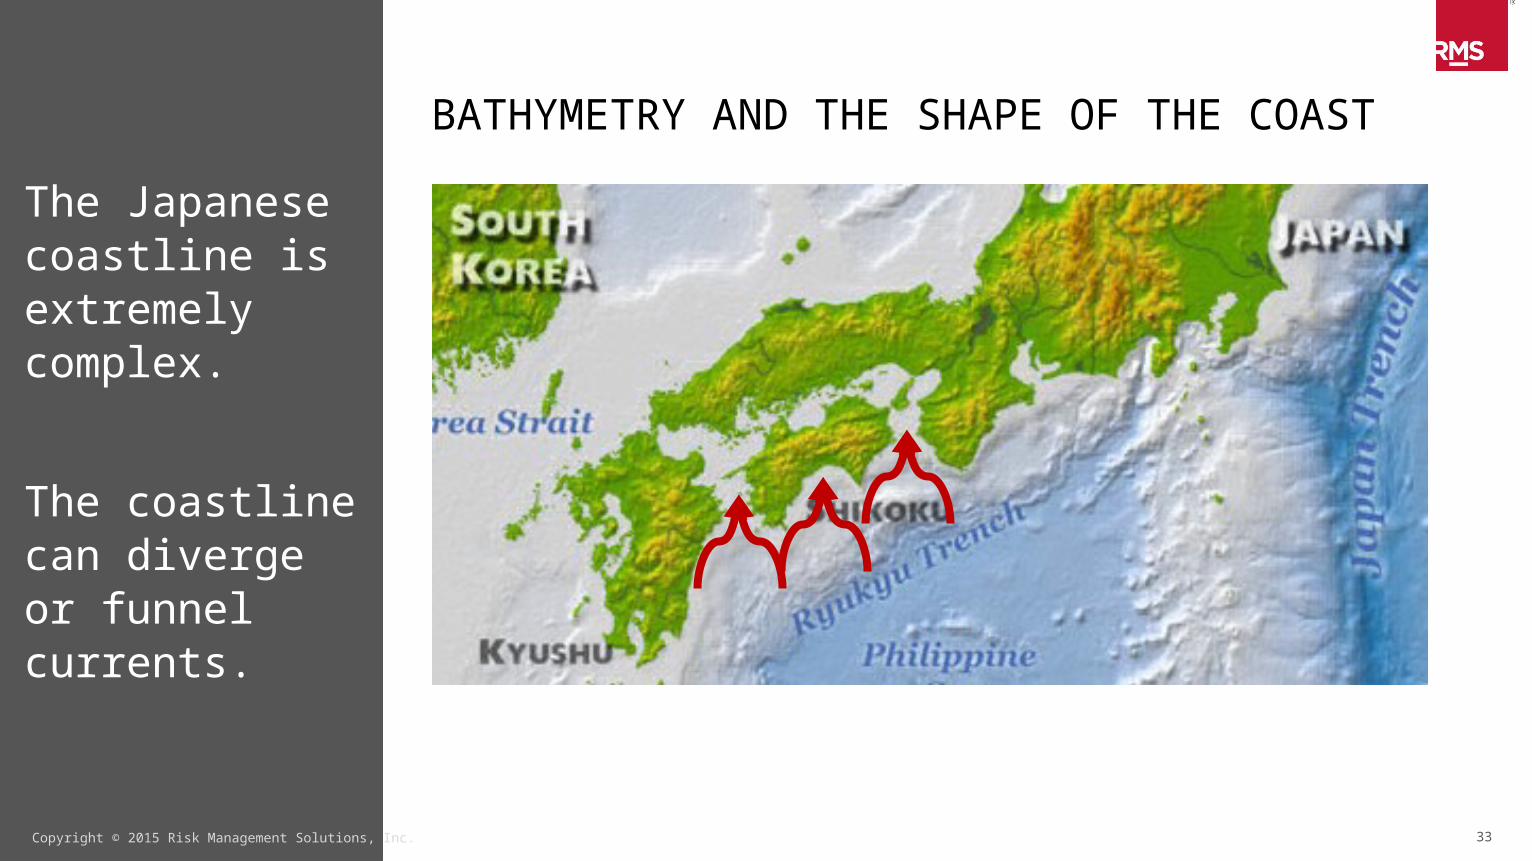
The Japanese coastline is extremely complex.
The coastline can diverge or funnel currents.

31Copyright © 2015 Risk Management Solutions, Inc.
BATHYMETRY AND THE SHAPE OF THE COAST
The Japanese coastline is extremely complex.
The coastline can diverge or funnel currents.

32Copyright © 2015 Risk Management Solutions, Inc.
BATHYMETRY AND THE SHAPE OF THE COAST
The Japanese coastline is extremely complex.
The coastline can diverge or funnel currents.
33Copyright © 2015 Risk Management Solutions, Inc.
BATHYMETRY AND THE SHAPE OF THE COAST
The Japanese coastline is extremely complex.
The coastline can diverge or funnel currents.

34Copyright © 2015 Risk Management Solutions, Inc.
BATHYMETRY AND THE SHAPE OF THE COAST
The Japanese coastline is extremely complex.
The coastline can diverge or funnel currents.

35Copyright © 2015 Risk Management Solutions, Inc.
BATHYMETRY AND THE SHAPE OF THE COAST
The Japanese coastline is extremely complex.
The coastline can diverge or funnel currents.
36Copyright © 2015 Risk Management Solutions, Inc.
BATHYMETRY AND THE SHAPE OF THE COAST
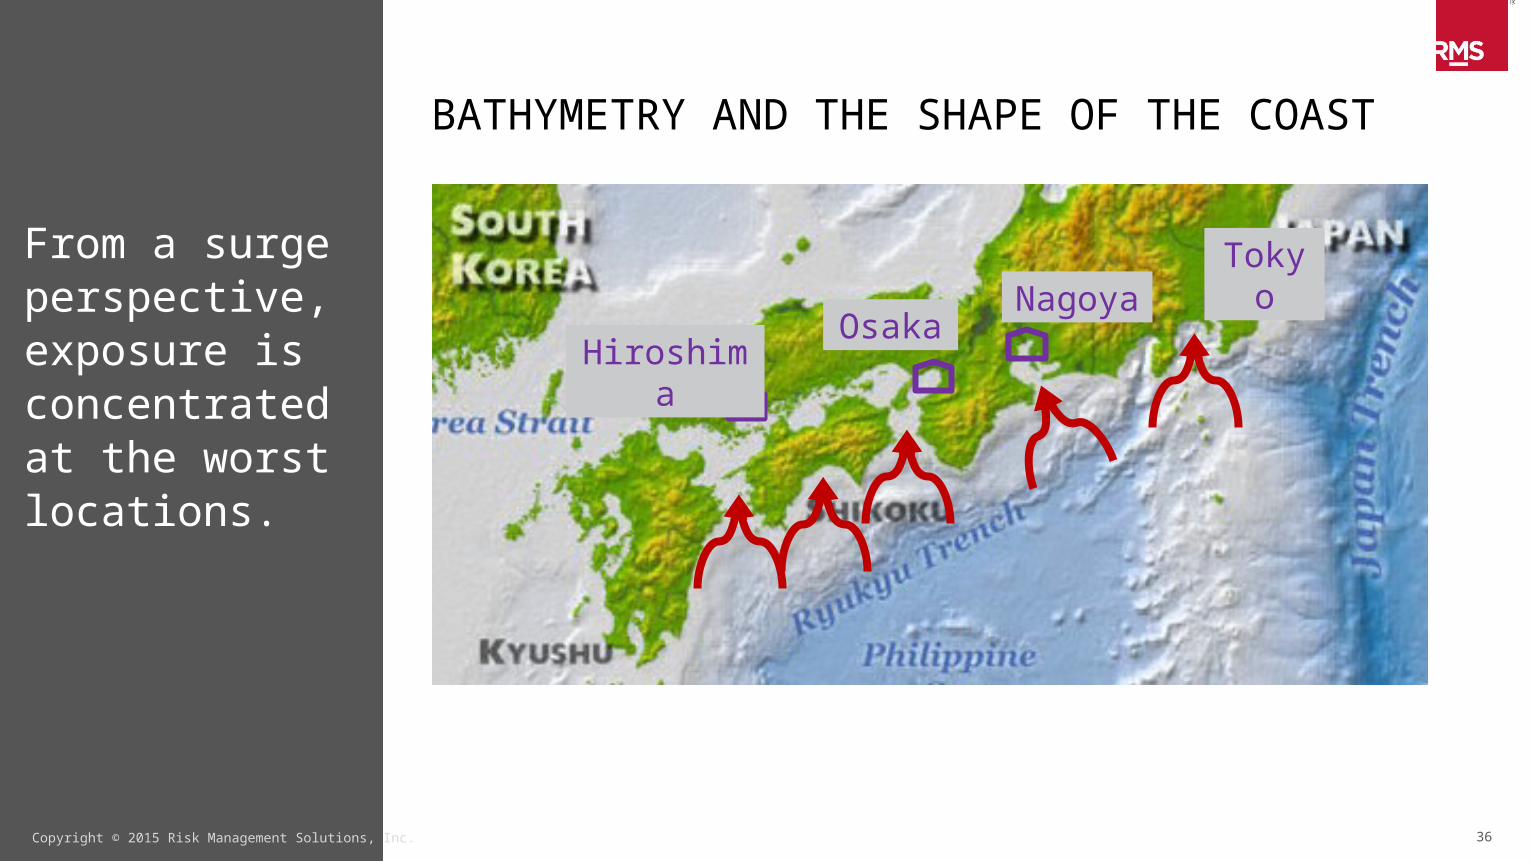
From a surge perspective, exposure is concentrated at the worst locations.
HiroshimaOsaka
NagoyaTokyo

37Copyright © 2015 Risk Management Solutions, Inc.
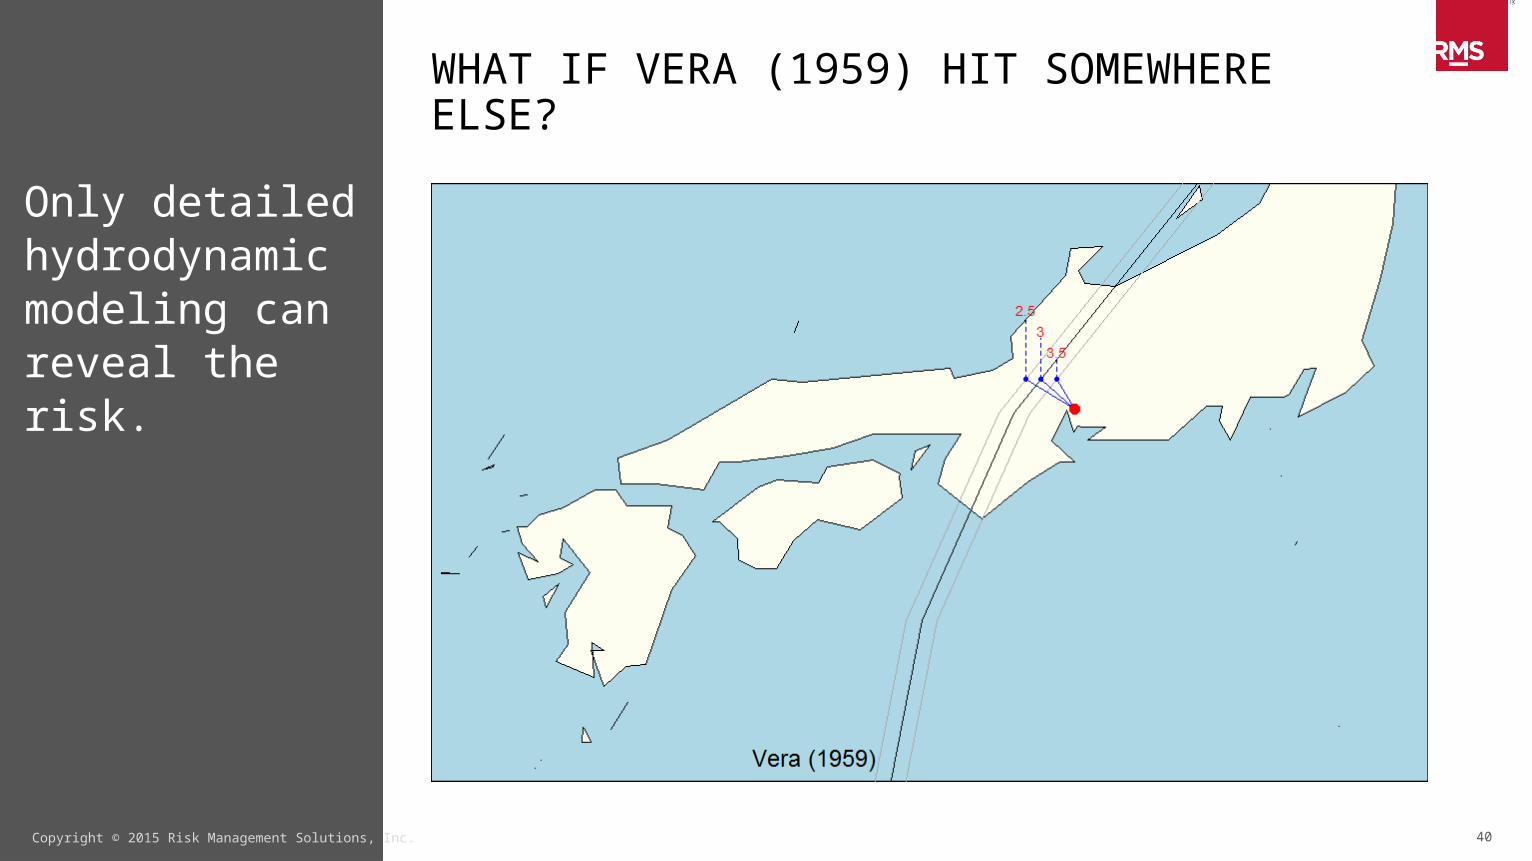
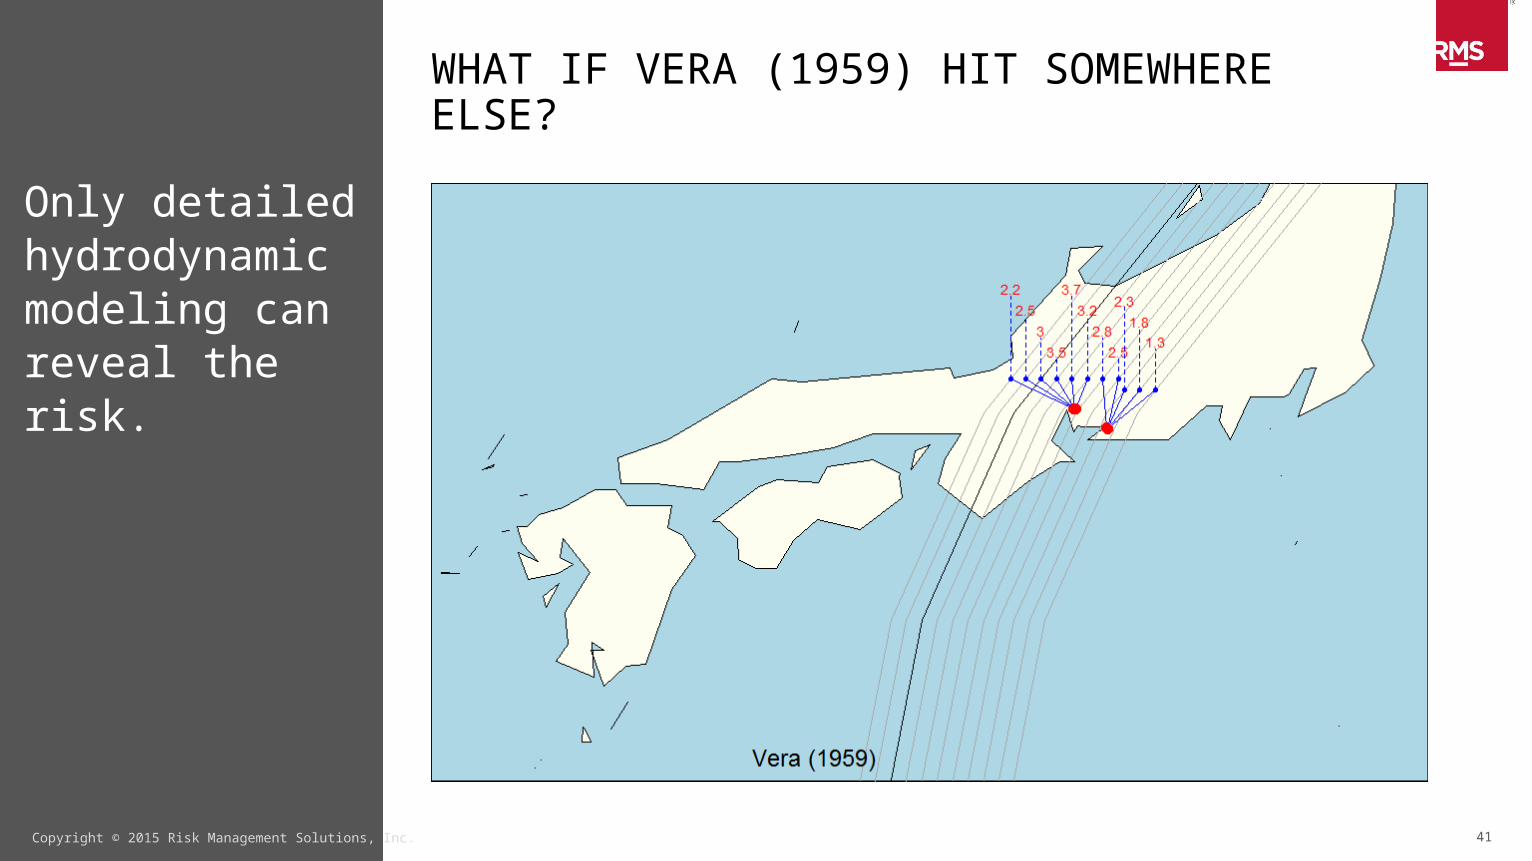
WHAT IF VERA (1959) HIT SOMEWHERE ELSE?
Only detailed hydrodynamic modeling can reveal the risk.

38Copyright © 2015 Risk Management Solutions, Inc.
WHAT IF VERA (1959) HIT SOMEWHERE ELSE?
Only detailed hydrodynamic modeling can reveal the risk.

39Copyright © 2015 Risk Management Solutions, Inc.
WHAT IF VERA (1959) HIT SOMEWHERE ELSE?
Only detailed hydrodynamic modeling can reveal the risk.
40Copyright © 2015 Risk Management Solutions, Inc.
WHAT IF VERA (1959) HIT SOMEWHERE ELSE?
Only detailed hydrodynamic modeling can reveal the risk.
41Copyright © 2015 Risk Management Solutions, Inc.
WHAT IF VERA (1959) HIT SOMEWHERE ELSE?
Only detailed hydrodynamic modeling can reveal the risk.
42Copyright © 2015 Risk Management Solutions, Inc.
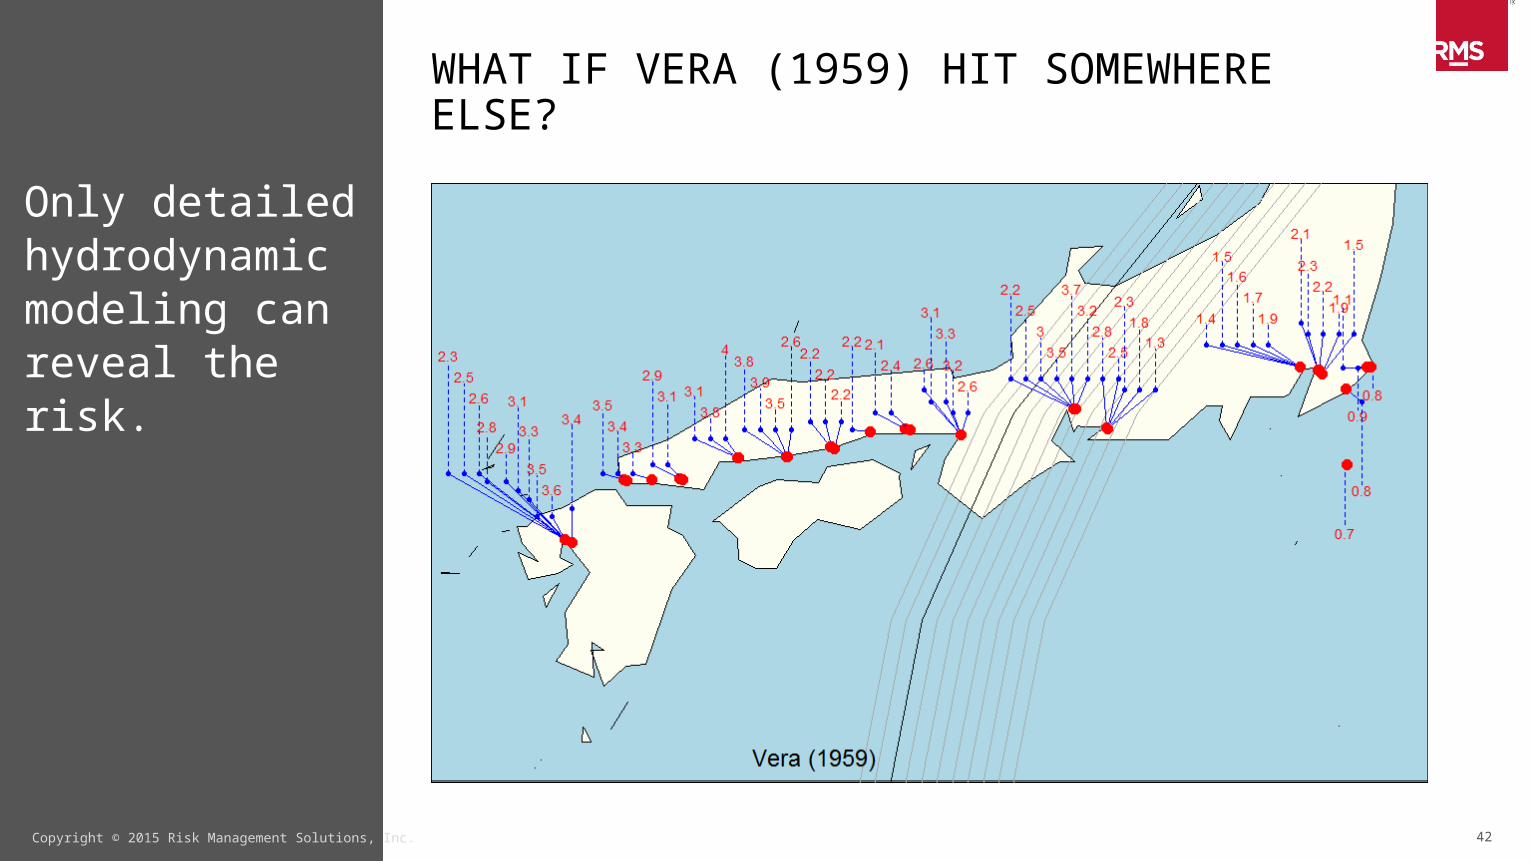
WHAT IF VERA (1959) HIT SOMEWHERE ELSE?
Only detailed hydrodynamic modeling can reveal the risk.

43Copyright © 2015 Risk Management Solutions, Inc.
WHAT IF VERA (1959) HIT SOMEWHERE ELSE?
Only detailed hydrodynamic modeling can reveal the risk.
Tokyo

44Copyright © 2015 Risk Management Solutions, Inc.
WHAT IF VERA (1959) HIT SOMEWHERE ELSE?
Only detailed hydrodynamic modeling can reveal the risk.
HiroshimaTokyo
45Copyright © 2015 Risk Management Solutions, Inc.
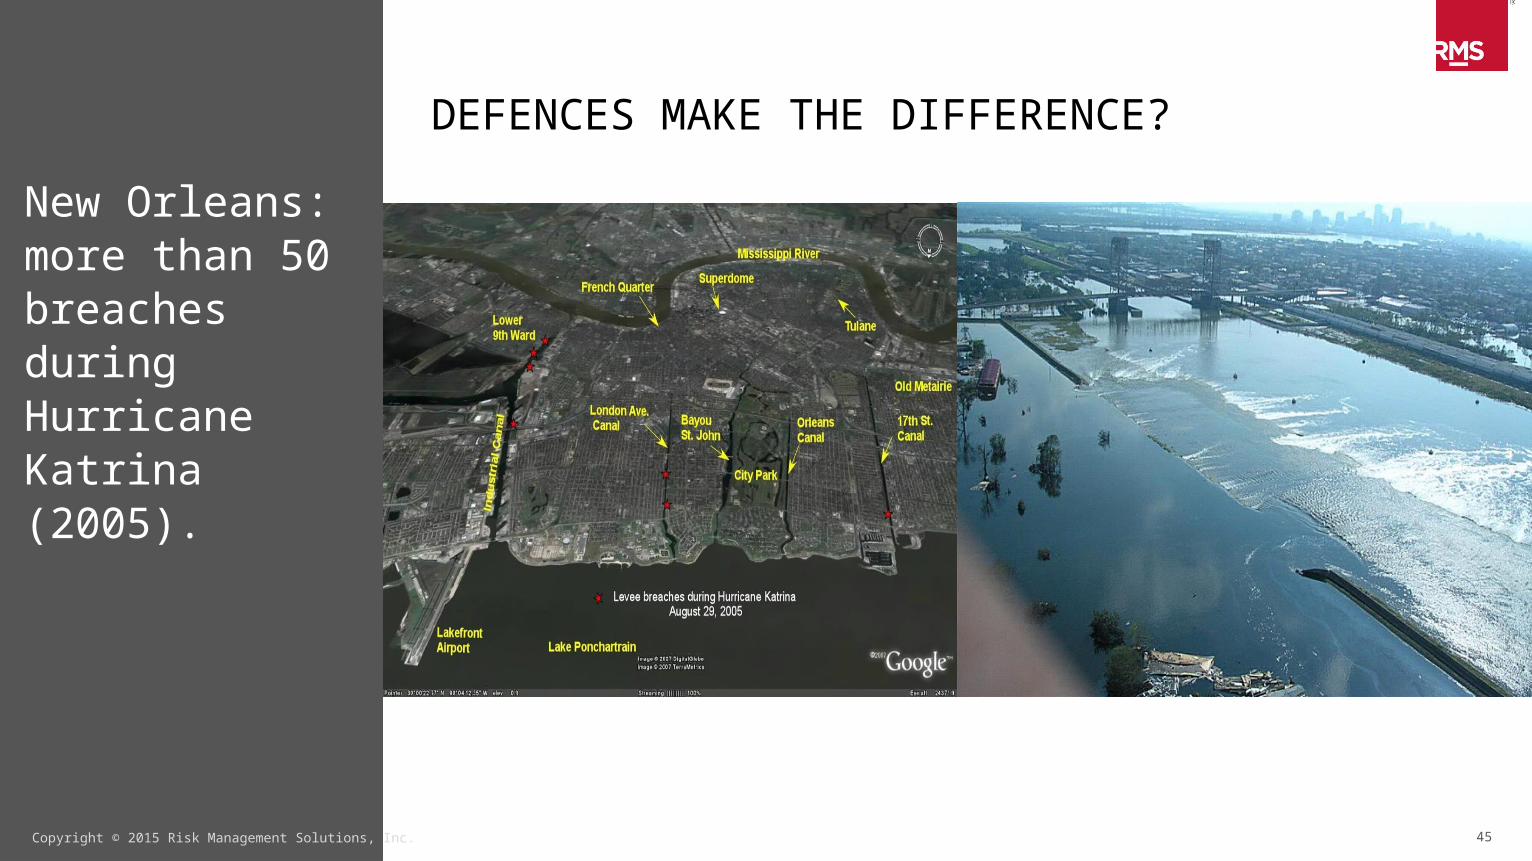
DEFENCES MAKE THE DIFFERENCE?
New Orleans: more than 50 breaches during Hurricane Katrina (2005).

46Copyright © 2015 Risk Management Solutions, Inc.
DEFENCES MAKE THE DIFFERENCE?
• Japan is very well defended.
• More than 97% of typhoons hitting Japan do not cause coastal inundation.
• This can lead to a wrong feeling of safety.
• The probability of a 1000-year surge event happening within the next 50 years is about 5%.
WE HAVE TO LIVE WITH THIS RISK
47Copyright © 2015 Risk Management Solutions, Inc.
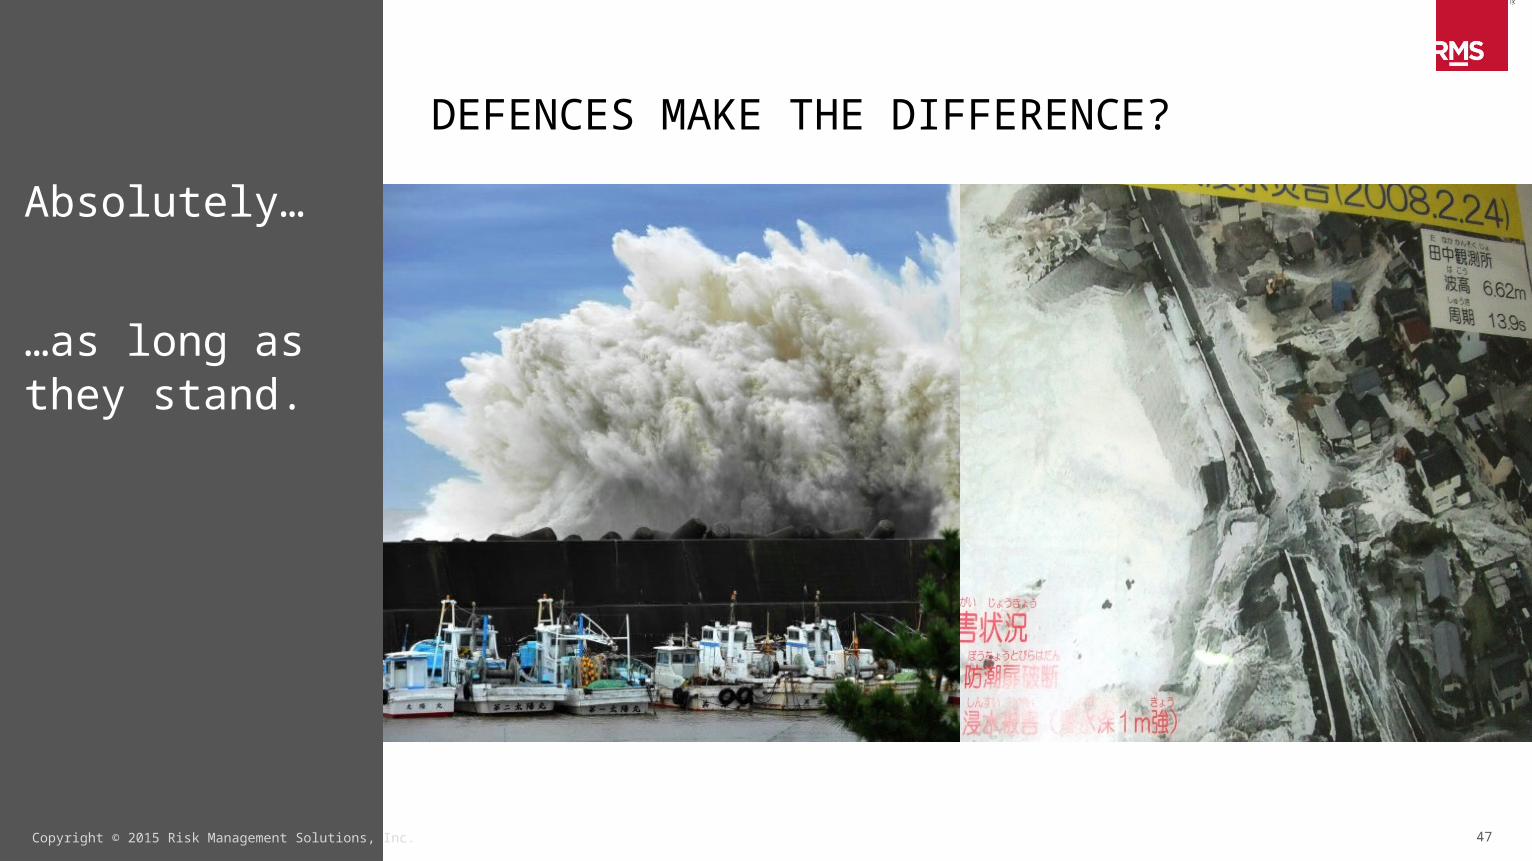
DEFENCES MAKE THE DIFFERENCE?
Absolutely…
…as long as they stand.

48Copyright © 2015 Risk Management Solutions, Inc. All Rights Reserved. April 15, 2023
WAVES
Wave modeling is far more complicated than surge modeling
Waves interact with each other in complex ways
+ =

49Copyright © 2015 Risk Management Solutions, Inc.
SURGE, TIDES, AND WAVES INTERACT
50Copyright © 2015 Risk Management Solutions, Inc.
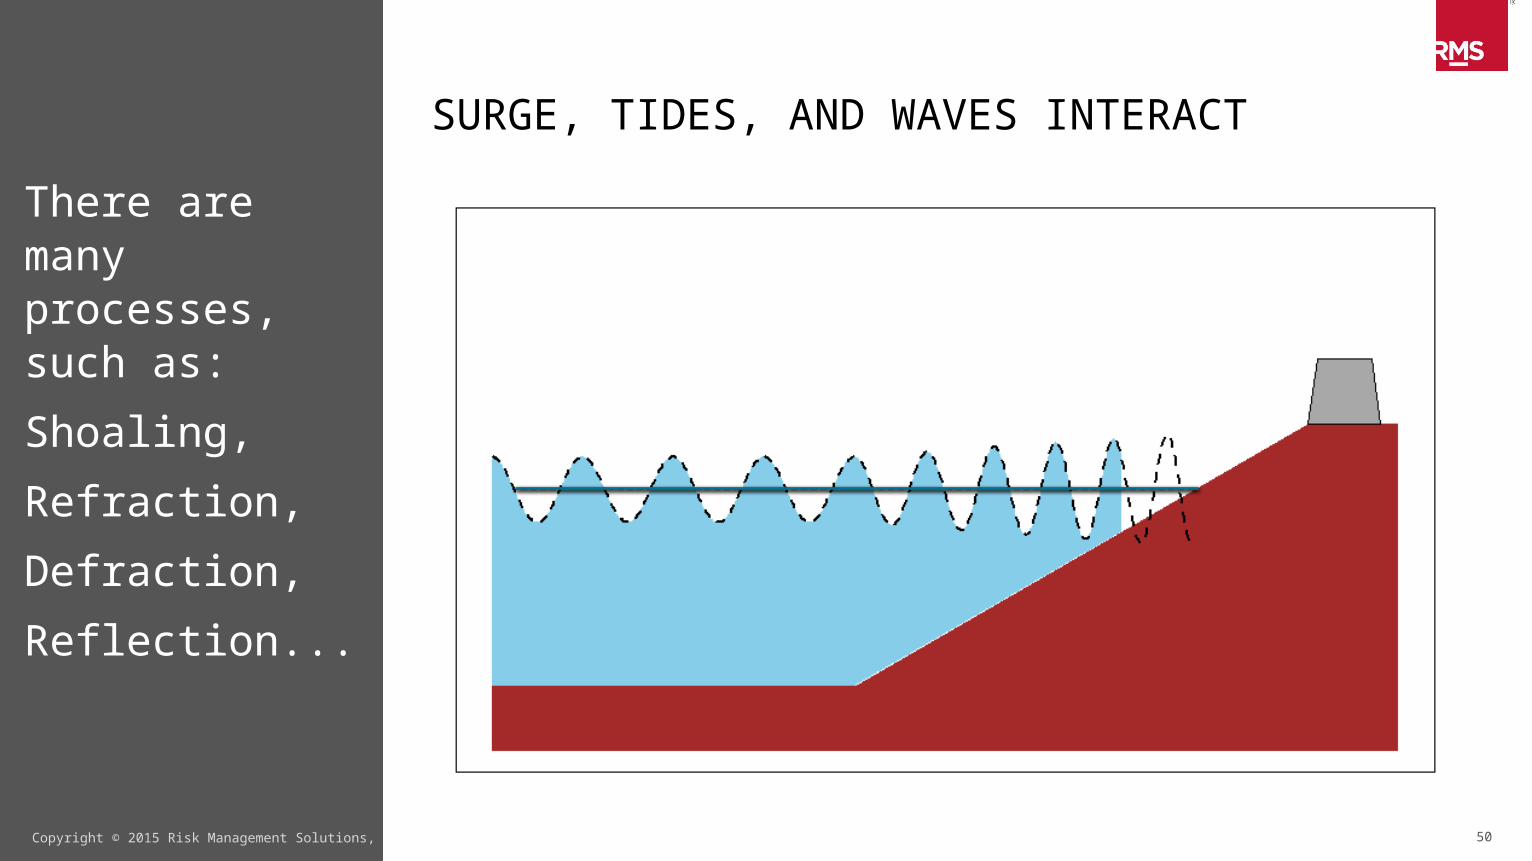
SURGE, TIDES, AND WAVES INTERACT
There are many processes, such as:
Shoaling,
Refraction,
Defraction,
Reflection...

51Copyright © 2015 Risk Management Solutions, Inc.
SURGE, TIDES, AND WAVES INTERACT
During surge events, higher waves hit the defences.

52
DEFENCES MAKE THE DIFFERENCE?Yokohama: breaching increases the losses in this case from 40 million to 17 billion Yen.

53
DEFENCES MAKE THE DIFFERENCE?Yokohama, breaching increases the losses in this case from 40 million to 17 billion Yen.
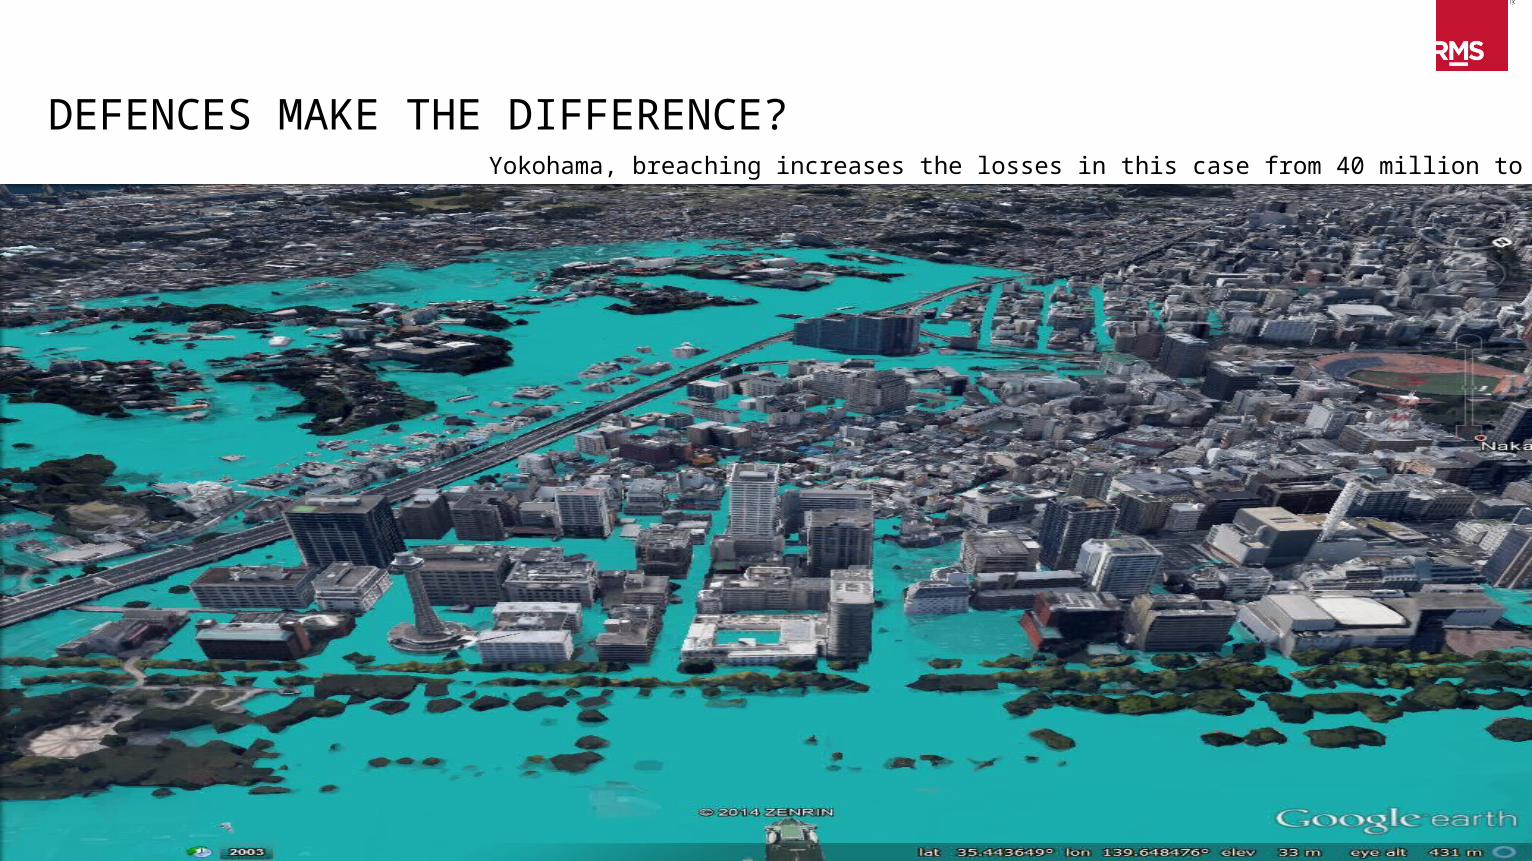
54
DEFENCES MAKE THE DIFFERENCE?Yokohama, breaching increases the losses in this case from 40 million to 17 billion Yen.

55Copyright © 2015 Risk Management Solutions, Inc.
THE IMPLICATIONS OF ‘COASTAL RISK’
• The biggest concentrations of risk and gradients of risk are coastal
• Coastal risks vary dramatically with elevation
• Always need location/address level data
• Need ‘state of the art’ modeling of the hazards – storm surge and tsunami & the defences
Under- accelerating sea-level rise defences will not keep pace with the risk until after the disaster.
56
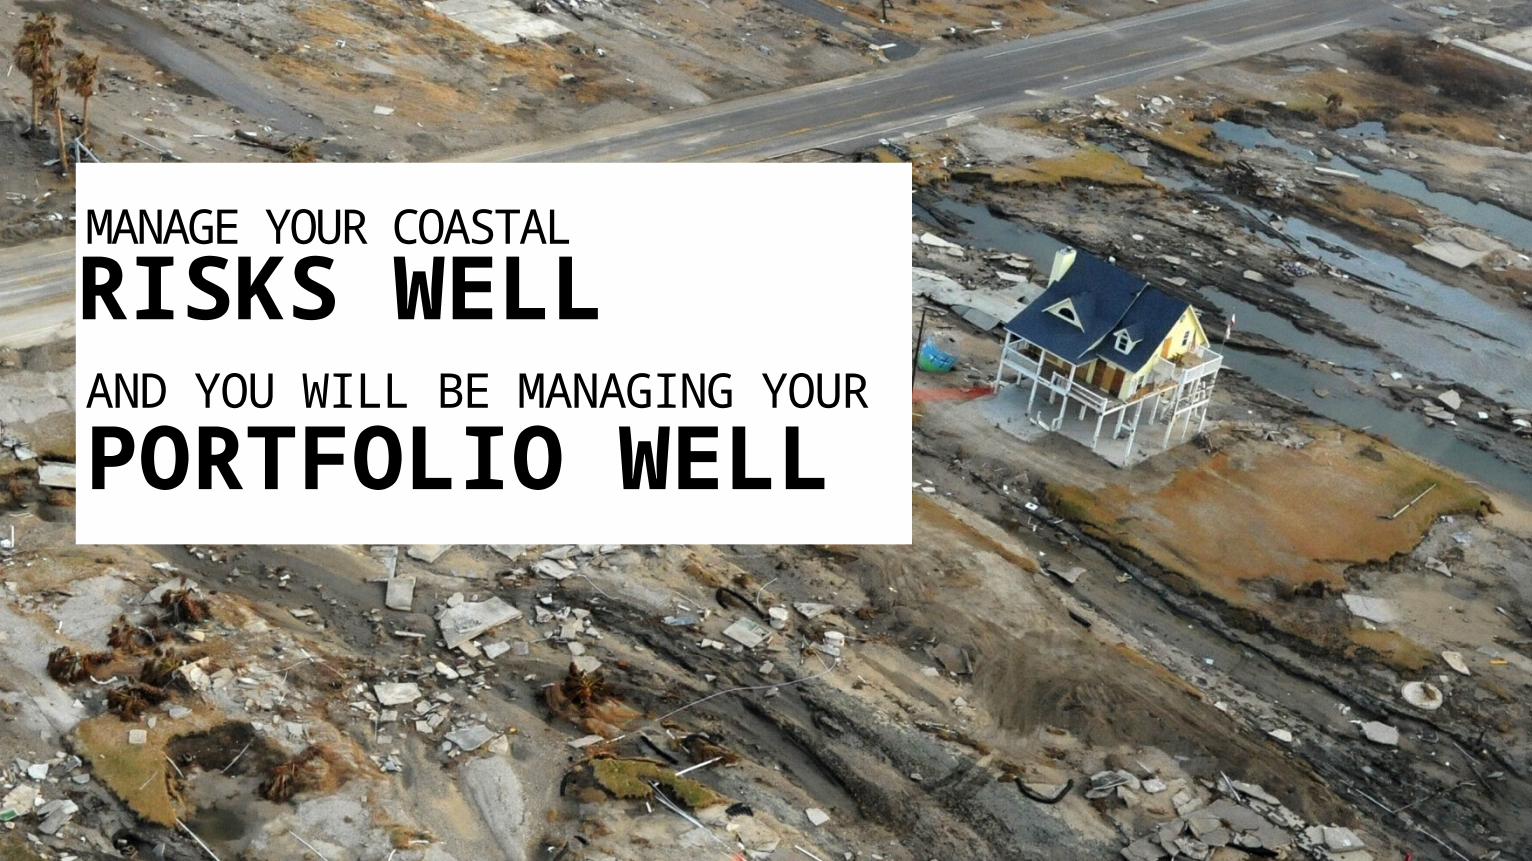
RISKS WELL
PORTFOLIO WELLAND YOU WILL BE MANAGING YOUR
MANAGE YOUR COASTAL

©2015 Risk Management Solutions, Inc. RMS and the RMS logo are registered trademarks of Risk Management Solutions, Inc. All other trademarks are property of their respective owners.