risk perception of climate change: empirical evidence for
TRANSCRIPT

RUHRECONOMIC PAPERS
Risk Perception of Climate Change: Empirical Evidence for Germany
#676
Manuel Frondel
Michael Simora
Stephan Sommer
Imprint
Ruhr Economic Papers
Published by
Ruhr-Universität Bochum (RUB), Department of Economics Universitätsstr. 150, 44801 Bochum, Germany
Technische Universität Dortmund, Department of Economic and Social Sciences Vogelpothsweg 87, 44227 Dortmund, Germany
Universität Duisburg-Essen, Department of Economics Universitätsstr. 12, 45117 Essen, Germany
RWI Leibniz-Institut für Wirtschaftsforschung Hohenzollernstr. 1-3, 45128 Essen, Germany
Editors
Prof. Dr. Thomas K. Bauer RUB, Department of Economics, Empirical Economics Phone: +49 (0) 234/3 22 83 41, e-mail: [email protected]
Prof. Dr. Wolfgang Leininger Technische Universität Dortmund, Department of Economic and Social Sciences Economics – Microeconomics Phone: +49 (0) 231/7 55-3297, e-mail: [email protected]
Prof. Dr. Volker Clausen University of Duisburg-Essen, Department of Economics International Economics Phone: +49 (0) 201/1 83-3655, e-mail: [email protected]
Prof. Dr. Roland Döhrn, Prof. Dr. Manuel Frondel, Prof. Dr. Jochen Kluve RWI, Phone: +49 (0) 201/81 49-213, e-mail: [email protected]
Editorial Office
Sabine Weiler RWI, Phone: +49 (0) 201/81 49-213, e-mail: [email protected]
Ruhr Economic Papers #676
Responsible Editor: Manuel Frondel
All rights reserved. Bochum, Dortmund, Duisburg, Essen, Germany, 2017
ISSN 1864-4872 (online) – ISBN 978-3-86788-784-7The working papers published in the Series constitute work in progress circulated to stimulate discussion and critical comments. Views expressed represent exclusively the authors’ own opinions and do not necessarily reflect those of the editors.
Ruhr Economic Papers #676
Manuel Frondel, Michael Simora, and Stephan Sommer
Risk Perception of Climate Change: Empirical Evidence for Germany

Bibliografische Informationen der Deutschen Nationalbibliothek
Die Deutsche Bibliothek verzeichnet diese Publikation in der deutschen National-bibliografie; detaillierte bibliografische Daten sind im Internet über: http://dnb.d-nb.de abrufbar.
Das RWI wird vom Bund und vom Land Nordrhein-Westfalen gefördert.
http://dx.doi.org/10.4419/86788784ISSN 1864-4872 (online)ISBN 978-3-86788-784-7
Manuel Frondel, Michael Simora, and Stephan Sommer1
Risk Perception of Climate Change: Empirical Evidence for Germany
AbstractThe perception of risks associated with climate change appears to be a key factor for the support of climate policy measures. Using a generalized ordered logit approach and drawing on a unique data set originating from two surveys conducted in 2012 and 2014, each among more than 6,000 German households, we analyze the determinants of individual risk perception associated with three kinds of natural hazards: heat waves, storms, and floods. Our focus is on the role of objective risk measures and experience with these natural hazards, whose frequency is likely to be affected by climate change. In line with the received literature, the results suggest that personal experience with adverse events and personal damage therefrom are strong drivers of individual risk perception.
JEL Classification: D81, H31, Q54
Keywords: Damage experience; natural hazards; generalized ordered logit
February 2017
1 Manuel Frondel, RWI and RUB; Michael Simora, RWI and RGS Econ; Stephan Sommer, RWI. – We gratefully acknowledge financial support by the German Federal Ministry of Education and Research (BMBF) within the framework program “Economics of Climate Change” under grant 01LA1113A. This work has also been supported by the Collaborative Research Center “Statistical Modeling of Nonlinear Dynamic Processes” (SFB 823) of the German Research Foundation (DFG), within Project A3, “Dynamic Technology Modeling”. We are very much indebted to Rüdiger Budde and Matthias Kaeding, Research Data Center Ruhr (FDZ Ruhr), for excellent research assistance and Colin Vance, as well as two anonymous reviewers, for helpful comments and suggestions. – All correspondence to: Manuel Frondel, RWI, Hohenzollernstr. 1-3, 45128 Essen, Germany, e-mail: [email protected]

1 Introduction
Among the major threats of climate change is a substantial increase in the occur-
rence of natural hazards, including heat waves, storms, and floods. In its most re-
cent report, the International Panel on Climate Change (Pachauri et al., 2014) predicts
that in the northern hemisphere, heat waves will emerge more frequently and last
longer than in previous decades. Moreover, heavy precipitation, as well as storms, are
likely to occur more frequently and with a higher intensity, resulting in more floodings.
Increasing the efforts to both mitigate climate change and adapt to its consequences
therefore seems to be indispensable.
A key driver of adaptation and prevention at the household level – be this the pur-
chase of insurance, investment in home insulation, or some other measure – is the
perception of risks due to climate change (O’Connor et al., 1999; Peacock et al., 2005;
Siegrist and Gutscher, 2006; Zaalberg et al., 2009). These risk perceptions vary sub-
stantially among countries (Eurobarometer, 2014) and individuals (e. g. Botzen et al.,
2016). Yet, as climate change is widely perceived to be a temporally and spatially dis-
tant problem (e. g. Lorenzoni and Hulme, 2009), related risks may be underestimated.
This bias in individual risk perception, while warranting public interventions to foster
adaptation behavior, may undermine public support for climate protection policies.
This is particularly critical for Germany, given its ambitious climate policy that aims
at reducing greenhouse gas emissions by 40% by 2020 relative to 1990 levels and by at
least 80% by 2050 (BMWi, 2010).1
Using a generalized ordered logit approach and drawing on a large data set origi-
nating from two surveys, each among more than 6,000 German households, this study
investigates the determinants of the personal risk perception of three adverse natural
events: heat waves, storms, and floods, focusing on the role of experience, personal
damage, and, most notably, the effects of objective risk measures. By including a suite
1An important prerequisite for the support of climate policies is that people believe in the existenceof global warming and that it is mainly man-made. That people believe in the existence of globalwarming holds true for the overwhelming majority of 96% of the survey respondents. Out of theserespondents, almost 93% believe that human beings are responsible for climate change, at least partly.
4

of household characteristics as regressors, we account for findings from the literature
on behavioral economics and psychology, which argues that the individual perception
of environmental risks is a convolute of socio-demographic, cognitive, socio-cultural,
and experiential factors (e. g. van der Linden, 2015).
Our empirical analysis contributes to the literature on the correlates of individual
risk perceptions of natural hazards in several respects: First, in addition to individual
hazard experience, we take account of personal damage as a determinant of the subjec-
tive risk perception. While assuming that the experience with any such adverse events
may be associated with subjective perceptions of future risks, we recognize that this
relationship is not necessarily causal: people with a high a-priori risk perception, as
well as people with strong climate change beliefs, may be more likely to indicate per-
sonal experience with natural events (Myers et al., 2013). Yet, second, the severe flood
event of 2013, which occurred in the year right between the two surveys, provided us
with the opportunity to validate the impact of floods on risk perception by employing
a difference-in-differences approach. Third, and most importantly, contrasting with
the majority of previous studies, we account for the objective risks to suffer from nat-
ural hazards by constructing corresponding risk measures and adding them to our
database.
The inclusion of a control for the objective risks allows us to examine an assertion
of Siegrist and Gutscher (2006:977), who argue that the experience of adverse events
may be confounded with the actual risk respondents face if objective risk measures
are omitted from the analysis. Yet, we maintain that the objective risk does not affect
subjective risk perceptions if individuals are unaware of the risk they actually face.
In that case, any measure of the objective risk would be a superfluous variable in the
analysis of subjective risk perceptions: only if people are aware of the objective risk
can it influence their individual risk perception.
In line with a great deal of studies exploring the impact of personal experience
with natural hazards on related risk perceptions and climate change beliefs (e. g. Dai
et al., 2015; Zaalberg et al., 2009), we find that the experience of adverse natural events
5

and, even more pronounced, suffering from damages has a strong bearing on individ-
ual risk perceptions. Similarly positive correlations between (damage) experience and
individual risk perceptions of extreme weather events are identified for Germany by
Menny et al. (2011), Thieken et al. (2007), and Weber (2006), as well as by Keller et al.
(2006), and Siegrist and Gutscher (2006) for Switzerland. These results are challenged
by Whitmarsh (2008), who does not find a higher individual risk perception among
flood victims in the UK. In a similar vein, Botzen et al. (2016), Brody et al. (2008),
van der Linden (2015), and Marquart-Pyatt et al. (2014) conclude that, once it is con-
trolled for social, cognitive, and cultural factors, the explanatory power of personal
experience is substantially reduced.
While simultaneously analyzing the effects of both flooding experience and objec-
tive risk measures in the form of flood risk zones on respondents’ risk perception and
preventive behavior, the analysis by Siegrist and Gutscher (2006) is among those rare
studies that account for objective risks. Whereas these authors argue that both the
objective risk and the experience of a flood have a positive impact on personal risk
perception, Peacock et al. (2005) come to a different conclusion, studying the case of
hurricane experience in Florida: once controlling for the objective risk, experience has
no bearing on individual risk perception.
We contribute to this debate, benefitting from rich empirical evidence that origi-
nates from more than 13,000 questionnaires completed by German households in the
years 2012 and 2014. The subsequent section describes this unique database, while the
methodology employed is explained in Section 3. Presenting the estimation results in
Section 4, the last section summarizes and concludes.
2 Data
We draw on two surveys conducted in 2012 and 2014 that were part of a project
funded by the German Federal Ministry of Education and Research (BMBF).2 A major2Information on the project, the underlying questionnaires and a summary of the descriptive results
is available at the project homepage: www.rwi-essen.de/eval-map.
6

aim of this project was to elicit various preference indicators, such as environmental
attitudes, as well as respondents’ personal experience with natural hazards and re-
lated subjective risk perceptions. Data was collected by the German survey institute
forsa via a state-of-the-art tool that allows respondents – in these surveys the house-
hold heads – to complete the questionnaire at home using either a television or the
internet. A large set of socio-economic and demographic background information on
all household members is available from forsa’s household selection procedure and
updated regularly.3
Between October 4 and November 4, 2012, 6,404 household heads completed the
first survey, followed by a second survey in which 6,602 household heads completed a
very similar questionnaire between June 13 and July 30, 2014, yielding a total of 13,006
completed questionnaires. Of those respondents participating in the first survey, 4,639
also participated in the second period, a survey design feature that is accounted for by
clustering standard errors at the household level. Although forsa’s household panel
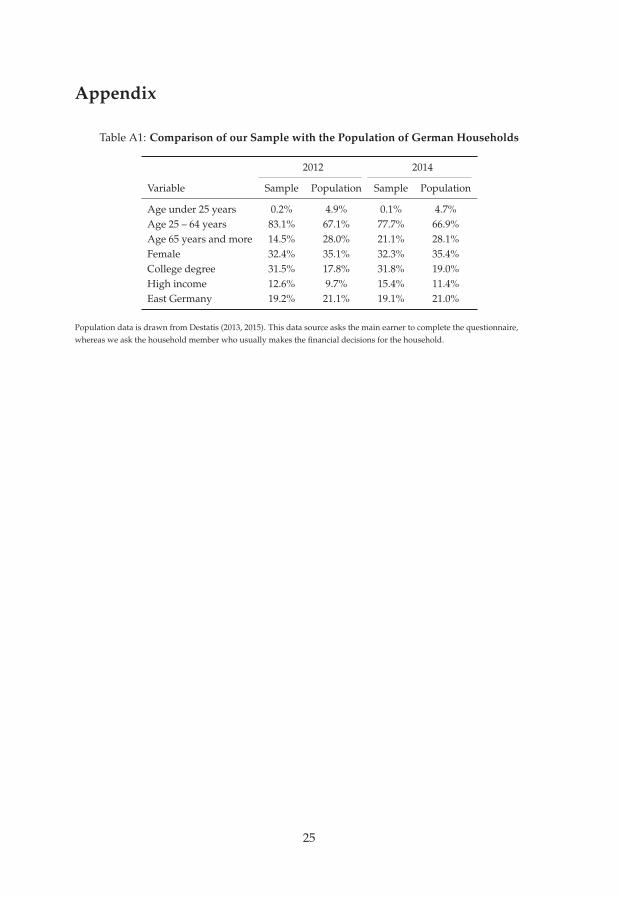
is representative for the population of German speaking households, this may not
hold true for our sample due to the self-selection of households in completing the
questionnaire. For instance, the share of respondents with a college degree is higher
in our sample than in the German population (see Table A1 in the appendix). This
fact may be due to their stronger interest in the questionnaire topics relative to less
educated people. With respect to other aspects, however, such as regional distribution,
we find that representativeness is maintained.
The dependent variable of our analysis, the respondents’ subjective risk percep-
tions, is measured on a 5-point Likert (1932) scale (see Table 1) and is based on the
following question: ”With respect to the next decades, how likely is an increase in fu-
ture personal financial or physical damages caused by ”, where the blank is
filled in with one of the following events: heat waves, storms, or floods.
Not surprisingly, more than two thirds of the respondents indicate that personal
damages owing to floods are either quite unlikely or very unlikely to increase in the
3Further information on forsa and its household panel is available at: www.forsa.com.
7

future (Table 1). This large share is presumably due to the fact that only people liv-
ing in flood-prone areas are faced with this risk. With respect to heat waves, about
half of the respondents do not fear increasing damages, whereas increasing personal
damages resulting from storms are perceived to have the highest likelihood among
the three kinds of natural hazards.
Table 1: Individual Risk Perception on the Likelihood of an Increase in Future PersonalFinancial or Physical Damages due to Heat Waves, Storms and Floods
Categories j Heat Waves Storms Floods
Very likely (j = 5) 4.2% 6.6% 2.6%Quite likely (j = 4) 17.1% 28.8% 9.3%Moderately likely (j = 3) 31.3% 31.6% 19.1%Quite unlikely (j = 2) 24.9% 14.0% 32.7%Very unlikely (j = 1) 22.5% 19.0% 36.3%
Our key explanatory variables are, first, personal experience – either at home or at
the workplace – with such natural events and, second, whether respondents suffered
from financial or physical damages. Almost 70% of the responding households indi-
cate personal experience with heat waves, but just 3.4% suffered from related damages
(Table 2). More relevant are damages from storms and floods: storms were responsible
for physical or financial damages among about 24% of our sample households, while
almost 13% of the households suffered damages from floods. Specifically, 1.5% suf-
fered damages from the flood event that hit Germany in June 2013, while 11.3% were
in some way directly affected by this event.
With respect to socio-economic characteristics, it is of note that with a share of
about one third, female respondents are less frequent in the sample than men. This
circumstance is possibly a consequence of our decision to ask only household heads to
participate in the survey. By definition, household heads typically make the family’s
investment decisions, e. g. on prevention measures, such as the purchase of insurance
covering storm damages, and are usually males. Furthermore, assuming that environ-
mental attitude may be correlated with risk perception, we asked for the respondents’
political orientation and adopted their inclination to vote for Germany’s Green Party
8
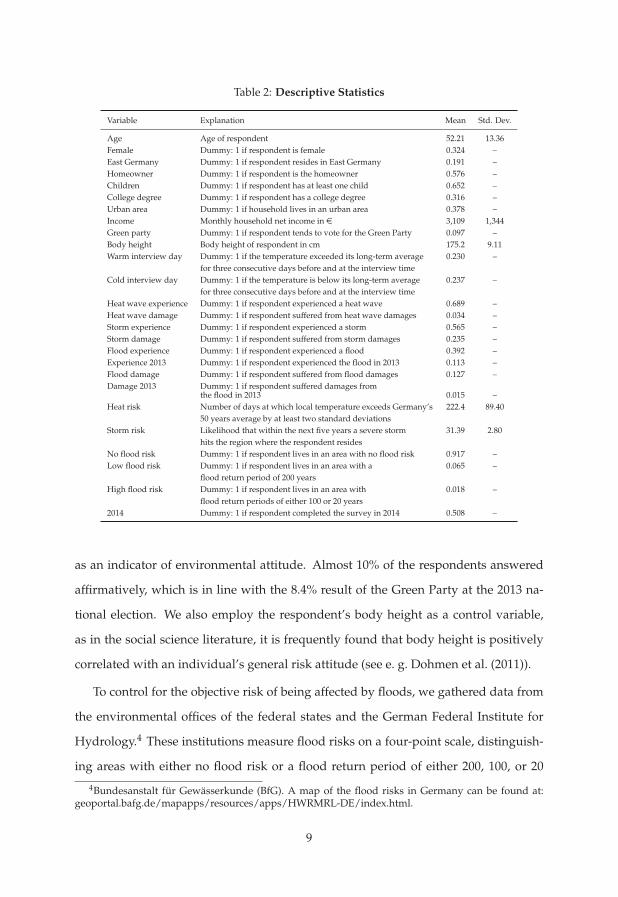
Table 2: Descriptive Statistics
Variable Explanation Mean Std. Dev.
Age Age of respondent 52.21 13.36Female Dummy: 1 if respondent is female 0.324 –East Germany Dummy: 1 if respondent resides in East Germany 0.191 –Homeowner Dummy: 1 if respondent is the homeowner 0.576 –Children Dummy: 1 if respondent has at least one child 0.652 –College degree Dummy: 1 if respondent has a college degree 0.316 –Urban area Dummy: 1 if household lives in an urban area 0.378 –Income Monthly household net income in e 3,109 1,344Green party Dummy: 1 if respondent tends to vote for the Green Party 0.097 –Body height Body height of respondent in cm 175.2 9.11Warm interview day Dummy: 1 if the temperature exceeded its long-term average 0.230 –
for three consecutive days before and at the interview timeCold interview day Dummy: 1 if the temperature is below its long-term average 0.237 –
for three consecutive days before and at the interview timeHeat wave experience Dummy: 1 if respondent experienced a heat wave 0.689 –Heat wave damage Dummy: 1 if respondent suffered from heat wave damages 0.034 –Storm experience Dummy: 1 if respondent experienced a storm 0.565 –Storm damage Dummy: 1 if respondent suffered from storm damages 0.235 –Flood experience Dummy: 1 if respondent experienced a flood 0.392 –Experience 2013 Dummy: 1 if respondent experienced the flood in 2013 0.113 –Flood damage Dummy: 1 if respondent suffered from flood damages 0.127 –Damage 2013 Dummy: 1 if respondent suffered damages from
the flood in 2013 0.015 –Heat risk Number of days at which local temperature exceeds Germany’s 222.4 89.40
50 years average by at least two standard deviationsStorm risk Likelihood that within the next five years a severe storm 31.39 2.80
hits the region where the respondent residesNo flood risk Dummy: 1 if respondent lives in an area with no flood risk 0.917 –Low flood risk Dummy: 1 if respondent lives in an area with a 0.065 –
flood return period of 200 yearsHigh flood risk Dummy: 1 if respondent lives in an area with 0.018 –
flood return periods of either 100 or 20 years2014 Dummy: 1 if respondent completed the survey in 2014 0.508 –
as an indicator of environmental attitude. Almost 10% of the respondents answered
affirmatively, which is in line with the 8.4% result of the Green Party at the 2013 na-
tional election. We also employ the respondent’s body height as a control variable,
as in the social science literature, it is frequently found that body height is positively
correlated with an individual’s general risk attitude (see e. g. Dohmen et al. (2011)).
To control for the objective risk of being affected by floods, we gathered data from
the environmental offices of the federal states and the German Federal Institute for
Hydrology.4 These institutions measure flood risks on a four-point scale, distinguish-
ing areas with either no flood risk or a flood return period of either 200, 100, or 20
4Bundesanstalt für Gewässerkunde (BfG). A map of the flood risks in Germany can be found at:geoportal.bafg.de/mapapps/resources/apps/HWRMRL-DE/index.html.
9

years. (For areas close to water courses and the sea, these risk categories are based
on high-resolution grids – in some cases comprising 25x25 meter pixels.) As the data
indicates, about 92% of the respondents do not face any flood risk at their place of res-
idence (Table 1). Since a negligible share of 0.3% of respondents reside in areas with
a flood return period of 20 years, we combine the areas with return periods of 20 and
100 years to create a single category called high flood risk.
To capture heat risks, we employ weather station data from Germany’s national
meteorological service Deutscher Wetterdienst (DWD) and add up all those days within
the last 50 years for which the local temperature exceeded Germany’s long-term av-
erage for that day by at least two standard deviations in the summer months (May to
September). Upon interpolating the outcomes to get estimates for all zip-code areas,
we assign the value of the centroid of the corresponding zip-code area to each house-
hold. The result of this exercise is illustrated by Figure 1, whose left panel shows that
the heat risk is particularly high in the south-western part of Germany, a region that is
well-known for its above-average temperatures.5
To extract a measure for the storm risk at the respondents’ residence, we draw
on data from the Center for Disaster Management and Risk Reduction Technology
(CEDIM), described in detail by Hofherr and Kunz (2010). Modeling spatially highly
resolved wind fields of severe storm events between 1971 and 2000, for which a 1x1
km grid is used, CEDIM estimates the likelihood for severe storms within return pe-
riods of 5, 10, 20, and 50 years. Employing these estimates and interpolating them on
the basis of zip codes, we measure the storm risk by the likelihood that the respon-
dent’s residence is hit by a severe storm within the next five years (Figure 1). It bears
noting that the estimation results remain hardly unchanged when we modify our risk
5Alternatively, we defined the objective heat risk measure as the sum of days on which the localtemperature exceeded its local long-term average by at least two standard deviations. This definitionwould address the fact that small upward deviations in relatively warm areas might be perceived morestrongly than larger upward deviations in relatively cold areas. While the results are the same in qual-itative terms, we argue that such a heat risk definition is less intuitive: although average temperaturestend to be lower in North Germany than in the south, measuring the deviation from the local long-termaverage would imply a higher heat risk in North Germany. In addition, we are aware of the fact thatheat risks comprise more than just high temperatures, but we lack data on additional factors such ashumidity levels, wind speed, etc.
10
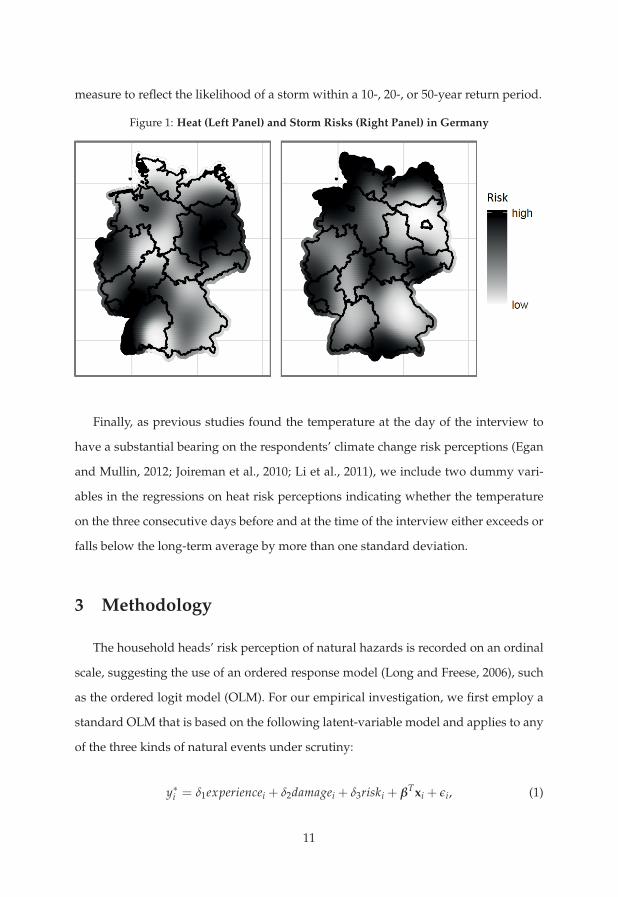
measure to reflect the likelihood of a storm within a 10-, 20-, or 50-year return period.
Figure 1: Heat (Left Panel) and Storm Risks (Right Panel) in Germany
Finally, as previous studies found the temperature at the day of the interview to
have a substantial bearing on the respondents’ climate change risk perceptions (Egan
and Mullin, 2012; Joireman et al., 2010; Li et al., 2011), we include two dummy vari-
ables in the regressions on heat risk perceptions indicating whether the temperature
on the three consecutive days before and at the time of the interview either exceeds or
falls below the long-term average by more than one standard deviation.
3 Methodology
The household heads’ risk perception of natural hazards is recorded on an ordinal
scale, suggesting the use of an ordered response model (Long and Freese, 2006), such
as the ordered logit model (OLM). For our empirical investigation, we first employ a
standard OLM that is based on the following latent-variable model and applies to any
of the three kinds of natural events under scrutiny:
y∗i = δ1experiencei + δ2damagei + δ3riski + βTxi + εi, (1)
11

where an intercept is not included for normalization reasons and y∗i designates the
latent risk perception of respondent i. experiencei denotes i’s experience with the re-
spective natural event, whereas damagei indicates whether respondent i suffered from
any damage owing to the event, and riski represents the objective risk in respondent
i’s neighborhood. x is a vector of control variables described in the previous section,
superscript T denotes the transposition of a vector, β and the δ’s are the parameters to
be estimated, and ε denotes the error term.
While objective risk measures are frequently lacking in empirical studies on sub-
jective risk perception (Siegrist and Gutscher, 2006), we hypothesize that the objective
risk does not affect risk perception y∗ if individuals are unaware of the actual risk level:
H0 : δ3 = 0. In this case, any measure of the objective risk would be a superfluous
variable. In other words, neglecting such risk measures would not result in omitted-
variable bias. Arguably, this may be the case for storms, for which information on the
degree of the objective risk is not easily accessible. Beyond the personal experience
with these hazards, people are likely to be unaware of the objective risk level, so that it
cannot influence their individual risk perception. Specifically for floods, however, we
hypothesize H0 : δ3 > 0, as the flood risk of a specific area is mainly determined by its
proximity to the next water course, a heuristic information that is easily available for
households.
In short, for natural events such as storms, we expect positive coefficients δ1 and
δ2, but a vanishing δ3, which is perfectly in line with the availability heuristic (Tver-
sky and Kahneman, 1973). According to this heuristic, people employ the ease with
which examples of a hazard can be brought to mind as a cue for estimating hazard
probabilities (Siegrist and Gutscher, 2006:972). Past personal experience with hazards,
in particular if they are associated with personal damages, may be such a cue. Experi-
ence is, therefore, an important factor affecting people’s risk perception and, hence, we
expect δ1 > 0 and δ2 > 0. In contrast, if heuristics for objective risks are unavailable
and people are, thus, unaware of the actual risk, one would assume that δ3 = 0.
Defining the observed risk perception categories by yi = j if αj−1 < y∗i ≤ αj, where
12

j = 1 = “very unlikely”, ..., j = 5 = “very likely” (see Table 1), M = 5, α0 = −∞ and
αM = ∞, it follows that
P(yi = j) = P(αj−1 < y∗i ≤ αj)
= P(αj−1 − δTwi − βTxi < εi ≤ αj − δTwi − βTxi) (2)
= F(αj − δTwi − βTxi)− F(αj−1 − δTwi − βTxi),
where vector w comprises the variables exper, damage, and risk and α1, ..., αM−1 denote
M − 1 threshold values that have to be estimated along with the parameter vectors δ
and β. P(yi ≤ 0) = 0 and F(.) is the cumulative distribution function of εi. In case of
the OLM, F(.) is the logistic function: Λ(z) = exp(z)/[1 + exp(z)].
To calculate the marginal effects for the OLM, one can depart from P(yi = j) =
P(yi ≤ j)− P(yi ≤ j − 1) = Λ(zj)− Λ(zj−1), where zj := αj − δTwi − βTxi:
∂P(yi = j)∂xi
= β[dΛ(zj−1)
dz− dΛ(zj)
dz], (3)
with the derivative of Λ(z) being given by dΛ(z)dz = Λ(z)(1 − Λ(z)). Note that for
1 < j < M − 1, the sign of the marginal effect of a variable is not necessarily in line
with that of its coefficient: a positive coefficient βk does not imply a positive marginal
effect, as the difference Λ(zj)− Λ(zj−1) can adopt positive or negative signs. Further-
more, the interpretation of the marginal effect is somewhat limited. If, for instance,
the marginal effect of an explanatory variable is negative, an increase in this variable
reduces the probability of y falling into category j, yet it remains unclear whether the
increase in this variable raises the probability of y being located in a higher or a lower
category.
To allow for easy interpretations of both parameters and marginal effects, alterna-
tive formulations of the OLM are either based on the probabilities P(yi ≤ j) or P(yi >
j) Williams (2006), rather than in terms of P(yi = j). For instance, for j = 1, 2, ..., M− 1,
13

our OLM reads:
P(yi > j) = Λ(−zj) = Λ(−αj + δTwi + βTxi) =exp(−αj + δTwi + βTxi)
1 + exp(−αj + δTwi + βTxi), (4)
as P(yi > j) = 1 − P(yi ≤ j) = 1 − Λ(αj − δTwi − βTxi) = Λ(−αj + δTwi + βTxi),
with the last equation being due to Λ(−z) = 1 − Λ(z).
Formulation (4) allows for a straightforward interpretation of the marginal effects
∂P(yi > j)∂xi
=dΛ(−zj)
dz∂(βTxi)
∂xi= Λ(−zj)[1 − Λ(−zj)]β. (5)
As the derivative of Λ(z), dΛ(z)dz = Λ(z)(1 − Λ(z)), is always positive, it follows from
Equation 5 that positive coefficients imply that larger values of an explanatory vari-
able make it more likely that response yi will be in a higher category than j, whereas
negative coefficients indicate the opposite.
A restrictive feature of the OLM is that it assumes that the coefficients related to any
explanatory variable do not vary across categories j, that is, δ and β do not depend on
category j. This is commonly referred to as the proportional-odds (PO) assumption
(McCullagh, 1980). If the PO assumption is violated, estimating an OLM will lead to
inconsistent results. Thus, numerous authors have challenged the OLM and the un-
derlying PO assumption by conceiving ordered choice models that are based on non-
proportional odds, see e.g. Terza (1985), McCullagh and Nelder (1989), and Peterson
and Harrell Jr (1990).
In addition to the OLM, in what follows, we employ the so-called generalized or-
dered logit model (GOLM), for which Fu et al. (1999) developed the Stata program
gologit. (Inspired by Vincent Fu’s gologit routine, Williams (2006) wrote the Stata
program gologit2 to offer several additional powerful options.) Applying the GOLM
to our empirical example, the probability of exceeding risk category j is given by
P(yi > j) = Λ(−αj + δTj wi + βT
j xi), j = 1, 2, ..., M − 1, (6)
14

where, in contrast to OLM Formula 4, δj and βj are parameter vectors that are allowed
to vary across categories j. While this generalization suggests itself on the basis of
OLM Formulation 4, the GOLM is particularly suited for our analysis, as we specifi-
cally expect the effect of damage experience to vary across risk perception categories
and to substantially differ for the polar categories j = 1 and j = 5, an aspect that
cannot be captured by the OLM.
In practice, the GOLM is estimated by running a series of M − 1 binary logit re-
gressions (Williams, 2006:63). In our case, where M = 5, four binary logit regressions
are to be estimated that sequentially combine the categories of the dependent vari-
able. For instance, for the first regression (indicated in the results tables by Y > 1),
category j = 1 is recoded as zero, whereas the outcomes falling into all other cate-
gories j = 2, . . . , 5 are recoded as unity. For the second binary regression (Y > 2),
all outcomes falling into the first two categories, j = 1 and j = 2, are recoded as 0:
yi = 0, with the remaining categories being recoded as yi = 1. In a similar vein, for the
third regression (Y > 3), categories 1 to 3 are combined and for the fourth regression
(Y > 4), categories 1 to 4 are recoded as zero. Note that the simultaneous estimation
of these binary regressions, which is what Williams’ gologit2 command does, pro-
vides results that differ slightly from those when each binary regression is estimated
separately. These results are presented in the subsequent section.
4 Results
Pooling the data from both surveys for the years 2012 and 2014, in this section,
we first present the results based on the standard OLM framework to provide for a
reference point for the more general GOLM, thereby accounting for repeated observa-
tions from the same households by clustering standard errors at the household level.
As can be seen from the outcomes of the robustness checks reported in the appendix,
the standard OLM results are quite similar to those originating from a random-effects
OLM (Table A2), that is, when the panel nature of the data is exploited, as well as to
15

those when the number of categories of individual risk perception is reduced from
M=5 to M=3 by combining the first two categories j=1 and j=2 and the categories j=4
and j=5, respectively (Table A3).
4.1 Correlates of Risk Perceptions
Starting with the discussion of the estimation results for the individual perception
of risks due to future heat waves, according to the coefficient estimates reported in Ta-
ble 3, experience with former heat waves raises individual risk perception. The effect
is even more pronounced for those respondents who suffered from heat-related dam-
ages. The positive correlation of both experience and damages with the perception of
future risks also holds for storms and floods.
Moreover, across all three kinds of natural events, the perception of future risks is
higher in the second panel wave. Partly, this outcome may be explained by an intense
storm that hit large parts of Germany shortly before the second survey started in 2014,
as well as the severe flood in the early summer of 2013, which affected numerous
river basins and earned a strong media resonance. This event, which occurred in the
year right between the two surveys, allows us to alternatively employ a difference-
in-differences approach in the subsequent section to validate the effects on the risk
perception for floods.
Additional similarities across all kinds of natural hazards can be observed for nu-
merous socio-economic characteristics and personal traits: For instance, women and
individuals who tend to vote for Germany’s green party exhibit higher risk percep-
tions, whereas households with higher incomes and household heads with a college
degree appear to be more immune to these adverse events than other individuals. Tak-
ing the tendency to vote for the green party as a proxy for environmental attitude, our
estimates confirm the results documented in the literature: environmental attitude is
widely found to be positively correlated with the perception of risks resulting from
climate change (Leiserowitz, 2006; McCright and Dunlap, 2011; Poortinga et al., 2011;
16

Table 3: Ordered Logit Estimation Results for the Determinants of Individual Risk Percep-tions
Heat Waves Storms Floods
Coeff. Std. Err. Coeff. Std. Err. Coeff. Std. Err.
Heat waveExperience 0.653** (0.050) – – – –Damages 2.057** (0.129) – – – –Heat risk 0.001** (0.0003) – – – –
StormsExperience – – 0.386** (0.056) – –Damages – – 0.883** (0.071) – –Storm risk – – -0.011 (0.008) – –
FloodsExperience – – – – 0.329** (0.044)Damages – – – – 1.124** (0.074)Low flood risk – – – – 0.507** (0.097)High flood risk – – – – 0.686** (0.168)
Warm interview day 0.068 (0.049) – – – –Cold interview day 0.0002 (0.052) – – – –Age 0.068** (0.012) 0.033** (0.012) 0.006 (0.012)Age × Age -0.001** (0.0001) -0.0004** (0.0001) -0.0001 (0.0001)Female 0.233** (0.061) 0.145* (0.063) 0.414** (0.063)East Germany -0.015 (0.061) -0.021 (0.059) -0.024 (0.059)Children -0.016 (0.053) 0.016 (0.055) -0.024 (0.054)Homeowner -0.030 (0.052) 0.340** (0.054) 0.019 (0.052)College degree -0.228** (0.050) -0.065 (0.052) -0.182** (0.051)Income -0.346** (0.054) -0.236** (0.055) -0.278** (0.054)Urban area 0.002 (0.050) -0.104* (0.050) 0.001 (0.048)Green party 0.162* (0.066) 0.251** (0.071) 0.081 (0.066)Body height 0.001 (0.003) 0.001 (0.003) 0.003 (0.003)2014 0.362** (0.037) 0.494** (0.038) 0.293** (0.036)α1 -1.132 (0.704) -2.149** (0.760) -1.676* (0.721)α2 0.092 (0.705) -1.370 (0.760) -0.235 (0.721)α3 1.585* (0.705) 0.006 (0.760) 1.030 (0.722)α4 3.483** (0.710) 2.117** (0.762) 2.712** (0.727)Number of observations: 8,211 7,495 8,555
Note: Standard errors are clustered at the household level and are reported in parentheses. ** and * denote statistical significanceat the 1 % and 5 % level, respectively.
Tobler et al., 2012; Wolf and Moser, 2011). Finally, although other studies, such as
Dohmen et al. (2011), find a positive correlation of body height with an individual’s
general risk attitude, our results suggest that body height has no bearing on the risk
perception of natural events.
17
Besides similarities, there are also hazard-specific discrepancies: For example, age
exhibits an inverted U-shaped correlation with the risk perceptions of heat waves and
storms, a pattern that cannot be detected for floods. Furthermore and not surprisingly,
the perception of storm risks is higher for homeowners than for renters, whereas such
a correlation does not exist for heat-wave- and flood-risk perceptions. Next, previous
studies found the temperature at the day of the interview to have a substantial bearing
on the respondents’ climate change risk perceptions (Egan and Mullin, 2012; Joireman
et al., 2010; Li et al., 2011). This finding contrasts with our results: The two dummy
variables indicating whether the temperature on the three consecutive days before and
at the time of the interview either exceeds or falls below the long-term average by more
than one standard deviation have no statistically significant effect on individual heat
risk perception. It turns out that the regression results are robust against amending
the definitions of these dummy variables by varying the number of days prior to the
interview that is taken into account in the definitions.
Turning to the role of objective risks, we now test our hypothesis H0 : δ3 = 0
according to which objective risk measures do not affect risk perceptions if individu-
als are unaware of the actual risk, which may be rather expected for storms than for
floods.6 In examining this hypothesis, we follow Greene (2007:E18-23; 2010:292), who
argues that in non-linear models, such as the OLM, tests on the statistical significance
of an explanatory variable should be based on its coefficient, rather than marginal
effects. Our hypothesis is largely confirmed by the empirical results: while the coef-
ficient estimate of the objective risk measure for storms is not statistically significant
and that for the heat risk measure is of negligible magnitude, both risk measures for
floods have a statistically significant, positive effect on respondents’ risk perceptions.
This result is in line with the finding of Siegrist and Gutscher (2006:975), according to
which respondents’ risk perceptions with respect to flooding are correlated with the
experts’ risk assessment. Yet, as the effects of damage experience do not vanish when
6While extreme wind speeds may occur at open-spaced saddles, edges, flanks, and summits(Hofherr and Kunz, 2010), thereby exacerbating the damages resulting from storms, we argue thatformer severe storms also caused substantial damages in cities. In short, the place of residence does notseem to be a good indicator of storm risks.
18

controlling for the objective storm risk, our empirical results contrast with those of
Peacock et al. (2005).
To explore whether the OLM is the appropriate estimation model, we test the va-
lidity of the PO assumption using the Brant (1990) test. It suggests comparing the
coefficient estimates across the M − 1 binary logit models that are employed to es-
timate the probabilities given by Equation 6. Under the null hypothesis H0 : βj =
β, δj = δ for all j = 1, ..., M, the respective coefficient estimates of the binary models
should not differ systematically. In fact, the chi-square statistics of χ2(51) = 150.93∗∗,
χ2(45) = 278.76∗∗, and χ2(48) = 172.11∗∗ indicate that the PO assumption is violated
for heat waves, storms, and floods, respectively. In addition, we conduct Likelihood-
Ratio (LR) tests to explore what model provides the best fit to our data, exploiting the
fact that the OLM is nested in the GOLM. The LR test results, not reported here, also
indicate that the GOLM is to be preferred over the OLM for all three kinds of natural
hazards at the conventional significance level of 1%.
Reporting the coefficient estimates of the four binary logit models that mimic the
GOLM estimation in the appendix (Table A4), Table 4 presents the average marginal ef-
fects resulting from the GOLM. These averages are given by the means of the marginal
effects calculated for each observational unit individually. Following again Greene
(2007:E18-23; 2010:292), we have abstained from reporting any asterisk in Table 4, as
testing the statistical significance of an explanatory variable should be based on its
coefficient, rather than marginal effects.
Solely focussing on the three key variables, the mere experience with heat waves,
that is, without suffering from physical or financial damage, exhibits the strongest
effect for the first two binary regressions (first row of Table 4). On the other hand, the
mere experience with heat waves increases the probability of indicating that future
risks thereof are "very likely" (Y > 4) by just 2.1 percentage points. As for the OLM, the
impact of damage experience is more pronounced than the effect of mere experience,
a finding that holds for all three kinds of natural hazards.
In addition to the OLM coefficient estimates reported in Table 3, the negligible
19

Table 4: Average Marginal Effects resulting from the Generalized Ordered Logit Model forthe Risk Perceptions of Heat Waves, Storms, and Floods
Y>1 Y>2 Y>3 Y>4
Marg. Std. Marg. Std. Marg. Std. Marg. Std.Effect Error Effect Error Effect Error Effect Error
Risk Perception of Heat Waves:Heat experience 0.141 (0.012) 0.142 (0.013) 0.079 (0.010) 0.021 (0.004)Heat damage 0.235 (0.021) 0.402 (0.027) 0.407 (0.032) 0.126 (0.021)Heat risk 0.0002 (0.0001) 0.0002 (0.0001) 0.0002 (0.0001) 0.0001 (0.00003)Number of observations: 8,211Risk Perception of Storms:Storm experience 0.063 (0.013) 0.089 (0.015) 0.084 (0.014) 0.019 (0.006)Storm damage 0.071 (0.015) 0.166 (0.017) 0.218 (0.017) 0.074 (0.009)Storm risk 0.001 (0.002) -0.002 (0.002) -0.003 (0.002) -0.001 (0.001)Number of observations: 7,495Risk Perception of Floods:Flood experience 0.063 (0.012) 0.085 (0.011) 0.036 (0.007) 0.004 (0.003)Flood damage 0.151 (0.016) 0.276 (0.017) 0.192 (0.014) 0.053 (0.008)Low flood risk 0.086 (0.023) 0.116 (0.023) 0.071 (0.017) 0.015 (0.008)High flood risk 0.119 (0.037) 0.138 (0.040) 0.115 (0.032) 0.026 (0.016)Number of observations: 8,555
Note: Standard errors are clustered at the household level and are in parentheses. All other covariates are dropped.
average marginal effects of the objective heat risk measure reconfirm our hypothesis
that objective risks seem to be irrelevant when people are unaware of the actual risk.
This result also holds true for storms, as the average marginal effects of the storm risk
on risk perception are very small and may reflect that respondents are unlikely to be
informed about the objective storm risk of their region of residence. By contrast, living
in a flood-prone area, irrespective of whether it is associated with a low or high flood
risk, fosters the perception of future flood risks.
Our analysis might suffer from potential simultaneity problems that arise from
the fact that people with a high a-priori risk perception, as well as people with strong
climate change beliefs, may be more likely to indicate personal experience with natural
events (Myers et al., 2013). Such problems may be ameliorated by employing natural
experiments or instrumental-variable (IV) approaches (van der Linden, 2014). In the
absence of any instrument that is correlated with the experience of adverse weather
events, but uncorrelated with risk perceptions, we alternatively employ a difference-
20
in-differences approach to validate the impact of flood experience on risk perception,
the results of which are presented in the subsequent section.
4.2 Risk Perceptions After the Flood of 2013
The flood event that hit East and South Germany in June 2013 can be exploited to
causally identify the impact of experiences with floods on subjective risk perceptions.
To this end, we restrict the sample to those 4,639 households that participated in both
surveys and employ the following difference-in-differences approach:
y∗it = γ2014 + αeexperience2013i + δe(experience2013
i × 2014)+
αddamage2013i + δd(damage2013
i × 2014) + βTxit + νit,(7)
where y∗it denotes the latent level of risk perception for floods of individual i in survey
year t, experience2013 and damage2013 stand for dummy variables that equal unity if
respondent i has either experience with the flood of 2013 or suffered damages from it,
and 2014 indicates whether an observation originates from the second survey. Vector
x comprises all socio-economic variables, including the objective flood risk measures
and ν denotes an idiosyncratic error term. The treatment effects of the flood of 2013
on risk perception are given by the coefficients δe and δd pertaining to the interaction
terms.
In addition to ordered-choice methods, we estimate Equation 7 using OLS meth-
ods, as the interpretation of interaction terms is more straightforward than when em-
ploying non-linear models (Frondel and Vance, 2012), such as the OLM. Not surpris-
ingly, the results of the difference-in-differences approach reported in Table 5 indicate
a statistically significant and positive treatment effect of experiencing the flood of 2013
on subjective risk perception, as well as of damages therefrom.
All these results have important implications for the society. While identifying
the distribution of people’s perceptions of risks associated with climate change is a
research topic in its own right, it is highly important to improve the risk perceptions of
21

Table 5: Difference-in-Differences Estimation Results for Individual Perceptions of Flood Risks
OLS OLM
Coeff. Std. Err. Coeff. Std. Err.2014 0.142** (0.022) 0.289** (0.039)Experience2013 0.057 (0.080) 0.080 (0.131)
Experience2013 × 2014 0.358** (0.069) 0.583** (0.118)Damage2013 -0.097 (0.174) -0.179 (0.329)
Damage2013 × 2014 0.624** (0.223) 1.115** (0.427)Low flood risk 0.277** (0.069) 0.474** (0.117)High flood risk 0.492** (0.116) 0.821** (0.195)Age 0.012 (0.008) 0.021 (0.015)Age × Age -0.000 (0.000) -0.000 (0.000)Female 0.194** (0.042) 0.365** (0.075)East Germany -0.049 (0.041) -0.082 (0.073)Children -0.025 (0.037) -0.036 (0.065)Homeowner 0.031 (0.035) 0.053 (0.062)College degree -0.102** (0.033) -0.169** (0.060)Income -0.177** (0.037) -0.314** (0.064)Urban area -0.035 (0.033) -0.042 (0.058)Green 0.077 (0.046) 0.160 (0.082)Body height 0.001 (0.002) 0.003 (0.004)Constant 1.766** (0.471) – –α1 – – -1.620 (0.853)α2 – – -0.228 (0.853)α3 – – 1.021 (0.853)α4 – – 2.730** (0.860)Number of observations: 6,595 6,595
Note: Standard errors are clustered at the household level and are in parentheses ** and * denote statistical significance at the1 % and 5 % level, respectively.
citizens: only if risk perceptions match actual risks can citizens respond adequately to
these risks. To improve individual risk perception, providing information on adverse
natural events is widely regarded as a central element: if people are more sensitized to
future risks, they may be more inclined to take adaptation and prevention measures
(e. g. Egan and Mullin, 2016). In this respect, it appears to be of high importance to
provide households with information on the efficacy of adaptation and prevention
measures (Zaalberg et al., 2009).
22

5 Summary and Conclusion
The overwhelming majority of European citizens both acknowledges the existence
of global climate change and expects negative consequences therefrom (Eurobarome-
ter, 2014). Nonetheless, climate change is widely perceived as a distant problem, both
temporally and spatially, and, hence, people typically expect negative consequences
for the future, but believe to remain unaffected in the short term (Lorenzoni and
Hulme, 2009; Poortinga et al., 2011; Wolf and Moser, 2011). As a result of this attitude,
which is similar to the notion of myopia in the behavioral economics literature (Thaler
and Benartzi, 2004), related risks due to low-probability-high-impact events may be
underestimated, which in turn may justify public support for fostering adaptation be-
havior and may undermine voters’ support for climate protection policies. This would
be particularly critical for Germany, as its greenhouse gas reduction targets are among
the most ambitious in the world.
Using ordered choice methods and drawing on a unique panel data set originating
from two repeated surveys, each among more than 6,000 German households, this
study has investigated the correlates of individuals’ risk perception with respect to
three natural hazards: heat waves, storms, and floods, thereby focusing on the role of
personal experience with extreme weather events, related damages, as well as the role
of objective risk measures.
In line with the empirical literature (e. g. Zaalberg et al., 2009), we find that per-
sonal experience with adverse natural events is associated with higher individual risk
perceptions. If this experience is based on personal damage, the effect on risk per-
ception is even more pronounced. These results have important policy implications:
As numerous studies indicate, strong risk perceptions may foster measures to adapt to
climate change (O’Connor et al., 1999; Peacock et al., 2005; Siegrist and Gutscher, 2006;
Sjöberg, 2000; Thieken et al., 2007; Zaalberg et al., 2009). The link between risk percep-
tion and mitigation behavior is less clear, though. On the one hand, Dienes (2015),
Wicker and Becken (2013), Siegrist and Gutscher (2008), Spence et al. (2011), and Os-
23
berghaus (2015) confirm stronger mitigation efforts due to a higher risk perception,
whereas Bubeck et al. (2012), Wachinger et al. (2013), and Zaalberg et al. (2009) cast
doubt on this nexus.
A possible explanation for the diverging findings with respect to adaptation and
mitigation behavior is that individuals adapt to adverse natural hazards regardless of
their beliefs in the origin. In contrast, investments in mitigation might require believ-
ing in anthropogenic climate change. On the basis of the empirical results presented
here, we conclude that to spur adaptation and prevention behavior with respect to the
natural hazards owing to climate change, it is crucial that the objective risks of being
affected by storms, heat waves, and floods are communicated to the population. Oth-
erwise, the degree of risk awareness and individual risk perception among citizens
may be too low, thereby undermining the support for climate policy.
24
Appendix
Table A1: Comparison of our Sample with the Population of German Households
2012 2014
Variable Sample Population Sample Population
Age under 25 years 0.2% 4.9% 0.1% 4.7%Age 25 – 64 years 83.1% 67.1% 77.7% 66.9%Age 65 years and more 14.5% 28.0% 21.1% 28.1%Female 32.4% 35.1% 32.3% 35.4%College degree 31.5% 17.8% 31.8% 19.0%High income 12.6% 9.7% 15.4% 11.4%East Germany 19.2% 21.1% 19.1% 21.0%
Population data is drawn from Destatis (2013, 2015). This data source asks the main earner to complete the questionnaire,whereas we ask the household member who usually makes the financial decisions for the household.
25
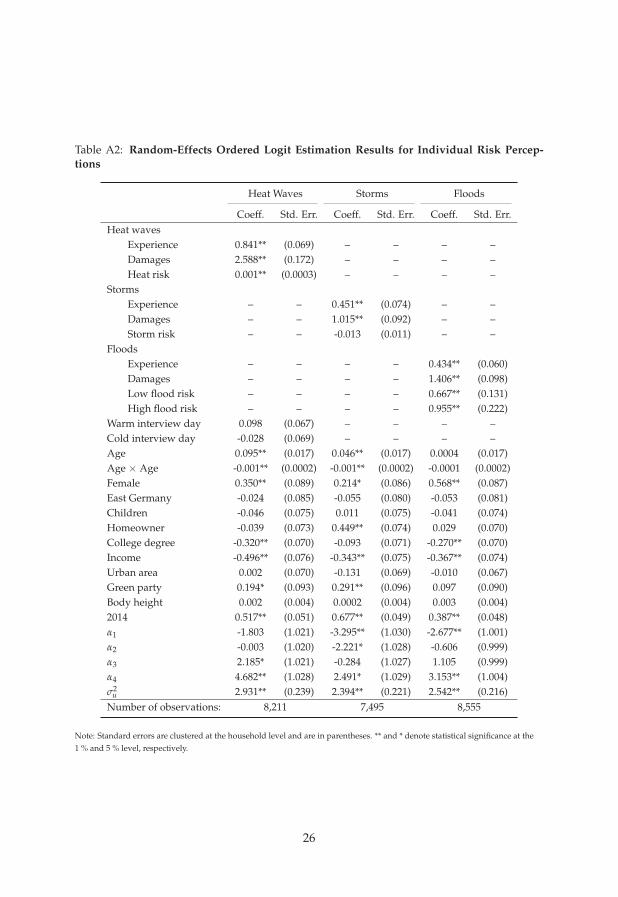
Table A2: Random-Effects Ordered Logit Estimation Results for Individual Risk Percep-tions
Heat Waves Storms Floods
Coeff. Std. Err. Coeff. Std. Err. Coeff. Std. Err.Heat waves
Experience 0.841** (0.069) – – – –Damages 2.588** (0.172) – – – –Heat risk 0.001** (0.0003) – – – –
StormsExperience – – 0.451** (0.074) – –Damages – – 1.015** (0.092) – –Storm risk – – -0.013 (0.011) – –
FloodsExperience – – – – 0.434** (0.060)Damages – – – – 1.406** (0.098)Low flood risk – – – – 0.667** (0.131)High flood risk – – – – 0.955** (0.222)
Warm interview day 0.098 (0.067) – – – –Cold interview day -0.028 (0.069) – – – –Age 0.095** (0.017) 0.046** (0.017) 0.0004 (0.017)Age × Age -0.001** (0.0002) -0.001** (0.0002) -0.0001 (0.0002)Female 0.350** (0.089) 0.214* (0.086) 0.568** (0.087)East Germany -0.024 (0.085) -0.055 (0.080) -0.053 (0.081)Children -0.046 (0.075) 0.011 (0.075) -0.041 (0.074)Homeowner -0.039 (0.073) 0.449** (0.074) 0.029 (0.070)College degree -0.320** (0.070) -0.093 (0.071) -0.270** (0.070)Income -0.496** (0.076) -0.343** (0.075) -0.367** (0.074)Urban area 0.002 (0.070) -0.131 (0.069) -0.010 (0.067)Green party 0.194* (0.093) 0.291** (0.096) 0.097 (0.090)Body height 0.002 (0.004) 0.0002 (0.004) 0.003 (0.004)2014 0.517** (0.051) 0.677** (0.049) 0.387** (0.048)α1 -1.803 (1.021) -3.295** (1.030) -2.677** (1.001)α2 -0.003 (1.020) -2.221* (1.028) -0.606 (0.999)α3 2.185* (1.021) -0.284 (1.027) 1.105 (0.999)α4 4.682** (1.028) 2.491* (1.029) 3.153** (1.004)σ2
u 2.931** (0.239) 2.394** (0.221) 2.542** (0.216)Number of observations: 8,211 7,495 8,555
Note: Standard errors are clustered at the household level and are in parentheses. ** and * denote statistical significance at the1 % and 5 % level, respectively.
26

Table A3: Ordered Logit Estimation Results for Individual Risk Perceptions and M =3 Cat-egories
Heat Waves Storms Floods
Coeff. Std. Err. Coeff. Std. Err. Coeff. Std. Err.Heat waves
Experience 0.577** (0.052) – – – –Damages 2.015** (0.137) – – – –Heat risk 0.001** (0.0003) – – – –
StormsExperience – – 0.399** (0.058) – –Damages – – 0.907** (0.071) – –Storm risk – – -0.012 (0.009) – –
FloodsExperience – – – – 0.428** (0.054)Damages – – – – 1.336** (0.074)Low flood risk – – – – 0.571** (0.101)High flood risk – – – – 0.713** (0.173)
Warm interview day 0.056 (0.052) – – – –Cold interview day 0.017 (0.053) – – – –Age 0.076** (0.013) 0.032* (0.013) 0.007 (0.014)Age × Age -0.001** (0.0001) -0.0004** (0.0001) -0.0001 (0.0001)Female 0.212** (0.064) 0.135* (0.066) 0.359** (0.071)East Germany 0.030 (0.062) 0.003 (0.061) -0.047 (0.068)Children -0.027 (0.055) 0.026 (0.057) -0.014 (0.063)Homeowner 0.003 (0.055) 0.409** (0.056) 0.016 (0.060)College degree -0.284** (0.053) -0.067 (0.055) -0.221** (0.061)Income -0.333** (0.055) -0.202** (0.056) -0.265** (0.061)Urban area 0.013 (0.052) -0.130* (0.052) -0.042 (0.057)Green party 0.122 (0.071) 0.270** (0.076) 0.044 (0.078)Body height 0.002 (0.003) 0.002 (0.003) -0.002 (0.004)2014 0.317** (0.039) 0.479** (0.040) 0.166** (0.044)α1 0.456 (0.733) -1.054 (0.787) -1.005 (0.804)α2 1.948** (0.733) 0.323 (0.787) 0.267 (0.804)Number of observations: 8,211 7,495 8,555
Note: Standard errors are clustered at the household level and are in parentheses. ** and * denote statistical significance at the1 % and 5 % level, respectively.
27

Table A4: Coefficient Estimates Resulting from the Generalized Ordered Logit Model forIndividual Risk Perceptions
Y>1 Y>2 Y>3 Y>4
Coeff. Std. Err Coeff. Std. Err Coeff. Std. Err Coeff. Std. ErrRisk Perception of Heat Waves:Heat experience 0.789** (0.060) 0.588** (0.054) 0.533** (0.072) 0.670** (0.160)Heat Damage 1.643** (0.244) 1.900** (0.178) 2.027** (0.144) 2.032** (0.223)Heat risk 0.001** (0.0003) 0.001* (0.0003) 0.001** (0.0003) 0.002* (0.001)Number of observations: 8,211Risk Perception of Storms:Storm experience 0.391** (0.079) 0.392** (0.067) 0.417** (0.072) 0.441** (0.160)Storm damage 0.449** (0.093) 0.782** (0.081) 0.987** (0.080) 1.188** (0.164)Storm risk 0.001 (0.012) -0.010 (0.010) -0.016 (0.010) -0.024 (0.018)Number of observations: 7,495Risk Perception of Floods:Flood experience 0.275** (0.052) 0.433** (0.055) 0.422** (0.084) 0.231 (0.184)Flood damage 0.707** (0.079) 1.254** (0.075) 1.506** (0.095) 1.508** (0.177)Low flood risk 0.404** (0.116) 0.540** (0.103) 0.617** (0.127) 0.512* (0.236)High flood risk 0.575** (0.198) 0.635** (0.174) 0.904** (0.199) 0.785* (0.352)Number of observations: 8,111
Note: Standard errors are clustered at the household level and are in parentheses. ** and * denote statistical significance at the1 % and 5 % level, respectively. Coefficient estimates for all other covariates are dropped.
28

References
BMWi, B., 2010. Energiekonzept für eine umweltschonende, zuverlässige und
bezahlbare Energieversorgung. Bundesministerium für Wirtschaft und Technolo-
gie (BMWi), Bundesministerium für Umwelt, Naturschutz und Reaktorsicherheit
(BMU), Berlin.
Botzen, W. J. W., Michel-Kerjan, E., Kunreuther, H., de Moel, H., Aerts, J. C. J. H., 2016.
Political affiliation affects adaptation to climate risks: Evidence from New York City.
Climatic Change 138 (1-2), 353–360.
Brant, R., 1990. Assessing proportionality in the proportional odds model for ordinal
logistic regression. Biometrics, 1171–1178.
Brody, S. D., Zahran, S., Vedlitz, A., Grover, H., 2008. Examining the relationship be-
tween physical vulnerability and public perceptions of global climate change in the
United States. Environment and Behavior 40 (1), 72–95.
Bubeck, P., Botzen, W. J., Aerts, J. C., 2012. A review of risk perceptions and other
factors that influence flood mitigation behavior. Risk Analysis 32 (9), 1481–1495.
Dai, J., Kesternich, M., Löschel, A., Ziegler, A., 2015. Extreme weather experiences and
climate change beliefs in China: An econometric analysis. Ecological Economics 116,
310–321.
Destatis, 2013. Bevölkerung und Erwerbstätigkeit. Artikelnummer: 2010300127004.
Destatis, 2015. Bevölkerung und Erwerbstätigkeit. Artikelnummer: 2010300147004.
Dienes, C., 2015. Actions and intentions to pay for climate change mitigation: Environ-
mental concern and the role of economic factors. Ecological Economics 109, 122–129.
Dohmen, T., Falk, A., Huffman, D., Sunde, U., Schupp, J., Wagner, G. G., 2011. In-
dividual risk attitudes: Measurement, determinants, and behavioral consequences.
Journal of the European Economic Association 9 (3), 522–550.
29
Egan, P. J., Mullin, M., 2012. Turning personal experience into political attitudes: the
effect of local weather on Americans’ perceptions about global warming. The Journal
of Politics 74 (03), 796–809.
Egan, P. J., Mullin, M., 2016. Recent improvement and projected worsening of weather
in the United States. Nature 532 (7599), 357–360.
Eurobarometer, 2014. Special Eurobarometer 409. Climate Change Report.
Frondel, M., Vance, C. J., 2012. Interpreting the outcomes of two-part models. Applied
Economics Letters 19 (10), 987–992.
Fu, V. K., et al., 1999. Estimating generalized ordered logit models. Stata Technical Bul-
letin 8 (44).
Greene, W., 2007. Limdep Version 9.0 Econometric Modeling Guide. New York: Econo-
metric Software.
Greene, W., 2010. Testing hypotheses about interaction terms in nonlinear models. Eco-
nomics Letters 107 (2), 291–296.
Hofherr, T., Kunz, M., 2010. Extreme wind climatology of winter storms in Germany.
Climate Research 41 (2), 105–123.
Joireman, J., Truelove, H. B., Duell, B., 2010. Effect of outdoor temperature, heat primes
and anchoring on belief in global warming. Journal of Environmental Psychology 30 (4),
358–367.
Keller, C., Siegrist, M., Gutscher, H., 2006. The role of the affect and availability heuris-
tics in risk communication. Risk Analysis 26 (3), 631–639.
Leiserowitz, A., 2006. Climate change risk perception and policy preferences: The role
of affect, imagery, and values. Climatic Change 77 (1-2), 45–72.
Li, Y., Johnson, E. J., Zaval, L., 2011. Local warming daily temperature change influ-
ences belief in global warming. Psychological Science.
30
Likert, R., 1932. A technique for the measurement of attitudes. Archives of Psychology.
Long, J. S., Freese, J., 2006. Regression models for categorical dependent variables us-
ing Stata. Stata Press.
Lorenzoni, I., Hulme, M., 2009. Believing is seeing: Laypeople’s views of future socio-
economic and climate change in England and in Italy. Public Understanding of Science.
Marquart-Pyatt, S. T., McCright, A. M., Dietz, T., Dunlap, R. E., 2014. Politics eclipses
climate extremes for climate change perceptions. Global Environmental Change 29,
246–257.
McCright, A. M., Dunlap, R. E., 2011. Cool dudes: The denial of climate change among
conservative white males in the United States. Global Environmental Change 21 (4),
1163–1172.
McCullagh, P., 1980. Regression models for ordinal data. Journal of the Royal Statistical
Society. Series B (Methodological), 109–142.
McCullagh, P., Nelder, J. A., 1989. Generalized linear models. Chapman & Hall.
Menny, C., Osberghaus, D., Pohl, M., Werner, U., 2011. General knowledge about cli-
mate change, factors influencing risk perception and willingness to insure. ZEW-
Centre for European Economic Research Discussion Paper (11-060).
Myers, T. A., Maibach, E. W., Roser-Renouf, C., Akerlof, K., Leiserowitz, A. A., 2013.
The relationship between personal experience and belief in the reality of global
warming. Nature Climate Change 3 (4), 343–347.
O’Connor, R. E., Bord, R. J., Fisher, A., 1999. Risk perceptions, general environmental
beliefs, and willingness to address climate change. Risk Analysis 19 (3), 461–471.
Osberghaus, D., 2015. The determinants of private flood mitigation measures in
Germany–Evidence from a nationwide survey. Ecological Economics 110, 36–50.
31

Pachauri, R. K., Allen, M. R., Barros, V., Broome, J., Cramer, W., Christ, R., Church,
J., Clarke, L., Dahe, Q., Dasgupta, P., et al., 2014. Climate change 2014: Synthesis
Report. Contribution of working groups I, II and III to the fifth assessment report of
the Intergovernmental Panel on Climate Change. IPCC.
Peacock, W. G., Brody, S. D., Highfield, W., 2005. Hurricane risk perceptions among
Florida’s single family homeowners. Landscape and Urban Planning 73 (2), 120–135.
Peterson, B., Harrell Jr, F. E., 1990. Partial proportional odds models for ordinal re-
sponse variables. Applied Statistics, 205–217.
Poortinga, W., Spence, A., Whitmarsh, L., Capstick, S., Pidgeon, N. F., 2011. Uncer-
tain climate: An investigation into public scepticism about anthropogenic climate
change. Global Environmental Change 21 (3), 1015–1024.
Siegrist, M., Gutscher, H., 2006. Flooding risks: A comparison of lay people’s percep-
tions and expert’s assessments in Switzerland. Risk Analysis 26 (4), 971–979.
Siegrist, M., Gutscher, H., 2008. Natural hazards and motivation for mitigation behav-
ior: People cannot predict the affect evoked by a severe flood. Risk Analysis 28 (3),
771–778.
Sjöberg, L., 2000. Factors in risk perception. Risk Analysis 20 (1), 1–12.
Spence, A., Poortinga, W., Butler, C., Pidgeon, N. F., 2011. Perceptions of climate
change and willingness to save energy related to flood experience. Nature Climate
Change 1 (1), 46–49.
Terza, J. V., 1985. Ordinal probit: A generalization. Communications in Statistics-Theory
and Methods 14 (1), 1–11.
Thaler, R. H., Benartzi, S., 2004. Save More Tomorrow: Using Behavioral Economics to
Increase Employee Saving . Journal of Political Economy 112 (S1,Papers in Honor of
Sherwin Rosen: A Supplement to Volume 112), S164–S187.
32
Thieken, A. H., Kreibich, H., Müller, M., Merz, B., 2007. Coping with floods: Pre-
paredness, response and recovery of flood-affected residents in Germany in 2002.
Hydrological Sciences Journal 52 (5), 1016–1037.
Tobler, C., Visschers, V. H., Siegrist, M., 2012. Consumers’ knowledge about climate
change. Climatic Change 114 (2), 189–209.
Tversky, A., Kahneman, D., 1973. Availability: A heuristic for judging frequency and
probability. Cognitive Psychology 5 (2), 207–232.
van der Linden, S., 2014. On the relationship between personal experience, affect and
risk perception: The case of climate change. European Journal of Social Psychology
44 (5), 430–440.
van der Linden, S., 2015. The social-psychological determinants of climate change risk
perceptions: Towards a comprehensive model. Journal of Environmental Psychology
41, 112–124.
Wachinger, G., Renn, O., Begg, C., Kuhlicke, C., 2013. The risk perception paradox –
Implications for governance and communication of natural hazards. Risk Analysis
33 (6), 1049–1065.
Weber, E. U., 2006. Experience-based and description-based perceptions of long-term
risk: Why global warming does not scare us (yet). Climatic Change 77 (1-2), 103–120.
Whitmarsh, L., 2008. Are flood victims more concerned about climate change than
other people? The role of direct experience in risk perception and behavioural re-
sponse. Journal of Risk Research 11 (3), 351–374.
Wicker, P., Becken, S., 2013. Conscientious vs. ambivalent consumers: Do concerns
about energy availability and climate change influence consumer behaviour? Eco-
logical Economics 88, 41–48.
Williams, R., 2006. Generalized ordered logit/partial proportional odds models for
ordinal dependent variables. Stata Journal 6 (1), 58.
33

Wolf, J., Moser, S. C., 2011. Individual understandings, perceptions, and engagement
with climate change: Insights from in-depth studies across the world. Wiley Interdis-
ciplinary Reviews: Climate Change 2 (4), 547–569.
Zaalberg, R., Midden, C., Meijnders, A., McCalley, T., 2009. Prevention, adaptation,
and threat denial: Flooding experiences in the Netherlands. Risk Analysis 29 (12),
1759–1778.
34