risk report 2020
TRANSCRIPT

1 Introduction | CPH Risk Report 2020
Risk Report
2020

2 Introduction | CPH Risk Report 2020
1 Introduction ..................................................................................................................................... 3
2 Executive Summary ......................................................................................................................... 4
2.1 Version Française .................................................................................................................... 4
2.2 English Version ........................................................................................................................ 5
3 General Risk management .............................................................................................................. 6
3.1 Risk Profile ............................................................................................................................... 6
3.2 Risk objectives and policies ..................................................................................................... 6
3.3 Risk Processes .......................................................................................................................... 7
3.3.1 ICAAP (Internal Capital Adequacy Assessment Process) ................................................. 7
3.3.2 Recovery Plan .................................................................................................................. 7
3.4 Hedging and risk mitigating ..................................................................................................... 7
4 Solvency Position ............................................................................................................................. 8
4.1 Evolution overall solvency ....................................................................................................... 8
4.2 Own funds ............................................................................................................................. 10
4.3 Capital requirements ............................................................................................................. 10
5 Credit Risk Management ............................................................................................................... 12
5.1 Exposure to retail credit risk ................................................................................................. 12
5.2 Exposure to non‐retail credit risk of investment portfolio ................................................... 14
5.3 Capital buffers ....................................................................................................................... 16
5.4 Zoom on the exposures ......................................................................................................... 18
5.4.1 Government bond positions .......................................................................................... 18
5.4.2 Securitisation positions ................................................................................................. 18
5.4.3 Positions in peripheral countries ................................................................................... 20
6 Other Risk Management Processes ............................................................................................... 20
6.1 Interest rate risk management in the banking book ............................................................. 20
6.2 Operational risk management ............................................................................................... 21
6.3 Liquidity risk management .................................................................................................... 21
6.4 Remuneration policy ............................................................................................................. 21
6.5 Leverage ratio ........................................................................................................................ 22
6.6 Unencumbered assets ........................................................................................................... 22
6.7 Market risk ............................................................................................................................ 22
Appendix: Overview Credit Risk Exposures ........................................................................................... 23

3 Introduction | CPH Risk Report 2020
1 Introduction
In its circular1 published on 3 September 2015, the National Bank of Belgium (BNB) refers to the
European Banking Authority (EBA) guidelines on the disclosure requirements that are covered in Part
Eight of the EU Regulation 575/2013, also known as the Capital Requirement Regulation (CRR). The
mentioned part of the Regulation (articles 430 to 455) is the European transposition of the Pillar 3
disclosure requirements included in the Basel Framework. It aims to address the information
asymmetry by providing stakeholders (like clients, members and investors) with information on the
solvency, risks and risk exposures of financial institutions. The EBA mentions that the access to
information is one of the conditions necessary to promote the transparency of financial institutions
and to contribute to the orderly functioning of financial markets. Disclosure requirements should be a
cornerstone of market discipline, enhancing the ability of stakeholders to assess risk in financial
institutions which may lead them to change their behaviour. Consequently, the EBA believes that
market discipline provides an opportunity for institutions with sound risk management policies and
practices to be rewarded with lower capital costs.
Institutions may decide how frequently to disclose information. Given its low risk profile and its size,
CPH decided to disclose the required information on an annual basis. This report is published on the
website of CPH.
CPH group covers in fact Banque CPH and its subsidiary CPH Life, respectively a credit institution under
Belgian law and an insurance company under Belgian law. Both of them, as Less Significant Institutions
(LSI), are supervised by the National Bank of Belgium (BNB) and the Belgian Financial Services and
Markets Authority (FSMA). This report focusses on Banque CPH. The total balance sheet of CPH Life,
which is a captive insurance company, is considered as not material.
1Circular NBB_2015_25 available on www.nbb.be

4 Executive Summary | CPH Risk Report 2020
2 ExecutiveSummary
2.1 VersionFrançaise
En tant que banque coopérative principalement active dans la partie sud de langue française de la
Belgique, le CPH profite de la proximité et du contact privilégié avec ses clients. Durant les dernières
années, la banque a graduellement étendu ses activités de prêt à des particuliers, à des indépendants
et à des PMEs. Malgré cette expansion et la crise financière, le CPH a été capable de maintenir un taux
de défaillance très bas pour son portefeuille de crédits grâce à ses critères d’acceptations prudents et
sa politique de garanties appropriée en combinaison avec un politique efficiente d’assurance‐crédit
pour certains risques spécifiques.
Entretemps, les revenus générés ont contribué à renforcer la base de fonds propres de la banque
tandis que les besoins en fonds propres réglementaires ont baissé principalement suite au
remplacement du portefeuille pour compte propre, notamment le portefeuille de titrisation, par des
créances clientèle moins consommatrices en fonds propres. La combinaison de la hausse des capitaux
disponibles et de la baisse des besoins en fonds propres a poussé la solvabilité de la banque à la hausse.
Le ratio « Common Equity Tier 1 » de 21,30 % (22,36 % de ratio global de solvabilité) pour le CPH est
clairement au‐dessus la moyenne des banques Belges et Européennes.
L'asymétrie naturelle des échéances dans le banking book entre le côté actif, avec principalement des
crédits retail à moyen‐long terme et le côté passif, avec des dépôts retail à court terme est suivie de
près par le Comité de Direction et le Conseil d’administration de la banque via le Comité des risques.
De plus, la banque gère l’exposition au risque de taux qui est liée à cette asymétrie d’une manière
proactive et dispose d’instruments de couverture pour garder l’exposition dans les limites internes.
Finalement, le CPH a une position de liquidité très solide qui lui permet d’absorber un choc de liquidité
inattendu. Il y a deux raisons pour justifier l’important excédent de liquidité : premièrement, les dépôts
retail sont une source de financement stable et deuxièmement, les positions de haute qualité dans le
portefeuille d’investissement donnent un coussin qu’on peut facilement convertir en cash si c’est
nécessaire.

5 Executive Summary | CPH Risk Report 2020
2.2 EnglishVersion
As a cooperative bank mainly operating in south part french speaking of Belgium, CPH benefits from
its close contacts and privileged relationship with its clients. Over the last years, the bank has gradually
expanded its lending facilities to retail clients, including professionals and small entities. Despite this
expansion and the financial crises, CPH was able to keep the loss rate of the granted loans very low
thanks to the prudent acceptance criteria and an appropriate collateral policy in combination with an
effective credit insurance program for some specific risks.
Meanwhile, the generated earnings steadily enforced the own fund reserve while the capital needs
required by the regulator decreased mainly as a result of the replacement of the investment portfolio,
namely the securitisation positions, by lending facilities to retail client less consuming own funds. The
combination of higher available own funds and lower needs has pushed the Common Equity Tier 1‐
ratio to a fairly comfortable level of 21,30 % (22,36 % global solvency ratio). This is clearly above the
average of both the Belgian and European banking sector.
The natural maturity mismatch in the banking book between on the one hand, the assets principally
middle and long term retail loans and the liabilities principally short term retail deposits on the other
hand is closely followed by the bank’s Management Board and the Board of Directors through the Risk
Committee. The interest rate risk exposure associated to this mismatch is actively managed and
hedging instruments are used in order to keep this risk within the internal limits.
Finally, CPH has a very strong liquidity position enabling the bank to absorb sudden unforeseen
liquidity outflows. There are two reasons for the important excess of liquidity. First, the retail deposits
are a stable funding source and second, the high‐quality positions in the investment portfolio provide
a liquidity buffer that can easily be turned into cash if needed.

6 General Risk management | CPH Risk Report 2020
3 GeneralRiskmanagement
3.1 RiskProfile
CPH is a local, cooperative bank that collects deposits from retail clients on the one hand and provides
credit facilities to households, professionals and small to medium sized entities on the other hand. The
bank aims to keep a close relation with its clients. The bank has 28 branches in Wallonia and Walloon
Brabant and its activities are focused on these regions as well.
The positive evolution of the stock of retail deposits during the last decade underlines the stability of
CPH’s main funding source. The combination of stable retail deposits with a conservative investment
strategy results in a solid liquidity buffer.
The current credit portfolio mainly consists of mortgage and corporate loans. CPH life applies strict
acceptance and collateral criteria in order to mitigate the exposure to the credit risk of its debtors.
CPH only offers standard products and the products are integrated in the internally developed
information system. The full ownership of its applications and the systems enable CPH to achieve its
business objectives with a lean organisation and helps to keep the operating costs under control.
Next to that, CPH is not involved as sponsor in any securitisation and the off‐balance sheet positions
are limited. This makes the balance sheet of the bank shows a low asset encumbrance and has a strong
leverage ratio.
Taking into consideration the previous elements and mainly local activities, our AML exposure is also
reduced.
3.2 Riskobjectivesandpolicies
CPH recognises the importance of a sound risk management in order to sustain the stability and
profitability of the bank. The risk framework is constantly adapted to the evolutions of bank’s activities
and proactively implements the new regulations.
The overall risk policy and risk appetite are defined by the Board of Directors. In order to monitor the
risk profile of the bank, the Board of Directors created a dedicated risk committee.
Each member of the CPH’s Management Board is responsible for the proper risk management of the
activities and functions falling under his responsibility (first line of risk management). The independent
Risk Manager (second line of risk management) reviews and assesses the measures implemented by
the business and he supports the business to assure the compliance with the relevant regulations.
Finally, as mentioned in the previous paragraph, the Board of Directors with the dedicate risk
committee supervises risk policies applied across the bank and intervenes where needed (third line of
risk management). Upfront these risk management Committees, there is the Audit Committee and the
internal audit department that regularly evaluates the different risk processes of the bank.

7 General Risk management | CPH Risk Report 2020
3.3 RiskProcesses
3.3.1 ICAAP(InternalCapitalAdequacyAssessmentProcess) Each year since 2007, the CPH Management Board is conducting an ICAAP. The results of this process
are documented in a comprehensive report transmitted to the National Bank of Belgium (NBB). The
NBB compares the ICAAP results with the outcome of the SREP (Supervisory Review Process), that is
the assessment of risks and capital requirement undertaken by the NBB using its own internal
methodology. Both the ICAAP and SREP are the cornerstones of the so called Pillar 2 of the Basel
framework. Recall that the Pillar 1 covers the general capital requirements and since 2015 the
standardised liquidity requirements.
The outcome of the SREP over the last years has not led to fundamental differences with the outcome
of the ICAAP. Moreover, CPH largely exceeds both the Pillar 1 and Pillar 2 requirements.
3.3.2 RecoveryPlan
The European Commission has developed a crisis management framework in response to the recent
banking crisis. One of the corner stones of the EU crisis management is the Bank Recovery and
Resolution Directive. This directive imposes on banks to design of own recovery plan whereas the
national competent authorities are asked to draft their resolution plan on a national level. The recovery
plan forces banks to identify its potential weaknesses and assess the effectiveness of plausible options
to recover from very severe events without state intervention.
The management board appointed two of its members to design the plan. During the implementation,
CPH consulted the NBB and integrated the feedback of the NBB in the plan. The final recovery plan
was approved by the Board of Directors and transferred for the first time to the NBB in 2015. This plan
is reviewed on an annual basis.
3.4 Hedgingandriskmitigating
CPH has a natural exposure to credit and interest rate risk. In order to limit these exposures and align
them with its risk appetite, the bank has put strict risk mitigation procedures in place. First, the
availability and the quality of collateral is a key element in the bank’s counterparty risk assessment of
each individual credit request. The high recovery rate of defaulted credit openings proofs the
effectiveness of the banks collateral policy. Second, the bank is actively managing its interest rate risk
position of its core banking activities and it has developed a hedging strategy to keep the exposure to
interest rate swings within the bank’s risk appetite. The hedging strategy is based on a well‐balanced
mix of interest rate derivatives. The effectiveness of the hedges is closely monitored by the bank’s risk
management.

8 Solvency Position | CPH Risk Report 2020
4 Solvency Position
4.1 Evolutionoverallsolvency
CPH Banque has an unambiguous objective to fulfil all European and national regulatory capital
requirements, more in particular those specified in CRR2 for the banking activities and Solvency II3 for
its insurance activities. In addition to the regulatory requirements, CPH aligns its objectives with the
recommendations of the Conseil National de la Coopération, de l’Entrepreneuriat social et de
l’entreprise Agricole, this is the Belgian consultative intuition established by the Belgian law of 20 July
1955 in order to promote the principles of a co‐operative statute and preserve the co‐operative ideal.
Therefore, the bank does not aim at a pure capitalistic return but at a sustainable evolution with
respect for its social role. The general conditions for co‐operative institutions limit the yearly dividend
of the co‐operative shares to a maximum of 6%.
Since its creation and over time, CPH was able to build a solid capital basis that enforces its total
independency and allows staying a local bank where both clients and employees know each other and
feel respected. Moreover, as a member of the Confédération Internationale des Banques Populaires,
CPH benefits form an implicit support of this international confederation and its members if needed.
Even during the financial crisis, CPH Banque was able to maintain a Common Equity Tier 1 (CET1) ratio
above 12%, which is far above the Basel II and even the Basel III thresholds. Over the last three years,
the CET1 steadily evolved to a solid 21,30 % at the end of 2020.
2CRR: REGULATION (EU) No 575/2013 of 26 June 2013 on prudential requirements for credit institutions and investment firms and amending Regulation (EU) No 648/2012 3 Solvency II DIRECTIVE 2009/138/EC of 25 November 2009 on the taking‐up and pursuit of the business of Insurance and Reinsurance (Solvency II)

9 Solvency Position | CPH Risk Report 2020
The average CET1 ratio of Belgian banking sector remained stable at 15,6%4 in 2019. On a European
point of view EBA shows CET1 ratio of 15 %6 at the end of June 2020 so one can conclude that CPH’s
solvency position clearly outperforms both the Belgian and the European sector. The CPH Solvency
ratio is 22,36 % end 2020.
Below, one finds more details on the evolution of CPH’s available and required capital since 2008.
Evolution available and required capital Banque CPH
Year Required Capital
CET1 Available Capital
Tier 2 Available Capital
Total Available Capital
CET1 ratio Total capital
ratio
2008 75 431 474 140 328 291 140 328 291 14.88% 14.88%
2009 91 052 500 150 618 319 150 618 319 13.23% 13.23%
2010 102 315 077 167 093 829 167 093 829 13.07% 13.07%
2011 109 109 072 172 196 965 172 196 965 12.63% 12.63%
2012 116 256 186 177 506 896 177 506 896 12.21% 12.21%
2013 112 696 099 193 327 319 193 327 319 13.72% 13.72%
2014 112 033 732 211 490 475 5 000 000 216 490 475 15.10% 15.46%
2015 112 636 517 226 668 013 5 000 000 231 668 013 16.10% 16.45%
2016 115 865 713 241 453 154 10 000 000 251 453 154 16.67% 17.36%
2017 118 543 719 258 378 507 10 000 000 268 378 507 17.44% 18.11%
2018 118 335 876 266 876 959 16 750 000 283 626 959 18.04% 19.17%
2019 124.206.684 280.109.885 16.750.000 296.859.885 18,04% 19,12%
2020 126.734.014 337.457.697 16.750.000 354.207.697 21,30% 22,36%
4 Source BNB Financial Stability Report 2020 https://www.nbb.be/doc/ts/publications/fsr/fsr_2020.pdf
6 Source ECB Risk assessment report December 2020 https://www.eba.europa.eu/sites/default/documents/files/document_library/Risk%20Analysis%20and%20Data/Risk%20Assessment%20Reports/2020/December%202020/961060/Risk%20Assessment_Report_December_2020.pdf

10 Solvency Position | CPH Risk Report 2020
4.2 Ownfunds
CPH’s own funds mainly consists of high‐quality common equity tier 1 capital, namely co‐operative
shares (paid up capital) and retained earnings accumulated over the past two decades (other reserves
and funds for general banking risk). More than half of the retained earnings are placed in the funds
for general banking risk which underlines CPH’s intention to lock in its capital buffer and maintain a
large cushion to absorb unexpected losses. At the end of 2020, CPH owns 100 % of CPH Life5 shares
corresponding to an interest of € 6 million. This participation is deducted from the common equity tier
1 capital.
The tier 2 capital only consists of an Internal Security Fund in order to cover general unrealised and
unexpected credit losses. This Internal Security Fund is also considered under IFRS referential as own
funds.
The total own funds have increased by more than € 57,3 million between 31 December 2019 and 31
December 2020. The Tier 1 increase is mainly explained by the bank’s contribution to the Fund for
general banking risks (+€ 6 million) and to accumulated other comprehensive income (+€ 48 million)
in relation with some unrealised capital gains on investments in REITs.
4.3 Capitalrequirements
The Pillar 1 capital requirements mainly consist of capital needs for the bank’s credit risk under the
standardised approach6. CPH only offers standard products like mortgage loans and consumer credits
to households or commercial loans to professionals and small to medium sized entities. Given the low
loss rate of CPH retail loans portfolio and the Belgian sector in general, the standardised approach is a
conservative risk measure since it does not fully recognise the low risk profile like more sophisticated
internal models do. During the internal capital adequacy assessment (ICAAP), the bank puts the
conservative of the standard model for its retail loan portfolio into evidence.
5 CPH Life is an insurance company under Belgian law 6 defined in TITLE II CAPITAL REQUIREMENTS FOR CREDIT RISK, CHAPTER 2 Standardised Approach of the EU Regulation 575/2013 (CRR)
Composition Own funds 31‐12‐20 31‐12‐19 31‐12‐18
TIER 1 CAPITAL 337.457.697 280.109.895 266.876.959
COMMON EQUITY TIER 1 CAPITAL 337.457.697 280.109.895 266.876.959
Paid up capital instruments 81.923.547 83.011.004 83.950.182
Accumulated other comprehensive income 48.353.667 3.145.742
Other reserves 91.711.105 87.323.888 82.844.648
Funds for general banking risk 124.000.000 118.000.000 104.500.000
(‐) Goodwill accounted for as intangible asset
(‐) Other intangible assets before deduction of deferred tax liabilities ‐2.530.622 ‐2.244.997 ‐1.583.613
(‐) CET1 instruments of financial sector entities where the institution has a significant investmen ‐6.000.000 ‐5.980.000 ‐5.980.000
ADDITIONAL TIER 1 CAPITAL
TIER 2 CAPITAL 16.750.000 16.750.000 16.750.000
General credit risk adjustments (Internal Security Fund) 16.750.000 16.750.000 16.750.000
TOTAL OWN FUNDS 354.207.697 296.859.895 283.626.959

11 Solvency Position | CPH Risk Report 2020
It is commonly known that internal models for credit risk result in lower capital requirements and thus,
requirements under the standard formula are considered to be a conservative risk measure, especially
in a Belgian mortgage loan context. The conservatism of the standard model for credit is considered in
the internal capital adequacy assessment. The impact of Covid‐19 crisis is actually under control.
CPH’s intermediation activities, in particular retail deposits on passive side and credits on active side
of the balance sheet, have an inherent interest rate risk component. The internal assessment for
interest rate risk of the banking book activities is based on both internal and regulatory indicators.
These indicators provide different angles on interest rate sensitivities of the bank. The interest rate
risk hedging positions limit the negative impact on the both income and economic value of the bank’s
banking book.
CPH opts for the Basic Indicator Approach (BIA) for operational risk capital requirements. Since CPH is
not involved in exotic banking activities and it has a typical organisation, the operational risk
standardised model is considered to be an appropriate risk measure for a bank like CPH.
The 2020 ICAAP exercise confirmed the adequacy of CPH’s capital buffer. The available own funds
largely exceed both the pillar 1 and the internal capital needs. This important excess was also
confirmed by the outcome of the Supervisory Review Process conducted by the Belgian National Bank
(BNB) during the autumn of 2019.
Own funds Pillar 1 31‐12‐20 31‐12‐19 31‐12‐18 31‐12‐17
Required Capital for Credit Risk 118.961.794 115.871.011 109.253.898 109.340.858
Required Capital for Operational Risk 7.759.936 8.303.582 9.017.991 9.088.911
Required Capital for Market Risk 12.284 32.091 63.987 113.949
Total Required Capital 126.734.014 124.206.684 118.335.876 118.543.719

12 Credit Risk Management | CPH Risk Report 2020
5 CreditRiskManagement
The bank’s credit risk exposure can be almost evenly split in retail and non‐retail credit risk. The
exposure to retail risks rose from € 1.990 million at the end of 2019 to € 2.040 million at the end of
2020 mainly due to the net retail credit production of 2020. The exposures classified as “others” are
mainly accounting items related to the amortisation of renovations to own properties and (IT)
infrastructure.
5.1 Exposuretoretailcreditrisk
CPH, as local bank in close contact to its clients, aims at providing a wide range of credit facilities to
natural persons, to professionals and small or medium sized enterprises located in its geographical
area of activities. The bank can follow its clients outside its initial area.
The low historical credit loss rates over the last years proof the conservatism of CPH and the
effectiveness of the mitigation actions, including reinsurance. The credit risk policy targets a secure
balance between risk and return that takes the overall business strategy defined by the Board of
Directors into account. The policy consists of the following components:
a general code of conduct
a code of conduct to frame‐up the yearly production objectives
a credit acceptance process
a monitoring of limits per counterparty
a supervision and control of the credit activities
a code of conduct for classification and provisioning
The performing loans are subjected to a tracking with automated reminders in case of delays in
payments. CPH has an automated process to classify credit lines under “uncertain evolution”. The local
branches are in charge of the follow‐up of the credit lines under uncertain evolution with the support

13 Credit Risk Management | CPH Risk Report 2020
of the front office and litigation department. Several initiatives can be considered going from a
renegotiation of the credit modalities to the liquidation of borrower’s belongings. Credit lines with
more than 90 days past due are tracked by the litigation department. The litigation department
evaluations these lines on an individual basis and assesses the value of the underlying collateral in
order to book impairments if needed.
Mortgage loans represent more than 77 % of the total retail exposure and their share is slightly growing
if not stable. Investment loans to professionals and small or medium sized companies represent 11%
of the total non‐retail exposure. The consumer loans are split into two groups: loans where the credit
risk is reinsured and loans where the credit risk is taken by CPH. The two groups represent about 9%
of the overall retail exposure. Between the end of 2019 and the end of 2020, the situation remains
stable.
Credits to “retail” clients with an exposure above €1 million are considered as non‐retail from a
regulatory point of view but these loans are also subjected to the policy as described above.
Nevertheless, there is close monitoring of all exposures above 1 million with specific limits per sector.

14 Credit Risk Management | CPH Risk Report 2020
5.2 Exposuretonon‐retailcreditriskofinvestmentportfolio
The credit risk policy linked to the investment portfolio aims at an appropriate balance between risk
and return taking the global strategy defined by the Board of Directors into account. The policy is based
on several elements.
The first element is a code of conduct based on the following courses of action: (1) obtain a majority
of investment grade positions and (2) maximize the diversification by limiting the exposures per region,
per underlying instruments, and if applicable per tranche of the same deal. The limit framework for
the investment portfolio enables the monitoring and controlling of the desired level of diversification
in the portfolio.
In practice, the supervision of the investment portfolio takes place at different levels of CPH’s
organisation. On the one hand, there is the overall monitoring performed by external audit, internal
audit, risk management and the Board of Directors (via the Risk Committee). On the other hand, the
Management Board and the “Front Office Treasury (FOT)” committee are supervising the daily
portfolio management. The FOT committee is a technical body (with no decision power) that regularly
reviews the evolution of the portfolio. As a member of this committee, the external expert assures an
independent and professional oversight of the portfolio. Finally, the Front Office Treasury (FOT)
department is responsible for the close follow‐up of each individual position. For this follow, the FOT
department makes use of reports published by specialised agencies, traders and other trustees
extended by its own expertise of the financial markets and by information of specialised financial news
providers.
The investment portfolio is historically split into four sub‐portfolios: Corporate bonds, Securitisation,
Government bonds (Govies) and Term Deposits. The size of the Term Deposit sub‐portfolio is small
compared to three others (see the table at below the next graph).
At the end of 2008, CPH had an exposure of about €354 million in securitisation positions and €155
million in Govies and €157 million in Corporates. The securitisation portfolio is in run‐off since then
and only € 25 million remains on December 31, 2020. The position in government bonds has gradually
increased until 2013 and decreased until 2019. It is now increasing again to end up to € 221 million on
December 31, 2020. The exposure in corporate bonds remained more or less stable during the last 10
years.

15 Credit Risk Management | CPH Risk Report 2020
Govies Securitisation Corporate Term Deposits Total
31-12-08 155 354 157 79 74631-12-09 195 313 281 66 85631-12-10 286 289 337 ‐2 91131-12-11 397 271 349 ‐3 101431-12-12 489 203 362 ‐34 102031-12-13 577 154 372 1 110531-12-14 490 130 352 ‐2 97031-12-15 387 96 368 ‐27 82431-12-16 292 68 350 0 71131-12-17 220 57 313 ‐29 56131-12-18 212 45 301 37 59531-12-19 182 31 351 53 61731-12-20 221 25 343 0 589
Exposure investment portfio in million eur

16 Credit Risk Management | CPH Risk Report 2020
5.3 Capitalbuffers
CPH uses the standardised approach to all its credit risk exposures. Larger banks tend to opt for internal
credit risk models what typically result in significantly lower capital requirements.
The total capital requirements for credit risk on December 31, 2020 is about € 118,9 million versus €
115,8 million at the end of 2019. The capital requirements for non‐retail credit risks increased (+ €
2 million) and those for retail credit risk also increased (+€ 1 million).
A closer look to the evolution capital requirements between December 31, 2019 and December 31,
2020 for retail credit risks learns that the needs for the mortgage loans went up by € 1,3 million which
is in line with the production of mortgage loans in 2020. Also, the investment loans required less capital
at the end of 2020 (‐€ 0.025 million).

17 Credit Risk Management | CPH Risk Report 2020
The capital requirements for non‐retail credit risk follow increased in 2020. This is mainly explained by
the increase of the equity portfolio (+€ 5,5 million).
The securitisation activity is in run‐off. On December 31, 2020, CPH had to put € 4 million aside to
cover the counterparty risk associated to these positions, this is € 2,7 million less than 12 months
earlier.
The needs for corporate and other exposures remain globally stable.

18 Credit Risk Management | CPH Risk Report 2020
5.4 Zoomontheexposures
An overview of all credit risk exposures grouped by type is available in appendix on page 24. In the
following subsections, the principal kinds of counterparties in the investment portfolio are highlighted.
5.4.1 Governmentbondpositions
Over the last years, CPH has had both short term (maturity shorter than 1 year) and long‐term positions
in government bonds but at end of 2015, all short term positions were redeemed. The positions in
Belgian government bonds (OLOs) went up by € 57 million during 2020 due to new positions. A new
long term exposure to France has been purchased. The position on Spain went down by € 10,2 million
during 2020.
The positions on other countries remain quite stable.
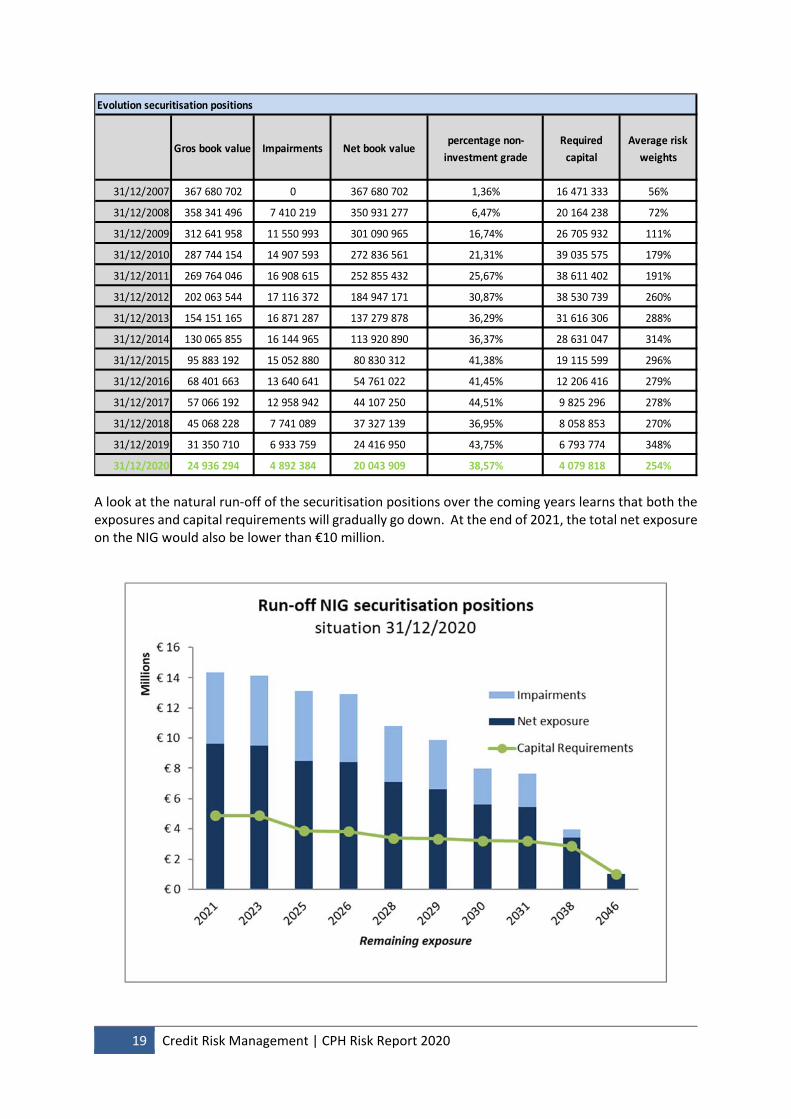
5.4.2 Securitisationpositions The portfolio with securitisation positions has been put in run‐off in 2008. Since then, the exposure in
these structured products has been reduced by the natural run‐off of the portfolio. After impairments,
the remaining exposure in book value was € 20,04 million on December 31, 2020, of which 38,57 %
positions in non‐investment grade bonds. The non‐investment grade bonds are less liquid and thus
less easy to sell at a fair price. Nevertheless, the capital requirements decrease by 39,9 % (‐€ 2,71
million) between December 31, 2019 and December 31, 2020 while the average Basel III risk weight of
the standard formula for credit risk remains stable. The average risk weight is a proxy for the quality
of the portfolio so the average quality of the remaining portfolio remained more or less stable over
the last five years.
19 Credit Risk Management | CPH Risk Report 2020
A look at the natural run‐off of the securitisation positions over the coming years learns that both the exposures and capital requirements will gradually go down. At the end of 2021, the total net exposure on the NIG would also be lower than €10 million.
Gros book value Impairments Net book valuepercentage non‐
investment grade
Required
capital
Average risk
weights
31/12/2007 367 680 702 0 367 680 702 1,36% 16 471 333 56%
31/12/2008 358 341 496 7 410 219 350 931 277 6,47% 20 164 238 72%
31/12/2009 312 641 958 11 550 993 301 090 965 16,74% 26 705 932 111%
31/12/2010 287 744 154 14 907 593 272 836 561 21,31% 39 035 575 179%
31/12/2011 269 764 046 16 908 615 252 855 432 25,67% 38 611 402 191%
31/12/2012 202 063 544 17 116 372 184 947 171 30,87% 38 530 739 260%
31/12/2013 154 151 165 16 871 287 137 279 878 36,29% 31 616 306 288%
31/12/2014 130 065 855 16 144 965 113 920 890 36,37% 28 631 047 314%
31/12/2015 95 883 192 15 052 880 80 830 312 41,38% 19 115 599 296%
31/12/2016 68 401 663 13 640 641 54 761 022 41,45% 12 206 416 279%
31/12/2017 57 066 192 12 958 942 44 107 250 44,51% 9 825 296 278%
31/12/2018 45 068 228 7 741 089 37 327 139 36,95% 8 058 853 270%
31/12/2019 31 350 710 6 933 759 24 416 950 43,75% 6 793 774 348%
31/12/2020 24 936 294 4 892 384 20 043 909 38,57% 4 079 818 254%
Evolution securitisation positions

20 Other Risk Management Processes | CPH Risk Report 2020
5.4.3 Positionsinperipheralcountries
CPH holds some positions in peripheral countries (inside and outside the EU) with only a limited
exposure to countries having a rating below investment grade (<Baa3). Spanish and Italian Corporate
bonds represent the most important share.
6 OtherRiskManagementProcesses
6.1 Interestrateriskmanagementinthebankingbook The bank is actively managing its interest rate risk and uses several indicators to monitor the exposure
to interest rate shocks. One of the indicators is the one defined by the BNB, the so‐called “90.30
report”, that assesses the impact of several interest rate scenarios on the economic value of the bank.
In order to calculate the economic value of its assets and liabilities, several assumptions on the client
behaviour are taken into account like the prepayment rate of the credits and duration of the deposits.
The duration of the deposits is imposed by the BNB and the prepayment rates for each scenario are
estimated by the bank. The internal indicators provide different angles on the duration of the bank’s
own funds. A technical working group defines and reviews the internal indicators and its hypothesis.
Several functions are involved in the bank’s interest rate management while all important decisions
are made on Management Board level.
The risk management regularly performs detailed analyses on the stability and maturity of the retail
deposits and it often reviews the observed prepayment rate of the credit loans. Since 2014, as a result
of the low interest rate regime, the Belgian banking sector observed a refinancing wave of the
mortgage loans. CPH has also observed the phenomena of existing clients asking to review the
conditions of their loan but also new clients transferring their mortgage loan.
In order to keep the interest rate exposure into the desired limits, the bank has developed a hedging
strategy and makes use of interest rate derivatives in the light of this strategy.
Exposures on country with rating lower than A3 at the 31/12/2020
Pays RATING Govies Titrisation Corporate CDS RDV Total
Espagne Baa1 30 577 738 10 735 192 11 764 443 0 ‐14 096 53 063 277
Mexique Baa1 202 345 0 202 345
Italie Baa3 271 005 8 990 942 0 9 261 947
Portugal Baa3 1 476 284 1 990 963 ‐76 737 3 390 510
Total Baa1 ‐ Baa3 30 577 738 12 482 481 22 948 694 0 ‐90 834 65 918 079
Brésil Ba2 440 026 735 687 1 175 713
Grèce Ba3 3 008 971 ‐452 100 2 556 871
Total Ba1 ‐ Ba3 440 026 3 008 971 735 687 0 ‐452 100 3 732 584
World ‐ Earth Sans 2 403 784 0 2 403 784
Total Monde 0 2 403 784 0 0 0 2 403 784
Total 31 017 764 17 895 235 23 684 381 0 ‐542 934 72 054 447

21 Other Risk Management Processes | CPH Risk Report 2020
6.2 Operationalriskmanagement
The bank’s risk management plays a coordinating role in the operational risk management. The risk
management began the renewing of the operational risk cartography in 2020. Next to that, there is an
internal procedure prescribing that the employee or team who reports an incident is supposed to write
an incident report. Depending on the materiality of the incident, a post‐mortem analysis is discussed
on management board level.
The bank maintains a business continuity plan that can be deployed in case of extreme events. An
important component of the plan is the disaster recovery plan for the IT infrastructure. This plan is
tested once a year and reviewed when needed.
Finally, given the size and low numbers of internal incidents, CPH has opted for the Basic Indicator
Approach (BIA) to measure the capital requirements for operational risk.
6.3 Liquidityriskmanagement The major funding source of the banks is retail deposits. During the financial crisis, CPH was able to
strengthen the stock of retail deposits, more details on the evolution of the deposits can be find in
the bank’s annual report7. There is a close monitoring of the in‐ and outflows of the deposits by the
bank’s Management Board. Meanwhile, the bank has built a solid stock of highly liquid assets that
can absorb sudden extreme liquidity needs.
The company performs each year the ILAAP (Internal Liquidity Adequacy Assessment Process)
exercise which confirms the strong liquidity position of the bank.
6.4 Remunerationpolicy CPH’s remuneration policy is available on the public website (URL: https://www.cph.be/la‐banque‐cph/corporate‐governance.html ).
7 Annual report is available on : https://www.cph.be/la‐banque‐cph/corporate‐governance.html

22 Other Risk Management Processes | CPH Risk Report 2020
6.5 Leverageratio
The leverage ratio is a popular solvency indicator in the Anglo‐Saxon world since it is straightforward
to compute and it is used across different business sectors. The regulatory minimum is fixed by the
European Banking Authority at 3%. On December 31, 2020, CPH Tier 1 capital represented 11,08 % of
its total expose which is more than three time the proposed regulatory minimum of 3%.
6.6 Unencumberedassets Encumbered assets refer to assets that are securing liabilities in the event that an institution fails to
meet its financial obligations. The typical transactions that are collateralised or asset‐backed are
repurchase agreements (repos), securitisations, covered bonds, or derivatives. The higher the number
of unencumbered assets, the better the depositors and even (cooperative) shareholders are protected
in case of financial distress.
CPH has no securitisation program, unlike some major (Belgian) banks that have repackaged a part of
their retail loans. This makes that about 95% of CPH assets are unencumbered, which is a high number.
Only the remaining 5% is collateral needed for the repos with the National Bank of Belgium (NBB) and
for the derivative positions.
6.7 Marketrisk
Market risk is the risk of loss due to unfavourable moves in market variables. Those moves can be due
to exchange rates, prices, interest rates, credit spreads, volatilities. Market risk is then made of interest
rate risk, foreign exchange risk, equity market risk and volatility risk. It occurs either through the
positions of the trading portfolio or through the positions of the banking book. CPH Banque has no
trading portfolio.
The interest rate risk has been developed before at point 6.1.
Exposures to currency risk are on major standard currencies and in relatively small amounts.
We no longer have a trading activity following the banking law of 25 April 2014.
Leverage ratio
31‐12‐20 31‐12‐19 31‐12‐18
Tier 1 capital 337.457.697 280.109.895 266.876.959
Total exposures 3.055.428.700 2.858.114.446 2.616.959.289
Regulatory adjustments ‐8.530.622 ‐8.224.997 ‐7.563.613
Total exposures for the calculation of the leverage ratio 3.046.898.078 2.849.889.449 2.609.395.677
Basel III leverage ratio 11,08% 9,83% 10,23%

23 Other Risk Management Processes | CPH Risk Report 2020
Appendix: Overview Credit Risk Exposures