risk review and disclosures under basel iii framework for ... · 4 risk review and disclosures...
TRANSCRIPT

1
Risk review and disclosures under Basel III Framework for the period ended 31 March 2016
1. Backgrounds The Standard Chartered Group (SCB Group or the Group) is an international banking and financial services group particularly focused on the markets of Asia, Africa and the Middle East. Standard Chartered Bank is regulated by the Financial Conduct Authority and Prudential Regulation Authority in the United Kingdom (UK). SCB India (SCBI or the Bank) is a branch of Standard Chartered Bank UK, which is part of the SCB Group. The ultimate parent company of the Bank is Standard Chartered PLC, which is listed on the London Stock Exchange and the Stock Exchanges of Hong Kong and India. Indian branch operations are conducted in accordance with the banking license granted by the Reserve Bank of India (RBI) under the Banking Regulation Act 1949. 2. Overview The Basel Committee on Banking Supervision published a framework for International Convergence of Capital Measurement and Capital Standards (commonly referred to as Basel II), which replaced the original 1988 Basel I Accord. The RBI adopted the same in March 2008. The Basel III implementation schedule for India has commenced from 1 April 2013 and is phased in through to 31 March 2019. Accordingly, for 31 March 2016 reporting purposes, the Bank has calculated its Pillar 1 capital requirement based on Basel III norms. Basel II/III is structured around three “pillars” which are outlined below: Pillar 1 sets out minimum regulatory capital requirements – the minimum amount of regulatory capital
banks must hold against the risks they assume; Pillar 2 sets out the key principles for supervisory review of a bank’s risk management framework and its
capital adequacy. It sets out specific oversight responsibilities for the Board and senior management, thus reinforcing principles of internal control and other corporate governance practices; and
Pillar 3 aims to bolster market discipline through enhanced disclosure by banks. Basel II/III provides three approaches of increasing sophistication to the calculation of credit risk capital; the Standardised Approach (SA), the Foundation Internal Ratings Based Approach and the Advanced Internal Ratings Based Approach (IRB). Basel II also introduced capital requirements for operational risk (OR) for the first time. 3. DF 1 - Scope of Application Name of the head of the banking group to which the framework applies: Standard Chartered Bank India Branches DF 1 - Qualitative Disclosures 3.1. Pillar 1 The SCB Group and local management of the Indian operations recognise that Basel II/III is a driver for continuous improvement of risk management practices and believe that adoption of leading risk management practices are essential for achieving its strategic intent. Accordingly, the Group has adopted the IRB model for the measurement of credit risk covering substantial majority of the portfolio. The Group applies Internal Model Approval model for market risk capital and the Standardised Approach for determining its OR capital requirements. SCBI has adopted RBI’s prevailing Basel II/III regulations related to SA for credit and market risk and Basic Indicator Approach (BIA) for OR for computing local regulatory Pillar 1 capital.

2
Risk review and disclosures under Basel III Framework for the period ended 31 March 2016
3.2. Pillar 2 Pillar 2 requires banks to undertake a comprehensive assessment of their risks and to determine the appropriate amounts of capital to be held against these risks where other suitable mitigants are not available. This risk and capital assessment is commonly referred to as an Internal Capital Adequacy Assessment Process (ICAAP). The range of risks that need to be covered by the ICAAP is much broader than Pillar 1, which covers only credit risk, market risk and OR. The Group has developed an ICAAP framework which closely integrates the risk management and capital assessment processes and ensures that adequate levels of capital are maintained to support the current and projected demand for capital under expected and stressed conditions. The ICAAP framework has been designed to be applied consistently across the organisation to meet the Pillar 2 requirements of local regulators. As a branch of a foreign bank in India, the India ICAAP is largely based on the Group ICAAP framework, so as to maintain consistency in reporting of the risk and capital management aspects. However, wherever necessary, local customisation has been incorporated to align with the RBI requirements. 3.3. Pillar 3 Pillar 3 aims to provide a consistent and comprehensive disclosure framework that enhances comparability between banks and further promotes improvements in risk management practices. The Bank has implemented the requirements laid down by RBI for Pillar 3 disclosure, covering both the qualitative and quantitative items. These are also published in the Bank’s annual report and hosted on the Bank’s website. The risk related disclosures and analysis provided herein below, are primarily in the context of the disclosures required under the RBI’s Pillar 3 – Market Discipline of the Basel III Capital Regulations and are in respect of SCBI, except where required and specifically elaborated, to include other Group entities operating in India. The information provided has been reviewed by senior management and is in accordance with the guidelines prescribed by the RBI. 3.4. Accounting and Prudential Treatment / Consolidation Framework The consolidation norms for accounting are determined by the prevailing Indian Generally Accepted Accounting Principles (GAAP). The regulatory requirements are governed by RBI guidelines. The differences between consolidation for accounting purposes and regulatory purposes are mainly on account of following reasons: 1) Control over other entities to govern the financial and operating policies of the subsidiaries or joint
ventures
As per Indian GAAP, existence of control/joint control to govern the financial and operating policies of the subsidiary or joint venture is necessary for accounting consolidation. However, certain entities such as Non Banking Finance Companies (NBFC) have to be consolidated for regulatory capital adequacy purposes even where the above requirement is not fulfilled. Such cases are where the ability to control financial and operating policies of the entities legally vests with the Parent or Group entities and not with the India branch operations.

3
Risk review and disclosures under Basel III Framework for the period ended 31 March 2016
2) Nature of business of the entities to be consolidated
As per Indian GAAP, subsidiaries are not excluded from consolidation because of dissimilar nature of business activities between subsidiary and other entities within the Group. However, RBI regulations do not require consolidation of entities engaged in insurance business and businesses not pertaining to financial services.
3) Method of consolidation
The accounting consolidation methodology requires ‘line by line’ consolidation and elimination of all inter-group balances. However, for the purpose of regulatory consolidation under the capital adequacy framework, the risk weighted assets (RWA) and capital requirements for each entity can be computed separately by applying the Basel II/III norms as applicable for a bank and simply added together with that of the lead bank in the consolidated group. The Bank has adopted the latter approach for consolidation of entities for limited purpose of capital adequacy framework, as the accounting consolidation method is not appropriate considering the legal ownership pattern of the consolidated entities.
List of group entities considered for consolidation for regulatory purposes is summarised below:
Name Of The Entity / Country Of Incorporation
Whether The Entity Is Included Under Accounting Scope Of Consolidation (Yes / No)
Explain The Method Of Consolidation
Whether The Entity Is Included Under Regulatory Scope Of Consolidation (Yes / No)
Explain The Method Of Consolidation
Explain The Reasons For Difference In The Method Of Consolidation
Explain the reasons if consolidated under only one of the scopes of consolidation
Standard Chartered Bank India Branches
Yes Full Yes For the purpose of regulatory consolidation under the capital adequacy framework, the RWA and capital requirements for each entity can be computed separately by applying the Basel II/III norms as applicable for a bank and simply added together with that of the lead bank in the consolidated group. The Bank has adopted the latter approach for consolidation of entities for limited purpose of capital adequacy framework, as the accounting consolidation method is not appropriate considering the legal ownership pattern of the consolidated entities.
Standard Chartered Investments and Loans (India) Limited
No Not Applicable
Yes
Standard Chartered Securities (India) Limited
No Not Applicable
Yes
St. Helen’s Nominees India Private Limited
No Not Applicable
Yes

4
Risk review and disclosures under Basel III Framework for the period ended 31 March 2016
List of group entities in India not considered for consolidation both under the accounting and regulatory scope of consolidation:
(` in 000s) Name Of The Entity /Country Of Incorporation
Principle activity of the entity Total balance sheet equity (as stated in the accounting balance sheet of the legal entity)
% of bank’s holding in the total equity
Regulatory treatment of bank’s investments in the capital instruments of the entity
Total balance sheet assets(as stated in the accounting balance sheet of the legal entity)
Scope International Private Limited
The company renders the following services to related parties: a) Software development, maintenance & support b) Back office transaction processing and data processing of various banking transactions c) IT support d) Voice call centre services
83,116 0% Not Applicable
9,582,656
Standard Chartered Finance Limited
Marketing services of financial products of Standard Chartered Bank and its Home Assist division provides search and other property related services.
71,907 0% Not Applicable
820,703
Standard Chartered (India) Modeling And Analytics Centre Private Limited.
The company is a captive knowledge process outsourcing company which provides robust and contemporary analytical solutions to the Bank’s businesses across the globe for the purpose of risk management and capital management.
500,000 0% Not Applicable
641,192
Standard Chartered Private Equity Advisory (India) Private Limited
The company is a research unit for Merlion India Fund carrying on activities of industry research and advice by furnishing industry and market feedback.
24,000 0% Not Applicable
644,915
Note: The above data is as per latest un-audited results as at 31 March 2016.
DF 1 - Quantitative Disclosures List of group entities considered for regulatory consolidation: (` in 000s)
Name Of The Entity /Country Of Incorporation
Principle activity of the entity Total balance sheet equity (as stated in the accounting balance sheet of the legal entity)
Total balance sheet assets(as stated in the accounting balance sheet of the legal entity)
Standard Chartered Bank, India Branches
Banking and Financial services 74,400,742 1,298,619,143
Standard Chartered Investments and Loans (India) Limited
Financial services acceptable for NBFC,
other than accepting public deposits eg.
lending, investments, etc.
4,543,850 11,678,376
Standard Chartered Securities (India) Limited
Category I merchant banker, rendering brokering services to retail clients and depository services
2,818,557 2,513,207

5
Risk review and disclosures under Basel III Framework for the period ended 31 March 2016
St. Helen’s Nominees India Private Limited
Nominee business - holding shares / debentures in limited companies on behalf of SCBI and its clients. Security trusteeship business for SCBI.
100 17,938
Note: The above data is as per latest un-audited results as at 31 March 2016
The aggregate amount of capital deficiencies in all subsidiaries not included in the consolidation, i.e., that are deducted and the name(s) of such subsidiaries.
NIL
The aggregate amounts (e.g., current book value) of the bank’s total interests in insurance entities, which are risk-weighted, as well as, their name, their country of incorporation or residence, the proportion of ownership interest and, if different, the proportion of voting power in these entities. In addition, indicate the quantitative impact on regulatory capital of using this method versus using the deduction. Any restrictions or impediments on transfer of funds or regulatory capital within the banking group.
NIL As per extant RBI guidelines
4. DF 2 - Capital Adequacy
DF 2 - Qualitative Disclosures 4.1. Objectives
The Bank’s capital management approach is driven by its desire to maintain a strong capital base to support the development of its business and to meet regulatory capital requirements at all times.
4.2. Approach Strategic, business and capital plans are drawn up annually covering a one to five year horizon. The plans ensure that adequate levels of capital and an optimum mix are maintained by the Bank to support its strategy. This is integrated with the Bank’s annual planning process which takes into consideration business growth assumptions across products and the related impact on capital resources.
The capital plan takes the following into account: Regulatory capital requirements and assessment of future standards; Demand for capital due to business growth, market stresses and potential risks; and Available supply of capital and capital raising options.
The Group uses internal models and other quantitative techniques in its internal risk and capital assessment at an overall Group level. The Bank also considers additional risk types other than those considered under Pillar 1 as part of its ICAAP. Each material risk is assessed, relevant mitigants considered, and appropriate levels of capital determined.
Stress testing and scenario/sensitivity analysis are used to assess the Bank’s ability to sustain operations during periods of extreme but plausible events. They provide an insight into the potential impact of significant adverse events on the Bank’s earnings, risk profile and capital position and how these could be mitigated.
The capital that the Bank is required to hold by the RBI is mainly determined by its balance sheet, off-balance sheet and market risk positions, after applying collateral and other risk mitigants.
6
Risk review and disclosures under Basel III Framework for the period ended 31 March 2016
4.3. Governance The Group operates processes and controls to monitor and manage capital adequacy across the organisation. At a country level, capital is maintained on the basis of the local regulator’s requirements. It is overseen by the country Asset and Liability Committee (ALCO), which is responsible for managing the country balance sheet, capital and liquidity, with the active support and guidance from Group ALCO (GALCO), Operational Balance Sheet Committee (OBSC) and Group Treasury (GT). The responsibility of capital management has been assigned to a dedicated sub-group of ALCO, the Capital Management Forum (CMF). The capital management process is governed by the Capital Planning Framework. Suitable processes and controls are in place to monitor and manage capital adequacy and ensure compliance with local regulatory ratios in all legal entities. These processes are designed to ensure that each entity and the consolidated Bank have sufficient capital available to meet local regulatory capital requirements at all times. 4.4. Mobility of Capital Resources The Bank operates as a branch in India, hence under current RBI regulations it cannot raise capital externally. The Group’s policy in respect of profit repatriation requires that each local entity should remit its profits that are considered surplus to local regulatory minimum requirements. The amount to be remitted/injected and the mix/mode of capital (CET 1 v/s Tier 2) is determined in conjunction with GT, after taking into account local capital adequacy regulations (inclusive of any regulatory buffers), anticipated changes to those regulations, forecast organic growth and Head Office (HO) return expectations. 4.5. Capital Structure CET 1/Tier 1 capital mainly comprises of: i) Capital funds injected by HO. ii) Net profits of each year retained as per statutory norms (currently 25%). iii) Remittable net profits retained in India for meeting regulatory capital requirements. iv) Capital reserves created out of profits on account of sale of immovable properties and held to maturity
investments, as per RBI regulations. The above are not repatriable/distributable to HO as long as the Bank operates in India. Tier 2 capital mainly comprises of: i) 45% of reserve created on revaluation of immovable properties in accordance with the Indian GAAP. ii) General provisions on standard (performing) assets created as per RBI regulations. iii) Reserve created out of unrealised gain on revaluation of investments as per RBI regulations.

7
Risk review and disclosures under Basel III Framework for the period ended 31 March 2016
DF 2 - Quantitative Disclosures
Capital and RWA
As at 31 Mar 2016 (` in 000s)
Solo bank* Consolidated bank*
Tier 1 Capital : 205,829,098 215,362,613
Common Equity Tier I 205,829,098 215,362,613
Head Office Capital 74,400,742 74,400,742
Paid up capital - 7,362,507
Eligible reserves 158,294,060 159,748,538
Illiquid securities reserves (482,341) (482,341)
Intangible assets (excluding DTA) (18,032) (51,201)
Other regulatory adjustments (3,095) (3,095)
DTA deduction (Net of Benefit) (26,362,236) (25,612,535)
Additional Tier I - -
Tier 2 Capital : 10,434,202 10,457,358
Eligible revaluation reserves 2,628,842 2,628,842
General provision and other eligible reserves/provisions 7,805,360 7,828,516
Debt capital instruments eligible to be reckoned as capital funds and included in Lower Tier 2 (of which amount raised during the year Rs. Nil)
- -
Less: Amortisation of qualifying subordinated debts - -
Other regulatory adjustments - -
Total capital base 216,263,300 225,819,971
Minimum regulatory capital requirements
Credit risk 132,453,467 133,778,641
Standardised approach portfolios 99,096,724 100,210,208
Securitisation exposures 1,975,160 1,975,160
Counterparty/settlement risks 25,774,073 25,774,073
Benefit of DTA 5,607,510 5,819,200
Market risk - Standardised duration approach 13,005,786 13,009,621
Interest rate risk 12,299,127 12,299,127
Foreign exchange risk (including gold) 650,700 650,700
Equity risk 55,959 59,794
Counterparty/settlement risks - -
Operational risk - Basic indicator approach 15,128,360 15,546,858
Total minimum regulatory capital requirements 160,587,613 162,335,120
Risk weighted assets and contingents
Credit risk 1,373,998,625 1,387,745,236
Market risk (including counterparty/settlement risks) 134,914,792 134,954,572
Operational risk - Basic indicator approach 156,933,192 161,274,458
Total Risk weighted assets and contingents 1,665,846,609 1,683,974,266
8
Risk review and disclosures under Basel III Framework for the period ended 31 March 2016
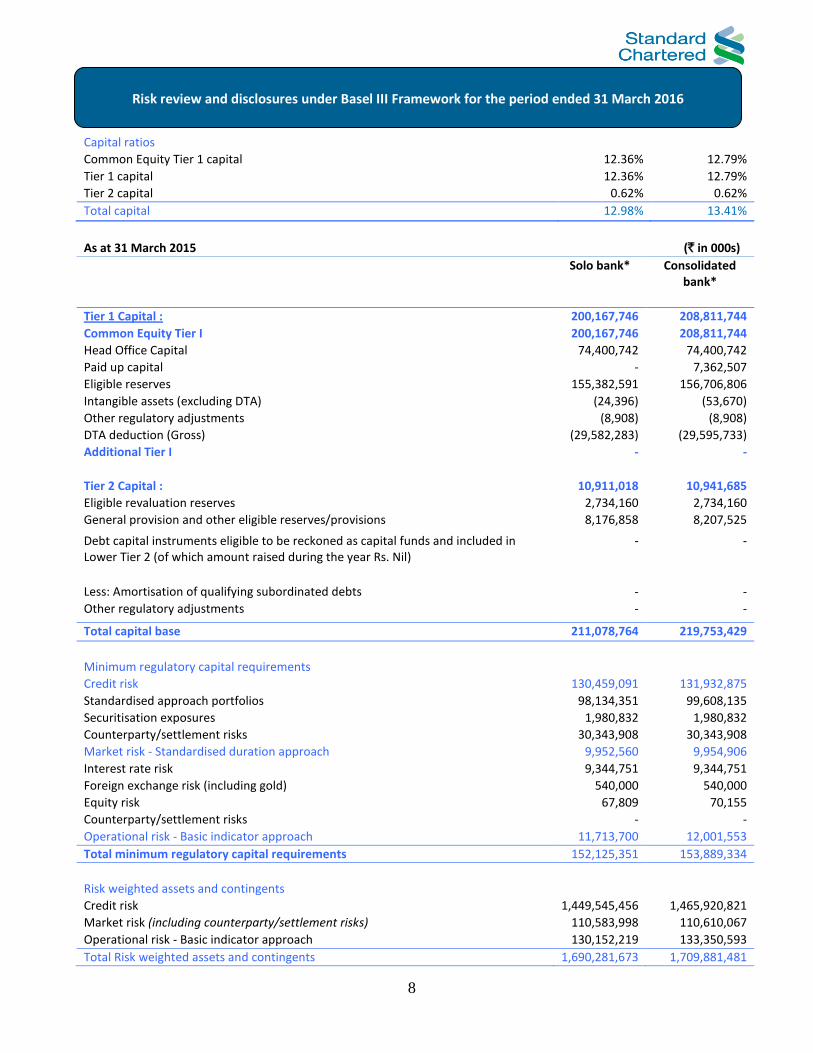
Capital ratios
Common Equity Tier 1 capital 12.36% 12.79%
Tier 1 capital 12.36% 12.79%
Tier 2 capital 0.62% 0.62%
Total capital 12.98% 13.41%
As at 31 March 2015 (` in 000s)
Solo bank* Consolidated bank*
Tier 1 Capital : 200,167,746 208,811,744
Common Equity Tier I 200,167,746 208,811,744
Head Office Capital 74,400,742 74,400,742
Paid up capital - 7,362,507
Eligible reserves 155,382,591 156,706,806
Intangible assets (excluding DTA) (24,396) (53,670)
Other regulatory adjustments (8,908) (8,908)
DTA deduction (Gross) (29,582,283) (29,595,733)
Additional Tier I - -
Tier 2 Capital : 10,911,018 10,941,685
Eligible revaluation reserves 2,734,160 2,734,160
General provision and other eligible reserves/provisions 8,176,858 8,207,525
Debt capital instruments eligible to be reckoned as capital funds and included in Lower Tier 2 (of which amount raised during the year Rs. Nil)
- -
Less: Amortisation of qualifying subordinated debts - -
Other regulatory adjustments - -
Total capital base 211,078,764 219,753,429
Minimum regulatory capital requirements
Credit risk 130,459,091 131,932,875
Standardised approach portfolios 98,134,351 99,608,135
Securitisation exposures 1,980,832 1,980,832
Counterparty/settlement risks 30,343,908 30,343,908
Market risk - Standardised duration approach 9,952,560 9,954,906
Interest rate risk 9,344,751 9,344,751
Foreign exchange risk (including gold) 540,000 540,000
Equity risk 67,809 70,155
Counterparty/settlement risks - -
Operational risk - Basic indicator approach 11,713,700 12,001,553
Total minimum regulatory capital requirements 152,125,351 153,889,334
Risk weighted assets and contingents
Credit risk 1,449,545,456 1,465,920,821
Market risk (including counterparty/settlement risks) 110,583,998 110,610,067
Operational risk - Basic indicator approach 130,152,219 133,350,593
Total Risk weighted assets and contingents 1,690,281,673 1,709,881,481

9
Risk review and disclosures under Basel III Framework for the period ended 31 March 2016
Capital ratios
Common Equity Tier 1 capital 11.84% 12.21%
Tier 1 capital 11.84% 12.21%
Tier 2 capital 0.65% 0.64%
Total capital 12.49% 12.85%
* Solo Bank represents the main licensed bank of the Group in India and consolidated bank includes Group controlled entities operating in India and consolidated for the limited purpose of capital adequacy framework.
5. Risk Management The Bank has a strong governance culture and framework for risk management. The Bank’s risk management principles align with those established at a Group level, and are customised to meet the local regulatory requirements. One of the main risks incurred arises from extending credit to clients through trading and lending operations. Beyond credit risk, the Bank is also exposed to a range of other risk types such as market, operational, liquidity, pension, country cross border, reputational, strategic and other risks that are inherent to its strategy, product range and geographical coverage. 5.1. Risk Management Framework The Bank adds value to clients and generates returns for shareholders by taking and managing risk in line with strategy and risk appetite. Risk management is the set of end-to-end activities through which the Bank makes risk-taking decisions and controls and optimises its risk-return profile. It is a Bank-wide activity and starts right at the front-line. The management of risk lies at the heart of the Bank’s business, as a central role of the Bank is to “warehouse” risk by extending credit to selected clients and to provide products which enable clients to lay off their price and liquidity risks to the Bank. Effective risk management is a central part of the financial and operational management of the Bank and fundamental to its ability to generate profits consistently and maximise the interest of its shareholders and other stakeholders.
The foundation of all risk assessment is aligned to the Group’s Risk Management Framework (“RMF”) and governance structure which has been adopted locally. The Group’s RMF establishes common principles and standards for the management of and control of all risks, and to inform behaviour across the organisation. The core components of the RMF include its risk classifications, risk principles and standards, definitions of roles and responsibilities and governance structure. Under this framework, there are three lines of defence.
The First Line of Defence is that all employees are required to ensure the effective management of risks within the scope of their direct organisational responsibilities.
The Second Line of Defence comprises the Risk Control Owners (“RCOs”) supported by their respective control functions. They are responsible for ensuring that the residual risks within the scope of their responsibilities remain within appetite.
The Third Line of Defence comprises the independent assurance provided by the GIA function, which has no responsibilities for any of the activities it examines. GIA provides independent assurance of the effectiveness of management’s control of its own business activities (the First Line) and of the processes maintained by

10
Risk review and disclosures under Basel III Framework for the period ended 31 March 2016
the Risk Control Functions (the Second Line). As a result, GIA provides assurance that the overall system of control effectiveness is working as required within the RMF.
5.2. Risk Governance The Group’s committee governance structure ensures that risk-taking authority and risk management policies are cascaded down from the GALCO and Group Chief Risk Officer to the appropriate functional and divisional committees. Information regarding material risk issues and compliance with policies and standards is communicated through the business and functional committees up to the Group-level committees, as appropriate. The Country Management Team (CMT) drives and executes the business and governance agenda bringing alignment across the business and the functions so as to maximise and protect the value of the Group’s operations in India. It is responsible for the overall strategic direction of the Bank. It is chaired by Country Chief Executive Officer (CEO) and comprises senior executive members of the Bank. The following committees are the primary committees with oversight of risk and capital for the Bank:
1. ALCO – responsible for the management of capital and liquidity and the establishment of and compliance with policies relating to balance sheet management, including management of the Bank’s liquidity and capital adequacy. It includes the CEO, Chief Financial Officer (CFO), Country Chief Risk Officer (CCRO) and members from the businesses and the economist.
2. Country Risk Committee (CRC) – responsible for the effective management of risks in support of business strategy within the boundaries set by the CMT and business level risk committees. It is responsible for implementing the RMF, including assignment of the roles and responsibilities of RCOs locally. It is also responsible for ensuring that the risk exposures for all types of risks, including liquidity risk, remain within the overall risk appetite and within any specific boundaries advised by CMT and business risk committees. It includes the CEO, CCRO, CFO and members from the businesses and compliance.
Key sub-committees / forums include:
A. The Liquidity Management Forum (LMF) is a sub-group of the ALCO which manages liquidity. It includes members from Finance, Asset Liability Management (ALM) and the businesses.
B. The CMF is a sub-group of the ALCO which manages capital. It includes members from Finance, Risk and the businesses.
C. The Stress Test Forum (STF) is a sub-committee of the CRC which is responsible for reviewing the results of ongoing stress testing including for ICAAP. It includes members from the Finance and Risk functions and the Country Economist.
D. The Country Operational Risk Committee (CORC) is a sub-committee of the CRC which exercises oversight of the Bank’s OR exposures to ensure that it is aligned with the Bank’s RMF. The CORC reviews the Bank’s significant risk exposures and ensures appropriateness and adequacy of mitigating action plans.

11
Risk review and disclosures under Basel III Framework for the period ended 31 March 2016
E. The Credit Issues Committee (CIC) is a sub-committee of the CRC which is responsible for identifying and monitoring corporate clients which show potential signs of weakness and/or may be exposed to higher risks. The CIC reviews the existing Early Alert, Retail and Group Special Assets Management (GSAM) portfolio and new accounts presented to the committee.
5.3. The Risk function
The CCRO manages the Risk function which is independent of the businesses. The role of the Risk function is: To maintain the RMF, ensuring it remains appropriate to the Bank’s activities and is effectively
communicated and implemented across the Bank and for administering related governance and reporting processes.
To uphold the integrity of the Bank’s risk/return decisions, and in particular for ensuring that risks are properly assessed, that risk/return decisions are made transparently on the basis of this proper assessment, and are controlled in accordance with its standards and risk appetite.
To exercise direct risk control ownership for credit, market, country cross-border, liquidity and operational risk types.
The Risk function is independent of the origination, trading and sales functions to ensure that the necessary balance in risk/return decisions is not compromised by short-term pressures to generate revenues. This is particularly important given that most revenues are recognised immediately while losses arising from risk positions only manifest themselves over time. In addition, the Risk function is a centre of excellence that provides specialist capabilities of relevance to risk management processes in the wider organisation. 5.4. Risk Appetite/Tolerance The Group/Bank manages its risks to build a sustainable franchise in the interests of all stakeholders. The Group Risk Tolerance Statement is the Standard Chartered PLC’s Board of Directors’ articulation of the amount of risk that the Group is willing to take in the pursuit of its strategic goals. The Risk Tolerance benchmarks provide a lens to identify risks and concentrations that may cause the Group to exceed its risk appetite. Within the Bank, these risks and concentrations are addressed and governed by various policies and frameworks (eg. RMF, Local Lending Policy, Liquidity Risk Framework, etc) which contain specific limits and parameters to manage them. 5.5. Stress Testing Stress testing and scenario analysis are used to assess the Bank’s ability to maintain operations during periods of severe but plausible stress conditions and to simulate the set of feasible management mitigating actions and their impact on the Bank’s earnings, risk profile and capital position, should such conditions materialise. These conditions may arise from economic, liquidity, legal, political or physical events, or from materialisation of risks that are unique to the Bank. The stress testing framework is designed to: Contribute to the setting and monitoring of the Bank’s ability to take risk; Identify the key risks to strategy, financial position and reputation;

12
Risk review and disclosures under Basel III Framework for the period ended 31 March 2016
Support the development of mitigating actions and contingency plans; Ensure effective governance, processes and systems are in place to co-ordinate and integrate stress testing; Inform senior management; and Ensure adherence to regulatory requirements. A Group level equivalent of STF, led by the Risk function with participation from the businesses, Group Finance, Global Research and GT, aims to ensure that the earnings and capital implications of specific stress scenarios are fully understood allowing informed mitigation actions and construction of contingency plans. This group forum generates and considers pertinent and plausible scenarios that have the potential to adversely affect the Group/Bank’s business. The India STF leverages on work done by Group and, in addition, reviews scenarios specific to the local context, including for ICAAP. Stress tests/impact analysis done in India during 2015-16 included RBI mandated bottom-up stress test and derivatives portfolio stress test, tall tree analysis, etc. 6. DF 3 - Credit Risk: General disclosures DF 3 - Qualitative Disclosures Credit risk is the potential for loss due to the failure of counterparty to meet its obligations to pay the Bank in accordance with agreed terms. Credit exposures may arise from both, the banking and trading books. Credit risk is managed through a framework that sets out policies and procedures covering the measurement and management of credit risk. There is a clear segregation of duties between transaction originators who are in the business units and approvers in the risk function. All credit exposure limits are approved within a defined credit approval authority framework. 6.1. Credit Policies Group-wide credit policies and standards are considered and approved by the Group Risk Committee (GRC), which also oversees the delegation of credit approval and loan impairment provisioning authorities. Policies and procedures specific to each business are established and provide the outline for how credit risk should be monitored and managed in the Bank. These Group policies/procedures are customised locally to incorporate any local regulatory and governance needs. 6.2. Credit Assessment Process
For Corporate and Institutional (C&I) Clients
A pre-sanction appraisal is carried out by the relationship manager through a Business Credit Application (BCA). BCAs are reviewed and duly approved by the credit officer based on the authority delegation given to him. Every account is graded using an alphanumeric grading system for quantifying the risks associated with the counterparty. The grading is based on a Probability of Default (PD) measure, with clients analysed against a range of quantitative and qualitative measures. The numeric grades run from 1 to 14 and some of the grades are further sub-classified A, B or C. Lower credit grades are indicative of a lower likelihood of default. Credit grades 1A to 12C are assigned to performing clients or accounts, while credit grades 13 and 14 are assigned to non-performing or defaulted clients. The Bank’s credit grades are not intended to replicate external credit grades, and ratings assigned by external ratings agencies are not used in determining the Bank’s internal credit grades.
13
Risk review and disclosures under Basel III Framework for the period ended 31 March 2016
Nonetheless, as the factors used to grade a borrower may be similar, a borrower’s poor external rating is kept in mind while assessing his internal credit grade. Nominal Limits, Loss Given Default (LGD), Expected Loss, Exposure At Default (EAD) and RWA are used in the assessment of individual exposures and portfolio analysis. LGD is the credit loss incurred if an obligor defaults. Nominal Limits are used in the delegation of credit approval authority and must be calculated for every transaction to determine the appropriate level of approval. In accordance with the credit authority delegation, significant exposures are reviewed and approved centrally through a credit committee. All the credit facilities are subject to an annual credit review process. The Bank’s Credit Policy, including local/governance/regulatory needs, requires strict adherence to laid down credit procedures and deviations, if any, are approved and captured through the credit appraisal process. Deviation from pre defined policy and procedures/local regulations are flagged off and approved by the relevant authority, if allowed, to ensure that deviations are justified and appropriately approved to avoid any undue loss/risk to the Bank. For Retail Clients Standard application forms are used, which are processed in central units using largely automated processes. Where appropriate to the client, product or market, a manual approval process by SCB Officers is in place. Origination and approval roles are segregated. Distribution of credit products through the new business channel is governed by the New Business Management and Risk Policy and Procedures, which among other requirements, lays down policies governing recruitment, verification, training and monitoring of sales staff. Credit decisions are independent of the sales/marketing functions and there are clear and specific delegated authorities. Department level Key Control Standards/ Control Self Testing/Key Control Indicators and regular assurance reviews and audits ensure compliance to policy and delegated authorities. Credit grades are based on a PD calculated using IRB score models. These models are based on application and behavioural scorecards which make use of external credit bureau information as well as the Bank’s own data. In case of portfolios where such IRB models have not yet been developed, the PD is calculated using portfolio delinquency flow rates and expert judgement, where applicable. An alphanumeric grading system identical to that for C&I clients is used as an index of portfolio quality. 6.3. Credit Approval All credit approval authorities are delegated by the Group Credit Approval Committee (CAC) to individuals based on their judgement and experience and based on a risk-adjusted scale which takes account of the estimated maximum potential loss from a given client or portfolio. Credit origination and approval roles are segregated in all exposures. 6.4. Credit Monitoring The Bank monitors its credit exposures and assesses the impact of trends in the macroeconomic environment which may impact its portfolio performance. For C&I clients, clients or portfolios are placed on ‘Early Alert’ when they display signs of actual or potential weakness. For example, where there is a decline in the client’s position within the industry, financial

14
Risk review and disclosures under Basel III Framework for the period ended 31 March 2016
deterioration, a breach of covenants, non-performance of an obligation within the stipulated period or there are concerns relating to ownership or management. Such accounts and portfolios are subjected to a dedicated process overseen by the CIC. Client account plans, documentation for existing facilities, and credit grades are re-evaluated. In addition, remedial actions are agreed and monitored. Remedial actions include, but are not limited to, exposure reduction, security enhancement, exiting the account or immediate movement of the account into the control of GSAM, the specialist recovery unit, which is independent of the main businesses. For Retail clients, portfolio delinquency trends are monitored continuously at a detailed level. Individual client behaviour is also tracked and is considered for lending decisions. Accounts which are past due are subject to a collections process, managed independently by the Risk function. Charged-off accounts are managed by a specialist recovery team. The micro and small-sized enterprise business is managed in small businesses segment. The credit processes are refined based on exposure at risk and are managed through Programmed Lending, in line with procedures for Retail clients. The CRC is responsible for the effective management of credit risk, among other risks. 6.5. Concentration Risk Credit concentration risk can arise from pools of exposures with similar characteristics which may lead to highly correlated changes in credit quality, for example individual large exposures or significantly large groups of exposures whose likelihood of default is driven by common underlying factors. Credit concentration risk is governed by the Group’s Large Exposure Policy and Local Lending Policy (LLP) / Credit Approval Document (CAD); adherence to these policies is monitored by the CRC. Credit concentration risk is managed via portfolio standards and within concentration caps set for counterparties or groups of connected counterparties, and for industry sectors, credit grade bands, business segments and collateralisation for C&I clients and by products for Retail clients. Credit concentration risk is principally managed based on three components: single-name borrower exposure, industry concentrations and product concentration. For managing single-name concentrations, the Bank monitors compliance to the single and group borrower regulatory guidelines. The LLP establishes industry and credit grade concentration limits. The CRC monitors adherence to these prescribed limits. Any excesses from the ceilings prescribed in the LLP are escalated to the CCRO/CRC/CMT for approval in accordance with the delegated authorities outlined in the LLP. For Retail clients, product concentration risk is managed through portfolio management approach in order to limit concentration, reduce volatility and improve profitability. As part of this approach, the Bank monitors product concentration on a bi-monthly basis. 6.6. Risk Reporting and Measurement Risk measurement plays a central role, along with judgement and experience, in informing risk-taking and portfolio management decisions. It is a primary area for sustained investment and senior management attention. Various risk measurement systems are available to risk officers to enable them to assess and manage the credit portfolio. As the Group has adopted IRB for credit risk under Basel II/III, these include systems to calculate nominal exposure, PD, LGD and EAD on a transaction, counterparty and portfolio basis. The Group has
15
Risk review and disclosures under Basel III Framework for the period ended 31 March 2016
implemented a single risk reporting system to aggregate risk data. This is used to generate management information to assist business and Risk users with risk monitoring and management. A number of internal risk management reports are produced on a regular basis, providing information on; individual counterparty, counterparty group, portfolio exposure, credit grade migration, the status of accounts or portfolios showing signs of weakness or financial deterioration, models performance and updates on credit markets. IRB portfolio metrics are widely used in these reports. Regular portfolio risk reports are made available at risk committee meetings. 6.7. Problem Credit Management and Provisioning Credit monitoring is a continuous process. The frequency for each type of monitoring processes is defined. For example, excesses and past dues are reviewed on daily basis by business and credit officials. Covenants and risk triggers are normally linked to an event e.g. quarter on quarter drop in sales, exchange rate, crude prices, etc. For corporate accounts identified in risk based manner, a Quarterly Performance Review (QPR) is also carried out. Account conduct is also tracked on a monthly basis in terms of past dues, excesses, documentation, compliance with covenants and progress on exit accounts through the Account Subject To Additional Review Process (ASTAR) reporting process. Potential problem credits are identified through the credit monitoring process and reported to the CIC for additional review. In addition, portfolio level review for both C&I and Retail clients is undertaken to track portfolio performance against local underwriting standards/Group policy. Outcomes of such reviews are placed before the CRC. C&I Exposures Loans are classified as impaired and considered non-performing where analysis and review indicates that full payment of either interest or principal becomes questionable, or as soon as payment of interest or principal is 90 days or more overdue. Impaired accounts are managed by GSAM. Specific provisions are made in accordance with the Bank’s internal policy, subject to minimum provisions required under the RBI guidelines. When all sources of recovery have been exhausted and no further source of recovery is apparent, then the debt is written off by applying the impairment provision held. Retail Exposures An account is considered to be delinquent when payment is not received on the due date. For credit cards, an account is required to be considered delinquent on the payment due date upon non receipt of payment till the payment due date plus 3 grace days. For delinquency reporting purposes, the Bank follows industry standards measuring delinquency as of 1, 30, 60 and 90 days past due. Accounts that are overdue are closely monitored. Loans are classified as impaired and considered non-performing where analysis and review indicates that full payment of either interest or principal becomes questionable, or as soon as payment of interest or principal is 90 days or more overdue. The process used for raising provisions is dependent on the product category and adheres to the Bank’s internal policy, subject to minimum provisions required under the RBI guidelines. In case of unsecured products, outstanding balances are written off at 150 days past due except discretionary lending. Unsecured products under discretionary lending are fully provided for at 90 days past due. In case of secured products like Mortgages, provision is raised after considering the realisable value of the collateral. For all products there are

16
Risk review and disclosures under Basel III Framework for the period ended 31 March 2016
certain accounts such as cases involving bankruptcy, fraud and death, where the loss recognition process is accelerated. The Bank also maintains general provision as a percentage of performing standard advances and on unhedged foreign currency exposures, as prescribed by the RBI, to cover the inherent risk of losses. The credit portfolio is monitored and reported to appropriate authorities in accordance with extant Group Policies/Procedures including Monitoring and Control Policy, Large Exposure Policy, Credit Initiation and Approval Policy and Risk Mitigation Policy, as well as extant local regulations/guidelines prescribed from time to time by RBI, e.g. Early Recognition of Financial Distress, Prompt Steps for Resolution and Fair Recovery for Lenders- Framework for Revitalising Distressed Assets in the Economy and reporting to Central Repository of Information on Large Credits (CRILC). DF 3 - Quantitative Disclosures a) Analysis of total gross credit risk exposures; fund based and non-fund based separately
(` in 000s)
1 Excluding provision on standard assets 2 Excluding credit lines which are unconditionally cancellable at the Bank’s sole discretion or, effectively provide for automatic cancellation of credit lines due to deterioration of borrower’s creditworthiness. 3 For non-fund based exposures, credit risk exposures or, equivalents are computed as under: In case of exposures other than Fx and derivative contracts, credit equivalent is arrived at by multiplying the
underlying contract or notional principal amounts with the credit conversion factors prescribed by the RBI under the Basel II/III capital framework.
In case of Fx and derivative contracts, credit equivalents are computed using the current exposure method which includes, two steps as under:
- Computation of current credit exposure, which is sum of the positive Mark to Market (MTM) value of the outstanding contracts.
31.03.2016 31.03.2015
Inter bank exposures 26,536,745 33,291,479
Investments (HTM) - -
Advances 766,573,055 748,283,036
Total gross fund based exposures 793,109,800 781,574,515
Specific provisions / Provisions for depreciation in the value of investment1 (101,207,526) (64,257,397)
Total net fund based exposures 691,902,274 717,317,118
Fx and derivative contracts 392,583,510 415,207,608
Guarantees, acceptances, endorsements and other obligations 304,055,120 290,085,481
Other commitments and credit l ines 2 47,330,049 58,245,906
Total gross non-fund based exposures3 743,968,679 763,538,995
Specific provisions (737) (737)
Total net non fund based exposures 743,967,942 763,538,258
Nature & category of exposures Credit risk exposures
17
Risk review and disclosures under Basel III Framework for the period ended 31 March 2016
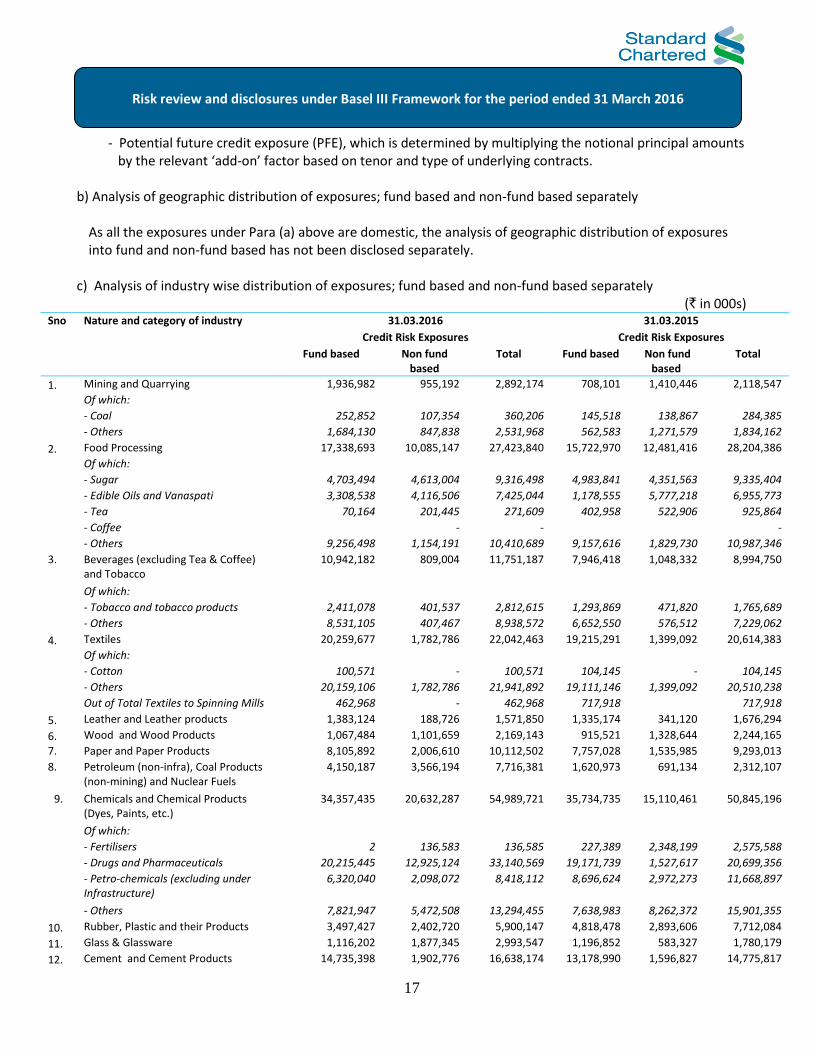
- Potential future credit exposure (PFE), which is determined by multiplying the notional principal amounts by the relevant ‘add-on’ factor based on tenor and type of underlying contracts.
b) Analysis of geographic distribution of exposures; fund based and non-fund based separately
As all the exposures under Para (a) above are domestic, the analysis of geographic distribution of exposures into fund and non-fund based has not been disclosed separately.
c) Analysis of industry wise distribution of exposures; fund based and non-fund based separately (` in 000s)
Sno Nature and category of industry 31.03.2016 31.03.2015
Credit Risk Exposures Credit Risk Exposures
Fund based Non fund based
Total Fund based Non fund based
Total
1. Mining and Quarrying 1,936,982 955,192 2,892,174 708,101 1,410,446 2,118,547
Of which:
- Coal 252,852 107,354 360,206 145,518 138,867 284,385
- Others 1,684,130 847,838 2,531,968 562,583 1,271,579 1,834,162
2. Food Processing 17,338,693 10,085,147 27,423,840 15,722,970 12,481,416 28,204,386
Of which:
- Sugar 4,703,494 4,613,004 9,316,498 4,983,841 4,351,563 9,335,404
- Edible Oils and Vanaspati 3,308,538 4,116,506 7,425,044 1,178,555 5,777,218 6,955,773
- Tea 70,164 201,445 271,609 402,958 522,906 925,864
- Coffee - - -
- Others 9,256,498 1,154,191 10,410,689 9,157,616 1,829,730 10,987,346
3. Beverages (excluding Tea & Coffee) and Tobacco
10,942,182 809,004 11,751,187 7,946,418 1,048,332 8,994,750
Of which:
- Tobacco and tobacco products 2,411,078 401,537 2,812,615 1,293,869 471,820 1,765,689
- Others 8,531,105 407,467 8,938,572 6,652,550 576,512 7,229,062
4. Textiles 20,259,677 1,782,786 22,042,463 19,215,291 1,399,092 20,614,383
Of which:
- Cotton 100,571 - 100,571 104,145 - 104,145
- Others 20,159,106 1,782,786 21,941,892 19,111,146 1,399,092 20,510,238
Out of Total Textiles to Spinning Mills 462,968 - 462,968 717,918 717,918
5. Leather and Leather products 1,383,124 188,726 1,571,850 1,335,174 341,120 1,676,294
6. Wood and Wood Products 1,067,484 1,101,659 2,169,143 915,521 1,328,644 2,244,165
7. Paper and Paper Products 8,105,892 2,006,610 10,112,502 7,757,028 1,535,985 9,293,013
8. Petroleum (non-infra), Coal Products (non-mining) and Nuclear Fuels
4,150,187 3,566,194 7,716,381 1,620,973 691,134 2,312,107
9. Chemicals and Chemical Products (Dyes, Paints, etc.)
34,357,435 20,632,287 54,989,721 35,734,735 15,110,461 50,845,196
Of which:
- Fertilisers 2 136,583 136,585 227,389 2,348,199 2,575,588
- Drugs and Pharmaceuticals 20,215,445 12,925,124 33,140,569 19,171,739 1,527,617 20,699,356
- Petro-chemicals (excluding under Infrastructure)
6,320,040 2,098,072 8,418,112 8,696,624 2,972,273 11,668,897
- Others 7,821,947 5,472,508 13,294,455 7,638,983 8,262,372 15,901,355
10. Rubber, Plastic and their Products 3,497,427 2,402,720 5,900,147 4,818,478 2,893,606 7,712,084
11. Glass & Glassware 1,116,202 1,877,345 2,993,547 1,196,852 583,327 1,780,179
12. Cement and Cement Products 14,735,398 1,902,776 16,638,174 13,178,990 1,596,827 14,775,817

18
Risk review and disclosures under Basel III Framework for the period ended 31 March 2016
13. Basic Metal and Metal Products 41,880,660 18,411,608 60,292,267 50,498,243 22,052,646 72,550,889
Of which:
- Iron and Steel 22,887,765 12,615,338 35,503,103 23,757,239 15,184,140 38,941,379
- Other Metal and Metal Products 18,992,894 5,796,270 24,789,164 26,741,004 6,868,506 33,609,510
14. All Engineering 30,332,954 25,562,756 55,895,710 34,076,498 29,958,517 64,035,015
Of which:
- Electronics 5,782,720 6,641,566 12,424,286 7,415,104 10,679,259 18,094,363
- Others 24,550,234 18,921,190 43,471,424 26,661,394 19,279,258 45,940,652
15. Vehicles, Vehicle Parts and Transport Equipments
21,694,876 5,615,459 27,310,335 16,806,331 10,571,323 27,377,654
16. Gems & Jewellery 20,650,769 4,282,372 24,933,141 25,402,214 1,668,734 27,070,948
17. Construction 6,193,948 9,031,328 15,225,276 12,415,310 10,515,017 22,930,327
18. Aviation 11,762,950 19,570,415 31,333,365 22,307,175 22,035,134 44,342,309
19. Infrastructure 79,171,668 40,939,200 120,110,868 73,078,871 25,501,165 98,580,036
Of which:
- Roads and Bridges 13,178,442 4,321,950 17,500,392 11,682,895 2,848,735 14,531,630
- Ports - -
- Inland Waterways 6,881,166 4,949,282 11,830,448 7,329,145 5,723,033 13,052,178
- Airport 229,833 740,049 969,882 118,175 250 118,425
- Railway Track, tunnels, viaducts, bridges
- - - - - -
- Electricity (Generation) 2,345,948 8,078,557 10,424,505 5,854,476 219,049 6,073,525
- Oil/Gas/Liquefied Natural Gas (LNG) storage facility
6,507 1,577 8,084 - - -
- Communication 51,662,595 11,460,638 63,123,233 41,798,826 11,239,666 53,038,492
- Other Infrastructure 4,867,178 11,387,147 16,254,325 6,295,354 5,470,432 11,765,786
20. Trading & NBFC 49,329,425 8,341,563 57,670,988 56,943,572 24,825,432 81,769,004
21. Mortgage 110,447,799 - 110,447,799 102,044,389 - 102,044,389
22. Retail Others 74,849,161 1,328,508 76,177,669 60,008,356 1,328,508 61,336,864
23. Real Estate 85,837,853 969,306 86,807,159 80,492,422 689,807 81,182,229
24. Other Industries 115,530,309 122,692,159 238,222,469 104,059,123 100,518,808 204,577,931
Total Gross Advances 766,573,055 304,055,120 1,070,628,175 748,283,036 290,085,481 1,038,368,516
Specific provisions (101,207,526) (737) (101,208,263) (64,257,397) (737) (64,258,134)
Total Net Advances 665,365,529 304,054,383 969,419,912 684,025,639 290,084,744 974,110,382
Total Inter-bank exposures 26,536,745 - 26,536,745 33,291,479 - 33,291,479
Total Investments (HTM) - - - - - -
Fund based exposure comprises loans and advances, inter-bank exposures and HTM Investments. Non-fund based exposure comprises guarantees, acceptances, endorsements and letters of credit.
19
Risk review and disclosures under Basel III Framework for the period ended 31 March 2016
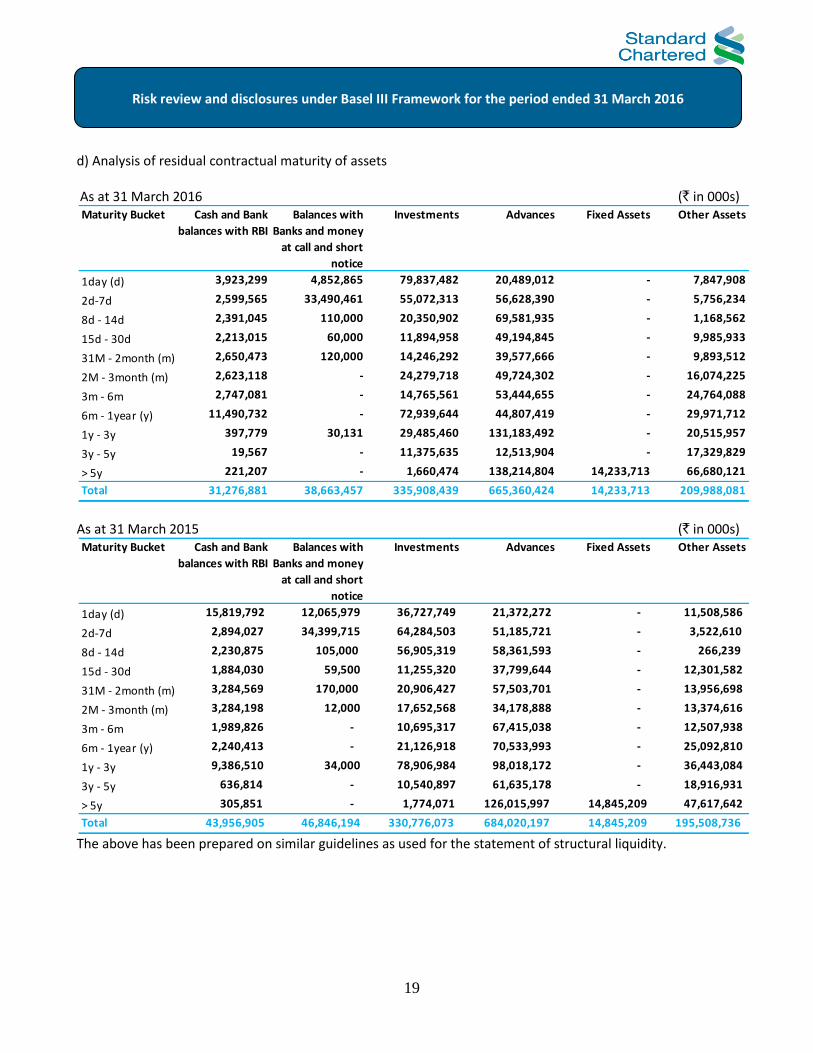
d) Analysis of residual contractual maturity of assets As at 31 March 2016 (` in 000s)
As at 31 March 2015 (` in 000s)
The above has been prepared on similar guidelines as used for the statement of structural liquidity.
Maturity Bucket Cash and Bank
balances with RBI
Balances with
Banks and money
at call and short
notice
Investments Advances Fixed Assets Other Assets
1day (d) 3,923,299 4,852,865 79,837,482 20,489,012 - 7,847,908
2d-7d 2,599,565 33,490,461 55,072,313 56,628,390 - 5,756,234
8d - 14d 2,391,045 110,000 20,350,902 69,581,935 - 1,168,562
15d - 30d 2,213,015 60,000 11,894,958 49,194,845 - 9,985,933
31M - 2month (m) 2,650,473 120,000 14,246,292 39,577,666 - 9,893,512
2M - 3month (m) 2,623,118 - 24,279,718 49,724,302 - 16,074,225
3m - 6m 2,747,081 - 14,765,561 53,444,655 - 24,764,088
6m - 1year (y) 11,490,732 - 72,939,644 44,807,419 - 29,971,712
1y - 3y 397,779 30,131 29,485,460 131,183,492 - 20,515,957
3y - 5y 19,567 - 11,375,635 12,513,904 - 17,329,829
> 5y 221,207 - 1,660,474 138,214,804 14,233,713 66,680,121
Total 31,276,881 38,663,457 335,908,439 665,360,424 14,233,713 209,988,081
Maturity Bucket Cash and Bank
balances with RBI
Balances with
Banks and money
at call and short
notice
Investments Advances Fixed Assets Other Assets
1day (d) 15,819,792 12,065,979 36,727,749 21,372,272 - 11,508,586
2d-7d 2,894,027 34,399,715 64,284,503 51,185,721 - 3,522,610
8d - 14d 2,230,875 105,000 56,905,319 58,361,593 - 266,239
15d - 30d 1,884,030 59,500 11,255,320 37,799,644 - 12,301,582
31M - 2month (m) 3,284,569 170,000 20,906,427 57,503,701 - 13,956,698
2M - 3month (m) 3,284,198 12,000 17,652,568 34,178,888 - 13,374,616
3m - 6m 1,989,826 - 10,695,317 67,415,038 - 12,507,938
6m - 1year (y) 2,240,413 - 21,126,918 70,533,993 - 25,092,810
1y - 3y 9,386,510 34,000 78,906,984 98,018,172 - 36,443,084
3y - 5y 636,814 - 10,540,897 61,635,178 - 18,916,931
> 5y 305,851 - 1,774,071 126,015,997 14,845,209 47,617,642
Total 43,956,905 46,846,194 330,776,073 684,020,197 14,845,209 195,508,736

20
Risk review and disclosures under Basel III Framework for the period ended 31 March 2016
e) Details of Non-Performing Advances (NPAs) - Gross and Net
(` in 000s)
Particulars 31.03.2016 31.03.2015
Sub Standard 43,221,895 10,748,560
Doubtful 32,290,683 28,560,066
- Doubtful 1 9,341,200 16,356,453
- Doubtful 2 18,562,081 11,150,499
- Doubtful 3 4,387,402 1,053,114
Loss 32,842,805 27,255,174
Gross NPAs 108,355,383 66,563,800
Provisions (101,207,525) (64,257,397)
Net NPAs 7,147,858 2,306,403
Cover ratio 93.40% 96.54%
f) NPA Ratios
Particulars 31.03.2016 31.03.2015
Gross NPAs to gross advances 14.14% 8.90%
Net NPAs to net advances 1.07% 0.34%
g) Movement of NPAs (` in 000s)
Particulars
31.03.2016 31.03.2015
Gross Net Gross Net
Balance, 1st April 66,563,800 2,306,403 57,826,468 3,063,474
Additions during the period 51,612,051 5,896,609 16,700,752 (333,392)
Reductions during the period (9,820,468) (1,055,154) (7,963,420) (423,679)
Balance, end of the period 108,355,383 7,147,858 66,563,800 2,306,403
h) Movement of Provisions for NPAs Specific Provisions (` in 000s)
Particulars 31.03.2016 31.03.2015
Balance, 1st April 64,257,397 54,762,994
Provisions made during the period 45,715,442 17,034,144
Write-off (1,886,287) (1,853,945)
Write-back of excess provisions (6,879,027) (5,685,796)
Balance, end of the period 101,207,525 64,257,397
21
Risk review and disclosures under Basel III Framework for the period ended 31 March 2016
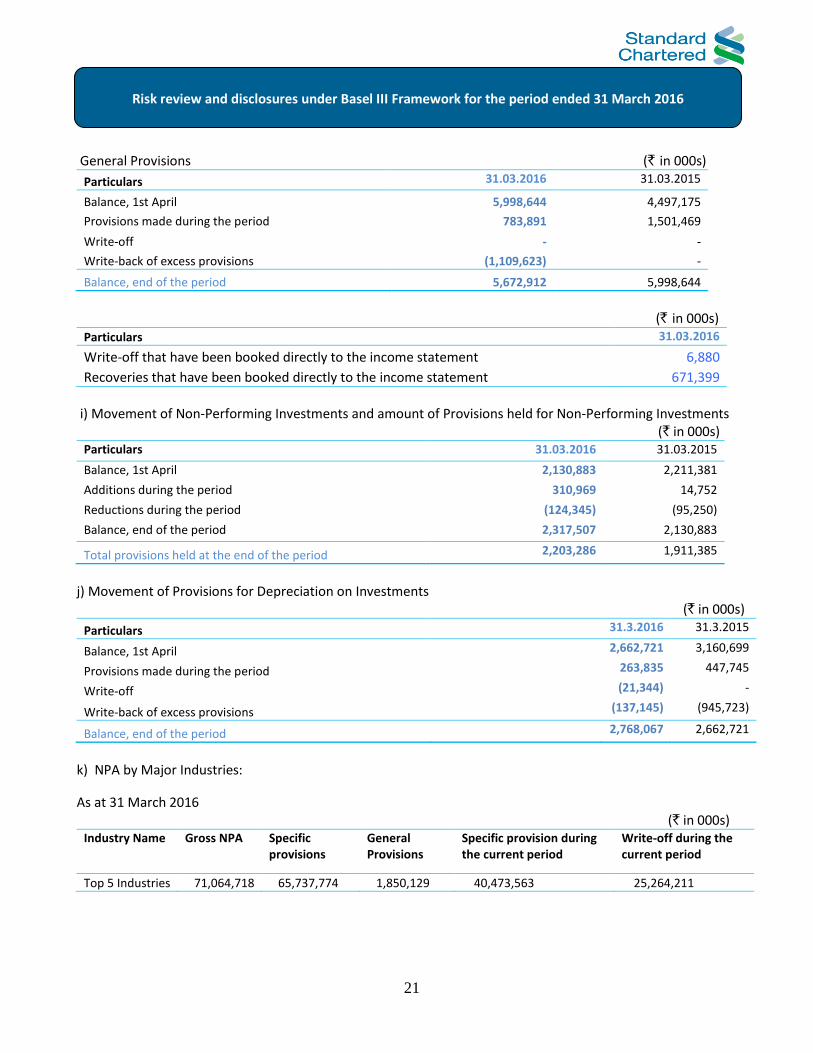
General Provisions (` in 000s)
Particulars 31.03.2016 31.03.2015
Balance, 1st April 5,998,644 4,497,175
Provisions made during the period 783,891 1,501,469
Write-off - -
Write-back of excess provisions (1,109,623) -
Balance, end of the period 5,672,912 5,998,644
(` in 000s)
Particulars 31.03.2016
Write-off that have been booked directly to the income statement 6,880
Recoveries that have been booked directly to the income statement 671,399
i) Movement of Non-Performing Investments and amount of Provisions held for Non-Performing Investments (` in 000s)
Particulars 31.03.2016 31.03.2015
Balance, 1st April 2,130,883 2,211,381
Additions during the period 310,969 14,752
Reductions during the period (124,345) (95,250)
Balance, end of the period 2,317,507 2,130,883
Total provisions held at the end of the period 2,203,286 1,911,385
j) Movement of Provisions for Depreciation on Investments
(` in 000s)
Particulars 31.3.2016 31.3.2015
Balance, 1st April
2,662,721 3,160,699
Provisions made during the period
263,835 447,745
Write-off
(21,344) -
Write-back of excess provisions
(137,145) (945,723)
Balance, end of the period 2,768,067 2,662,721
k) NPA by Major Industries: As at 31 March 2016
(` in 000s) Industry Name Gross NPA Specific
provisions General Provisions
Specific provision during the current period
Write-off during the current period
Top 5 Industries 71,064,718 65,737,774 1,850,129 40,473,563 25,264,211

22
Risk review and disclosures under Basel III Framework for the period ended 31 March 2016
7. DF 4 - Credit Risk: Disclosures for portfolios subject to the standardised approach
DF 4 - Qualitative Disclosures As per the provisions of the Basel framework in India, SCBI has adopted the SA for measurement of credit risk. The risk weights applied under the SA are prescribed by the RBI and are based on the asset class to which the exposure is assigned. This approach permits use of external ratings for credit exposures to counterparties in the category of sovereigns, international banks, corporate and securitisation exposures. The specified credit rating agencies used for these types of exposures are as under:
Domestic Credit Rating Agencies International Credit Rating Agencies
Credit Rating Information Services of India Limited Standard and Poor’s ICRA Limited Moody’s India Ratings and Research Private Limited (India Ratings) Credit Analysis and Research Limited SME Rating Agency of India Limited Brickworks Ratings India Pvt. Limited
Rated facilities have generally been considered as those facilities where the Bank’s exposure has been explicitly considered; else, the exposure has been treated by the Bank as unrated. The process used to transfer public issue ratings onto comparable assets in the banking book is in accordance with the requirements laid down by RBI. DF 4 - Quantitative Disclosures Analysis of outstanding credit exposures (after considering credit mitigation) and credit risk by regulatory risk weight As at 31 March 2016 (` in 000s)
< 100% 100% > 100% Deduction
from capital
Inter bank exposures 26,536,745 - 26,536,745 26,536,745 - - -
Investments (HTM) - - - - - - -
Advances 766,573,055 (24,923,557) 741,649,498 251,650,068 368,763,195 121,236,235 -
Total fund based
exposures
793,109,800 (24,923,557) 768,186,243 278,186,813 368,763,195 121,236,235 -
Fx and derivative
contracts
392,583,510 - 392,583,510 303,042,191 64,312,532 25,228,787 -
Guarantees,Acceptances,
endorsements and other
obligations
304,055,120 (8,442,978) 295,612,142 72,301,050 119,656,988 103,654,104 -
Undrawn Commitments
and others
47,330,049 - 47,330,049 - 37,069,619 10,260,430 -
Total non fund based
exposures
743,968,679 (8,442,978) 735,525,701 375,343,241 221,039,139 139,143,321 -
Nature & category of
exposures
Total gross credit
exposure
Credit risk mitigation Net exposure
(before
provision)
Credit risk weight buckets summary
23
Risk review and disclosures under Basel III Framework for the period ended 31 March 2016
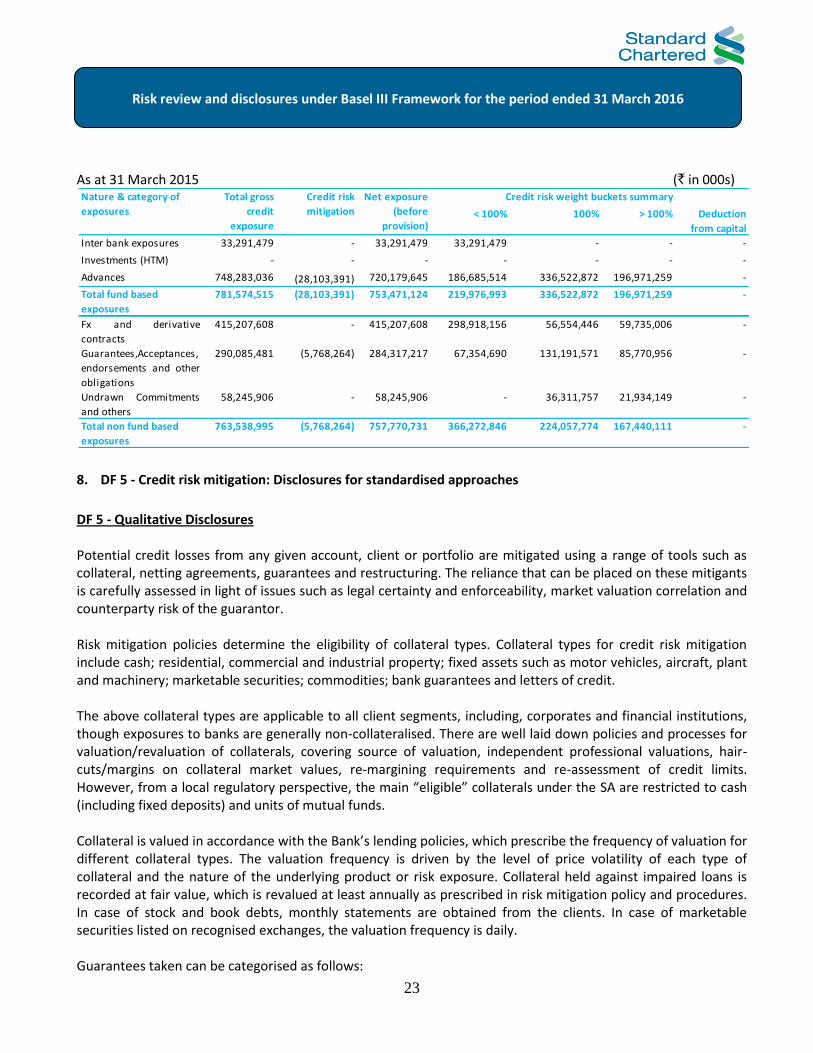
As at 31 March 2015 (` in 000s)
8. DF 5 - Credit risk mitigation: Disclosures for standardised approaches
DF 5 - Qualitative Disclosures Potential credit losses from any given account, client or portfolio are mitigated using a range of tools such as collateral, netting agreements, guarantees and restructuring. The reliance that can be placed on these mitigants is carefully assessed in light of issues such as legal certainty and enforceability, market valuation correlation and counterparty risk of the guarantor. Risk mitigation policies determine the eligibility of collateral types. Collateral types for credit risk mitigation include cash; residential, commercial and industrial property; fixed assets such as motor vehicles, aircraft, plant and machinery; marketable securities; commodities; bank guarantees and letters of credit. The above collateral types are applicable to all client segments, including, corporates and financial institutions, though exposures to banks are generally non-collateralised. There are well laid down policies and processes for valuation/revaluation of collaterals, covering source of valuation, independent professional valuations, hair-cuts/margins on collateral market values, re-margining requirements and re-assessment of credit limits. However, from a local regulatory perspective, the main “eligible” collaterals under the SA are restricted to cash (including fixed deposits) and units of mutual funds. Collateral is valued in accordance with the Bank’s lending policies, which prescribe the frequency of valuation for different collateral types. The valuation frequency is driven by the level of price volatility of each type of collateral and the nature of the underlying product or risk exposure. Collateral held against impaired loans is recorded at fair value, which is revalued at least annually as prescribed in risk mitigation policy and procedures. In case of stock and book debts, monthly statements are obtained from the clients. In case of marketable securities listed on recognised exchanges, the valuation frequency is daily. Guarantees taken can be categorised as follows:
< 100% 100% > 100% Deduction
from capital
Inter bank exposures 33,291,479 - 33,291,479 33,291,479 - - -
Investments (HTM) - - - - - - -
Advances 748,283,036 (28,103,391) 720,179,645 186,685,514 336,522,872 196,971,259 -
Total fund based
exposures
781,574,515 (28,103,391) 753,471,124 219,976,993 336,522,872 196,971,259 -
Fx and derivative
contracts
415,207,608 - 415,207,608 298,918,156 56,554,446 59,735,006 -
Guarantees,Acceptances,
endorsements and other
obligations
290,085,481 (5,768,264) 284,317,217 67,354,690 131,191,571 85,770,956 -
Undrawn Commitments
and others
58,245,906 - 58,245,906 - 36,311,757 21,934,149 -
Total non fund based
exposures
763,538,995 (5,768,264) 757,770,731 366,272,846 224,057,774 167,440,111 -
Nature & category of
exposures
Total gross
credit
exposure
Credit risk
mitigation
Net exposure
(before
provision)
Credit risk weight buckets summary

24
Risk review and disclosures under Basel III Framework for the period ended 31 March 2016
Guarantee from a bank (including central banks), or surety bond which is repayable on demand. Guarantee from a related corporate (including government owned commercial enterprises). Guarantee from an unconnected corporate. Guarantee from a government department, or an entity classified as government risk (excluding those
classified as banks or commercial enterprises). Guarantee or indemnity from a SCB Group entity (subsidiary/associate or branch). Guarantee from one or more individuals. DF 5 - Quantitative Disclosures
(` in 000s) Nature and category of exposures 31.03.2016 31.03.2015
Exposure covered by eligible financial collateral after application of haircuts 93,023,161 53,785,103
Exposure covered by guarantees 19,192,652 27,472,547
9. DF 6 – Securitisation exposures: Disclosure for standardised approach
DF 6 - Qualitative Disclosures Securitisation transactions are generally undertaken with the objective of credit risk transfer, liquidity management, meeting regulatory requirements such as priority sector lending and asset portfolio management. The Bank participates in securitisations in the role of originator, as well as, investor. In general, it provides credit enhancement services (as originator or as a third party), liquidity facilities, interest rate derivative products and acts as a collection and service agent. The key risks inherent in securitisation transactions include: Credit risk/market risk: risk arising on account of payment delinquencies from underlying
obligors/borrowers in the assigned pool. Liquidity risk: risk arising on account of lack of secondary market to provide ready exit options to the
investors/participants. Interest rate/currency risk: mark to market risks arising on account of interest rate/currency fluctuations. Prepayment risk: prepayments in the securitised pool results in early amortisation and loss of future interest
to the investor on the prepaid amount. Co-mingling risk: risk arising on account of co-mingling of funds belonging to investor(s) with that of the
originator and/or collection and service agent, when there exists a time lag between collecting amounts due from the obligors and payment made to the investors.
Monitoring credit risk The Bank in the capacity of collection and service agent prepares monthly performance reports which are circulated to investors/assignees/rating agencies. The securitised pools are continuously monitored and those requiring attention are subjected to specific interventions (e.g. focused collection efforts in affected geographies etc.) to improve their performance. The risk assessment of the pools is done continuously by the rating agencies based on amortisation level, collection efficiency, credit enhancement utilisation levels and credit cover available for balance deal tenor. The Bank has not used credit risk mitigants to mitigate retained risks.

25
Risk review and disclosures under Basel III Framework for the period ended 31 March 2016
The Bank provides credit enhancements in the form of cash deposits or guarantees in its securitisation transactions and also provides credit enhancement as a third party. The Bank makes appropriate provisions for any delinquency losses assessed at the time of sale as well as over the life of the securitisation transactions in accordance with the RBI guidelines. Summary of the Bank’s accounting policies for securitisation activities
The Bank securitises advances to Special Purpose Vehicles (SPV). Securitised assets are derecognised if they are transferred to the SPV in compliance with all the conditions of true sale as prescribed in ‘Guidelines on Securitisation transactions’ vide circulars DBOD.No.B.P.BC-103/21.04.177/2011-12 dated 07 May 2012 and DBOD.NO.BP.BC.60/21.04.048/2005-06 dated 01 February 2006 issued by the RBI. Securitisation transactions which do not meet the criteria for derecognition are accounted for as secured borrowings.
In accordance with the above referred circular, gain arising on securitisation is amortised over the life of the securities issued / to be issued by the SPV. Loss, if any, is recognised immediately in the Profit and Loss Account.
The Bank also follows the aforesaid principles to ascertain de-recognition of loans and advances through direct assignment and the gain arising upon such direct assignment is amortised over the life of the loans and advances sold. Loss, if any, is recognised immediately in the Profit and Loss Account.
In respect of credit enhancements provided or recourse obligations accepted by the Bank at the time of securitisation or direct assignment, appropriate provisions / disclosures are made in accordance with AS 29 – Provisions, Contingent Liabilities and Contingent Assets. Pass Through Certificates purchased have been marked to market on the basis of the base yield curve and the applicable spreads as per the spread matrix relative to the weighted average maturity of the paper as notified by Fixed Income Money Market and Derivatives Association of India (FIMMDA). Regulatory capital approach As per the provisions of the Basel II/III framework, all banks have to mandatorily adopt SA for capital treatment of securitisation transactions. This approach requires use of external rating agencies for risk weighting securitisation exposures. The credit rating agencies used by the Bank for these types of exposures are those recognised by the RBI (refer section 7 – DF- 4 above). DF 6 - Quantitative Disclosures
1. Banking Book a) The outstanding exposures securitised by the Bank (in ` 000’s) as on 31 Mar 2016: ` 4,467,715
(Previous Year: ` 5,917,742). b) Securitisation losses recognised by the Bank during period ending 31 Mar 2016: NIL (Previous Year: NIL)
c) Assets intended to be securitised within a year – NIL (Previous Year: NIL).
The securitisation transactions are undertaken on a need basis to meet the objectives as disclosed above.

26
Risk review and disclosures under Basel III Framework for the period ended 31 March 2016
d) The total amount of exposures securitised with unrecognised gain / (loss)
(` in 000s) 31-Mar-16 31-Mar-15
Exposure Type Outstanding Unrecognised gain /(loss)
Outstanding Unrecognised gain /(loss)
Housing Loans 1,263,291 - 1,788,942 22,862
Corporate Loans 3,204,424 - 4,128,800 -
e) Securitisation exposures retained or purchased
(` in 000s)
31-Mar-16 31-Mar-15 Exposure Type On Balance Sheet Off Balance Sheet On Balance Sheet Off Balance
Sheet
Housing Loans 328,434 1,328,508 652,522 1,328,508
f) Aggregate amount of securitisation exposures retained or purchased and the associated capital charges
As at 31 Mar 2016 (` in 000s)
Exposure Type <100% risk weight 100% risk weight >100% risk weight
Total
Housing Loans - - 1,656,942 1,656,942
Capital Charge - - 1,996,615 1,996,615
As at 31 Mar 2015 (` in 000s)
Exposure Type <100% risk weight 100% risk weight >100% risk weight Total
Housing Loans - - 1,981,031 1,981,031
Capital Charge - - 1,981,031 1,981,031
g) Securitisation exposures deducted from capital : NIL (Previous Year: NIL)
2. Trading Book
a) There are no outstanding exposures securitised for which the Bank has retained any exposure which is subject to Market Risk.
b) Securitisation exposures retained or purchased – On Balance Sheet and Off Balance Sheet.
As at 31 Mar 2016 (` in 000s) Exposure Type On Balance Sheet Off Balance Sheet
Vehicle Loans 2,446,635 - SME Loans 35,973,891 - Direct & Indirect Agriculture Lending 4,775,420 -
Total 43,195,946 -

27
Risk review and disclosures under Basel III Framework for the period ended 31 March 2016
As at 31 Mar 2015 (` in 000s)
Exposure Type On Balance Sheet Off Balance Sheet
Vehicle Loans 7,430,026 -
SME Loans 15,433,282
Direct & Indirect Agriculture Lending 3,109,165 -
Total 25,972,473 -
c) Securitisation exposures retained or purchased
(` in 000s) Risk Weight Bands 31-Mar-16 31-Mar-15
Exposures subject to Comprehensive Risk Measure for specific risk 43,195,946 25,972,473
Exposures subject to the securitisation framework for specific risk
<100% risk weight 43,195,946 25,972,473 100% risk weight - - >100% risk weight - -
Total 43,195,946 25,972,473
d) Aggregate amount of the capital requirements for the securitisation exposures
(` in 000s) Risk Weight Bands 31-Mar-16 31-Mar-15
<100% risk weight 832,818 467,505
100% risk weight - -
>100% risk weight - -
Total 832,818 467,505
e) Securitisation exposures deducted from capital: NIL (Previous Year: NIL)
10. DF 7 - Market Risk in Trading Book
DF 7 - Qualitative Disclosures The Bank recognises market risk as the potential for loss of earnings or economic value due to adverse changes in financial market rates or prices. The Bank is exposed to market risk arising principally from client-driven transactions. The objective of the Bank’s market risk policies and processes is to obtain a balance of risk and return while meeting clients’ requirements. The primary categories of market risk for the Bank are interest rate risk, currency exchange rate risk, commodity price risk and equity price risk. 10.1. Market Risk Governance The GRC approves the Group’s market risk appetite taking account of market volatility, the range of products and asset classes, business volumes and transaction sizes. The Credit and Market Risk Committee (CMRC), under

28
Risk review and disclosures under Basel III Framework for the period ended 31 March 2016
authority delegated by the GRC, is responsible for setting Value at Risk (VaR) as the primary market risk measure within the Group’s risk appetite. The CMRC is also responsible for policies and other standards for the control of market risk and overseeing their effective implementation. These policies cover both trading and non-trading books. At a country level, there is an independent market risk function to implement Group market risk policies/limits and to monitor the market risk exposures in accordance with Group and local governance/regulatory norms. Market and Traded Credit Risk (MTCR) approves the limits within delegated authorities and monitors exposures against these limits. Additional limits are placed on specific instruments and position concentrations, where appropriate. Sensitivity measures are used in addition to VaR as a risk management tools. For example, interest rate sensitivity is measured in terms of exposure to a one basis point increase in yields, whereas, foreign exchange, commodity and equity sensitivities are measured in terms of the underlying values or amounts involved. Option risks are controlled through revaluation limits on underlying price and volatility shifts and limits on volatility risk and other variables that determine the options’ value. The CRC, in conjunction with MTCR, provides market risk oversight, reporting and management of the market risk profile. Value at Risk The Bank measures the risk of losses arising from future potential adverse movements in market rates, prices and volatilities using a VaR methodology. VaR, in general, is a quantitative measure of market risk that applies recent historical market conditions to estimate the potential future loss in market value that will not be exceeded in a set time period at a set statistical confidence level. VaR provides a consistent measure that can be applied across trading businesses and products over time and can be set against actual daily trading profit and loss outcome. VaR is calculated for expected movements over a minimum of one business day and to a confidence level of 97.5 per cent. This confidence level suggests that potential daily losses, in excess of the VaR measure, are likely to be experienced six times per year. Back Testing To assess their predictive power, VaR models are back tested against actual results. Trading book back testing is conducted against clean profit and loss, which is the actual profit and loss for a given business day, adjusted to remove the effect of certain items unrelated to market risk. Stress Testing Losses beyond the confidence interval are not captured by a VaR calculation, which therefore gives no indication of the size of unexpected losses in these situations. MTCR complements the VaR measurement by regularly stress testing market risk exposures to highlight potential risk that may arise from extreme market events that are rare but plausible. Stress testing is an integral part of the market risk management framework and considers both, historical market events and forward looking scenarios. A consistent stress testing methodology is applied to trading and non-trading books. The stress testing methodology assumes that scope for management action would be limited during a stress event, reflecting the decrease in market liquidity that often occurs. Stress scenarios are regularly updated to reflect changes in risk profile and economic events.
29
Risk review and disclosures under Basel III Framework for the period ended 31 March 2016
Regular stress test scenarios are applied to interest rates, credit spreads, exchange rates and equity prices thereby covering asset classes in the Financial Markets (FM) non-trading and trading books. Ad hoc scenarios are also prepared, reflecting specific market conditions and for particular concentrations of risk that arise within the businesses. 10.2. Foreign Exchange Exposure The foreign exchange exposures comprise trading and non-trading foreign currency translation exposures. Foreign exchange trading exposures are principally derived from client driven transactions. 10.3. Interest Rate Exposure The interest rate exposures arise from trading and non-trading activities. Structural interest rate risk arises from the differing re-pricing characteristics of commercial banking assets and liabilities. 10.4. Derivatives
Structure and organisation of management of risk in derivatives trading
The derivatives business is managed by the front office with independent back office for confirmation and settlement of trades. A separate middle office team validates all the derivative transactions and the processing and settlement is done by the back office team. The market risk team is responsible for monitoring market risk limits for derivative instruments. VaR is the primary risk measure and supplemented by other limits like PV01 as required and appropriate. There is clear segregation of duties and different reporting lines to ensure independent monitoring and reporting.
Risk monitoring team
The Bank is exposed to market risk, liquidity risk, operational risk and credit risk on the derivatives portfolio. The Bank’s risk management group, compliance group and internal audit group assist in identifying, assessing and monitoring of these principal risks in accordance with policies and procedures.
For further details please refer to para 12 (DF 9) below. DF 7 - Quantitative Disclosures For details please refer to market risk section under para 4 (DF 2 - Quantitative Disclosures)
11. DF 8 - Operational Risk
DF 8 - Qualitative Disclosures OR is the potential for loss arising from the failure of people, processes, technology or the impact of external events. It is the Bank’s objective to minimise exposure to OR, subject to cost trade-offs. OR exposures are managed through a consistent set of management process that drive risk identification, assessment, control and monitoring. OR is managed by the CORC, which exercises oversight of the Bank’s OR exposures to ensure that it is aligned with the Bank’s RMF.
30
Risk review and disclosures under Basel III Framework for the period ended 31 March 2016
The responsibility for daily management of OR exposures rests with businesses and functions as an integral component of their first line risk management responsibilities. In addition, specialist operational RCOs have responsibility for the management of OR arising from the following activities: legal processes, people management, technology management, vendor management, property management, security management, accounting and financial control, tax management, corporate authorities and structure and regulatory compliance. Each RCO is responsible for identifying risks that are material to the Group and for maintaining an effective control environment, which includes defining appropriate policies and procedures for approval by authorised risk committees. The Bank uses the BIA consistent with the RBI’s capital adequacy requirements to assess its regulatory capital requirements for OR. Under the BIA, a pre-determined beta co-efficient is applied to the average income for the previous three years, to determine the OR capital requirement.
12. DF 9 - Interest Rate Risk in the Banking Book (IRRBB)
DF 9 - Qualitative Disclosures Interest rate risk from the non-trading book portfolios is transferred to FM where it is managed by ALM under the supervision of ALCO. This risk arises principally from the re-pricing mismatch between commercial assets and liabilities. ALM also deals in approved financial instruments in the market to manage the net interest rate risk, subject to approved VaR and risk limits. VaR and stress tests are applied to non-trading book exposures in the same way as for the trading book and thus the primary risk measurement tool is VaR for the non-trading book. ALM also manages a portfolio of marketable securities primarily for the purpose of meeting the reserve requirements and the same is profiled as per its underlying risk factors. No prepayment assumptions are applied to the fixed rate commercial loan book and such loans follow the contractual maturity profiling method. For non maturing products like current accounts, savings accounts, cards and overdrafts, behavioural calculation is done to segregate the portfolio according to the balances expected to remain with the bank under non stress conditions for a year or more (core) or less than a year (non-core). DF 9 - Quantitative Disclosures The impact on market value of equity for a 200 basis upward move (in ` 000’s) as at 31 Mar 2016 is ` 1,927,178 (previous year: ` 3,205,233).
13. DF 10 – Exposure related to Counterparty Credit Risk
DF 10 - Qualitative Disclosures 13.1. Credit Limits and Collaterals Counterparty credit risk (CCR) is the risk that a Bank’s counterparty defaults in a FX, interest rate, commodity or credit derivative contract prior to or at the maturity date of the contract and that the Bank at the time has a claim on the counterparty. The Credit Initiation and Approval Policy governs CCR and is approved by CRC. The credit risk arising from all financial derivatives is managed as part of the overall credit limits to both financial institutions and other clients.

31
Risk review and disclosures under Basel III Framework for the period ended 31 March 2016
Exposure values for regulatory capital purposes on over the counter traded products are calculated according to the CCR Current Exposure Method (CEM). This is calculated as the sum of the current replacement cost and the PFE. The current replacement cost is the amount owed by the counterparty to the Bank for various financial derivative transactions. The PFE is an add-on based on a percentage of the notional principal of each transaction. These percentages are prescribed by the RBI in the guidelines and vary according to the underlying asset class and tenor of each trade. The Group has a credit risk economic capital model which is managed centrally. The model uses obligor-level Monte Carlo simulation parameterised with internal data to capture various elements of credit risk including CCR. The Bank seeks to negotiate Credit Support Annexes (CSA) to International Swaps and Derivatives Association master agreements with counterparties on a case-by-case basis, where collateral is deemed a necessary or desirable mitigant to the exposure. The credit terms of the CSA are specific to each legal document and determined by the credit risk approval unit responsible for the counterparty. The nature of the collateral will be specified in the legal document and will typically be cash or highly liquid securities. A daily operational process takes place to calculate the MTM on all trades captured under the CSA. Additional collateral will be called from the counterparty at agreed frequency if total uncollateralised MTM exposure exceeds the threshold and minimum transfer amount specified in the CSA. Additional collateral may be required from the counterparty to provide an extra buffer to the daily variation margin process. The Bank further reduces its credit exposures to counterparties by entering into contractual netting agreements which result in a single amount owed by or to the counterparty through netting the sum of the positive (amounts owed by the counterparty) and negative (amounts owed by the Bank) MTM values of these transactions. In India, the Bank follows SA for credit risk and hence no credit reserve is set aside. However, provisioning for the exposures on derivative contracts is made as prescribed by RBI Circular No.DBR.No.BP.BC.2/21.04.048/2015-16 dated 01 July 2015. 13.2. Wrong Way Risk
Wrong-way risk ("WWR") occurs when exposure to a counterparty is positively correlated to deterioration in its creditworthiness. WWR falls into two categories: Specific Wrong Way Risk, which occurs when future exposure to a specific counterparty is adversely correlated with the counterparty's probability of default due to the nature of the transactions with the counterparty. General Wrong Way Risk, which occurs when the likelihood of default of a counterparty is adversely correlated with general market risk factors. The Financial Markets Credit Policy manages WWR through CCR monitoring and credit procedures.
13.3. Impact of Credit Rating Downgrade
In line with market convention, the Bank negotiates CSA terms for certain counterparties where the thresholds related to each party are dependent on their External Credit Assessment Institution (ECAI) long term rating. Such clauses are typically mutual in nature. In the event of downgrade of counterparty’s credit rating, margin call may

32
Risk review and disclosures under Basel III Framework for the period ended 31 March 2016
be initiated to ask for additional collateral to cover negative MTM portfolios where thresholds are lowered. It is recognised that a downgrade in the Group’s rating could result in counterparties seeking additional collateral calls to cover negative MTM portfolios where thresholds are lowered. DF 10 - Quantitative Disclosures
(` in 000s) Particulars 31.03.2016 31.03.2015
Gross positive fair value of contracts 126,167,881 129,887,652
Less: Netting benefits - -
Netted current credit exposure 126,167,881 129,887,653
Less: Collateral held (including type, e.g. cash,government securities, etc.) - -
Net derivatives credit exposure 126,167,881 129,887,652 Potential future exposure 266,415,629 285,319,956
Measures for exposure at default or exposure amount under CEM 392,583,510 415,207,608
Notional value of credit derivative hedges - -
Distribution of current credit exposure by types of credit exposure - Interest Rates 104,199,329 91,686,978
- Fx 288,384,181 323,520,630
Credit Derivative Transactions that create exposures to CCR (Notional Value) NIL NIL
For capital requirement details, refer “Minimum Regulatory Capital Requirements” under para 4 (DF 2 – quantitative disclosure) of this disclosure.
14. Other Key Risks
14.1. Liquidity Risk Liquidity risk is the potential that the Bank either does not have sufficient liquid financial resources available to meet all its obligations and commitments as they fall due, or can only access these financial resources at excessive cost. The Liquidity Risk Framework governs liquidity risk and is managed by ALCO. In accordance with that framework, the Bank maintains a liquid portfolio of marketable securities as reserve assets. The level of the Bank’s aggregate liquid reserves is in accordance with local regulatory minimum liquidity requirements, including the Liquidity Coverage Ratio. 14.2. Reputational Risk Reputational risk is the potential for damage to the Group’s franchise, resulting in loss of earnings or adverse impact on market capitalisation as a result of stakeholders taking a negative view of the organisation or its actions.

33
Risk review and disclosures under Basel III Framework for the period ended 31 March 2016
Reputational risk is managed by the CMT/CRC, which is responsible for protecting the Group’s reputation locally and has the responsibility to ensure that the Bank does not undertake any activities that may cause material damage to the Group’s franchise.
Reputational risk is registered, recorded and reviewed by the CEO through the CRC. Whilst the CRC covers all forms of reputational risk in country, any significant business related reputational risks identified is escalated to Business Responsibility and Reputational Risk Committee.
15. Monitoring
Monitoring of risk management is achieved through independent reviews by RCOs, GIA, Compliance, concurrent audits and spot checks by external specialists as required under regulations. To ensure the effectiveness of risk management processes in maintaining the risk profile of the Bank within risk appetite, the Bank maintains a three ‘lines of defence’ framework - refer para 5.1 above for further details.
16. DF 11 - Composition of Capital as at 31 Mar 2016
(` in M) Basel III common disclosure template Solo Consolidated
Common Equity Tier 1 capital: instruments and reserves
Basel III Amounts
Amounts Subject to
Pre-Basel III Treatment
Basel III Amounts
Amounts Subject to
Pre-Basel III Treatment
Ref No.(Section 17/DF 12)
1 Directly issued qualifying common share capital plus related stock surplus (share premium)
74,401 - 74,401 - A1
2 Retained earnings 79,220 - 79,220 - B6
3 Accumulated other comprehensive income (and other reserves)
79,074 - 78,468 - B1+B3+B4+B5+B7+B8+
C1+C3 4 Directly issued capital subject to phase out
from CET1 (only applicable to non-joint stock companies)
- - - -
Public sector capital injections grandfathered until 1 January 2018
5 Common share capital (plus share premium) issued by other regulated entities and held by third parties (amount allowed in group CET1)
- - 9,423 - A2
6 Common Equity Tier 1 capital before regulatory adjustments
232,695 - 241,512 -
Common Equity Tier 1 capital: regulatory adjustments
7 Prudential valuation adjustments - - - -
8 Goodwill (net of related tax liability) 10 - 10 - E1
9 Intangibles other than mortgage-servicing rights (net of related tax
8 - 41 - E2

34
Risk review and disclosures under Basel III Framework for the period ended 31 March 2016
Basel III common disclosure template Solo Consolidated
Common Equity Tier 1 capital: instruments and reserves
Basel III Amounts
Amounts Subject to
Pre-Basel III Treatment
Basel III Amounts
Amounts Subject to
Pre-Basel III Treatment
Ref No.(Section 17/DF 12)
liability)
10 Deferred tax assets (net of Benefit) 26,362 - 25,613 -
11 Cash-flow hedge reserve - - - -
12 Shortfall of provisions to expected losses - - - -
13 Securitisation gain on sale - - - -
14 Gains and losses due to changes in own credit risk on fair valued liabilities
- - - -
15 Defined-benefit pension fund net assets - - - -
16 Investments in own shares (if not already netted off paid-in capital on reported balance sheet)
- - - -
17 Reciprocal cross-holdings in common equity
- - - -
18 Investments in the capital of banking, financial and insurance entities that are outside the scope of regulatory consolidation, net of eligible short positions, where the bank does not own more than 10% of the issued share capital (amount above 10% threshold)
- - - -
19 Significant investments in the common stock of banking, financial and insurance entities that are outside the scope of regulatory consolidation, net of eligible short positions (amount above 10% threshold)
- - - -
20 Mortgage servicing rights (amount above 10% threshold)
- - - -
21 Deferred tax assets arising from temporary differences(amount above 10% threshold, net of related tax liability)
- - - -
22 Amount exceeding the 15% threshold - - - -
23 of which: significant investments in the common stock of financial entities
- - - -
24 of which: mortgage servicing rights - - - -
25 of which: deferred tax assets arising from temporary differences
- - - -
26 National specific regulatory adjustments(26a+26b+26c+26d)
- - - -
26a of which: Investments in the equity capital of the unconsolidated insurance subsidiaries
- - - -
26b of which: Investments in the equity capital - - - -

35
Risk review and disclosures under Basel III Framework for the period ended 31 March 2016
Basel III common disclosure template Solo Consolidated
Common Equity Tier 1 capital: instruments and reserves
Basel III Amounts
Amounts Subject to
Pre-Basel III Treatment
Basel III Amounts
Amounts Subject to
Pre-Basel III Treatment
Ref No.(Section 17/DF 12)
of unconsolidated non-financial subsidiaries
26c of which: Shortfall in the equity capital of majority owned financial entities which have not been consolidated with the bank
- - - -
26d of which: Unamortised pension funds expenditures
- - - -
Regulatory Adjustments Applied to Common Equity Tier 1 in respect of Amounts Subject to Pre-Basel III Treatment
97 2 97 2
of which: HO Debit Balance(20%) 1 2 1 2 F1
of which: Incurred CVA loss(20%) 96 386 96 386 F2
27 Regulatory adjustments applied to Common Equity Tier 1 due to insufficient Additional Tier 1 and Tier 2 to cover deductions
388 388 388 388
28 Total regulatory adjustments to Common equity Tier 1
26,866 - 26,149 -
29 Common Equity Tier 1 capital (CET1) 205,829 - 215,363 -
Additional Tier 1 capital: instruments
30 Directly issued qualifying Additional Tier 1 instruments plus related stock surplus (31+32)
- - - -
31 of which: classified as equity under applicable accounting standards (Perpetual Non-Cumulative Preference Shares)
- - - -
32 of which: classified as liabilities under applicable accounting standards (Perpetual debt Instruments)
- - - -
33 Directly issued capital instruments subject to phase out from Additional Tier 1
- - - -
34 Additional Tier 1 instruments (and CET1 instruments not included in row 5) issued by subsidiaries and held by third parties (amount allowed in group AT1)
- - - -
35 of which: instruments issued by subsidiaries subject tophase out
- - - -
36 Additional Tier 1 capital before regulatory adjustments
- - - -
Additional Tier 1 capital: regulatory adjustments
37 Investments in own Additional Tier 1 instruments
- - - -
38 Reciprocal cross-holdings in Additional Tier 1 instruments
- - - -
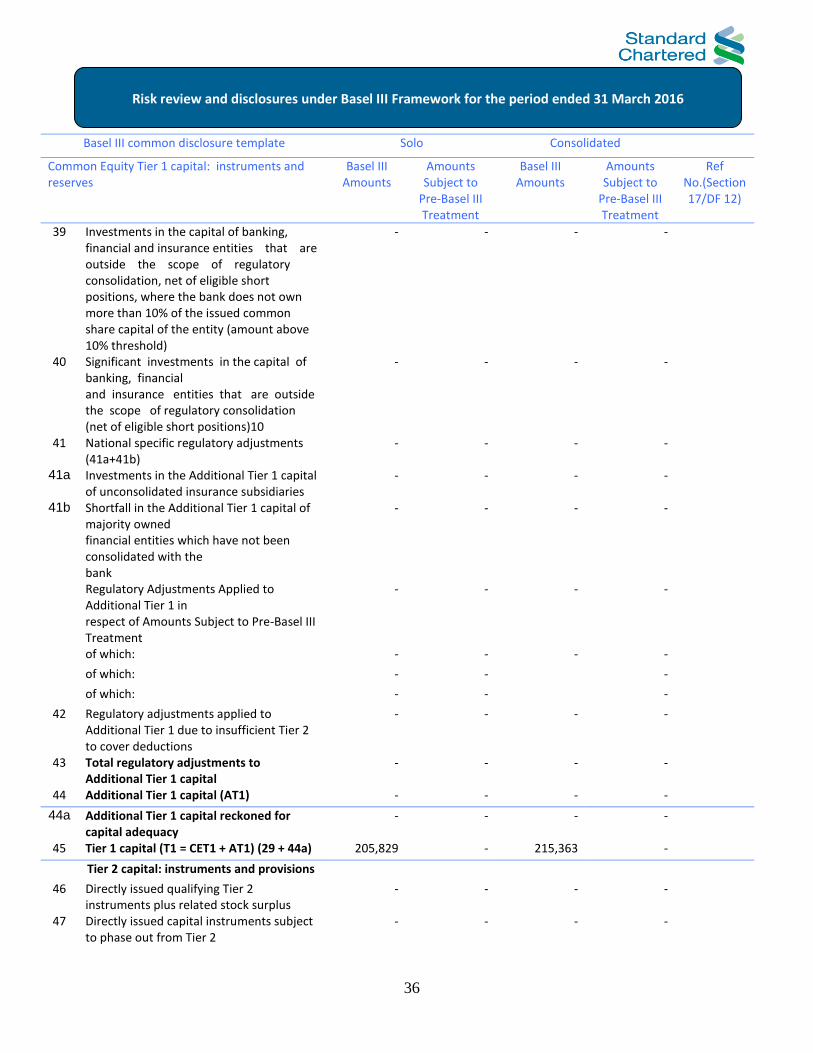
36
Risk review and disclosures under Basel III Framework for the period ended 31 March 2016
Basel III common disclosure template Solo Consolidated
Common Equity Tier 1 capital: instruments and reserves
Basel III Amounts
Amounts Subject to
Pre-Basel III Treatment
Basel III Amounts
Amounts Subject to
Pre-Basel III Treatment
Ref No.(Section 17/DF 12)
39 Investments in the capital of banking, financial and insurance entities that are outside the scope of regulatory consolidation, net of eligible short positions, where the bank does not own more than 10% of the issued common share capital of the entity (amount above 10% threshold)
- - - -
40 Significant investments in the capital of banking, financial and insurance entities that are outside the scope of regulatory consolidation (net of eligible short positions)10
- - - -
41 National specific regulatory adjustments (41a+41b)
- - - -
41a Investments in the Additional Tier 1 capital of unconsolidated insurance subsidiaries
- - - -
41b Shortfall in the Additional Tier 1 capital of majority owned financial entities which have not been consolidated with the bank
- - - -
Regulatory Adjustments Applied to Additional Tier 1 in respect of Amounts Subject to Pre-Basel III Treatment
- - - -
of which: - - - -
of which: - - -
of which: - - -
42 Regulatory adjustments applied to Additional Tier 1 due to insufficient Tier 2 to cover deductions
- - - -
43 Total regulatory adjustments to Additional Tier 1 capital
- - - -
44 Additional Tier 1 capital (AT1) - - - -
44a Additional Tier 1 capital reckoned for capital adequacy
- - - -
45 Tier 1 capital (T1 = CET1 + AT1) (29 + 44a) 205,829 - 215,363 -
Tier 2 capital: instruments and provisions
46 Directly issued qualifying Tier 2 instruments plus related stock surplus
- - - -
47 Directly issued capital instruments subject to phase out from Tier 2
- - - -

37
Risk review and disclosures under Basel III Framework for the period ended 31 March 2016
Basel III common disclosure template Solo Consolidated
Common Equity Tier 1 capital: instruments and reserves
Basel III Amounts
Amounts Subject to
Pre-Basel III Treatment
Basel III Amounts
Amounts Subject to
Pre-Basel III Treatment
Ref No.(Section 17/DF 12)
48 Tier 2 instruments (and CET1 and AT1 instruments not included in rows 5 or 34) issued by subsidiaries and held by third parties (amount allowed in group Tier 2)
- - - -
49 of which: instruments issued by subsidiaries subject to phase out
- - - -
50 Provisions 10,434 - 10,457 - B2*45%+C2+D1+D2+D
3+D4 51 Tier 2 capital before regulatory
adjustments 10,434 - 10,457 -
Tier 2 capital: regulatory adjustments
52 Investments in own Tier 2 instruments - - - -
53 Reciprocal cross-holdings in Tier 2 instruments
- - - -
54 Investments in the capital of banking, financial and insurance entities that are outside the scope of regulatory consolidation, net of eligible short positions, where the bank does not own more than 10% of the issued common share capital of the entity (amount above the 10% threshold)
- - - -
55 Significant investments in the capital banking, financial and insurance entities that are outside the scope of regulatory consolidation (net of eligible short positions)
- - - -
56 National specific regulatory adjustments (56a+56b)
- - - -
56a of which: Investments in the Tier 2 capital of unconsolidated subsidiaries
- - - -
56b of which: Shortfall in the Tier 2 capital of majority owned
- - - -
financial entities which have not been consolidated with the bank
- - - -
Regulatory Adjustments Applied To Tier 2 in respect of
- - - -
Amounts Subject to Pre-Basel III Treatment - - - -
of which: Investment in Subsidiaries - - - -
of which: [INSERT TYPE OF ADJUSTMENT - - - -
57 Total regulatory adjustments to Tier 2 capital
- - - -
58 Tier 2 capital (T2) 10,434 - 10,457 -

38
Risk review and disclosures under Basel III Framework for the period ended 31 March 2016
Basel III common disclosure template Solo Consolidated
Common Equity Tier 1 capital: instruments and reserves
Basel III Amounts
Amounts Subject to
Pre-Basel III Treatment
Basel III Amounts
Amounts Subject to
Pre-Basel III Treatment
Ref No.(Section 17/DF 12)
58a Tier 2 capital reckoned for capital adequacy
10,434 - 10,457 -
58b Excess Additional Tier 1 capital reckoned as Tier 2 capital
- - - -
58c Total Tier 2 capital admissible for capital adequacy (58a + 58b)
10,434 - 10,457 -
59 Total capital (TC = T1 + T2) (45 + 58c) 216,263 - 225,820 -
Risk W eighted Assets in respect of Amounts Subject to Pre-Basel III Treatment
of which:
60 Total risk weighted assets (60a + 60b + 60c)
1,665,847 - 1,683,974 -
60a of which: total credit risk weighted assets 1,373,999 - 1,387,745 -
60b of which: total market risk weighted assets 134,915 - 134,955 -
60c of which: total operational risk weighted assets
156,933 - 161,274 -
Capital Ratios
61 Common Equity Tier 1 (as a percentage of risk weighted assets)
12.36% 12.79%
62 Tier 1 (as a percentage of risk weighted assets)
12.36% 12.79%
63 Total capital (as a percentage of risk weighted assets)
12.98% 13.41%
64 Institution specific buffer requirement (minimum CET1 requirement plus capital conservation and countercyclical buffer requirements, expressed as a percentage of risk weighted assets)
- - - -
65 of which: capital conservation buffer requirement
- - - -
66 of which: bank specific countercyclical buffer requirement
- - - -
67 of which: G-SIB buffer requirement - - - -
68 Common Equity Tier 1 available to meet buffers (as a percentage of risk weighted assets)
- - - -
National minima (if different from Basel III)
69 National Common Equity Tier 1 minimum ratio (if different from Basel III minimum)
- - - -
70 National Tier 1 minimum ratio (if different from Basel III minimum)
- - - -
71 National total capital minimum ratio (if different from Basel III minimum)
- - - -
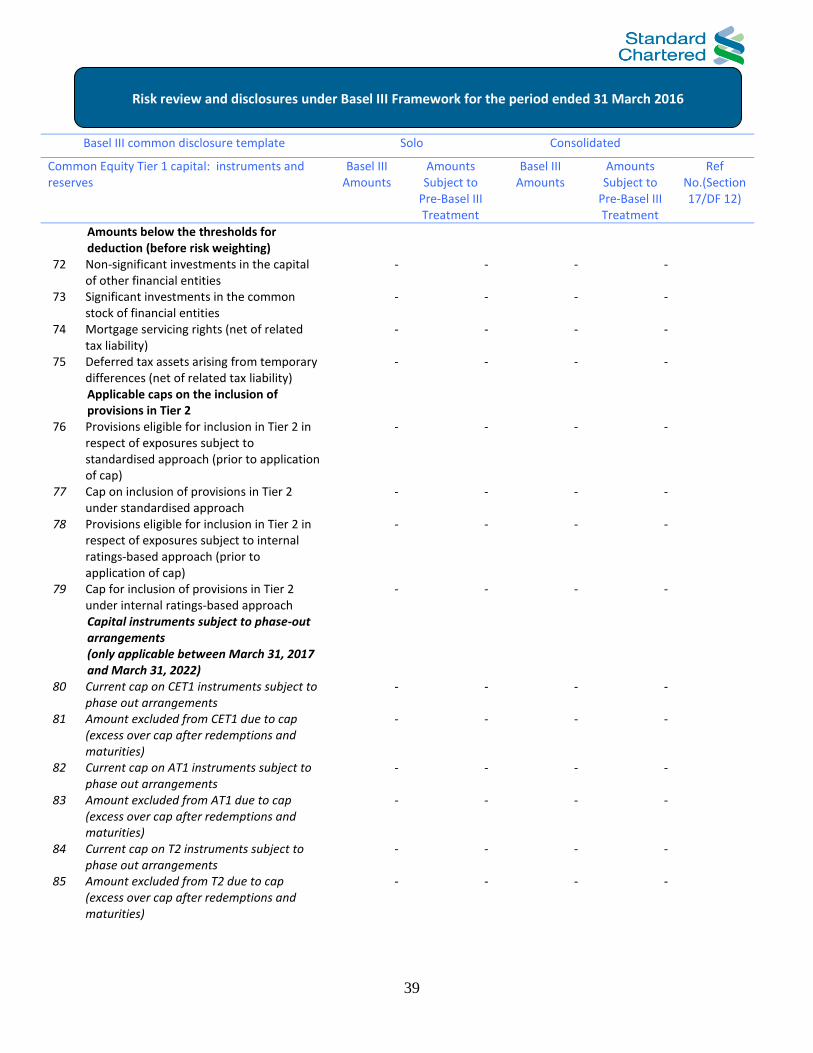
39
Risk review and disclosures under Basel III Framework for the period ended 31 March 2016
Basel III common disclosure template Solo Consolidated
Common Equity Tier 1 capital: instruments and reserves
Basel III Amounts
Amounts Subject to
Pre-Basel III Treatment
Basel III Amounts
Amounts Subject to
Pre-Basel III Treatment
Ref No.(Section 17/DF 12)
Amounts below the thresholds for deduction (before risk weighting)
72 Non-significant investments in the capital of other financial entities
- - - -
73 Significant investments in the common stock of financial entities
- - - -
74 Mortgage servicing rights (net of related tax liability)
- - - -
75 Deferred tax assets arising from temporary differences (net of related tax liability)
- - - -
Applicable caps on the inclusion of provisions in Tier 2
76 Provisions eligible for inclusion in Tier 2 in respect of exposures subject to standardised approach (prior to application of cap)
- - - -
77 Cap on inclusion of provisions in Tier 2 under standardised approach
- - - -
78 Provisions eligible for inclusion in Tier 2 in respect of exposures subject to internal ratings-based approach (prior to application of cap)
- - - -
79 Cap for inclusion of provisions in Tier 2 under internal ratings-based approach
- - - -
Capital instruments subject to phase-out arrangements (only applicable between March 31, 2017 and March 31, 2022)
80 Current cap on CET1 instruments subject to phase out arrangements
- - - -
81 Amount excluded from CET1 due to cap (excess over cap after redemptions and maturities)
- - - -
82 Current cap on AT1 instruments subject to phase out arrangements
- - - -
83 Amount excluded from AT1 due to cap (excess over cap after redemptions and maturities)
- - - -
84 Current cap on T2 instruments subject to phase out arrangements
- - - -
85 Amount excluded from T2 due to cap (excess over cap after redemptions and maturities)
- - - -
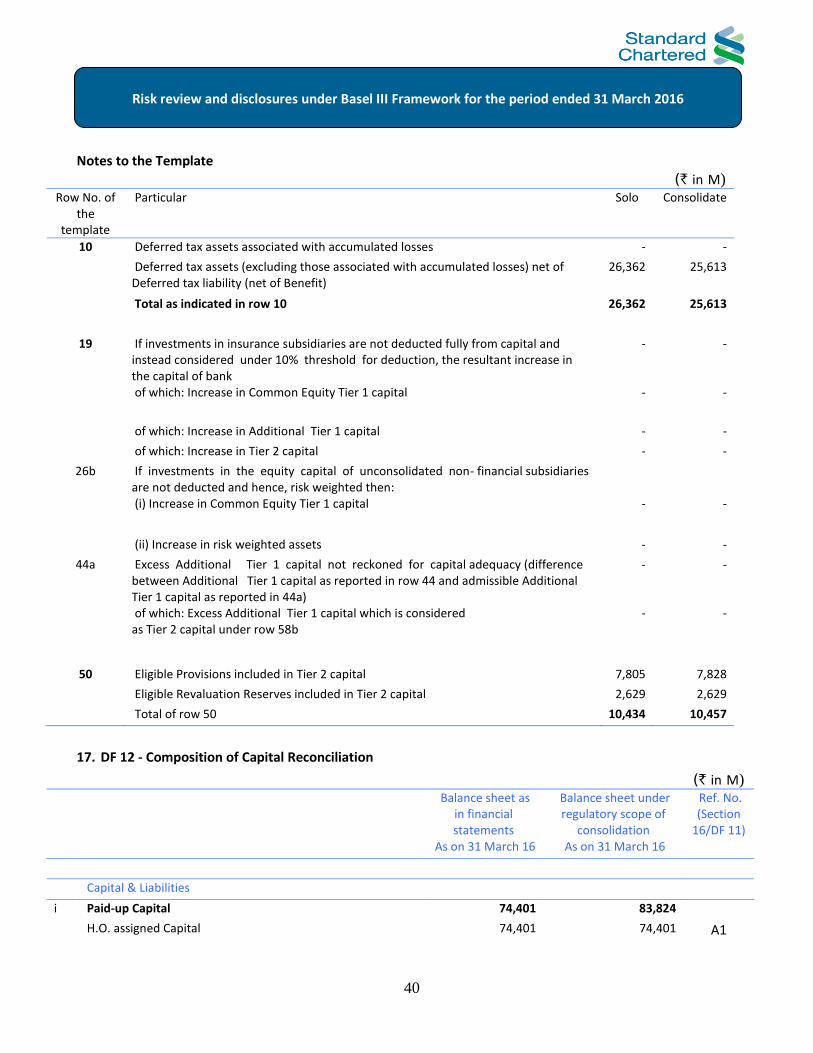
40
Risk review and disclosures under Basel III Framework for the period ended 31 March 2016
Notes to the Template
(` in M) Row No. of
the template
Particular Solo Consolidate
10 Deferred tax assets associated with accumulated losses - -
Deferred tax assets (excluding those associated with accumulated losses) net of Deferred tax liability (net of Benefit)
26,362 25,613
Total as indicated in row 10 26,362 25,613
19 If investments in insurance subsidiaries are not deducted fully from capital and instead considered under 10% threshold for deduction, the resultant increase in the capital of bank
- -
of which: Increase in Common Equity Tier 1 capital - -
of which: Increase in Additional Tier 1 capital - -
of which: Increase in Tier 2 capital - -
26b If investments in the equity capital of unconsolidated non- financial subsidiaries are not deducted and hence, risk weighted then:
(i) Increase in Common Equity Tier 1 capital - -
(ii) Increase in risk weighted assets - -
44a Excess Additional Tier 1 capital not reckoned for capital adequacy (difference between Additional Tier 1 capital as reported in row 44 and admissible Additional Tier 1 capital as reported in 44a)
- -
of which: Excess Additional Tier 1 capital which is considered as Tier 2 capital under row 58b
- -
50 Eligible Provisions included in Tier 2 capital 7,805 7,828
Eligible Revaluation Reserves included in Tier 2 capital 2,629 2,629
Total of row 50 10,434 10,457
17. DF 12 - Composition of Capital Reconciliation
(` in M)
Balance sheet as in financial statements
Balance sheet under regulatory scope of
consolidation
Ref. No. (Section
16/DF 11)
As on 31 March 16 As on 31 March 16
Capital & Liabilities i Paid-up Capital 74,401 83,824
H.O. assigned Capital 74,401 74,401 A1

41
Risk review and disclosures under Basel III Framework for the period ended 31 March 2016
Common share capital (plus share premium) issued by other regulated entities and held by third parties (amount allowed in group CET1)
- 9,423 A2
of which: Amount eligible for CET1 74,401 83,824
-
of which: Amount eligible for AT1 - -
ii Reserves & Surplus 172,576 172,399
a Statutory Reserves 67,803 68,604 B1 b Property Revaluation Reserve 5,842 5,842 B2 c Capital Reserves-Surplus on sale of immovable properties 9,776 9,776
B3
d Capital Reserves-Surplus on sale of Held To Maturity investments
985 985 B4
e Capital Reserve 302 302 B5 f Remittable Surplus retained in India for CRAR 79,220 79,220 B6 g Profit and Loss Account 7,433 6,329
a) Considered for Regulatory Consolidation - (1,533) B7 b) Not Considered for Regulatory Consolidation 7,433 7,862
h Exchange Reserve 1 1 B8 i Property Investment Reserve 207 207 C1 j Investment Reserve 1,007 1,007 C2 k General Reserve - 126 C3
Total Capital and Reserves 246,977 256,223
iii Deposits 751,931 751,931
of which: Deposits from banks 25,044 25,044
of which: Customer deposits 726,887 726,887
of which: Other deposits (pl.specify) - -
iv Borrowings 104,529 107,058
of which: From RBI 31,130 31,130
of which: From banks - -
of which: From other institutions 51,969 51,969
of which: subordinated debt -
of which: Others (borrowings outside India) 21,430 23,959
v Other liabilities & provisions 195,182 197,617
of which: Provision for Countercyclical Buffer 750 750 D1 of which: Provision Held for Sold NPA's 312 312 D2 of which: Provision for Country Risk 64 64 D3 of which: Provision for Standard assets 5,672 5,695 D4
Total Capital & Liabilities 1,298,619 1,312,829

42
Risk review and disclosures under Basel III Framework for the period ended 31 March 2016
Assets
vi Cash and balances with Reserve Bank of India 31,277 31,277
vii Balance with banks and money at call and short notice 38,663 42,255
viii Investments 339,097 339,248
of which: Government securities 278,072 278,072
of which: Other approved securities - -
of which: Shares 229 381
of which: Debentures & Bonds 9,888 9,888
of which: Subsidiaries / Joint Ventures / Associates - -
of which: Others (Commercial Papers, Mutual Funds etc.) 50,907 50,907
ix Loans and advances 665,360 675,385
of which: Loans and advances to banks - -
of which: Loans and advances to customers 665,360 675,380
x Fixed assets 14,234 14,330
of which: Goodwill 10 10 E1
of which: Intangible 8 41 E2 xi Other assets 209,988 210,334
of which: Deferred tax assets 49,630 49,759
of which: Ho Debit Balance 3 3 F1 of which: Incurred CVA loss(20%) 482 482 F2
Total Assets 1,298,619 1,312,829
18. DF 13 - Main Features of Regulatory Capital Instruments
As of 31 March 2016, there were no regulatory capital instruments issued by SCBI.
19. DF 14 - Full Terms and Conditions of Regulatory Capital Instruments
As of 31 March 2016, there were no regulatory capital instruments issued by SCBI.
20. DF 15 - Disclosure Requirements for Remuneration
The Bank’s compensation policies including that of CEO’s, is in conformity with the Financial Stability Board principles and standards. In accordance with the requirements of the RBI Circular No. DBOD No.BC.72/29.67/001/2011-12 dated 13 January 2012, the Regional Office of the Bank has submitted a declaration to RBI confirming the aforesaid matter. Accordingly no disclosure is required to be made in this regard.
21. DF - 16 Equities – Disclosure for Banking Book Positions
Investments in equities (in ` 000’s) as at 31 March 2016 amounts to ` 1,486,650 and mainly include shares obtained from restructuring of debt in case of certain clients. As per the banks accounting policy they are

43
Risk review and disclosures under Basel III Framework for the period ended 31 March 2016
classified as ‘Available for Sale’ (AFS). Unquoted equity shares are valued at the break-up value, if the latest balance sheet is available, or at Re. 1, as per RBI guidelines.
The break-up of equities into quoted and unquoted is as under: (` in 000s)
Particulars 31.03.2016
Quoted 775,736
Unquoted 710,914
Total 1,486,650
22. Leverage Ratio
The bank is required to maintain a minimum leverage ratio of 4.5%. The bank’s leverage ratio, calculated in accordance with the RBI guidelines under consolidated framework is 10.64% as of 31 March 2016 (Previous Year: 8.98%).
DF-17 Quantitative disclosures
Summary comparison of accounting assets vs. leverage ratio exposure measure (` in M)
31 March 2016 31 March 2015
Sr. No. Item Solo Consol Solo Consol
1 Total consolidated assets as per published financial statements
1,298,619 1,312,829 1,317,397 1,333,998
2 Adjustment for investments in banking, financial, insurance or commercial entities that are consolidated for accounting purposes but outside the scope of regulatory consolidation
- - - -
3 Adjustment for fiduciary assets recognised on the balance sheet pursuant to the operative accounting framework but excluded from the leverage ratio exposure measure
- - - -
4 Adjustments for derivative financial instruments
240,270 240,270 307,794 307,794
5 Adjustment for securities financing transactions (i.e. repos and similar secured lending)
2,116 2,116 - -
6 Adjustment for off-balance sheet items (i.e. conversion to credit equivalent amounts of off- balance sheet exposures)
406,091 406,091 711,856 712,076
7 Other adjustments (38,993) (38,276) (29,615) (29,658)
8 Leverage ratio exposure 1,908,103 1,923,030 2,307,432 2,324,210
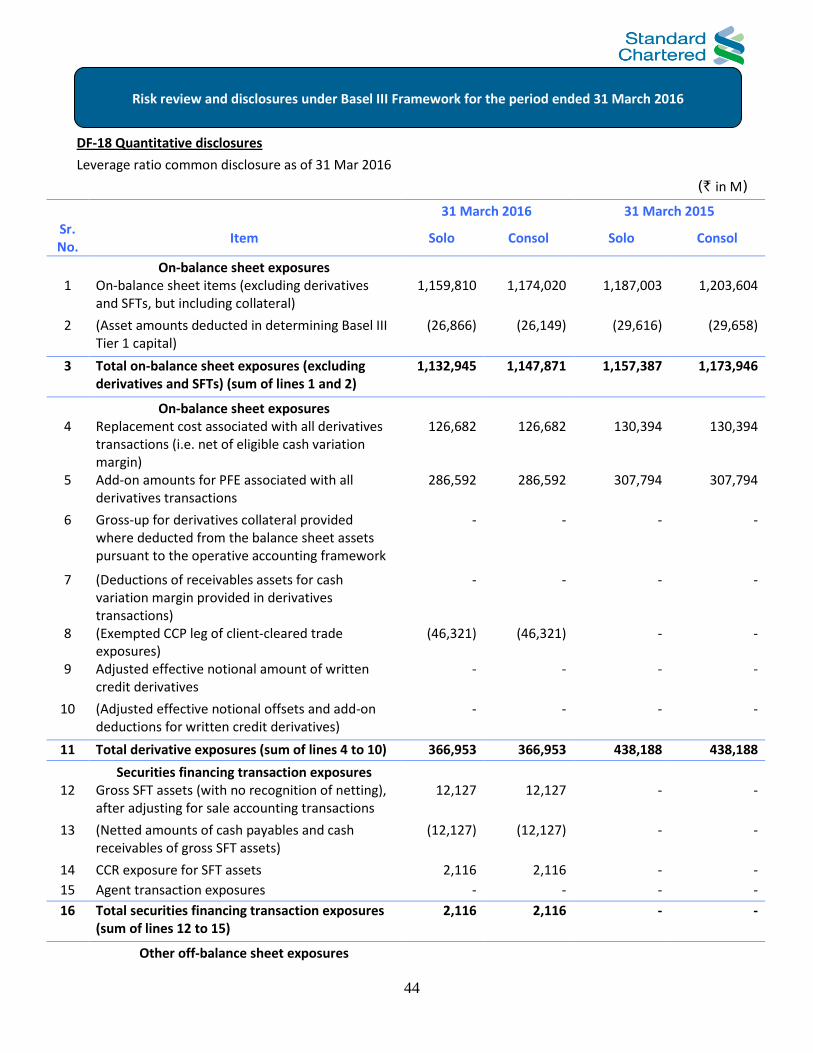
44
Risk review and disclosures under Basel III Framework for the period ended 31 March 2016
DF-18 Quantitative disclosures
Leverage ratio common disclosure as of 31 Mar 2016
(` in M)
31 March 2016 31 March 2015 Sr. No.
Item Solo Consol Solo Consol
On-balance sheet exposures
1 On-balance sheet items (excluding derivatives
and SFTs, but including collateral) 1,159,810 1,174,020 1,187,003 1,203,604
2 (Asset amounts deducted in determining Basel III Tier 1 capital)
(26,866) (26,149) (29,616) (29,658)
3 Total on-balance sheet exposures (excluding derivatives and SFTs) (sum of lines 1 and 2)
1,132,945 1,147,871 1,157,387 1,173,946
On-balance sheet exposures
4 Replacement cost associated with all derivatives transactions (i.e. net of eligible cash variation margin)
126,682 126,682 130,394 130,394
5 Add-on amounts for PFE associated with all derivatives transactions
286,592 286,592 307,794 307,794
6 Gross-up for derivatives collateral provided where deducted from the balance sheet assets pursuant to the operative accounting framework
- - - -
7 (Deductions of receivables assets for cash variation margin provided in derivatives transactions)
- - - -
8 (Exempted CCP leg of client-cleared trade exposures)
(46,321) (46,321) - -
9 Adjusted effective notional amount of written credit derivatives
- - - -
10 (Adjusted effective notional offsets and add-on deductions for written credit derivatives)
- - - -
11 Total derivative exposures (sum of lines 4 to 10) 366,953 366,953 438,188 438,188
Securities financing transaction exposures
12 Gross SFT assets (with no recognition of netting), after adjusting for sale accounting transactions
12,127 12,127 - -
13 (Netted amounts of cash payables and cash receivables of gross SFT assets)
(12,127) (12,127) - -
14 CCR exposure for SFT assets 2,116 2,116 - -
15 Agent transaction exposures - - - -
16 Total securities financing transaction exposures (sum of lines 12 to 15)
2,116 2,116 - -
Other off-balance sheet exposures

45
Risk review and disclosures under Basel III Framework for the period ended 31 March 2016
17 Off-balance sheet exposure at gross notional amount
1,188,303 1,188,303 711,856 712,076
18 (Adjustments for conversion to credit equivalent amounts)
(782,212) (782,212) -
19 Off-balance sheet items (sum of lines 17 and 18) 406,091 406,091 711,856 712,076
Capital and total exposures
20 Tier 1 capital 195,168 204,585 200,168 208,812
21 Total exposures (sum of lines 3, 11, 16 and 19) 1,908,103 1,923,030 2,307,432 2,324,210
Leverage ratio
22 Basel III leverage ratio 10.23% 10.64% 8.67% 8.98%
Reconciliation of total published balance sheet size and on balance sheet exposure (` in M)
31 March 2016 31 March 2015 Sr. No.
Item Solo Consol Solo Consol
1 Total consolidated assets as per published financial statements
1,298,619 1,312,829 1,317,397 1,333,998
2 Replacement cost associated with all derivatives transactions i.e. net of eligible cash variation margin
(126,682) (126,682) (130,394) (130,394)
3 Adjustment for securities financing transactions (i.e. repos and similar secured lending)
(12,127) (12,127) - -
4 Adjustments for entities outside the scope of regulatory consolidation
- - - -
5 On-balance sheet exposures under leverage ratio (excluding derivatives and SFTs)
1,159,810 1,174,020 1,187,003 1,203,604