risk seminar session 1 – introduction to … seminar session 1 – introduction to risk management...
TRANSCRIPT

© Oliver Wyman | LON-FSP03201-034
RISK SEMINARSESSION 1 – INTRODUCTION TO RISK MANAGEMENTNOVEMBER 2012
Stockholm, KTH
Contents
1. Introduction to risk
2. Risk Appetite
Case study: Risk Appetite engagement
3. Introduction to Economic Capital, risk types and risk measurement
Economic Capital – overview
Risk types – overview
Credit risk
Market risk
Operational risk

Introduction to riskSection 1

33© Oliver Wyman | LON-FSP03201-034
A typical bank’s balance sheet expose the institution to a number of risks (Illustrative)
Time 1 ChangeAssetsCash & balances with CB 50,073 0.1%Treasury bills 50,000 0.0%Loans to credit institutions 70,000 0.0%Loans to the public 875,518 1.3%Shares 53 17.2%Interest bearing securities 100,054 0.0%Derivatives 133 8.9%Intangible assets 2,999 0.0%Property and equipment 1,436 0.0%Other assets 60,565 0.0%Total assets 1,210,831 1.0%
LiabilitiesDeposits by credit institutions 85,000 0.0%Deposits from the public 268,912 0.8%Debt securities in issue 756,176 1.1%Derivatives ‐ N/AOther liabilities 60,000 0.0%Subordinated liabilities 15,000 0.0%Total liabilities 1,185,088 0.9%
EquityShare capital 23,000 0.0%Retained earnings 2,743 105.5%Total equity 25,743 5.8%Total liabilities and equity 1,210,831 1.0%
• Do I have enough liquid funds to sustain a closure of the funding market?
• Will my customers pay back the money they owe on time?
• How sensitive are my traded assets to market movements?
• What is the likelihood for a deposit run and how severe would it be?
• How frequently does my debt need refinancing and do I have the capacity?
• What is my re-pricing terms and what happens when IR changes?
• How likely is it that any of the above risks will deplete my equity? (See overleaf)

44© Oliver Wyman | LON-FSP03201-034
From a solvency perspective, a financial institution holds capital to protect against losses in a “worst-case” year
Assets
• Cash• Loans• Investment
securities
Liabilities
• Deposits• Borrowings• Shareholders’
equity
Available capital
Responsibility towards debt holders is “fixed” from a cash-flow perspective
• Buffer against asset value change
• Not stable: varies according to losses and retained earnings
Volatility in asset value
Economic capital indicates the amount of net financial resources required to
ensure solvency in the face of worst-case balance sheet losses
Asset value is susceptible to risk (e.g. credit losses, changes in market prices, fraud, etc.)
Typical bank balance sheet

55© Oliver Wyman | LON-FSP03201-034
The risks that a bank face are typically categorized into the following broad segments
Over and above the solvency related risks there are also a number of risks that threaten the liquidity of the institution
Major risk types relevant for Banks Description/examples
Credit Risk Will a counterparty pay back a loan (on time)?
Market Risk Will my assets lose value due to unfavourablemarket movements?
Interest Rate Risk Will my assets lose value due to unfavourableinterest rate movements?
Transfer Risk Will a foreign borrower be able to obtain the currency required to repay the debt?
Operational (Event) Risk Losses due to unforeseen events regarding people, process or system failures
Business Risk Fluctuation in consumer demand
Insurance Risk Uncertainty in number of claims and e.g. mortality assumptions

Risk appetiteSection 2

77© Oliver Wyman | LON-FSP03201-034
Risk Appetite serves as one of the most important mediums for coordinating risk-taking activities across a bank
Finance
RiskCorporate strategy
Where should we place our strategic bets?
Which risks arewe taking?
How much capital do we need?
How leveraged do we want to be?
How to optimise therisk-return trade-off?
How should we measure
value creation?
Where should we allocate
excess capital?
How should we allocate resources for
sustainable growth?
What are acceptable risks?
How volatile can results be?
• All businesses take risk to generate returns; but the types of risk taken, the absolute amounts to which the company is exposed, and how and where it is taken must be an input into strategy decisions, not a collateral by-product
• When the board and management discuss strategy, they make decisions about which risks the company will accept and take
• Risk appetite is defined as the amount of risk that the enterprise is willing to accept and risk tolerance as the degree of variance from risk appetite that the enterprise is willing to accept

8© Oliver Wyman | LON-FSP03201-034 8
Oliver Wyman supported a European bank in implementing a risk appetite framework to improve its long-term profitability
• The bank had strong risk management on transaction level, supported by a good risk culture. However, there was a need for a more integrated perspective with a focus on the portfolio view and interaction between different risk types
• Stakeholders, including regulators, debt-holders and shareholders were increasingly demanding that the Group Risk appetite was explicitly defined, monitored and actively managed
• Across the industry, financial institutions were moving towards a more structured approach to risk appetite
The overall aim of introducing the risk appetite framework was to improve the client’s risk management
and thereby long-term profitability
Case study: Risk Appetite engagement

99© Oliver Wyman | LON-FSP03201-034
The risk appetite implementation consisted of four stepsCase study: Risk Appetite engagement
Description
Identify key risk types to be managed1 Identify
appropriate metrics2 Calibration
of identified metrics3 Embed into
operational limitsin the business4
• The broad content of the risk appetite statement is outlined
• Main categories are articulated
• Detailed statements are defined in each main category
• A view on which statements to “manage by” and which to “report on” is taken (i.e. which statements are cascaded into limits and which are used as indicators of level of risk taking)
• Once statements have been identified the threshold needs to be defined (i.e. what constitutes an acceptable risk appetite)
• Analysis is based on external (peers) and internal data (current and historic values) as well as current limits and guidelines
• Where applicable, defined statements are cascaded to business units and regions to enable the business to manage based on the defined risk appetite
• Alignment of reporting will be performed as a result of this exercise

10© Oliver Wyman | LON-FSP03201-034 10
The risk appetite statements defined the outer boundaries to the client’s risk-taking activities
• The group level risk appetite consists of a number of statements on the acceptable level of risk taking covering the dimensions: Solvency, Earnings Volatility, Liquidity and Non-financial risks & reputation
• The risk appetite statements were approved by the Board of Directors and the actual risk profile in relation to each of the defined statements are regularly reported to the Risk Committee and the Board of Directors
• The statements collectively define the outer boundaries to the bank’s group-wide risk-taking activities and are translated into limits on lower organisation levels and embedded into key processes, such as strategic planning
Case study: Risk Appetite engagement

1111© Oliver Wyman | LON-FSP03201-034
Category Metric Status Comment
Credit risk Single customer concentration Green Summary of explanatory commentary
Industry concentration Amber Summary of explanatory commentary
Geographic concentration Green Summary of explanatory commentary
Expected loss Green Summary of explanatory commentary
Loan loss Green Summary of explanatory commentary
Probability of default Green Summary of explanatory commentary
Market risk Maximum reported market risk loss per quarter
Green Summary of explanatory commentary
Total economic loss from markets Red Summary of explanatory commentary
Operational risk Operational risk loss Green Summary of explanatory commentary
Reputational impact Green Summary of explanatory commentary
Solvency Tier 1 capital ratio Green Summary of explanatory commentary
Leverage ratio Green Summary of explanatory commentary
Target credit rating Green Summary of explanatory commentary
Liquidity risk Survival horizon Amber Summary of explanatory commentary
Compliance/ Non-negotiable risks
Regulatory requirements Green Summary of explanatory commentary
Internal policy and external regulatory breaches
Green Summary of explanatory commentary
Risk appetite dashboardExecutive management report
The statements consist of an overall risk appetite dashboard that enables further drill-down for additional detail
Risk dashboard
• Contains clear traffic light summary for all factors at the highest level
• Provides a clear overview and guides the reader to the key sections to focus on
• General descriptive comment for each category, focusing on recent developments
Statement reporting
• Visualises current status and development of each factor, and where relevant key drivers
• Comments are focused on explaining cause and impact of status and development
• Detailed drill down for individual drivers are available for all factors as appendix
Credit Risk (2/6) – Industry concentration
Industry concentration
Industry concentration movements
Top industry drill down
Industry Exposure EC EC% EC limit CommentReal estate management and investment
XX XX XX 20.7% Comment on development
Forest materials
XX XX XX XX Comment on development
Shipping and offshore
XX XX XX XX Comment on development
… … … …
Development of industries concentration risks– Comments on changes within considered/top industries
Comments on general structure of portfolio– E.g. Industries considered in analysis
Geographic and name-level concentrations within the largest industries
Comments on rating and economic capital limits
Comments on development efforts w.r.t. metric (as long as ongoing)
Comments
9,3% 9,9% 11,2%11,2% 9,4% 9,0%
0%
5%
10%
15%
20%
25%
2009Q4 2010Q1 2010Q2
Real estate Industry X
Real estate limit
Industry X limit
The following industry sectors should not individually be responsible for more than the stated percentage of total corporate credit risk economic capital:- Real estate management and investment : 12.0% (or up to 16% if fully explained by credit quality deterioration)
Action tracking
Previous follow-up actions agreed for metric Comments on new proposed actions
Case study: Risk Appetite engagement

1212© Oliver Wyman | LON-FSP03201-034
• Comments on the development of concentration risks– Analysis of the top 10, top 3 and top counterparties– Comments on changes within these counterparties
• General structure of portfolio– e.g. how many counterparties to consider in the
analysis
• Comments on geographic and industry concentrations within the largest single names
• Comments on rating and economic capital limits
• Comments on development efforts w.r.t. metric (as long as ongoing)
Customer concentration movements
Top single counterparties
Counterparties PDExposure (BN) Limit EC MM EC % Comment
Counterparty 1 1.22% 1,24 XX 71 0.81% Comment on development
Counterparty 2 0.88% 1.04 XX 63 0.71% Comment on development
Counterparty 3 0.03% 0.93 XX 43 0.53% Comment on development
Counterparty 4 1.14% 0.85 XX 41 0.51% Comment on development
… … … … …
The 25 largest corporate counterparties should not be responsible for more than 8% of corporate credit risk economic capital, and a single counterparty should not be responsible for more than 1% of corporate credit risk economic capital
• Previous follow-up actions agreed for metric
• Comments on new proposed actions
Top-25 limit
Top counterparty limit
Example report: Single customer concentrationCase study: Risk Appetite engagement
CommentsCustomer concentration
Action tracking
0,78% 0,92% 0,91% 0,78%
7,9% 7,4% 7,2% 7,1%
0%
2%
4%
6%
8%
10%
Q4 2010 Q1 2010 Q2 2010 Q3 2010
Top counterparty Top 25 counterparties

Introduction to Economic Capital, risk types and risk measurement
Section 3
1414© Oliver Wyman | LON-FSP03201-034
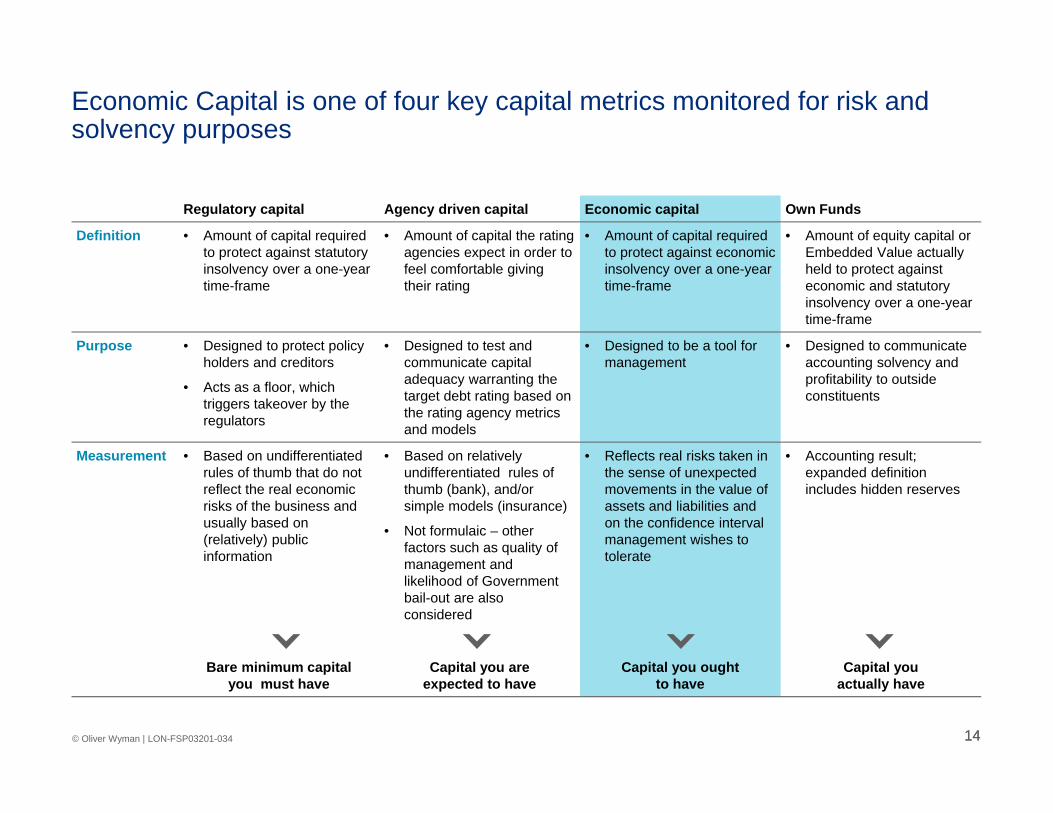
Economic Capital is one of four key capital metrics monitored for risk and solvency purposes
Regulatory capital Agency driven capital Economic capital Own Funds
Definition • Amount of capital required to protect against statutory insolvency over a one-year time-frame
• Amount of capital the rating agencies expect in order to feel comfortable giving their rating
• Amount of capital required to protect against economic insolvency over a one-year time-frame
• Amount of equity capital or Embedded Value actually held to protect against economic and statutory insolvency over a one-year time-frame
Purpose • Designed to protect policy holders and creditors
• Acts as a floor, which triggers takeover by the regulators
• Designed to test and communicate capital adequacy warranting the target debt rating based on the rating agency metrics and models
• Designed to be a tool for management
• Designed to communicate accounting solvency and profitability to outside constituents
Measurement • Based on undifferentiated rules of thumb that do not reflect the real economic risks of the business and usually based on (relatively) public information
• Based on relatively undifferentiated rules of thumb (bank), and/or simple models (insurance)
• Not formulaic – other factors such as quality of management and likelihood of Government bail-out are also considered
• Reflects real risks taken in the sense of unexpected movements in the value of assets and liabilities and on the confidence interval management wishes to tolerate
• Accounting result; expanded definition includes hidden reserves
Bare minimum capital you must have
Capital you are expected to have
Capital you oughtto have
Capital youactually have

1515© Oliver Wyman | LON-FSP03201-034
Economic Capital is based on the economic balance sheet, which considers assets and liabilities at economic value (i.e. fair or market value)
Expected
Required Economic Capital
Net assetvalue
Probability of outcome
Tail probability
AvailableEconomic
Capital
RequiredEconomic
Capital
Excess Capital
Economicvalue
of assets
Economic netasset value
Assetvolatility
Economicvalue
of liabilities
Liabilityvolatility
Economic balance sheet Distribution of economic net asset value
Available vs. required Economic Capital
• Economic value of assets includes all unrealised capital gains and excludes any amortisation, deferred acquisition costs, negative reserves, etc.
• Economic value of liabilities includes the guaranteed liabilities and value of options to policyholders for in-force business

Risk typesOverview
Section 3.1

1717© Oliver Wyman | LON-FSP03201-034
Volatility of economic earnings (including changes in balance sheet value)
Earnings volatility due to errors/omissions or changes in operating economics
Earnings volatility due to changes in market pricesor liquidity
Earnings volatility due to variation in credit losses
Economic capital
• Loans• Derivative
counterparties• Reinsurance
counterparties
• Equities• Bonds• Foreign Exchange• Real Estate• ALM risk• Liquidity risk
• Fraud• Unintentional
errors• Legal risk
• Changes in business volumes
• Changes in margins and costs
Financial institutions face three fundamental sources of risk for which they need to hold capital
Total economic risk
Credit riskIssuer/transfer/counterparty
Market riskTrading/ALM/interest rate
Operating riskBusiness/operational

1818© Oliver Wyman | LON-FSP03201-034
While different tools and methodologies are used to measure each risk…Lo
ss R
ate
Mean
Time
EL
Time
$
OperatingRisk
Capital
DM appreciation
USD appreciation
Jan 87 Jan 88 Jan 89 Jan 90 Jan 91 Jan 92 Jan 93
105104103102101100
9998979695
2 Standard deviations
Credit risk Market risk
Operating risk
OperatingRisk
Capital

1919© Oliver Wyman | LON-FSP03201-034
Prob
abili
ty
Unexpected lossesExpected losses
Manage causes Manage volatility/capitalise
…they are all based on modeling loss or value distributions
Economic capital
Economic capital is the “amount you will lose over a year with probability x%”
Illustrative loss distribution

2020© Oliver Wyman | LON-FSP03201-034
Standalone EC Diversified EC
For preciseness and ease of computation, Economic Capital is typically measured separately for each risk type…
Aggregation Engine
Inter-Risk Dependencies
…Credit Risk
ALM Risk
Market Risk
Market /ALM
Operational & Business
DiversificationBenefit
Credit
…and thereafter aggregated to a Bank-wide figure, taking into account diversification effects
OutputRisk AggregationStandalone Risk Measurement

Credit riskSection 3.2

2222© Oliver Wyman | LON-FSP03201-034
Credit Risk is expressed through the concepts of Expected Loss and Unexpected Loss
• Anticipated average annual loss rate• Foreseeable “cost” of doing business• Not “risk” as investors think of it, but rather charge
which affects anticipated yield• Equal to the mean (average) of losses over an
economic cycle
• Anticipated volatility of loss rate• Results in volatility of return over time• Unanticipated but inevitable• Requires a balance sheet cushion of “economic” capital• Defined as one standard deviation of losses
Cre
dit l
osse
s
Time (years)
EL
Expected Loss (EL)
Unexpected Loss (UL)UL
Frequency
Cre
dit l
osse
s

2323© Oliver Wyman | LON-FSP03201-034
Key risk parameters used to estimate Expected Loss and Unexpected Loss
Probability of default(PD)
Who are you lending to?
What is the % you expect to lose? Time to repayment? Expected exposure if
borrower defaults?
Loss Given Default(LGD)
Maturity (M)
Exposure at Default(EaD)
• Quantifies likelihood of borrower being unable to repay
• Rating models calibrated to long-term cycle averaged PD (central tendency)
• Quantifies the % of the exposure that is lost in the case of default, including economic costs e.g. legal costs
• Generally depends on the collateral and product type
• Quantifies the exposure at risk in the case of default
• Calculation depends upon product type
• Level of “connectedness” of individual loans in the portfolio
• Asset correlation, PD and default correlation related via Merton model
Asset/default correlation
Correlation
Credit risk
Borrower characteristics
Facility characteristics
Portfolio characteristics

2424© Oliver Wyman | LON-FSP03201-034
The economic capital calculation centers around estimating uncertainty around portfolio EL, and may be calculated via two different methods
Probability of default (PD)
Exposure at default (EaD)
Loss given default (LGD)
Expected loss (EL)
x
x
Stochastic simulation model
Closed-form aggregation model
Calculate unexpected loss (UL)
Calculate theoretical loss distribution
Run stochastic simulations
Generate simulated loss distribution
Economic capital
Economic capital calculation overview
Primary focus of economic capital build-out

2525© Oliver Wyman | LON-FSP03201-034
There are pros and cons to using a simulation vs. closed-form aggregation model for credit risk
Method Closed-form aggregation Simulation
Description Use a customised statistical approach; analytical formulae
Do a bottom-up approach covering multiple risk drivers to describe credit risk
Risk drivers
Requires at minimum: PD, LGD, EaD, associated volatilities, correlations, capital multiplier
Can be applied at loan-level or segment-level
Requires at minimum: drivers of PD, LGD, EaD, loan characteristics (maturity, amortization schedules)
Pros • Straightforward• Easily manipulate-able, can be spreadsheet-based• Easily customised
• Very powerful in describing full credit risk distribution
• Bottom-up approach can incorporate loan-level borrower behavior and product characteristics (e.g. optionality)
Cons • Accuracy of ecap estimate is highly linked to accuracy of correlations
• Does not capture borrower or management optionality well
• Complex• Requires lots of data• Difficult to parameterise especially for non-
public companies

Market riskSection 3.3

2727© Oliver Wyman | LON-FSP03201-034
Market risks affect both the asset and the liability side of the balance sheet
EquityInterest rate
Real estate
Foreign exchange
Market risks
Assets
Liabilities
Net asset value
• Movements in value of equity, fixed income and real estate investments
• Movements in value of derivatives held for hedging purposes
• Change in market value of liabilities due to
– Changes in the value of embedded options and guarantees
– Changes in market-driven policyholder behaviour
Calculating Economic Capital for market risk requires assessing asset
and liability values in stress scenarios

2828© Oliver Wyman | LON-FSP03201-034
Market Risk
Market Risk arises from two sources
• Measures market risks for liquid, actively traded positions across many markets
• Incorporates correlations across markets (e.g. interest rates, foreign exchange, commodities)– Interest Rate Risk– Equity Risk– Foreign Exchange Risk– Commodity Risk– Option Risk
• Measures structural interest rate mismatch between illiquid assets and liabilities in home currency
• Risk measured based on long time horizons and large market movements– Interest Rate Risk– Liquidity Risk– Maturity Risk
Trading Risk Asset/Liability Mismatch Risk

2929© Oliver Wyman | LON-FSP03201-034
Shareholder equity
ALM risk arises from the structural inadequacy between assets and liabilities on the balance sheet…
Assets Liabilities
“Interest sensitive assets”• Short term loans at fixed rate• Long term loans at fixed rate• Short term loans at variable
rate• Long term loans at variable
rate
“Interest bearing liabilities”• Customer deposits• Long term borrowings• Short term loans at fixed rate• Short term loans at
variable rate
-50
-40
-30
-20
-10
0
10
20
Valu
e
Liabilities Assets
• Banking is founded on the principle of leveraging a low cost of funds• The “Assets” side of the balance sheet tends to exhibit much longer duration than the “Liabilities” side
– The bulk of bank liabilities come in the form of short-term deposits, sensitive to changes in the short term interest rates– Opportunities to make money typically involve longer duration activities, sensitive to changes in the long term interest rates
• Managing the risk associated with this lopsided balance sheet is essential to keeping a bank afloat
Gap profile of a typical bank B/SBalance sheet characteristics of a typical bank

3030© Oliver Wyman | LON-FSP03201-034
…and is an aggregation of Interest rate (IRR), FX and Liquidity risks
Illustrative IR shocks
Base case
Tenor
Tenor
Tenor
Tenor
Rat
eR
ate
Rat
eR
ate
• Liquidity risk is the risk of inability to meet payout commitments due to problems raising new funds or selling assets
Liquidity risk
• FX risk is driven by the volatility of exchange rates of all currencies on the balance sheet
• Balance sheet assets and liabilities are denominated in different currencies
FX risk
• Interest rate risk is driven by the volatility of interest rates leading to changes in the yield curve i.e. shifts, twists etc.
• Balance sheet assets and liabilities have different sensitivities to interest rates in terms of economic value and generated margin
Interest rate risk
+
+

3131© Oliver Wyman | LON-FSP03201-034
For Trading Risk, Value-at-Risk is an appropriate measure of Market Risk
• Trading holding periods are short-term
• Losses are largely independent from day-to-day
• Non-linearity of options less of an issue over short time periodsValue-at-risk
• Typically daily horizon
• Two standard deviations(97.52 confidence)
Trading P&L
0
2
Adjustments are made for liquidity, time horizon and management intervention when converting to Economic Capital
Operational riskSection 3.4

3333© Oliver Wyman | LON-FSP03201-034
• Changes in volumes• Changes in margins• Changes in costs• Changes in competitive
environment• Etc.
• Systems failure• Fraud• Litigation• Processing error• Breach of regulation• Etc.
Operating Risk splits into two subcategories
Business Risk Operational/Event Risk
Operating Risk

3434© Oliver Wyman | LON-FSP03201-034
Operational risks occur from many sources
Category Symptoms typically observed Largest event observed
Intentional fraud, collusion or misrepresentation by own staff or agents
• Rogue trader
• Internal theft
• Willful misrepresentation of P&L or risk
$2,500 MMSumitomo copper trader fraud
Unintentional errors and omissions by internal staff or agents
• Incorrect accounting, modelling, pricing or risk assessment
• Programming and data input/output errors
• Settlements/reconciliation errors
$500 MMCitibank failure of controls in Australian loan approval system
Man-made shocks and disasters (external)
• Externally perpetrated fraud
• Unanticipated regulatory changes and changes in tax regimes
• Unanticipated legal disputes or change in interpretation of the law
$1,200 MMPrudential Securities suit from ING for bad advice on purchase
Unanticipated loss of resources • Loss of key systems resources
• Loss of key personnel
• Loss of key suppliers, e.g. information providers
$85 MMCitibank cancellation of software contract
Natural disasters and shocks • Acts of God, e.g. earthquake
• Accidental damage, e.g. fire
$75 MMCredit Lyonnais fire at HQ
Etc.

Appendix

3636© Oliver Wyman | LON-FSP03201-034
Risk, in a financial sense, is defined as Volatility in Earnings (or Losses)
• Risk is any deviation from expectations– e.g. 2% loss a year
• For a loan portfolio risk is any deviation from expected losses– If a bank knows that it will lose exactly
2% in write-offs every year, it does not carry any risk
– Risk arises from uncertainty around the expectation of a 2% annual loss
0 Expectedearnings
Earnings distributionLikelihood of outcome

3737© Oliver Wyman | LON-FSP03201-034
A risk appetite statement represents what risks a Group is prepared to expose itself to as part of its business
For instance• Globally leading financial group• Committed to excellence in all markets it is
active in• Financial ambitions
– Target rating– Target ROE – Maintain dividends
• What is the worst result you would accept in terms of earnings over the course of a business cycle? How frequently would you accept zero profit?
• What is the worst rating you would be willing to accept once in your career?
• In what circumstances would you actually consider cutting your dividend? How often would you expect a company to experience a dividend cut?
• When would you take drastic measures to protect solvency?
Consistency
The Risk Appetite calibration process is crucial to ensure consistency with the business model
Risk Appetite addresses the following types of questions…
…in the context of the business model

3838© Oliver Wyman | LON-FSP03201-034
The goal of defining a risk appetite is to make explicit an appropriate level and nature of risk the Group is prepared to accept in pursuit of its’ desired strategy
• Build confidence (internal and external)– Clear “field of play” for operations– Comprehensive and robust basis for
external communication
• Force explicit consideration of the risk implications of strategy choices, and vice versa– Provoke dialogue: “how much is too much?”
• Raise internal awareness of potential issues– “Plain English” description of risk
management – Facilitate debate on potential future risks
• Pre-position for future events– De-risking to bring reality in line with
expectations– Early warning measures feeding up to
senior management
• Build mechanisms for implementation– Develop risk management “levers”
• Don’t be taken by surprise…
• …and don’t take stakeholders by surprise
• Don’t allow “separation from the herd”
• Prevent inaccurate external rumours

3939© Oliver Wyman | LON-FSP03201-034
The risk appetite statement should be clearly defined and link to potential management actions that can be used to adjust the risk profile
Qua
ntita
tive
Qua
litat
ive
Metric Illustrative definition Management options Key stakeholder
Target debt rating
• We target a Moody’s rating of “XXX” on our senior debt, at all times staying above “YYY”
• Granular measurement of Economic Capital• Monitoring key metrics (e.g. AFR,
liquidity, etc.)
• Debtholders• Rating agencies
Earnings volatility
• We will not miss consensus earnings forecast by more than “X”% at a “YY”% confidence level
• We will aim to consistently target dividend of “XXX”
• Quantitative stress testing of business plans • Shareholders
Maximum loss
• We do not wish to see a loss of more than “XXX” at the “YY”% confidence interval
• Bottom up risk measurement • Management
Liquidity headroom
• Available liquidity resources to meet requirements at “XX”% confidence interval
• Liquidity model to measure and forecast requirements
• Regulator• Shareholders• Debtholders
Reputation • Ensure that the highest ethical standards are followed at all times
• Ethical policy written to be followed by all staff all the time
• Customers• Regulator
Regulation • Have no significant instances of regulatory breach
• Compliance department • Regulator• Shareholders
Governance • Ensure appropriate policies and processes are followed at all times
• Internal/external audit • Regulator• Shareholders
Growth • All new business opportunities to follow appropriate risk controls
• Strategic Planning Process• Avoid portfolio concentrations
• Shareholders
Client example
Disguised client example of range of possible Risk Tolerance statements

4040© Oliver Wyman | LON-FSP03201-034
Reporting is a key element of the risk appetite framework; it should give management a clear understanding of the bank’s risk-taking capacity
• Consistent set of figures/charts allows trend tracing
• Drill down capability– Reports covering same broad themes but at different
levels of detail- Short Board summary linked to high-level risk
strategic profile- Longer risk type summaries enabling drill down into
risk-type issues- More detailed line of business reports allowing
further drill-down
• Traffic light risk triggers and pro-active contingency plans– Early warning system to identify capital and/or earning
strains linked to a preventative actions e.g.- Green – everything on track- Yellow – consider contingency plans - Orange – put contingency plans into action and
monitor- Red – Board/Group risk intervene as last resort
• Value added commentary plus ad-hoc analysis – Comments added to put words to the graphs– Tailored analysis carried out to focus attention on key
issues e.g. relevant trends/threat scenarios
• Action point tracking (e.g. limit breaches/major risks to the bank and follow-up actions)
Risk type andBU specifics
Risk type and
BU overview
Position and exposuredrill down
Summary and aggregation by reporting units
BUmanagement
Report
Appendix
Executivesummary
Report
Appendix
Executivesummary
Report
Appendix
Enterpriseoverview
BoardExecutive managementReporting hierarchy
Recommended reporting hierarchy Reporting principles

4141© Oliver Wyman | LON-FSP03201-034
Once embedded, a structured risk appetite framework will positively influence a number of key aspects across the organisation
Optimisingrisk avoidance/risk taking
Translating overall Risk Appetite limits into limits and targets on lower organisation levels means unwanted risk taking can be avoided and areas with scope for increased risk taking can be identified
Quicker changes in risk profile
Highlight risk topics to the Risk Committee and Board in a timely manner, leading to better risk-taking
Improved governance
Clearly defined limits and more focussed reporting will support risk oversight in all three lines of defence
Support risk culture
Clear reporting, defined limits and better overall transparency on risk capacity utilisation will help highlight the importance of risk management
Day-to-day business decision
All decision makers will have a clear understanding of what is expected in terms of risk taking, and the risk appetite will influence day-to-day decision making
Board communication
Support a more structured, holistic and meaningful communication with the board on risks

4242© Oliver Wyman | LON-FSP03201-034
Three basic measurement principles are relevant to the calculation of Economic Capital
Economic Capital is the amount of resources required to protect against economic insolvency due to changes in value over a
specified time horizon and confidence interval
Economic Capital principles for today’s discussion
Definition of value
Time horizon
Confidence level
1
2
3

4343© Oliver Wyman | LON-FSP03201-034
The key choice of time horizon is between a one-year view and a multi-year view
One-year approach Multi-year approach
• Solvency is assessed over a one-year time horizon
• Expected market value of assets and liabilities in one year is compared to ‘worst case’ market value of assets and liabilities in one year
• Assumes that the portfolio can be restructured within one year in the event of adverse scenarios
• Requires ability to assess the market value of the balance sheet. The volatility of all future cash flows is implicitly captured in the volatility of the market value
• Solvency is assessed over a multi-year time period
• The value of assets and liabilities is stochastically projected over multiple years and it is checked how much capital needs to be held initially to ensure that assets exceed liabilities at the end of the projection horizon
• Typically assumes that assets and liabilities are held to maturity
• Usually cash flow-based and often used when market value assessments are not available. Requires explicit modelling of cash flows over lifetime of the asset/liability
2
Time horizon

4444© Oliver Wyman | LON-FSP03201-034
The one-year Economic Capital framework is the market standard for financial institutions
• It introduces consistency across the Group
• It is in line with capital management/ planning horizon
• One year is a relevant time horizon over which re-capitalisation would be considered
• Despite being a one-year measure, it still captures change in market value which allows it to address multi-period nature of business
• For European institutions, regulators are heading in this direction
Expected scenario
Worst case scenario (for one risk factor)
Time
Fair
valu
e
Vt+1,expected
Vt+1,worst case
Worst casevalue loss
Economic Capital
Time horizon
2
Framework Why?

4545© Oliver Wyman | LON-FSP03201-034
• Economic Capital is the amount of capital that an institution needs to hold in order to keep its probability of insolvency below a pre-specified threshold
• Solvency standard is related to likelihood of default – anchored to observable corporate bond default rates at various ratings
• For the same risk profile, an institution targeting a better credit rating will need to hold more capital
Expectedvalue
Economic required capital
ECBBB
ECA
ECAA
ECAAA
Value
AAAA AA BBB
Probabilityof outcome
Tail
prob
abili
ties
Confidence interval
Most institutions calibrate their Economic Capital models to bond probabilities of default
3
Value at risk distribution

4646© Oliver Wyman | LON-FSP03201-034
VaR is not a good way to characterise ALM Risk if the value distribution is not normal
? XVAR
ALM
“Worst case” loss relative to VAR is a function of the skewness of the distribution
• Long horizon
• Non-linearity (optionality) material
Trading
Value-at-risk2
Therefore, for ALM, one should model the annual distribution explicitly
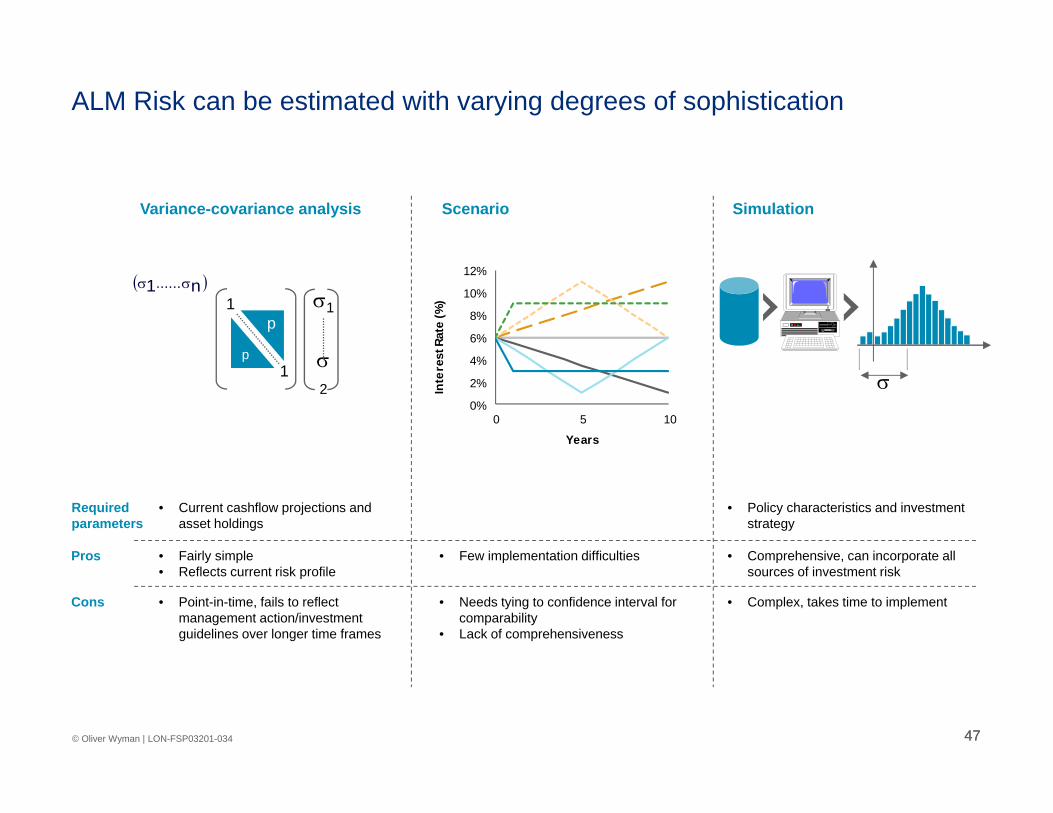
4747© Oliver Wyman | LON-FSP03201-034
Variance-covariance analysis Simulation
• Fairly simple• Reflects current risk profile
• Comprehensive, can incorporate all sources of investment risk
• Current cashflow projections and asset holdings
• Policy characteristics and investment strategy
n1 ......
p
p1
1
1
2
Scenario
0%
2%
4%
6%
8%
10%
12%
0 5 10
YearsIn
tere
st R
ate
(%)
• Few implementation difficulties
Requiredparameters
ALM Risk can be estimated with varying degrees of sophistication
• Point-in-time, fails to reflect management action/investment guidelines over longer time frames
• Complex, takes time to implement• Needs tying to confidence interval for comparability
• Lack of comprehensiveness
Pros
Cons