risk solutions user forum jeff bottari, vp risk solutions group checkfree october 24, 2007
Post on 18-Dec-2015
220 views
TRANSCRIPT

Risk Solutions User Forum
Jeff Bottari, VP Risk Solutions GroupCheckFree
October 24, 2007

2
Welcome!!

3
User Conference Objectives
Very few CheckFree commercials
Shared experiences using CheckFree products
Shared industry concerns
A time to talk with other banks about issues
Advise CheckFree on what you like, don’t like, and would like to see
A feeling of community
An opportunity to advance best practices
It should be fun!

Jeff Bottari
Compton Harry
Debb Gordon
Don Crosby
Robert McCannMichael Bunyard

Karen Taylor
Pete Sullivan
Jeff S-S-Sargent
Dee Millard
Mark Steeber

Angela Bardowell
Rich Rosner
Dan Barta
Roger Snell

7
Whatever happened to Carreker?

8
CheckFree / Carreker
Acquisition completed on April 1st, 2007
CheckFree is a $1 billion company with 4,400 employees world-wide, located in more than 20 different cities
Carreker’s current solutions are being integrated into CheckFree’s current product structure
The combination of the two predecessor companies makes CheckFree an industry leader in software applications that cross the traditional check-based & ACH payments arena
We are uniquely qualified to help banks balance customer needs with needs for greater efficiency and profitability, as an already diverse payments environment continues to evolve and change

9
CheckFree Snapshot
Premier provider of financial electronic commerce services and software products
Founded by current Chairman & CEO Pete Kight in 1981
Became a publicly traded company in 1995
26 years in operation
2006 in Review:
Revenue of $972.6 million
Nearly 1.3 billion transactions processed
Nearly 226 million electronic bills delivered
Nearly 2.7 million portfolios under management at year end

10
Whatever happened to CheckFree?
Soon to be a part of…
11
Carreker/CheckFree’s Risk Management Solutions
We are the premier supplier of Enterprise Risk and Fraud Mitigation Solutions.
Our Pragmatic Convergence approach provides financial institutions with maximum protection via multi-channel transaction monitoring and customer behavior modeling.

12
Pragmatic Approach Defined
The destiny: An enterprise risk mitigation platform which correlates fraud across access points and channels by customer
Allows you to leverage your existing investments to create an achievable strategic plan
Stay ahead of the fraudsters while gradually adding functionality
Each step provides a return on investment in months not years
prag·mat·ic [prag-mat-ik] -adjective: Concerned with practical matters; “a matter-of-fact approach to the problem”
— Webster

13
Weaknesses of Current Risk Management Models
Largely a Day 2 Process… Limited Day 1 and Day 0 Analytics
Day 0: Real time instantaneous transaction monitoring at Customer Access Point — Proactive
Day 1: Same-day analysis of transactions before posting (near real time or multiple batch runs) — Reactive
Day 2: Batch analysis after Posting — Reactive
Different capabilities in different silos
No ability to correlate transactions in multiple customer access points in multiple timeframes
Multiple analysts working same accounts in different channels

14
Example of Fraud Detection in Individual Silos
Sophisticated Fraudsters Will Find The Weakest Link
• Duplication of solution investments• High/unnecessary IT overhead• Duplication of data and resource expenses• No leverage of cross-silo alerts
Results in:
Alert MgmtSystem
Shared Data
Scoring Engines, Models, Rules
On-Us / Deposit
Alert MgmtSystem
Shared Data
Scoring Engines, Models, Rules
ACH
Alert MgmtSystem
Shared Data
Scoring Engines, Models, Rules
Wires
Alert MgmtSystem
Shared Data
Scoring Engines, Models, Rules
Internet /ATM
15
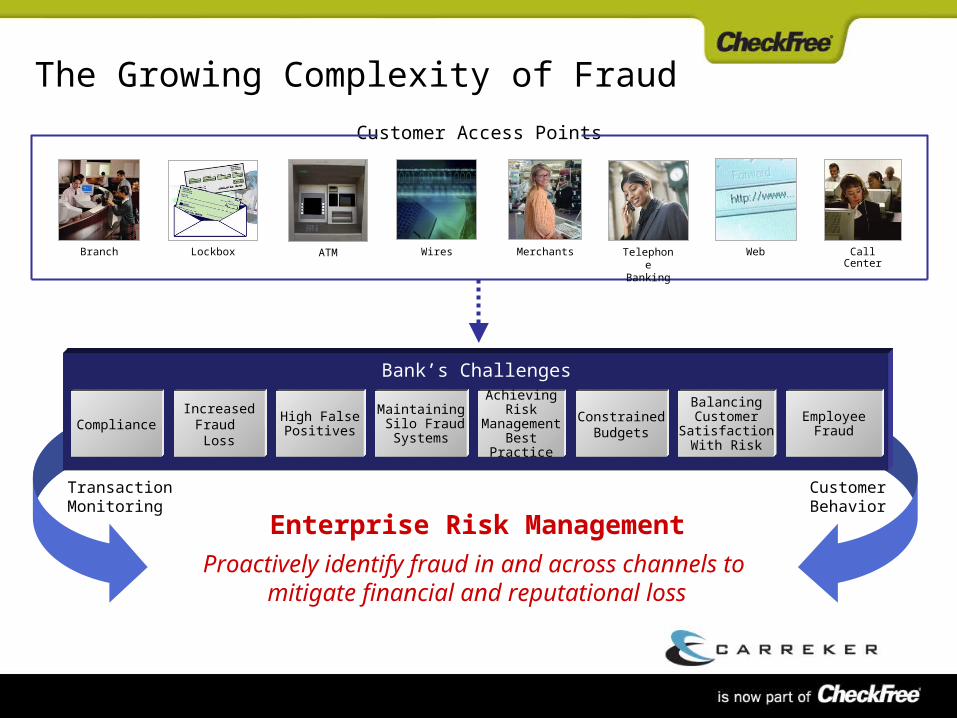
Customer Access Points
Enterprise Risk ManagementProactively identify fraud in and across channels to
mitigate financial and reputational loss
IncreasedFraud Loss
High FalsePositives
Achieving Risk
Management Best
Practice
Bank’s Challenges
Constrained Budgets
Balancing Customer
Satisfaction With Risk
Maintaining Silo Fraud Systems
The Growing Complexity of Fraud
Transaction Monitoring
Customer Behavior
Branch Lockbox WebMerchantsATM Telephone Banking
Call CenterWires
Employee FraudCompliance

16
Industry Best Practice:Enterprise Risk Management
Holistic View of transactions, accounts, and relationships
Monitor all transactions for suspicious behavior
Analyze monetary and non-monetary data
Enable creating rules containing cross-channel variables
Manage potential fraud cases effectively, from detection through law enforcement reporting
Move to Proactive vs. Reactive

17
Carreker/CheckFree Enterprise Risk Management
DetectionManagement
AlertManagement
CaseManagement
Other Detection
Investment Accounts
Credit Accounts
Other Detection
Other Detection
Liability Accounts
InvestigationInvestigation
Link Link AnalysisAnalysis
ReportingReporting
AcquireAcquire
ResearchResearch
DecisionDecision
AnalyzeAnalyze
Day 0, Day 1 or Day 2 Capabilities
Alerts
On-UsDeposit
WiresACH Fraud
ManagerFraud
Manager
Fraud
Workflow ManagerWorkflow Manager
Syfact Investigator
Syfact Investigator

18
Data Acquisition Detection
Data Staging
Workflow Manager Disposition
Data
Acq
uis
ition
En
gin
e
External Data
Sources
All Trans-actions File
Internal Data
Sources
FraudLink On-Us
Mainframe
FraudLink Deposit
Mainframe
Su
spect D
ata
base
Case Management
Ale
rt Packag
er
On-Us Real Time
DepositReal Time
On-Us Day 1 & 2
DepositDay 1 & 2
ACH
ATM
InternetBanking
Wires
Other
Modeling
Segments
Profiles
User Defined Rules
Filter
Lists
Alert Management
Research
Decisioning/ Fraud Analyst Workstation
Reporting
Queries / Dashboard
WorkDistribution
Credit LRM ATM/Cards Treasury Mgmt
Enterprise Risk Management

19
Frauds
Dashboard Example
On-Us Deposit ACH Wires OnlineLoans Internal
Enterprise Region Customer
Total Customers Alerted(000)’s
Total Fraud Volume YTD Number of Alerts Process per FTE
per Hour
Regions # Alerted % Increase from last Qtr
Region 12 7,245 15Region 14 5,895 10Region 5 5,432 7Region 8 5,236 3Region 11 2,529 0
Top 5 Customer AlertedRegions in 4Q 2005
Regions $ Alerted % Increase from last Qtr
Region 12 3,796,380 15Region 14 2,528,955 10Region 8 2,371,908 7Region 5 2,297,736 3Region 11 1,044,477 0
Top 5 Alerted AmountsRegions in 4Q 2005

20
Benefits of Enterprise Risk Management
Efficiency
Automated processes
Review fraud-rich pool of suspects with no addition to staff
Single platform for all fraud mitigation
Effectiveness
Improved fraud detection
Lower false positives, reduce false negatives
Improved analyst job satisfaction
Flexibility
Dynamic creation of rules
Image-based workflow
Champion vs. Challenger

21
Agenda Day One
Welcome and Introductions Jeff Bottari, VP Risk Solutions Group, CheckFree
Enterprise Alert Management: Managing Alerts More Effectively
Silvia Sarra, AVP Loss Prevention & Security, Sovereign Bank
Dan Barta, Service Delivery Manager, CheckFree
Citibank and CheckFree Fraud Manager Deposit Case Study
Debb Gordon, Director Business Architecture and Analysis, CheckFree
Reducing False Positives: Effectively using Account Types and Period Parameters
Lisa Zarzycki, Vice President and Risk Manager Fraud Services, Comerica Bank

22
Agenda Day One, continued
Internet Banking Fraud Trends Carly Boardman, Manager Cheque Compliance & Fraud Detection, ANZ
Peter Casey, Manager Fraud Detection, ANZ
Understanding Your Bank’s “Fraud Profile”: A Risk-Based Approach to Re-calibration
Mark Steeber, Risk Advisory Consultant, CheckFree
Closing Remarks Jeff Bottari
Cocktail Happy Hour
Client Conference Event
Tapas Bar and Drinks ReceptionTerrace Bay Lobby, Lower Level
San Diego Zoo

23
Agenda Day Two
Emerging Fraud Trends:What trends are you seeing?
Angela Bardowell, Director Risk Consulting Group, CheckFree
Product Roadmap
Product Roadmap Session with Customer Input
Michael Bunyard, Director Product Management, CheckFreeGroup Discussion
Group Discussion
Meeting Wrap-Up Jeff Bottari, VP Risk Solutions Group, CheckFree

Questions?

Enterprise Alert Management:Managing Alerts More Effectively
Silvia Sarra, Sovereign Bank
Dan Barta, CheckFree
October 24, 2007

26
What is Enterprise Alert Management?
en·ter·prise [en'-ter-prahyz] −noun:
1) a project or undertaking that is especially difficult, complicated, or risky
2) readiness to engage in daring or difficult action: initiative <showed great enterprise in dealing with the crisis>
3) a unit of economic organization or activity; especially: a) a business organization b) a systematic purposeful activity <agriculture is the main economic enterprise among these people>
— Webster

27
What “Enterprise” will we be Discussing Today?
Enterprise Definition and Scope
Focus on transaction accounts (DDA & SAV)
Focus on payment transactions and account opening
Limited inclusion of money laundering analysis
Focus on fraud and loss prevention activities
Other areas that could be included
Mortgage and other lending transactions
Investment accounts (brokerage, mutual funds, etc.)
Insurance
Other Industries

28
Payment ChannelsPayment Channels
Enterprise Alert Management
FraudLinkACHeCK
Falcon Fraud MgrWires Other ToolsFalcon
FraudLinkOn-Us/Deposit
Detection ToolsDetection Tools
SuspectReport
SuspectReport
SuspectReport
SuspectReport
SuspectReport
SuspectReport
ACH Debit Wires ATMCreditCheck

29
Payment ChannelsPayment Channels
Enterprise Alert Management
FraudLinkACHeCK
Falcon Fraud MgrWires Other ToolsFalcon
FraudLinkOn-Us/Deposit
Detection ToolsDetection Tools
ACH Debit Wires ATMCreditCheck
Workflow ToolWorkflow Tool
SuspectReport
SuspectReport
SuspectReport
SuspectReport
SuspectReport
SuspectReport
30
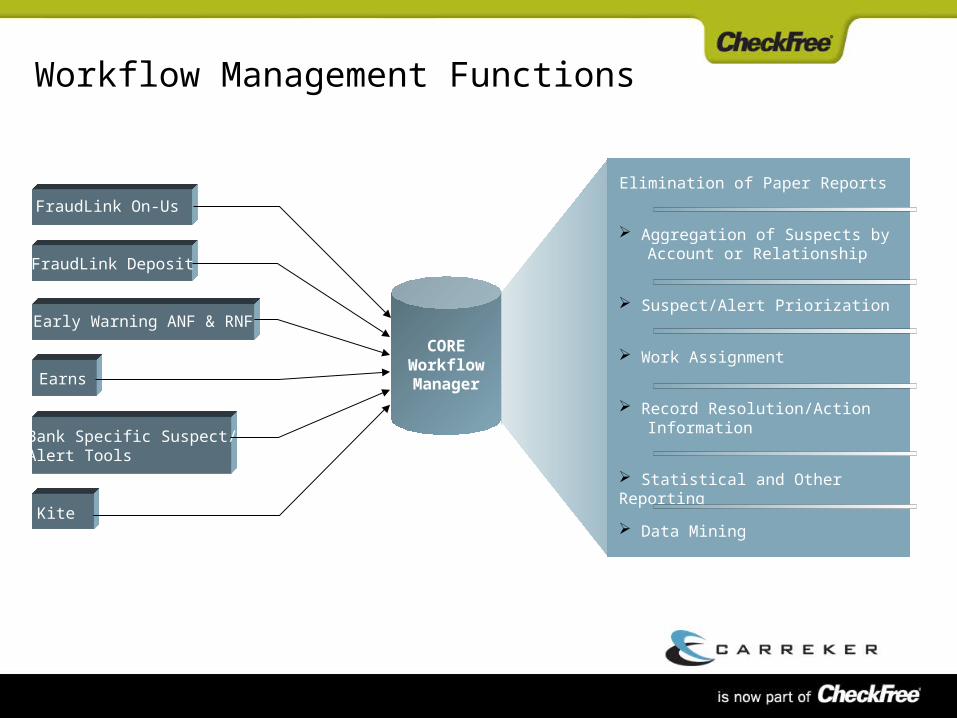
CORE Workflow Manager
Elimination of Paper Reports
FraudLink Deposit
Early Warning ANF & RNF
Earns
Bank Specific Suspect/Alert Tools
Kite
Aggregation of Suspects by Account or Relationship
Suspect/Alert Priorization
Work Assignment
Record Resolution/Action Information
Statistical and Other Reporting
Data Mining
FraudLink On-Us
Workflow Management Functions

31
CORE Workflow Manager
Elimination of Paper Reports
FraudLink Deposit
Early Warning ANF & RNF
Earns
Bank Specific Suspect/Alert Tools
Kite
Aggregation of Suspects by Account or Relationship
Suspect/Alert Priorization
Work Assignment
Record Resolution/Action Information
Statistical and Other Reporting
Data Mining
FraudLink On-Us
DocumentGeneration
Mainframe Communication
Workflow Management Functions
32
Benefits of Enterprise Alerts Management
Utilization of Database software
More complete view of risk at the account/customer level
Better Prioritization of Suspect/transaction Activity
Elimination of Redundant Effort
Smarter/Faster Decisions
Historical Picture of Suspect/Alert Activity
Research capability
Elimination of Paper Reports
33
Sovereign Bank – Company Overview
Sovereign’s headquarters in Wyomissing, PA
$82 billion financial institution
Markets primarily in the Northeast United States
750 Community Banking Offices (CBOs) & 2,250 ATMs
18th largest banking institution in the United States
Successfully completed two dozen acquisitions since the late 1980s

34
Loss Prevention – Operational Overview
Centralized Loss Prevention Unit
Team of 44
Check fraud prevention (Deposit & On-Us)
Case Management case input
Centralized check fraud claims
Debit card (signature and pinned)
Fraud claims
Single point of contact for ID Theft
CBOs, customers, and other Sovereign units’ support via a toll free response line
Elderly Abuse

35
Business Drivers to Implement Enterprise Alert Management
Mergers and Acquisitions
Standardize staff training
Establish a suspect/victim model
Inability to prioritize highest risk alerts
Analysts working in silos i.e. same suspects in multiple reports
Manual processes
Customer notifications (Reg CC)
Re-keying same info in several applications
Unable to identify new trends
Lack of audit trails
Paper driven
36
Staff Efficiency & Operational Gains
Prioritization of highest risk accounts
Elimination of manual processes
Customer notifications
Connection to host system eliminating re-keying of same date
Audit trail (tracks every keystroke)
On average it takes 5 minutes vs. 10 minutes to make a decision to pay/return/hold/freeze
Holistic review of suspects
At a glance history of suspect transactions
Detection rate of alerts reviewed year to date averages 90%
Return on investment (ROI) year to date averages 22:1
4 FTE reduction

37
Customer Service Impacts
Standardize notification to customers
Info populating by pulling from host systems hence less chance for typos
Any Analyst can assist customer that calls inquiring about a notification they received, less time spent on the phone

Questions?

Citibank and CheckFreeFraud Manager Deposit: A Case Study
Gail O’Brien, Citibank
David Fapohunda, Citibank
Debb Gordon, CheckFree
October 24, 2007
40
Citibank Business Background
Successfully used FraudLink for both On-Us and Deposit Fraud Detection
However, false positive and false negative rates were becoming a continuing burden to the operation
Current priority: Improve the efficiency of Deposit fraud detection
Deposit False positive alerts were 683 to 1 for the sample period (8/1/2005 to 9/29/2005) tested
FraudLink Deposit (ASI-19) was missing on average 52% of the Fraudulent transactions (false negatives) and these missed transactions accounted for an average of 62% of the Actual Losses
The Goal for Carreker/CheckFree’s Risk Solutions Analytic Team:
Reduce total alerts by 50% and capture at least 98% of the current fraud alerted
Enable the current rules set to be relaxed to alert the missed fraud with the same volumes currently used

41
Analytic Project Background
Early 2006, Carreker/CheckFree approached Citibank to perform a validation of the statistical models created from pooled bank data
Citibank initially provided FraudLink Deposit Transaction alert data from 8/1/2005 thru 9/29/2005
The Risk Solutions Analytic Team scored the transactions on the Generic model and developed a Custom Model for Citibank
Following the Development process, Citibank provided three months of blind data (11/1/2005 thru 1/31/2006) to be scored and returned to their analysts
The model was successfully able to meet the project criteria of a total alert reduction of 50% while maintaining a fraud detection rate of at least 98%
21 months later, the validation was repeated and replicated the results

42
Advanced Analytics
System Capabilities
Modeling
Statistical fraud models designed and tailored to fit behavior in each institution
Rules
Custom defined rules written and published by the operation
Lists
Can be imported from an outside source, or created by the operation
Segmentation
Create segments that can be serviced with different logic
Filters
Filters limit what you want to alert
43
Advanced Analytics
The Score
Each transaction is scored based on good customer profiles
Scores range from Zero to 1,000, the higher the score the more likely it’s fraud
Scores are presented in a distribution, you pick the cut-off score that best fits you
Use the score to prioritize workflow, or use a combination of score and any other information you use today
44
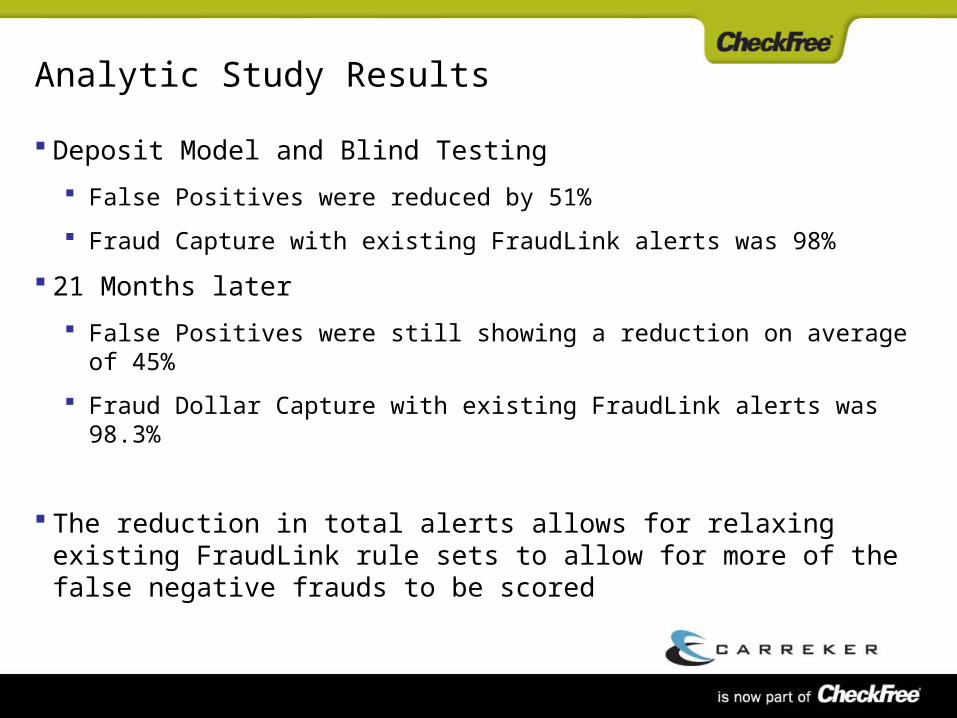
Analytic Study Results
Deposit Model and Blind Testing
False Positives were reduced by 51%
Fraud Capture with existing FraudLink alerts was 98%
21 Months later
False Positives were still showing a reduction on average of 45%
Fraud Dollar Capture with existing FraudLink alerts was 98.3%
The reduction in total alerts allows for relaxing existing FraudLink rule sets to allow for more of the false negative frauds to be scored

45
Citibank’s Business Application
Scored transactions
Defined rules
Prioritization in Workflow
Combining different information for better decisioning
46
Conclusion
Based on these Model Validation studies, Citi expects a significant reduction in alert volume
Combining the use of the score with other user written rules can improve these results even more.
Citi is looking forward to greater operational efficiency in Day 2 Batch
Future releases will bring the detection to Day 0 Real Time, allowing for automated holds and returns at the point of Deposit

Questions?

Comerica’s Experience with FraudLink DepositReducing False Positives:Effectively using Account Types and Period Parameters
Lisa M. Zarzycki, Comerica
October 24, 2007

49
Comerica Overview*
$58.6 Billion in total assets
401 Banking Centers in 5 States
Michigan,
California,
Texas,
Florida, and
Arizona
Select businesses operating in several other states, as well as Canada, Mexico, and China
Among the 20 largest U.S. banking companies
*As of July 18, 2007

50
FraudLink Deposit History
Comerica installed FraudLink Deposit v2.0 in October 2003.
With the exception of “home grown” ATM deposit fraud reports, Comerica had no deposit fraud prevention tool.
Comerica estimated $375,000 in loss avoidance in the first year.
Actual Loss Avoidance: $1.8 M
Total At Risk: $1.9 M
230 Cases
Average Prevention: $7,800

51
FraudLink Deposit Rules at Inception
5 of the 7 available rules (excluding 3 & 5) 3 Account Periods 3 Separate Markets 13 account types
Type A – Access & Value Ckg *Free Retail Type C – Correspondent Banks Type E – Employee Accounts Type H – High End Retail Ckg Type I – Interest Retail Type L – Large Business Type M – Interest & MMIA Bus Type O – Other Business *Professional (Drs., IOLTA, etc.) Type R – Regular Chg Type S – Small Business *Free Business Type 1 – Retail Savings Type 2 – Business Savings DFLT – Default Accounts *Deposit is made in market other than home market

52
FraudLink Deposit Inception
Average suspects per day – 2,137
4 FTE reviewed 994 or 46% on average
To manage volumes, analysts review “high risk” account types and high risk markets.

53
Upgrade to FraudLink v3.0
August 2006, Comerica Upgrades to FraudLink v3.0
Charge off analysis reveals that 80% of deposit fraud losses occur in the first 90 days and 63% of deposit fraud losses occur in the first 10 days of account opening
Move to 6 Account Periods:
0 to 10 days
11 to 90 days
91 to 180 days
181 to 365 days
366 to 1095 days
Greater than 1095 days
Update Parameters Based on Account Periods
Enable Rule 3 (36% reduction in suspects)

54
Additional Filters
January 2007, filter added to work flow management system
If the count of the number of times an account has suspected is greater than X times (Y or more) the alert will not be passed into the system to be worked by an analyst.
The filter is not applied to the FLK system but rather to the output from the system.
This allows the group to identify in a charge off analysis if the filter caused the account not to suspect and there was subsequent fraud.
The filter reduced suspects by an additional 16%.

55
FraudLink Today
Average: 1533 suspects per day
Staffing: 5 FTE
Results: 1080 suspects reviewed or 73%
Focus on “high risk” account types as defined by loss analysis
High Risk Account Types:
70% of Suspects
82% of Deposit Fraud at Fisk
79% of Deposit Fraud New Losses
Continuous charge off analysis to identify high risk account types and markets and manage false positives

Questions?
Contact Lisa M. Zarzycki
248-371-6742

Australia and New Zealand Banking Group Limited
Carly BoardmanManager
Fraud Detection &Cheque Compliance
Peter CaseyManager
Fraud Detection

ANZ Banking Group Limited
• One of the 5 largest and most successful companies in Australia and the number one bank in New Zealand
• Represented in our primary markets of Australia and New Zealand, as well as Asia, the Pacific, the UK, Europe and USA
• 781 branches in Australia and 1,265 other worldwide points of representation
• 6 million customers worldwide – personal, private banking, small business, corporate, institutional & asset finance
• USD$298 billion in assets
• Employ more than 30,000 staff worldwide

Financial Intelligence Operations
Cheque Fraud
Detection
Internet & Phone Banking Fraud Detection
Cheque Compliance
Denied Payments
AML / CTF
Education of ANZ branch staff, detection of on us and deposit fraud by way of: Fraudlink ASI16 & ASI19, Fraudlink Cheque Order Report, Fraudlink Kite ANZ Visual Image Archive Data exchange with other Fraudlink enabled banks Physical examination of large amount cheques
Detection of internet and phone banking fraud by way of: Fraudlink Billpay Eunexus Internet Intelligence System
Assist with the design, approval and production of ‘special print’ cheques for ANZ business customers.
Represent ANZ on the Australian banking industry Printing Standards Committee.
Filter inward and outward messages against lists, looking for Sanctioned Parties, Countries, Assets (Commodities), Currencies by way of Metavante’s Prime Compliance Suite of products.
Team currently ‘under construction’.
ANZ AML Program looking to introduce new technology and processes to meet revised Australian legislation that will ensure compliance with international standards (FATF).
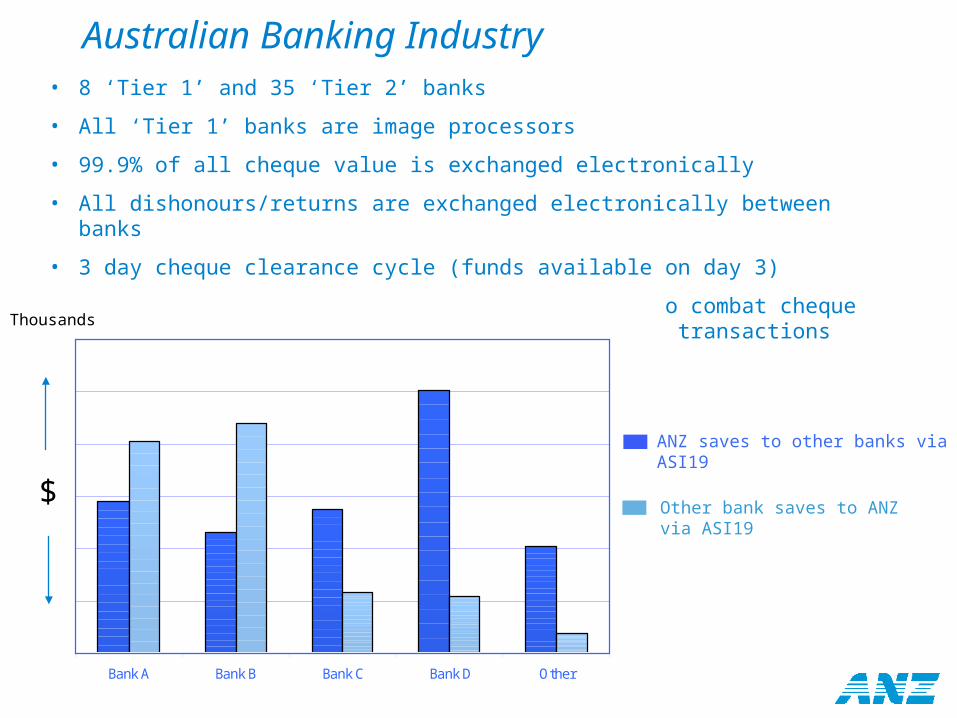
Australian Banking Industry• 8 ‘Tier 1’ and 35 ‘Tier 2’ banks
• All ‘Tier 1’ banks are image processors
• 99.9% of all cheque value is exchanged electronically
• All dishonours/returns are exchanged electronically between banks
• 3 day cheque clearance cycle (funds available on day 3)
• FraudLink enabled banks work collaboratively to combat cheque fraud, i.e. daily exchange of ‘suspect’ cheque transactions
12 month period
Bank A Bank B Bank C Bank D Other
$
ANZ saves to other banks via ASI19
Other bank saves to ANZ via ASI19
Thousands

Australian Domestic Payment Streams
Figures obtained via the Australian Payments Clearing Association (APCA) Ltd
Avg. transaction volume per month
Cheque Online Debit
Online Credit ATM
EFTPOS Credit Card
$120
$100
$80
$60
$40
$20
Million
1997 200320022001200019991998 2007200620052004

10% 20% 30% 40% 50%
Breach of Mandate
Third Party Conversion
Counterfeit
Theft / Forgery
Alteration
Valueless / Kite Flying
% of Value
% of Value
Figures obtained via the Australian Payments Clearing Association (APCA) Ltd
Australian Cheque Fraud Experience $148M in attempts, $32M in losses Losses represent 0.0005% of cheque transaction volume Losses represent 0.0019% of cheque transaction value
In 2006

ANZ Internet Banking Functionality
Balance and Transaction Enquiries Pay Bills to over 10,000 registered billers, e.g. utility companies Receive, view and pay bills online Transfer between connected accounts Transfer funds to accounts held with other Australian banks Transfer funds overseas Multi Payments, e.g. company payroll Purchase a Bank Cheque or International Draft Secure Mail
Security
128-bit SSL Encryption
Firewalls to prevent access to the ANZ network
Automatic time-outs
Fraud Detection (FraudLink)
Limited use of Two Factor Authentication

ANZ Internet Banking
What We Plan To Do?
Migration to CheckFree’s Fraud Manager Platform (Business Case in progress)
Move to real time detection (as opposed to intra day batch)
Login Session Monitoring – Stop the fraud before it happens
Continue Consumer Education & Awareness Campaigns
What Have We Done?
Implemented Fraudlink Billpay (2004)
Integration of Eunexus Internet Intelligence System to enrich Fraudlink
Billpay
Real-time sharing of IP intelligence with other Eunexus enabled banks in
Australia
Consumer Education & Awareness Campaigns
ANZ won Financial Insights Innovation Award in the category of security
& fraud management
Decreased losses by 40% increased detection by 80%
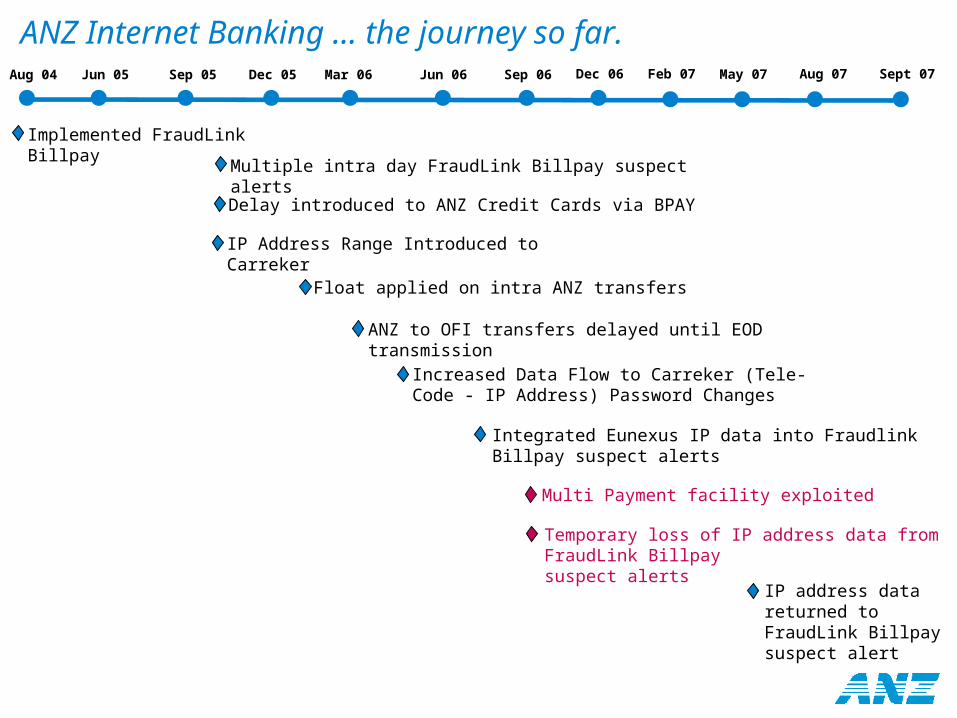
ANZ Internet Banking … the journey so far.Aug 04 Sep 05 Jun 06 Sep 06 Dec 06Mar 06Dec 05Jun 05 May 07 Sept 07Feb 07 Aug 07
Multi Payment facility exploited
Temporary loss of IP address data from FraudLink Billpay suspect alerts
Implemented FraudLink Billpay
Multiple intra day FraudLink Billpay suspect alerts
Delay introduced to ANZ Credit Cards via BPAY
IP Address Range Introduced to Carreker
Float applied on intra ANZ transfers
ANZ to OFI transfers delayed until EOD transmission
Increased Data Flow to Carreker (Tele-Code - IP Address) Password Changes
Integrated Eunexus IP data into Fraudlink Billpay suspect alerts
IP address data returned to FraudLink Billpay suspect alert

ANZ Internet Banking
Billion
How we are tracking against increased transaction volume …
Tra
nsa
ction V
alu
e

Some Fraud Alert Triggers Payee or Recipient is not in previous account history
Dollar Value is “Greater Than Average”
IP Address originates from an overseas destination
IP address has been marked as ‘fraud’ by another Eunexus enabled bank
IP address identified as either ‘malicious or ‘proxy’ by the Eunexus Internet Intelligence System
IP Address has never been used previously by customer
Payment message or reference entered at the time of transaction, considered suspicious
Payments to ‘high risk’ billers (gambling institutions or money transfer agents)
Telecode/Password resets (for telephone banking channel)
Weight of a suspect alert (10 – 20 – 30 – 40)

IP Sharing & ReportingIP Sharing
75% of all Australian banks, are using IP data provided by Eunexus
‘Eunexus’ enabled banks are actively sharing IP intelligence, thereby effecting an industry approach to internet fraud, e.g. blacklisting IP addresses
Reporting to Government
Australian banks report all cases of online fraud to the Australian High Tech Crime Centre (AHTCC)
The AHTCC is a collaboration between the government and private industry to enable a national and coordinated approach to combating serious, multi-jurisdictional technology enabled crimes.

Questions?

Understanding Your Banks “Fraud Profile”: A Risk-Based Approach to FraudLink Re-Calibration
Mark Steeber, CheckFree
October 24, 2007

Agenda
Overview: Check and Deposit Fraud – How Has It Changed? How Does It Remain the Same?
Determining Your “False Positive Rate” & “Fraud Detection Rate”
FraudLink System Reports: Data Collection & Analysis
Fraud Detection/Fraud Losses: Data Collection & Analysis
“Fraud Profile”: Identifying Current & Emerging Fraud Activity
Risk-Based Re-Calibration: Targeting Your “Fraud Profile”

Overview: Check and Deposit Fraud – How has it changed? How does it remain the same?
Back in the “old days,” remember when…
A $1000 fraud loss was catastrophic
No automated way to detect in-clearing check fraud
Two types of deposit fraud; new account fraud and kiting
The fraudster had to come into the bank to commit fraud
Depended on new account reps. and tellers to detect fraud
Fraud today…
A $10,000 fraud loss might be catastrophic?????
FraudLink On-Us in-clearing check fraud detection
FraudLink Deposit & Kite detecting deposit fraud schemes
Fraudster doesn’t have to enter bank to commit fraud
Depend on new account reps and tellers to sell, sell, sell…

Overview: Check and Deposit Fraud – How has it changed? How does it remain the same?
Fundamentally check fraud has not changed
Checks are still…
Lost or stolen
Forged
Counterfeited
Purchases
Deposit fraud schemes
Teller cashed
Paid in-clearing
The playing field has just gotten bigger
Professionals
Amateurs
Victim Customers
Electronic Transaction – ACH & Debit Card

Overview: Check and Deposit Fraud – How has it changed? How does it remains the same?
Challenges
Check Losses Highest Among All Payments Channels
< Check Volume = > Check Fraud?????
Federal Reserve Payments Study -
Check Volume: 2000 – 41.9B & 2003 – 36.7B = ↓12.4%
Electronic Payments: 2000 – 30.6B & 2003 – 44.5B = ↑44.5%
ABA Fraud Survey
Fraud Cases: 1999 – 447G; 2001 – 600G & 2003 – 616G
Attempted Check Fraud: 1999 - $2.2B; 2001 - $4.3B & 2003 - $5.5B
Losses: 1999 - $679M; 2001 - $698M & 2003 - $677M

Overview: Check and Deposit Fraud – How has it changed? How does it remains the same?
Challenges FinCEN SAR Reporting - (Check Fraud, Kiting & Counterfeit Checks
Only)
1999 – 27,682; 2001 – 43,501; 2003 – 61,611; 2006 – 124,905
Association of Financial Professionals (AFP) 2007 Payments Fraud Survey
Check fraud is increasing despite check volume decline Check Fraud 93%
ACH Debit Fraud 35%
Consumer Credit Card Fraud 17%
Corporate Purchasing Card14%
Consumer Debit Card Fraud 5%
ACH Credit Fraud 4%
Wire Transfer Fraud 3%

Determining Your “False Positive Rate” & “Fraud Detection Rate”
FraudLink On-Us “False Positive Rate”
FraudLink On-Us Suspects Deemed Good ÷ Total FraudLink On-Us Suspects = False Positive Rate
1,068,000 Suspect Items - 1,360 Fraud Items = 1,066,640 Good Suspects
1,066,640 Goods ÷ 1,068,000 Total Suspects = 99.8% False Positive Rate
Loss Avoidance Total: $4.4M – Charge Off Total : $400K
Daily Average Suspect Volume: 4,240/5 FTE = 850 Items/FTE

Determining Your “False Positive Rate” & “Fraud Detection Rate”
FraudLink On-Us “False Positive Ratio”
FraudLink On-Us Suspect Items ÷ FraudLink On-Us Items Detected = False Positive Ratio
1,068,000 Suspect Items ÷ 1,360 Fraud Items = 785:1 Ratio
One Fraud Item for Every 785 Suspects

Determining Your “False Positive Rate” & “Fraud Detection Rate”
FraudLink Deposit “False Positive Rate”
FraudLink Deposit Suspects Deemed Good ÷ Total FraudLink Deposit Frauds = False Positive Rate
156,200 Suspect Accounts - 560 Deposit Frauds = 155,640 Good Accounts
155,640 Goods ÷ 156,200 Total Suspects = 99.7% False Positive Rate
Loss Avoidance Total: $19M – Charge Off Total: $2.2M
Daily Average Suspect Volume:620/5 FTE = 125 Accounts/FTE
Determining Your “False Positive Rate” & “Fraud Detection Rate”
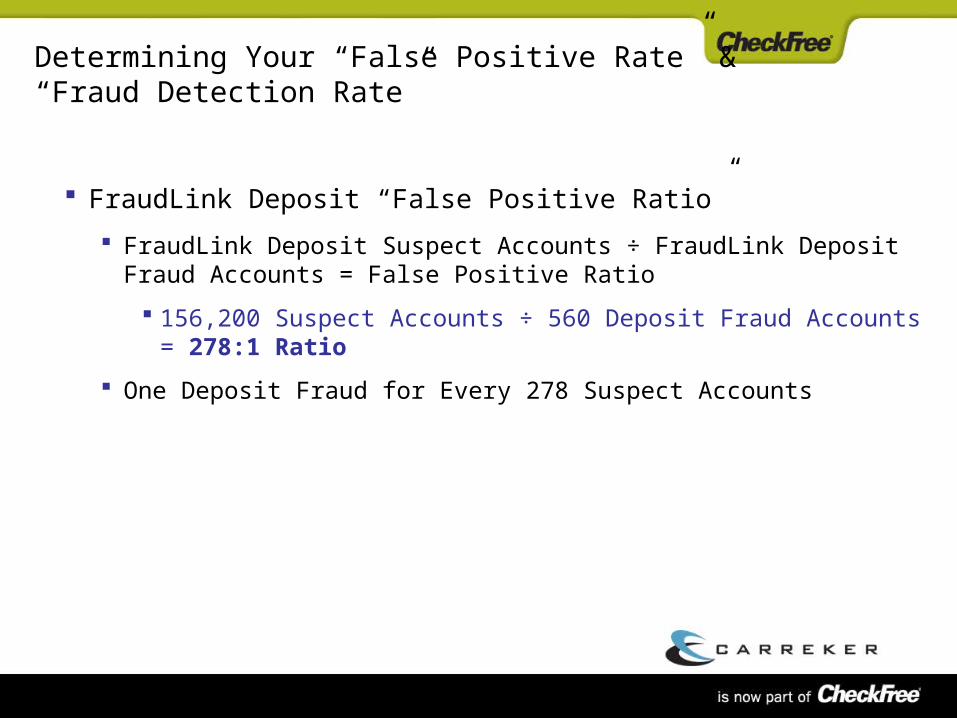
FraudLink Deposit “False Positive Ratio”
FraudLink Deposit Suspect Accounts ÷ FraudLink Deposit Fraud Accounts = False Positive Ratio
156,200 Suspect Accounts ÷ 560 Deposit Fraud Accounts = 278:1 Ratio
One Deposit Fraud for Every 278 Suspect Accounts

Determining Your “False Positive Rate” & “Fraud Detection Rate”
FraudLink On-Us “Fraud Detection Rate” Dollars
On-Us Fraud Dollars Charged Off + FraudLink On-Us Fraud Dollars Detected = Total On-Us Check Fraud Dollars Exposure
$400K Charged Off + $4.4 Detected = $4.8M Total Fraud Exposure
FraudLink On-Us Fraud Dollars Detected ÷ Total Dollars Exposure = Fraud Dollars Detection Rate
$4.4M Detected ÷ $4.8 Exposure = 92% Fraud Dollars Detection Rate

Determining Your “False Positive Rate” & “Fraud Detection Rate”
FraudLink On-Us “Fraud Detection Rate” Items
On-Us Fraud Items Charged Off + FraudLink On-Us Fraud items Detected = Total On-Us Check Fraud Items Exposure
670 items Charged Off + 1,360 items Detected = 2,030 Total Items Exposure
FraudLink On-Us Items Detected ÷ Total Items Exposure = Fraud Items Detection Rate
1,360 Detected ÷ 2,030 Exposure = 70% Fraud Items Detection Rate

Determining Your “False Positive Rate” & “Fraud Detection Rate”
FraudLink Deposit “Fraud Detection Rate” Dollars
Deposit Fraud Dollars Charged Off + FraudLink Deposit Dollars Detected = Total Deposit Fraud Dollars Exposure
$2.2M Charged Off + $19M Detected = $21.2M Total Fraud Exposure
FraudLink Deposit Dollars Detected ÷ Total Dollars Exposure = Fraud Detection Rate
$19M Detected ÷ $21.2 Exposure = 90% Fraud Detection Rate

Determining Your “False Positive Rate” & “Fraud Detection Rate”
FraudLink Deposit “Fraud Detection Rate” Accounts
Deposit Fraud Accounts Charged Off + FraudLink Deposit Accounts Detected = Total Deposit Fraud Accounts Exposure
250 Accounts Charged Off + 560 Accounts Detected = 810 Total Accounts Exposure
FraudLink Deposit Accounts Detected ÷ Total Accounts Exposure = Fraud Detection Rate
560 Detected ÷ 810 Exposure = 69% Fraud Account Detection Rate
Determining Your “False Positive Rate” & “Fraud Detection Rate”
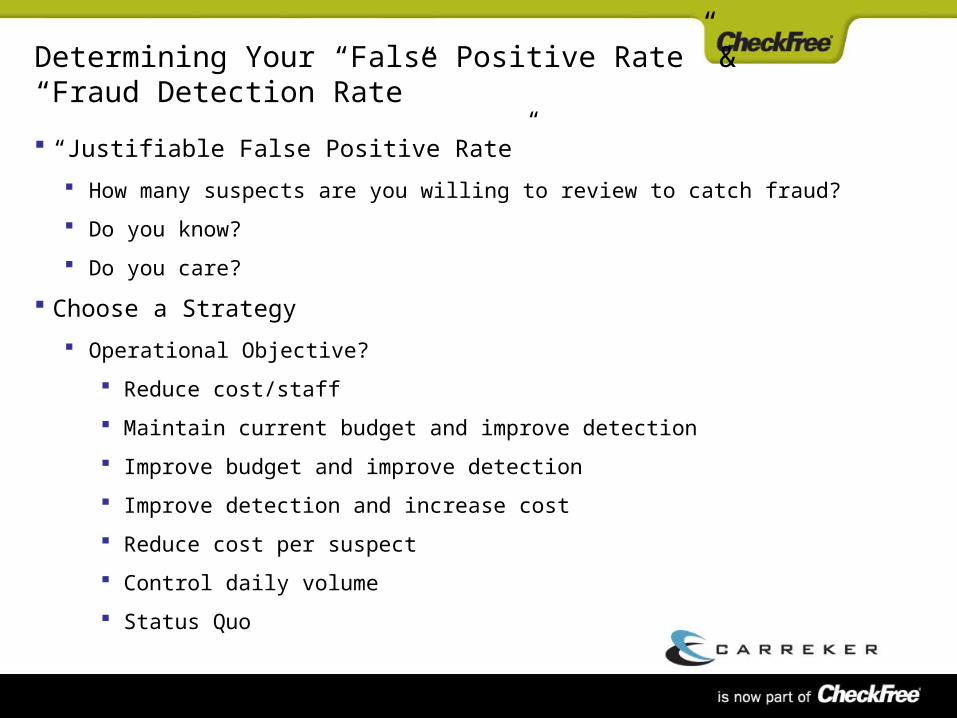
“Justifiable False Positive Rate”
How many suspects are you willing to review to catch fraud?
Do you know?
Do you care?
Choose a Strategy
Operational Objective?
Reduce cost/staff
Maintain current budget and improve detection
Improve budget and improve detection
Improve detection and increase cost
Reduce cost per suspect
Control daily volume
Status Quo

Determining Your “False Positive Rate” & “Fraud Detection Rate”
Baseline measurements?
Average number of suspects per day
Average number of false positives
Average number of frauds observed per period
Average number of “false negatives” observed per period
“False negative” losses that failed to appear on Suspect Report
Detection rate observed per period
No “One Size Fits All” Solution
Decision up to each individual bank

FraudLink System Reports: Data Collection & Analysis
Understanding FraudLink Suspect Distribution
FraudLink On-Us Back Office Summary Report
Produces Daily Reports
Bank
Group
Account Type
Reason/Rule
Number Checks/Accounts
Grand Total
Average Suspect Activity
Observe the distribution of Suspects across all Account Types and Reason/Rule

FraudLink System Reports: Data Collection & Analysis
DATE: 01/16/2002 08:37 CARREKER FRAUDLINK ON-US FRAUD DETECTION SYSTEM A16RPT04POSTED DATE : 01/15/2002 BACK OFFICE SUMMARY REPORT CONTAINING ITEMS FROM ALL SOURCES PAGE 12
GRAND TOTALS REASON CHECKS ACCOUNTS AMOUNT
DUPLICATE SERIAL NUMBER 14 8 $18,302.02SERIAL NUMBER OUT OF RANGE 102 65 $371,305.26AMOUNT GREATER THAN AVERAGE 34 29 $1,976,687.96AMOUNT EXCEEDS LARGEST ON FILE 21 19 $412,938.72NO HISTORY FOR ACCOUNT 4 4 $3,528.50NO HISTORY FOR NEW ACCOUNT 2 1 $4,326.42MISSING SERIAL NUMBER 17 9 $31,177.61LOW DOLLAR CHECK PULL 148 148 $384,295.54LOWEST CHECK NUMBER ON FILE 9 8 $12,200.17VELOCITY BACK OFFICE 4 2 $1,540.80BRANCH VELOCITY 0 0 $0.00BRANCH DUPLICATE SERIAL 10 3 $8,339.44DUPLICATE AMOUNT 24 8 $14,765.21SERIAL NUMBER IN NEW CHECK RANGE 0 0 $0.00HIGH DOLLAR 98 69 $3,463,688.35DUPLICATE SERIAL AND AMOUNT 0 0 $0.00EXCEEDED DOLLAR THRESHOLD 0 0 $0.00PAYEE VELOCITY 0 0 $0.00SUSPECT ONLY ITEMS 204 117 $3,315,609.02COMPANION ONLY ITEMS 108 108 $29,477.99SUSPECT COMPANION ITEMS 40 40 $354,817.55
FRAUD ANALYSIS HAS FLAGGED 352 CHECKS FOR 153 ACCOUNTS WITH A TOTAL VALUE OF 3,699,904.56 FOR THIS DAYS WORK
FraudLink System Reports: Data Collection & Analysis
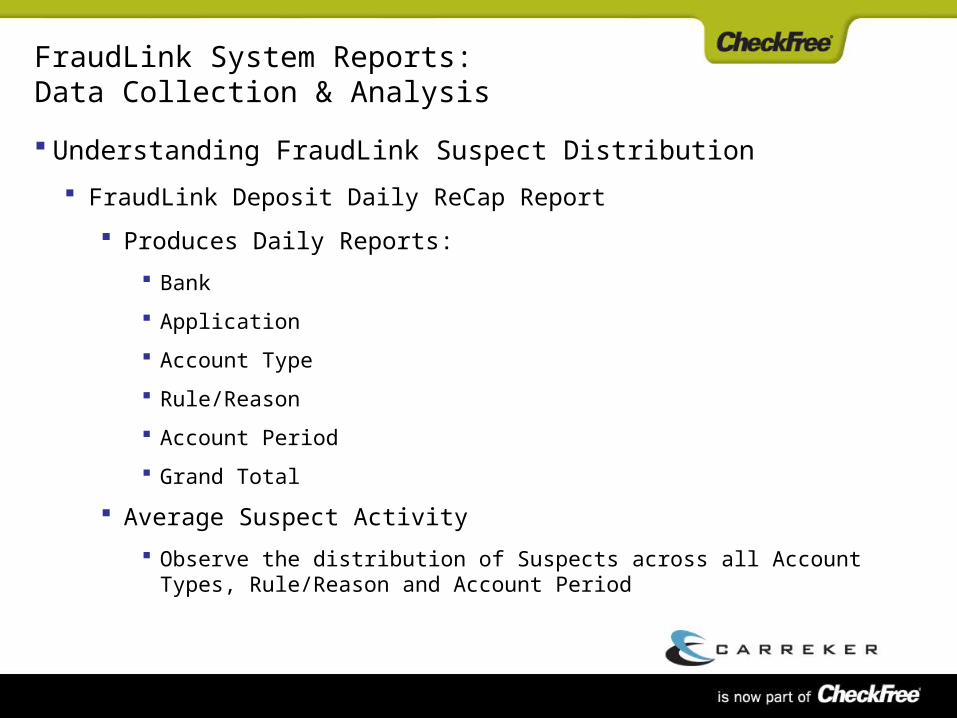
Understanding FraudLink Suspect Distribution
FraudLink Deposit Daily ReCap Report
Produces Daily Reports:
Bank
Application
Account Type
Rule/Reason
Account Period
Grand Total
Average Suspect Activity
Observe the distribution of Suspects across all Account Types, Rule/Reason and Account Period

FraudLink System Reports: Data Collection & Analysis

Fraud Detection/Fraud Losses: Data Collection & Analysis
Collect, Sort and Stratify Your On-Us Detection and Loss Data
On-Us Fraud Analysis
Geographical Risk
Product Risk
FraudLink Suspect Rule
Loss Avoidance Amount
Loss Amount – FraudLink Suspect Y/N
Return Reason
Understand Your Entire Risk Exposure
What’s working
What’s not working
Where changes are needed

Fraud Detection/Fraud Losses: Data Collection & Analysis
Collect, Sort and Stratify Your Deposit Detection and Loss Data
Deposit Fraud Analysis
Geographical Risk
Product Risk
Age of Account Risk – FraudLink Account Periods
FraudLink Suspect Rule
Deposit Amount
Loss Avoidance Amount
Loss Amount – FraudLink Suspect Y/N
RDI Reason
Understand Your Entire Risk Exposure
What’s working
What’s not working
Where changes are needed

“Fraud Profile”: Identifying Current & Emerging Fraud Activity “Fraud Profile”
Current Trends – Commonality
Common Fraud Amounts
Common Bank Products
Common Geographic's
Common Account Age
Common Detection & Failures
In-clearing vs. Teller Cashed
Emerging Fraud – Un-Commonality
New Fraud Amounts
Fraud Below Current FraudLink System Settings
New Bank Products
New Geographic’s
New Account Ages
Fraud Moving From Paper to other Delivery Channels

Risk-Based Re-Calibration: Targeting Your “Fraud Profile”
Where is the Fraud Risk?
FraudLink On-Us
Product – Commercial DDA
Amounts - $375.00 - $998.00 & $4,800 - $9,900
Detection – Rule 2 Serial Number Out of Range-83% & Rule 1 Duplicate Serial Number-12%
Determine “False Negatives”
Where isn’t the Fraud Risk?
FraudLink On-Us
Product – Senior 50+ DDA & MMDDA
Amounts < $374.00
Detection – Rule 3 Amount Greater Than Average & Rule 13 Duplicate Check Amounts
Determine “False Negatives”

Risk-Based Re-Calibration: Targeting Your “Fraud Profile”
Where is the Fraud Risk?
FraudLink Deposit
Product – Free Personal DDA & Internet Free Personal DDA
Amounts – Account Period 1: $2,000 - $5,500 Account Period 3: $35,000 - $425,000
Detection – Rule 1 Daily Total Above Average-88% & Rule 5 Invalid Routing & Transit Number-9%
Region – 1 & 2
Where isn’t the Fraud Risk?
FraudLink Deposit
Product – Commercial DDA & Public Funds Accounts
Amounts < $1,000
Detection – Rule 8 Deposit Velocity Exceeds Average & Rule 6 Duplicate Items Amounts
Region – 6 & 8

Risk-Based Re-Calibration: Targeting Your “Fraud Profile”
What Have We Learned?
False Positive Rate
False Negative Rate
Fraud Detection Rate
“Justifiable False Positive”
FraudLink Suspect Volume Distribution
Fraud Exposure Distribution
Fraud Profile
Common Fraud Trends
Emerging Fraud Trends
Where Your Fraud Is

Risk-Based Re-Calibration: Targeting Your “Fraud Profile”
Re-Calibration Set and balance Rules and Parameters
Target highest Fraud Risk activity
Generate More Suspects that Provide the Greatest Value
Generate Less Suspects Where Fraud is Least Likely
Results
More Fraud Detection
Less False Negatives
Less False Positives
Happier Employees
What You Might Find…
A need to generate more Suspects than current staff can handle
Business case for added staff with significant payback
Need for full-time Business Analyst to collect and analyze data and conduct re-calibration testing

Questions?
Q: I don’t have the staff to do all of this, is there an automated way to collect this data?
A: Yes, CORE Workflow Manager & Syfact Case Management System
Q: Can Carreker/CheckFree help?
A: Yes, we provide consulting and re-calibration services, check with your Account Representative.
Now Your Questions!

Closing Remarks
Jeff Botari, CheckFree