riskminds - did basel & iosco put the final nail in the coffin of csa-discounting?
TRANSCRIPT

Did Basel & IOSCO put the final nail in the
coffin of CSA-Discounting ?
Amsterdam – December 10th, 2014
Alexandre Bon, Murex
FVA in presence of imperfect collateralisation, IMs and variable funding spreads
Copyright © 2014 Murex S.A.S. All rights reserved 2
Introduction
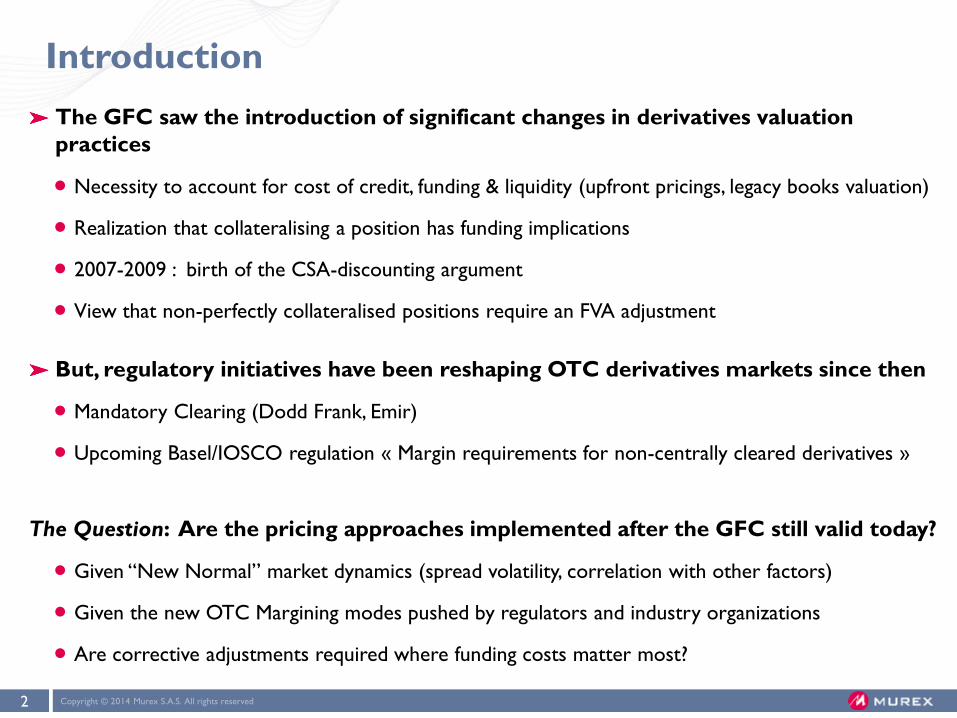
The GFC saw the introduction of significant changes in derivatives valuation
practices
Necessity to account for cost of credit, funding & liquidity (upfront pricings, legacy books valuation)
Realization that collateralising a position has funding implications
2007-2009 : birth of the CSA-discounting argument
View that non-perfectly collateralised positions require an FVA adjustment
But, regulatory initiatives have been reshaping OTC derivatives markets since then
Mandatory Clearing (Dodd Frank, Emir)
Upcoming Basel/IOSCO regulation « Margin requirements for non-centrally cleared derivatives »
The Question: Are the pricing approaches implemented after the GFC still valid today?
Given “New Normal” market dynamics (spread volatility, correlation with other factors)
Given the new OTC Margining modes pushed by regulators and industry organizations
Are corrective adjustments required where funding costs matter most?

Agenda
1. PRICING FUNDING COSTS AFTER THE CRISIS
2. COMPETING FVA MODELS : CSA-DISCOUNTING & EXPOSURE SIMULATION
3. WHICH FVA MODELS ARE STILL VALID NOW?
CONSIDERING POST-CRISIS SPREADS DYNAMICS
GIVEN THE IMPACT NEW REGULATORY DEVELOPMENTS (EMIR, BASEL/IOSCO…) ON
COLLATERALISATION REGIMES
4. ONE POSSIBLE FVA OPERATING MODEL

Copyright © 2014 Murex S.A.S. All rights reserved 4
Justification for a funding adjustment
Unsecured derivatives positions
Future cash flow assets (liabilities) are term-funded by borrowing on an unsecured
basis and investing (borrowing) in a “risk-free” money market account that will pay
back the required amount at maturity.
i.e. the value of this derivative can be obtained by :
Discounting future cash-flows on our own unsecured funding curve (term-funding).
Equivalently, the integral of future MtMs discounted with our unsecured funding spread gives
the valuation adjustment that can be subtracted from the “risk-free” price to derive our
economic value for this transaction
Other argument : the unsecured derivatives is hedged by a collateralised one

Copyright © 2014 Murex S.A.S. All rights reserved 5
Justification for a funding adjustment
Collateralised derivatives positions
When the value of the position 𝑉(𝑡) is positive we effectively borrow the collateral
amount 𝐶(𝑡) at the collateral rate 𝑟𝑖𝑠𝑘 𝑓𝑟𝑒𝑒 + 𝑆𝑐𝑜𝑙𝑙𝑎𝑡 and fund the remaining shortfall
excess 𝑉 𝑡 − 𝐶 𝑡 at our cost of funds (and vice versa).
The collateral rate is the interest rate specified in the agreement, when exchanging
cash collateral, the funding cost/benefit is thus the combination of:
𝐶(𝑡) at the collateral spread 𝑆𝑐𝑜𝑙𝑙𝑎𝑡
𝑉 𝑡 − 𝐶 𝑡 + at the unsecured borrowing spread 𝑆𝑏𝑜𝑟𝑟𝑜𝑤
𝐶 𝑡 − 𝑉 𝑡 − at the unsecured lending spread 𝑆𝑙𝑒𝑛𝑑
Assuming continuous collateralisation 𝑉 𝑡 = 𝐶(𝑡) : cash flows can be discounted on
the collateral rate (CSA-discounting)
Usually the collateral rate is an OIS index which is also the benchmark for repos and
our “risk-free” money market account.
Under these ideal hypotheses : FVA = 0
Copyright © 2014 Murex S.A.S. All rights reserved 6
Justification for a funding adjustment
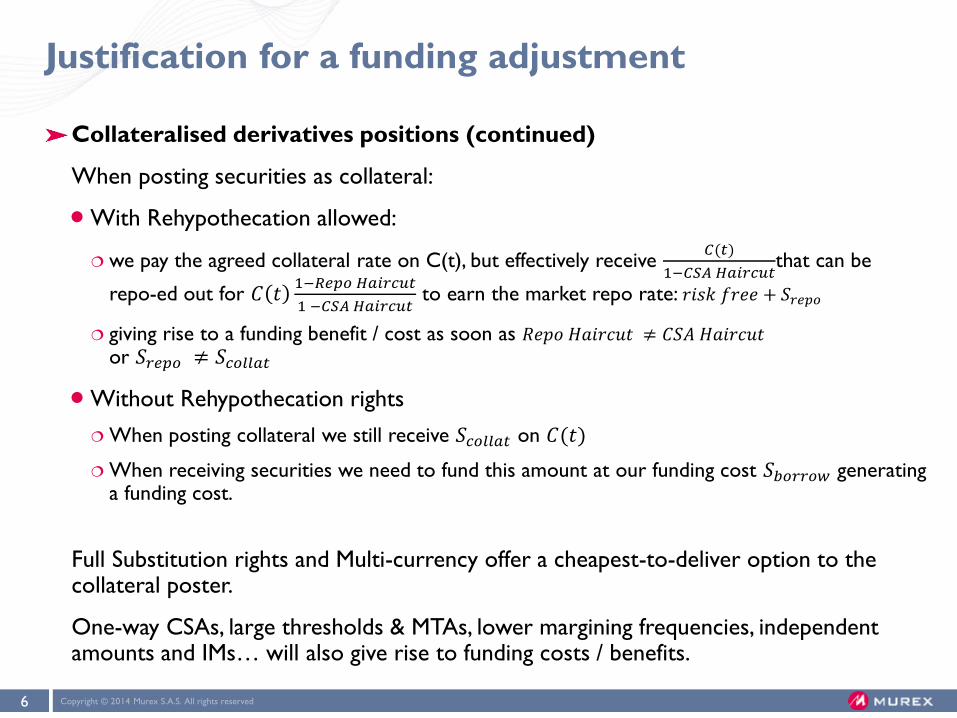
Collateralised derivatives positions (continued)
When posting securities as collateral:
With Rehypothecation allowed:
we pay the agreed collateral rate on C(t), but effectively receive 𝐶(𝑡)
1−𝐶𝑆𝐴 𝐻𝑎𝑖𝑟𝑐𝑢𝑡that can be
repo-ed out for 𝐶 𝑡1−𝑅𝑒𝑝𝑜 𝐻𝑎𝑖𝑟𝑐𝑢𝑡
1 −𝐶𝑆𝐴 𝐻𝑎𝑖𝑟𝑐𝑢𝑡 to earn the market repo rate: 𝑟𝑖𝑠𝑘 𝑓𝑟𝑒𝑒 + 𝑆𝑟𝑒𝑝𝑜
giving rise to a funding benefit / cost as soon as 𝑅𝑒𝑝𝑜 𝐻𝑎𝑖𝑟𝑐𝑢𝑡 ≠ 𝐶𝑆𝐴 𝐻𝑎𝑖𝑟𝑐𝑢𝑡 or 𝑆𝑟𝑒𝑝𝑜 ≠ 𝑆𝑐𝑜𝑙𝑙𝑎𝑡
Without Rehypothecation rights
When posting collateral we still receive 𝑆𝑐𝑜𝑙𝑙𝑎𝑡 on 𝐶(𝑡)
When receiving securities we need to fund this amount at our funding cost 𝑆𝑏𝑜𝑟𝑟𝑜𝑤 generating a funding cost.
Full Substitution rights and Multi-currency offer a cheapest-to-deliver option to the collateral poster.
One-way CSAs, large thresholds & MTAs, lower margining frequencies, independent amounts and IMs… will also give rise to funding costs / benefits.

Agenda
1. PRICING FUNDING COSTS AFTER THE CRISIS
2. COMPETING FVA MODELS : CSA-DISCOUNTING & EXPOSURE SIMULATION
3. WHICH FVA MODELS ARE STILL VALID NOW?
CONSIDERING POST-CRISIS SPREADS DYNAMICS
GIVEN THE IMPACT NEW REGULATORY DEVELOPMENTS (EMIR, BASEL/IOSCO…)
ON COLLATERALISATION REGIMES
4. ONE POSSIBLE FVA OPERATING MODEL

Copyright © 2014 Murex S.A.S. All rights reserved 8
The CSA-discounting argument & assumptions
Uncollateralised trades are priced by discounting Cash Flows on a curve representing
our cost of fund (usually Libor + spread).
Collateralised trades are priced by discounting Cash Flows on a curve representing
the collateral rate (usually OIS rate of a specified currency).
Implicit assumptions:
Transactions are held to maturity and term-funded
For each 𝑡 there is a single funded amount 𝑉(𝑡) and a single funding rate 𝑆𝑏𝑜𝑟𝑟𝑜𝑤 or 𝑆𝑐𝑜𝑙𝑙𝑎𝑡
Following hypotheses regarding the margining process and market dynamics:
1. Strong “ideal CSA” assumptions :
Bilateral & continuous margining
Cash equivalent collateral
0-thresholds
No MTAs, Rounding, IAs and … No IMs
Full substitution and re-hypothecation rights
2. Funding spreads are :
Symmetrical (lending = borrowing)
Fixed (and obviously independent from
exposure drivers)

Copyright © 2014 Murex S.A.S. All rights reserved 9
CSA-discounting has become market practice
Intuitive trade-level method, now widely used as the pricing approach on FO desks.
Usual consensus that, so far, the “ideal CSA” assumption has worked for the bulk
of interbank portfolios on “classical” CSAs and for uncollateralised positions as
well.
ISDA Margin Survey 2014 [17]
This year, 66% of participants indicated they were referencing terms contained within their
underlying CSAs when pricing derivatives transactions for collateral margining (CSA-discounting).
Copyright © 2014 Murex S.A.S. All rights reserved 10
CSA-discounting in practice
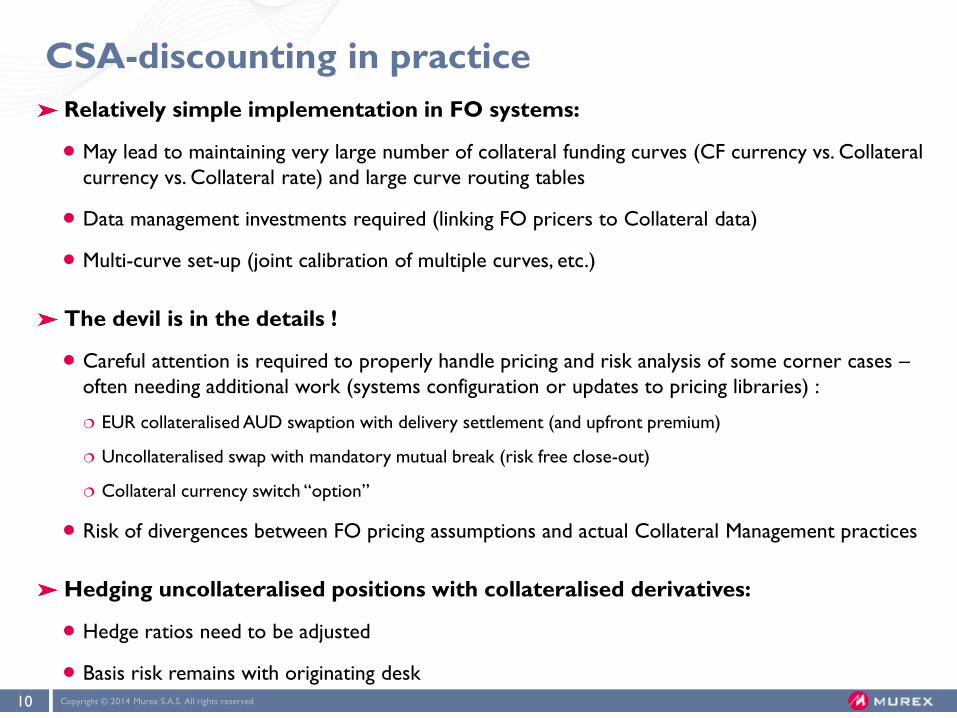
Relatively simple implementation in FO systems:
May lead to maintaining very large number of collateral funding curves (CF currency vs. Collateral
currency vs. Collateral rate) and large curve routing tables
Data management investments required (linking FO pricers to Collateral data)
Multi-curve set-up (joint calibration of multiple curves, etc.)
The devil is in the details !
Careful attention is required to properly handle pricing and risk analysis of some corner cases –
often needing additional work (systems configuration or updates to pricing libraries) :
EUR collateralised AUD swaption with delivery settlement (and upfront premium)
Uncollateralised swap with mandatory mutual break (risk free close-out)
Collateral currency switch “option”
Risk of divergences between FO pricing assumptions and actual Collateral Management practices
Hedging uncollateralised positions with collateralised derivatives:
Hedge ratios need to be adjusted
Basis risk remains with originating desk

Copyright © 2014 Murex S.A.S. All rights reserved 11
Reminder: CVA & FVA definition
CVA & DVA
CVA is the market value of counterparty credit risk for OTC derivatives (or the difference
between the risk-free price and the mid-market price of the portfolio).
Expectation over time of discounted future exposures weighted by default probabilities and
recoveries.
FVA
Similarly FVA aims to capture the funding costs (FCA) and benefits (FBA) incurred on derivatives
transactions due to timing mismatches between inflows and outflows that would be financed at
unsecured rates.
Integral over time of Funded Amounts weighted by the corresponding Funding Spreads.
Under the CSA-discounting assumptions, FVA is the difference in value obtained by discounting
cash flows on their relevant funding curves vs. a reference “risk-free” curve (OIS).
As funding spreads contain a credit risk element and funded amounts can correspond (not
always) to discounted exposure, there are definite overlaps between bilateral CVA and FVA (esp.
FBA and DVA).

Copyright © 2014 Murex S.A.S. All rights reserved 12
FVA via Exposure Simulation
The second approach consists in extending the CVA simulation framework to
price FVA at the portfolio level:
All trades are discounted on their relevant “risk-free” OIS benchmark for pricing, regardless of the
collateral agreement details
Exposures and Collateral balances are simulated explicitly taking into account the full details of the
collateral agreement (coverage, thresholds, collateral currency, haircuts, IMs, etc.)
FVA is measured by taking the integral of discounted exposures/liabilities weighted by the
appropriate funding spreads (if desired, different rates can be applied for the lending & borrowing
cases).
This approach offers improved modeling flexibility but at the cost of added
computational complexity (akin to the simulation model for CVA/DVA).
By isolating the “funding component” of the price, this method:
lends itself well to centralised management and internal transfer pricing (FVA desk)
preserves hedge ratios between collateralised and uncollateralised positions.

Copyright © 2014 Murex S.A.S. All rights reserved 13
FVA Simulation Principles
Funding spreads are measured between the effective Collateral rate and the chosen
reference risk-free funding rate
Similar to the CSA-discounting case, with the option of also evolving spreads as a stochastic risk
factor
Behavioural assumptions can be made regarding the :
Counterparty's choice of collateral assets (currency switch option, cash/securities mix).
Assumed funding lifetime of the positions.
Effective rehypothecation ratio / repo haircuts of illiquid securities (RMBS, corporate / municipal
bonds, etc.) and counterparty’s own bonds on stressed scenarios.
FVA can be simply split into sub-components:
FBA vs. FVA
FVA, LVA, CollVA, IMVA… (e.g. separating CDS-Bond basis liquidity spread from the credit spread, or
isolating the funding component due to collateral excesses/shortfalls).
P&L attribution elements
Copyright © 2014 Murex S.A.S. All rights reserved 14
Examples of typical modeling challenges
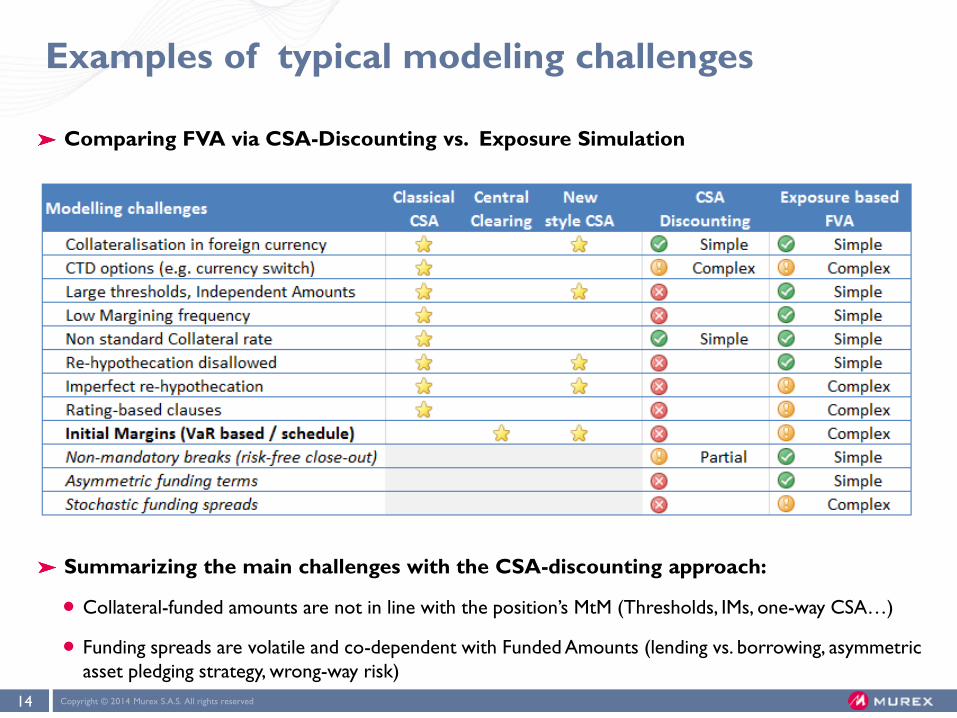
Comparing FVA via CSA-Discounting vs. Exposure Simulation
Summarizing the main challenges with the CSA-discounting approach:
Collateral-funded amounts are not in line with the position’s MtM (Thresholds, IMs, one-way CSA…)
Funding spreads are volatile and co-dependent with Funded Amounts (lending vs. borrowing, asymmetric
asset pledging strategy, wrong-way risk)

Copyright © 2014 Murex S.A.S. All rights reserved 15
Is CSA-discounting still a valid pricing method ?
The question is whether a CSA-discounting approach alone can be used to
price incrementally without the risk of providing distorted incentives:
Depends on the portfolio in place (transactions and agreements) and magnitude of the
impacts.
E.g. if clearing of a given product can happen only on a single CCP.
Option to fix some of the CSA-discounting shortfalls by fiddling with the pricing and
curve libraries.
Strong intuition that aggregation-dependent effects (VaR-based IMs, one-way CSAs)
should be modeled upfront
Whether the volatility of spreads and their correlation with exposure factors can have
a material impact is less clear (apart from obvious pathological cases)

Agenda
1. PRICING FUNDING COSTS AFTER THE CRISIS
2. COMPETING FVA MODELS : CSA-DISCOUNTING & EXPOSURE SIMULATION
3. WHICH FVA MODELS ARE STILL VALID NOW?
CONSIDERING POST-CRISIS SPREADS DYNAMICS
GIVEN THE IMPACT NEW REGULATORY DEVELOPMENTS (EMIR, BASEL/IOSCO…)
ON COLLATERALISATION REGIMES
4. ONE POSSIBLE FVA OPERATING MODEL
Copyright © 2014 Murex S.A.S. All rights reserved 17
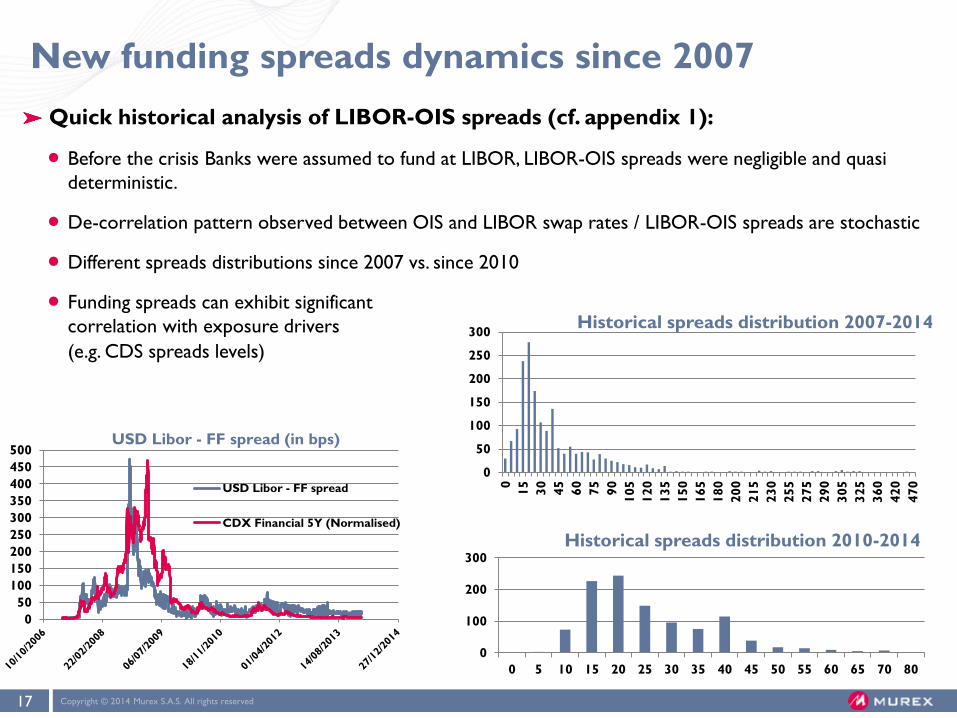
New funding spreads dynamics since 2007
Quick historical analysis of LIBOR-OIS spreads (cf. appendix 1):
Before the crisis Banks were assumed to fund at LIBOR, LIBOR-OIS spreads were negligible and quasi
deterministic.
De-correlation pattern observed between OIS and LIBOR swap rates / LIBOR-OIS spreads are stochastic
Different spreads distributions since 2007 vs. since 2010
Funding spreads can exhibit significant
correlation with exposure drivers
(e.g. CDS spreads levels)
0
50
100
150
200
250
300
350
400
450
500
USD Libor - FF spread
CDX Financial 5Y (Normalised)
USD Libor - FF spread (in bps)
0
50
100
150
200
250
300
0
15
30
45
60
75
90
105
120
135
150
165
180
200
215
230
255
275
290
305
325
360
420
470
Historical spreads distribution 2007-2014
0
100
200
300
0 5 10 15 20 25 30 35 40 45 50 55 60 65 70 80
Historical spreads distribution 2010-2014
Copyright © 2014 Murex S.A.S. All rights reserved 18
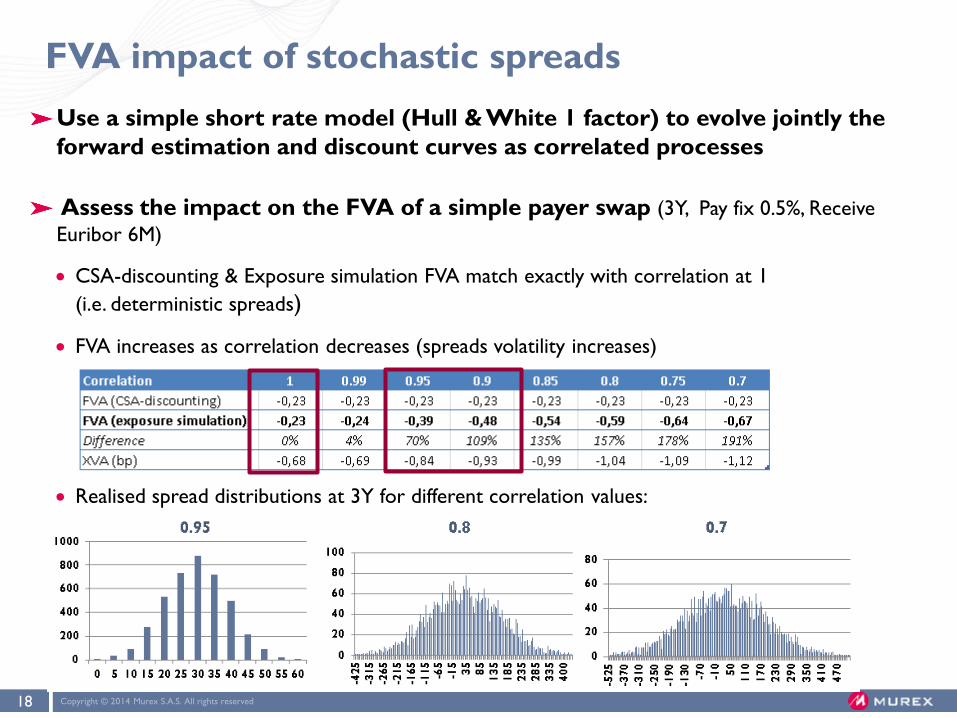
FVA impact of stochastic spreads
Use a simple short rate model (Hull & White 1 factor) to evolve jointly the
forward estimation and discount curves as correlated processes
Assess the impact on the FVA of a simple payer swap (3Y, Pay fix 0.5%, Receive
Euribor 6M)
CSA-discounting & Exposure simulation FVA match exactly with correlation at 1
(i.e. deterministic spreads)
FVA increases as correlation decreases (spreads volatility increases)
Realised spread distributions at 3Y for different correlation values:
Copyright © 2014 Murex S.A.S. All rights reserved 19
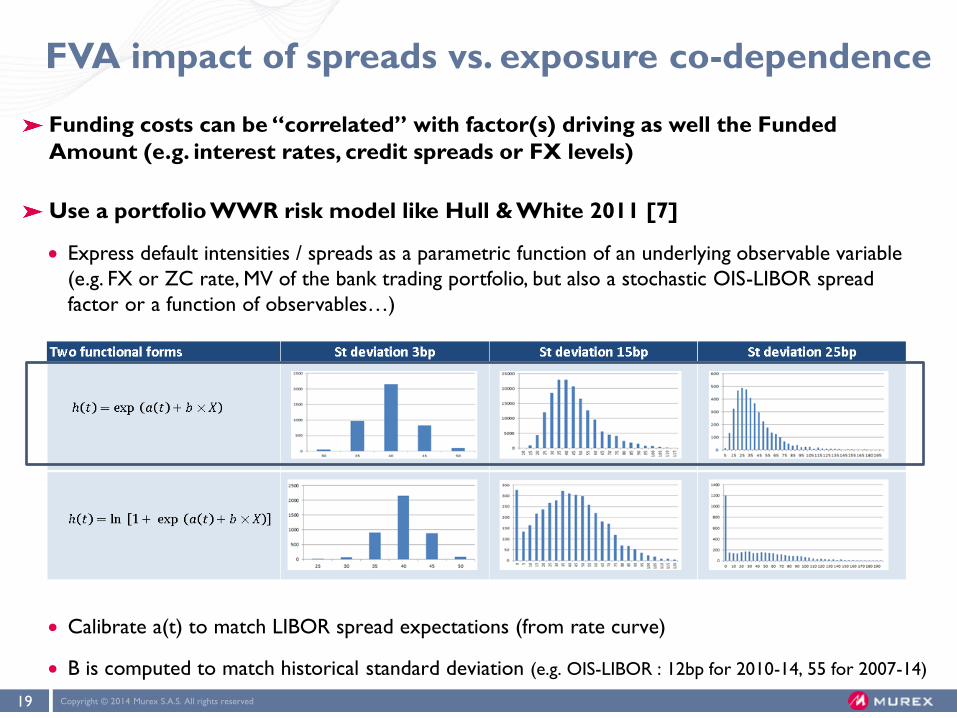
FVA impact of spreads vs. exposure co-dependence
Funding costs can be “correlated” with factor(s) driving as well the Funded
Amount (e.g. interest rates, credit spreads or FX levels)
Use a portfolio WWR risk model like Hull & White 2011 [7]
Express default intensities / spreads as a parametric function of an underlying observable variable
(e.g. FX or ZC rate, MV of the bank trading portfolio, but also a stochastic OIS-LIBOR spread
factor or a function of observables…)
Calibrate a(t) to match LIBOR spread expectations (from rate curve)
B is computed to match historical standard deviation (e.g. OIS-LIBOR : 12bp for 2010-14, 55 for 2007-14)
Copyright © 2014 Murex S.A.S. All rights reserved 20
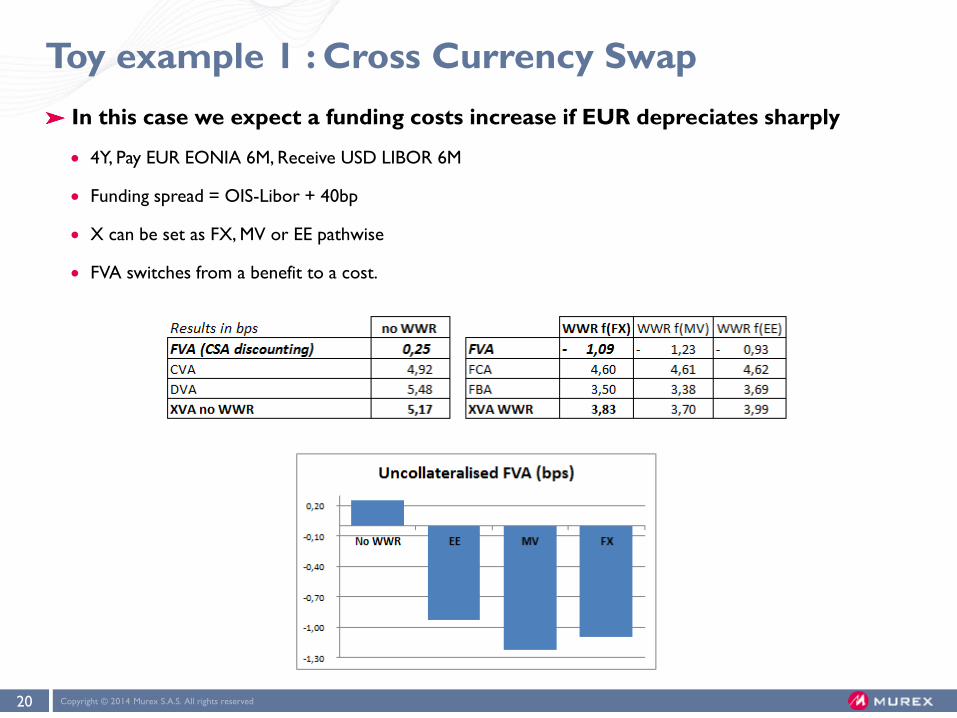
Toy example 1 : Cross Currency Swap
In this case we expect a funding costs increase if EUR depreciates sharply
4Y, Pay EUR EONIA 6M, Receive USD LIBOR 6M
Funding spread = OIS-Libor + 40bp
X can be set as FX, MV or EE pathwise
FVA switches from a benefit to a cost.
Copyright © 2014 Murex S.A.S. All rights reserved 21
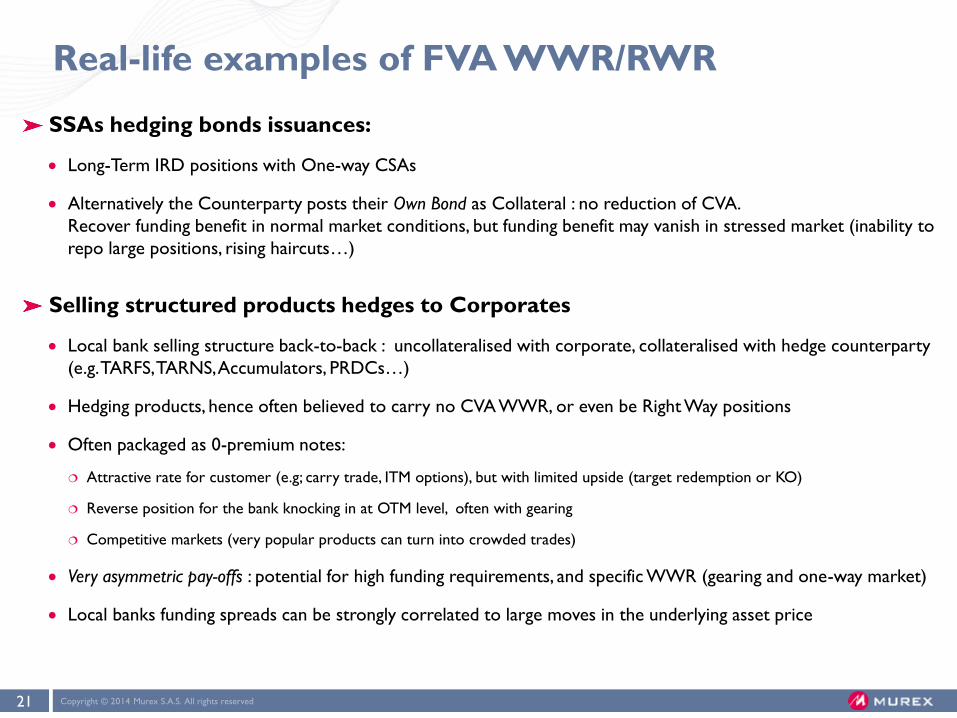
Real-life examples of FVA WWR/RWR
SSAs hedging bonds issuances:
Long-Term IRD positions with One-way CSAs
Alternatively the Counterparty posts their Own Bond as Collateral : no reduction of CVA.
Recover funding benefit in normal market conditions, but funding benefit may vanish in stressed market (inability to
repo large positions, rising haircuts…)
Selling structured products hedges to Corporates
Local bank selling structure back-to-back : uncollateralised with corporate, collateralised with hedge counterparty
(e.g. TARFS, TARNS, Accumulators, PRDCs…)
Hedging products, hence often believed to carry no CVA WWR, or even be Right Way positions
Often packaged as 0-premium notes:
Attractive rate for customer (e.g; carry trade, ITM options), but with limited upside (target redemption or KO)
Reverse position for the bank knocking in at OTM level, often with gearing
Competitive markets (very popular products can turn into crowded trades)
Very asymmetric pay-offs : potential for high funding requirements, and specific WWR (gearing and one-way market)
Local banks funding spreads can be strongly correlated to large moves in the underlying asset price
Copyright © 2014 Murex S.A.S. All rights reserved 22
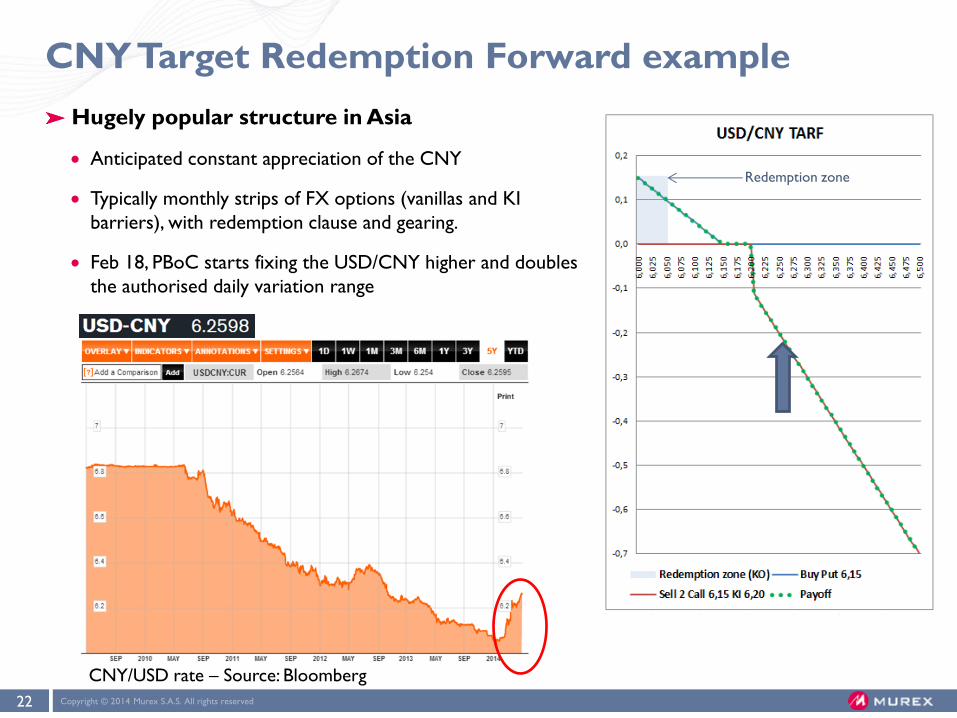
CNY Target Redemption Forward example
CNY/USD rate – Source: Bloomberg
Hugely popular structure in Asia
Anticipated constant appreciation of the CNY
Typically monthly strips of FX options (vanillas and KI
barriers), with redemption clause and gearing.
Feb 18, PBoC starts fixing the USD/CNY higher and doubles
the authorised daily variation range
Redemption zone
Copyright © 2014 Murex S.A.S. All rights reserved 23
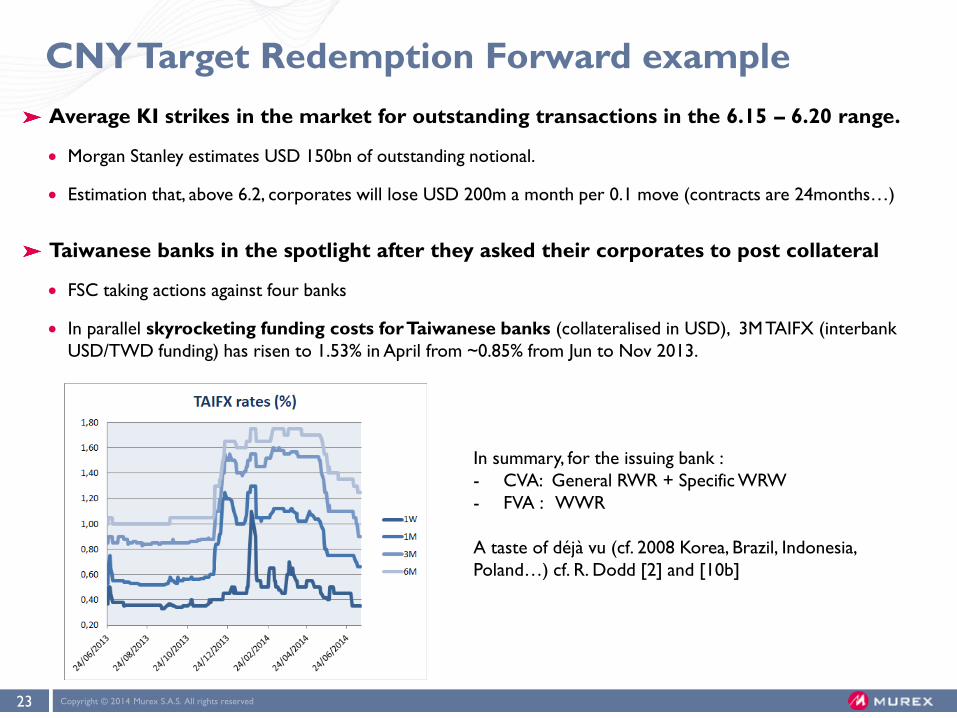
CNY Target Redemption Forward example
Average KI strikes in the market for outstanding transactions in the 6.15 – 6.20 range.
Morgan Stanley estimates USD 150bn of outstanding notional.
Estimation that, above 6.2, corporates will lose USD 200m a month per 0.1 move (contracts are 24months…)
Taiwanese banks in the spotlight after they asked their corporates to post collateral
FSC taking actions against four banks
In parallel skyrocketing funding costs for Taiwanese banks (collateralised in USD), 3M TAIFX (interbank
USD/TWD funding) has risen to 1.53% in April from ~0.85% from Jun to Nov 2013.
In summary, for the issuing bank :
- CVA: General RWR + Specific WRW
- FVA : WWR
A taste of déjà vu (cf. 2008 Korea, Brazil, Indonesia,
Poland…) cf. R. Dodd [2] and [10b]
Copyright © 2014 Murex S.A.S. All rights reserved 24
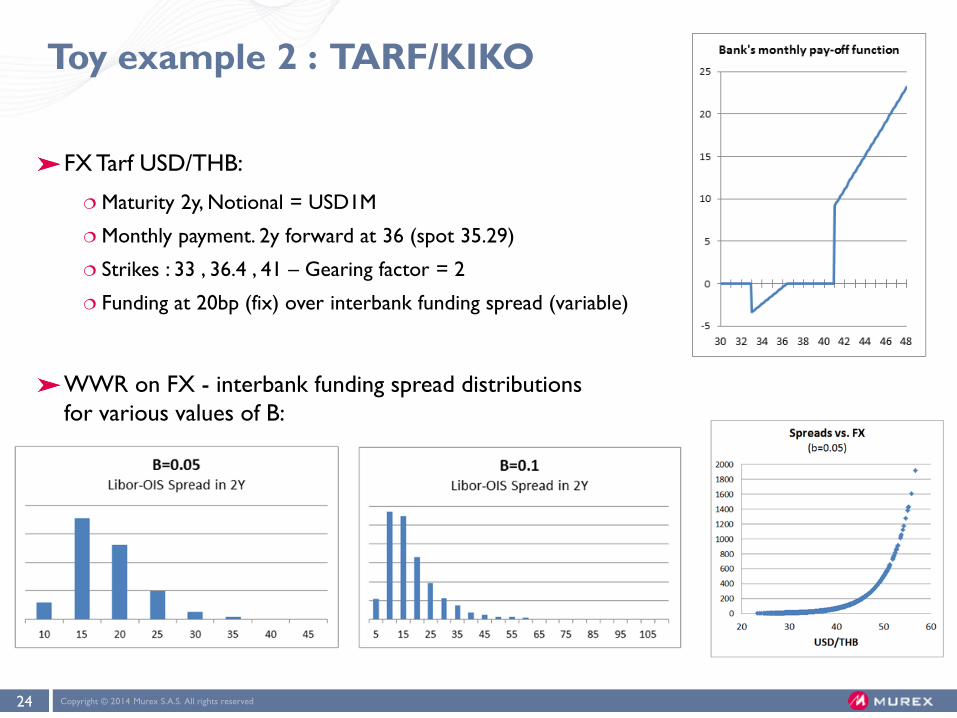
Toy example 2 : TARF/KIKO
FX Tarf USD/THB:
Maturity 2y, Notional = USD1M
Monthly payment. 2y forward at 36 (spot 35.29)
Strikes : 33 , 36.4 , 41 – Gearing factor = 2
Funding at 20bp (fix) over interbank funding spread (variable)
WWR on FX - interbank funding spread distributions
for various values of B:

Copyright © 2014 Murex S.A.S. All rights reserved 25
Toy example 2 : TARF/KIKO
Taking the funding B(FX) as 0.1, we get a 65% increase in FVA
Adding similar dynamics for CVA :
General RWR on FX (the corporate is hedging against THB appreciation)
Specific WWR on the structure’s MtM (due to gearing, default probabilities rise
sharply once the MtM rises beyond certain levels)
We get the following results with a 78% XVA increase due to combined
WWR effects on funding costs and credit risk.
Agenda
1. PRICING FUNDING COSTS AFTER THE CRISIS
2. COMPETING FVA MODELS : CSA-DISCOUNTING & EXPOSURE SIMULATION
3. WHICH FVA MODELS ARE STILL VALID NOW?
CONSIDERING POST-CRISIS SPREADS DYNAMICS
GIVEN THE IMPACT NEW REGULATORY DEVELOPMENTS
(EMIR, BASEL/IOSCO…) ON COLLATERALISATION REGIMES
4. ONE POSSIBLE FVA OPERATING MODEL
Copyright © 2014 Murex S.A.S. All rights reserved 27
How could regulation break CSA-discounting?
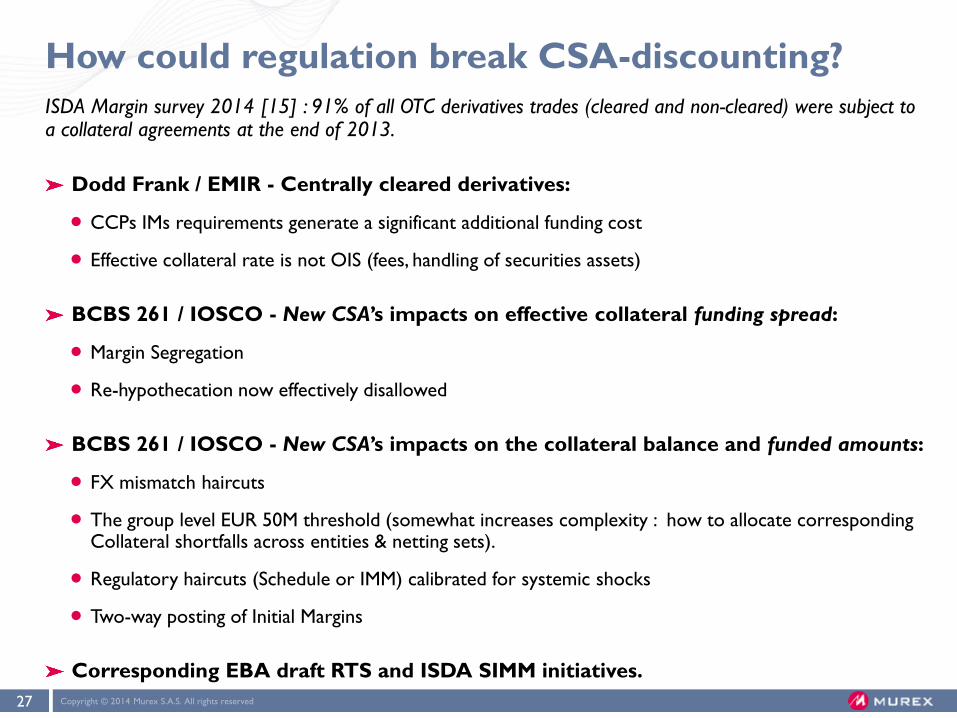
ISDA Margin survey 2014 [15] : 91% of all OTC derivatives trades (cleared and non-cleared) were subject to a collateral agreements at the end of 2013.
Dodd Frank / EMIR - Centrally cleared derivatives:
CCPs IMs requirements generate a significant additional funding cost
Effective collateral rate is not OIS (fees, handling of securities assets)
BCBS 261 / IOSCO - New CSA’s impacts on effective collateral funding spread:
Margin Segregation
Re-hypothecation now effectively disallowed
BCBS 261 / IOSCO - New CSA’s impacts on the collateral balance and funded amounts:
FX mismatch haircuts
The group level EUR 50M threshold (somewhat increases complexity : how to allocate corresponding Collateral shortfalls across entities & netting sets).
Regulatory haircuts (Schedule or IMM) calibrated for systemic shocks
Two-way posting of Initial Margins
Corresponding EBA draft RTS and ISDA SIMM initiatives.

Copyright © 2014 Murex S.A.S. All rights reserved 28
Computation of Initial Margins (IMs)
Listed products usually SPAN-based methods
Centrally cleared products use VaR-based methods; CCPs methodologies vary
VaR or Expected Shortfall (99,7%), 5d/10d liquidity horizon, 10y history, EWMA decay or scaling
Credit & liquidity multipliers
CCP pays back OIS rate – spread on cash Collateral received, not necessarily on securities.
Future CSA for uncleared products (cf. appendix 2):
Mandatory exchange of “two-way initial margins”
Simple and prohibitively expensive standardised Schedule method (40/60 NGR)
Internal model : 99% 10d VaR, split in 4 asset classes buckets, 3y history incl. period of stress
FX mismatch haircut and Group-level threshold (max €50m) across entities & agreements
ISDA SIMM proposals:
V1: Sensitivities-based VaR (Taylor expansion) on risk factor buckets
V2: SBA-M, scaled down version of the SBA-C method for FRTB, risk weight applied by sensitivities buckets – under discussion.

Copyright © 2014 Murex S.A.S. All rights reserved 29
Should IMs be considered in trade-level FVAs?
a. Simplistic example :
Assume a portfolio’s value is normally distributed (IID)
Compare the daily IMs with the portfolio average MtM,
depending on the average “age” of the positions
b. Margin replication benchmark exercise on
IRD portfolios:
Are IM amounts material enough ?
Obviously extremely variable and a function of the leverage and directionality of the portfolio being
cleared/collateralised.

Copyright © 2014 Murex S.A.S. All rights reserved 30
Modeling VaR-based IMs for FVA
Copyright © 2014 Murex S.A.S. All rights reserved 31
Measuring IMs contributions to FVA
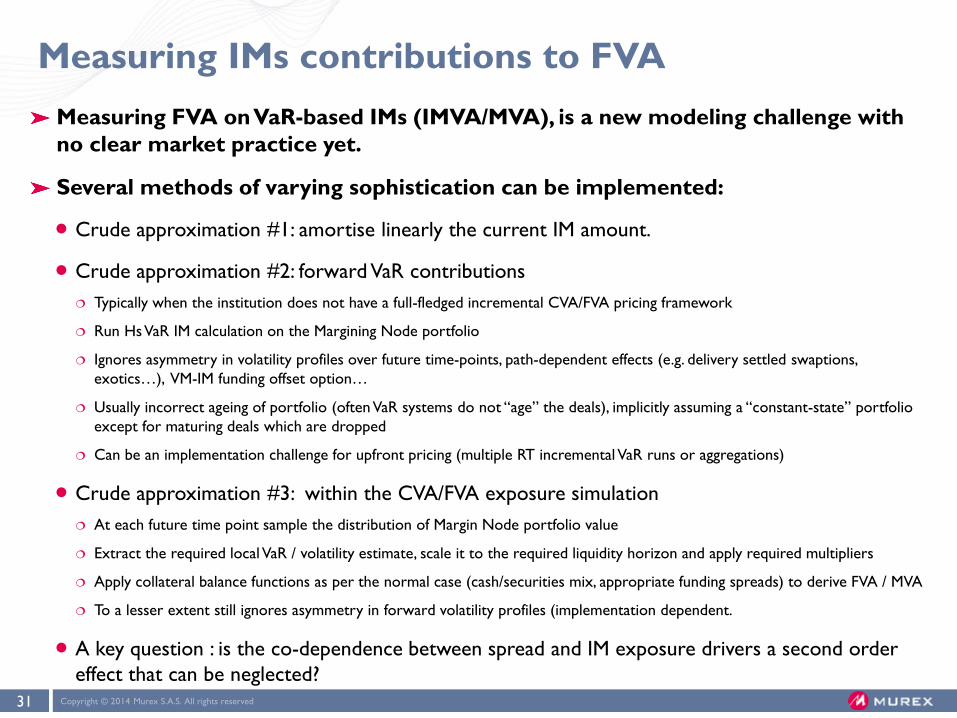
Measuring FVA on VaR-based IMs (IMVA/MVA), is a new modeling challenge with
no clear market practice yet.
Several methods of varying sophistication can be implemented:
Crude approximation #1: amortise linearly the current IM amount.
Crude approximation #2: forward VaR contributions
Typically when the institution does not have a full-fledged incremental CVA/FVA pricing framework
Run Hs VaR IM calculation on the Margining Node portfolio
Ignores asymmetry in volatility profiles over future time-points, path-dependent effects (e.g. delivery settled swaptions,
exotics…), VM-IM funding offset option…
Usually incorrect ageing of portfolio (often VaR systems do not “age” the deals), implicitly assuming a “constant-state” portfolio
except for maturing deals which are dropped
Can be an implementation challenge for upfront pricing (multiple RT incremental VaR runs or aggregations)
Crude approximation #3: within the CVA/FVA exposure simulation
At each future time point sample the distribution of Margin Node portfolio value
Extract the required local VaR / volatility estimate, scale it to the required liquidity horizon and apply required multipliers
Apply collateral balance functions as per the normal case (cash/securities mix, appropriate funding spreads) to derive FVA / MVA
To a lesser extent still ignores asymmetry in forward volatility profiles (implementation dependent.
A key question : is the co-dependence between spread and IM exposure drivers a second order
effect that can be neglected?
Copyright © 2014 Murex S.A.S. All rights reserved 32
Measuring IMs contributions to FVA
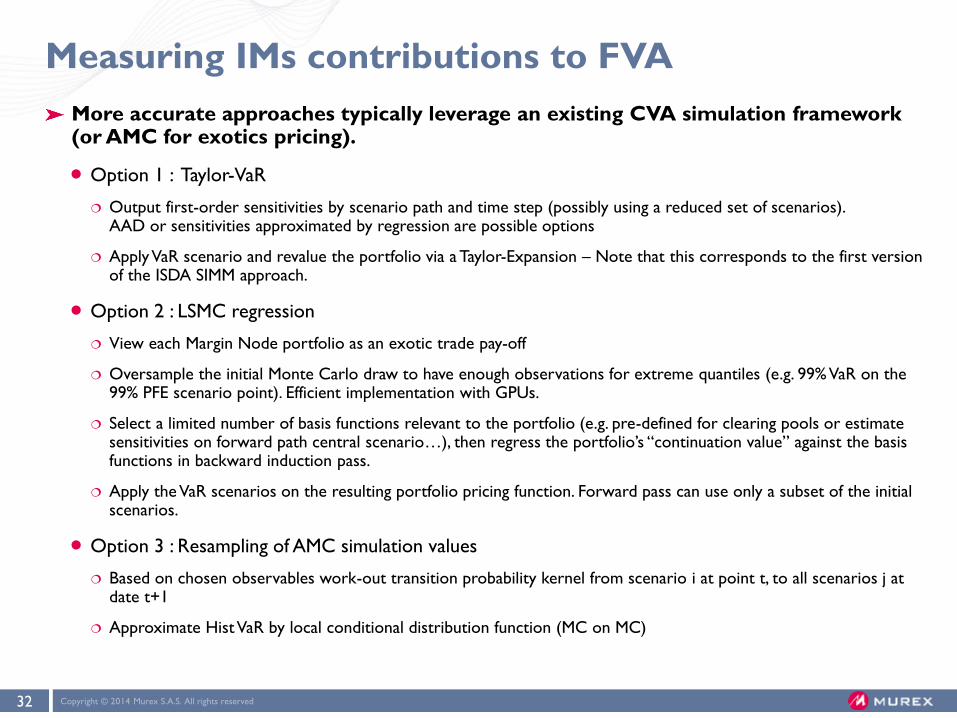
More accurate approaches typically leverage an existing CVA simulation framework (or AMC for exotics pricing).
Option 1 : Taylor-VaR
Output first-order sensitivities by scenario path and time step (possibly using a reduced set of scenarios). AAD or sensitivities approximated by regression are possible options
Apply VaR scenario and revalue the portfolio via a Taylor-Expansion – Note that this corresponds to the first version of the ISDA SIMM approach.
Option 2 : LSMC regression
View each Margin Node portfolio as an exotic trade pay-off
Oversample the initial Monte Carlo draw to have enough observations for extreme quantiles (e.g. 99% VaR on the 99% PFE scenario point). Efficient implementation with GPUs.
Select a limited number of basis functions relevant to the portfolio (e.g. pre-defined for clearing pools or estimate sensitivities on forward path central scenario…), then regress the portfolio’s “continuation value” against the basis functions in backward induction pass.
Apply the VaR scenarios on the resulting portfolio pricing function. Forward pass can use only a subset of the initial scenarios.
Option 3 : Resampling of AMC simulation values
Based on chosen observables work-out transition probability kernel from scenario i at point t, to all scenarios j at date t+1
Approximate Hist VaR by local conditional distribution function (MC on MC)

Copyright © 2014 Murex S.A.S. All rights reserved 33
Local regression for LSMC-based IM simulation
In low dimensions (e.g. clearing), local regression methods (LOWESS) can be an
interesting alternative to the usual parametric forms (e.g. polynomials).
Significant accuracy improvement on high “PFE” quantiles for exotic pay-offs
LSMC PFE accuracy w.r.t closed-form pricing (cf. Morali [12])
Parametric
regression
Local
regression
Copyright © 2014 Murex S.A.S. All rights reserved 34
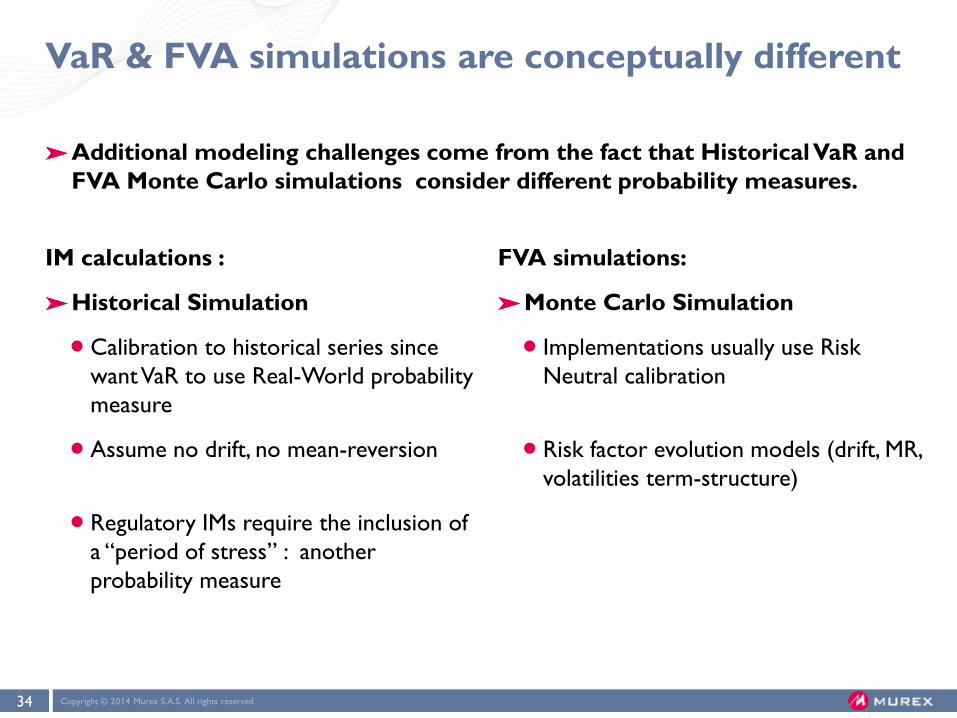
VaR & FVA simulations are conceptually different
IM calculations :
Historical Simulation
Calibration to historical series since
want VaR to use Real-World probability
measure
Assume no drift, no mean-reversion
Regulatory IMs require the inclusion of
a “period of stress” : another
probability measure
FVA simulations:
Monte Carlo Simulation
Implementations usually use Risk
Neutral calibration
Risk factor evolution models (drift, MR,
volatilities term-structure)
Additional modeling challenges come from the fact that Historical VaR and
FVA Monte Carlo simulations consider different probability measures.

Copyright © 2014 Murex S.A.S. All rights reserved 35
FVA for VaR-based IMs: methodology challenges
Is FVA estimated in the Risk-Neutral or Real World measure?
Approximations will have to be used, esp. for translating VaR scenarios in the
forward simulation
Initialization of path-wise calibration time series should be avoided :
Potentially complex (e.g. filtering or vol rescaling)
Undesirable “change of volatility regime” from today onwards, impact of mean-reversion over
long-horizons
Can we assume equivalence between:
Historical and Monte Carlo VaR?
Risk Neutral – Real World equivalence by a change of measure and use RN calibration for VaR
For regulatory IM, apply a change of measure or a simple volatilities scale-up (Stressed
Measure for Real-World Measure)?
Handling of VaR scenarios on risk factors not captured in the FVA simulation /
Margining node pricing function

Copyright © 2014 Murex S.A.S. All rights reserved 36
Modeling challenges with the “SBA-M” proposal
ISDA’s tentative proposal : SBA for Margin (SBA-M)
Purpose: offer a risk-sensitive approach that will support simplicity and speed of computations as well as facilitate the reconciliation process
Aligned on Standardised method for market risk capital (bcbs 265 : Fundamental Review of the Trading Book), with some simplifications and adjustments:
First-order sensitivities (without disallowance factor ignoring curvature/basis risk)
Recalibration of risk weights (10d liquidity period), and single correlation set. No JTD, No vega-margin in phase 1
Collateral FX risk directly included & Bucketing by risk factors rather than asset classes
Etc.
The computation of the corresponding IM FVA thus requires producing Deltas on all scenario paths and time points within the simulation, before applying the SBA algorithm !
No simple approximations as sensitivities are not stable through time and space
Full computation too heavy for incremental pricing needs
One option: estimate sensitivities in the American Monte Carlo by regressing incremental changes in values vs. incremental values of the risk driver and applying a correction for correlations (cf. Cesari [1]].
Agenda
1. PRICING FUNDING COSTS AFTER THE CRISIS
2. COMPETING FVA MODELS : CSA-DISCOUNTING & EXPOSURE SIMULATION
3. WHICH FVA MODELS ARE STILL VALID NOW?
CONSIDERING POST-CRISIS SPREADS DYNAMICS
GIVEN THE IMPACT NEW REGULATORY DEVELOPMENTS (EMIR, BASEL/IOSCO…)
ON COLLATERALISATION REGIMES
4. ONE POSSIBLE FVA OPERATING MODEL
Copyright © 2014 Murex S.A.S. All rights reserved 38
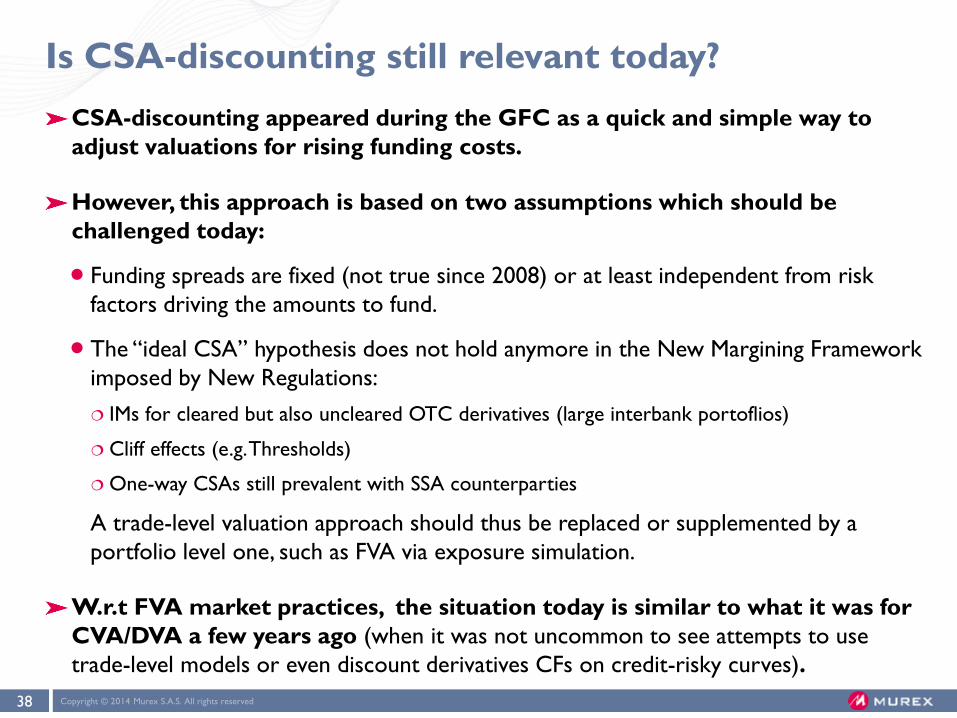
Is CSA-discounting still relevant today?
CSA-discounting appeared during the GFC as a quick and simple way to
adjust valuations for rising funding costs.
However, this approach is based on two assumptions which should be
challenged today:
Funding spreads are fixed (not true since 2008) or at least independent from risk
factors driving the amounts to fund.
The “ideal CSA” hypothesis does not hold anymore in the New Margining Framework
imposed by New Regulations:
IMs for cleared but also uncleared OTC derivatives (large interbank portoflios)
Cliff effects (e.g. Thresholds)
One-way CSAs still prevalent with SSA counterparties
A trade-level valuation approach should thus be replaced or supplemented by a
portfolio level one, such as FVA via exposure simulation.
W.r.t FVA market practices, the situation today is similar to what it was for
CVA/DVA a few years ago (when it was not uncommon to see attempts to use
trade-level models or even discount derivatives CFs on credit-risky curves).

Copyright © 2014 Murex S.A.S. All rights reserved 39
Summary of possible valuation approaches
Nonetheless, can CSA-discounting still be used in an economic value perspective
(e.g. for pricing incremental operations) in some cases ?

Copyright © 2014 Murex S.A.S. All rights reserved 40
Economic value optimisation: the accounting analogy
Why compute valuation adjustments?
Initial motivation: incentivize risk takers by valuing all economic costs/benefits to the BU ignored
in the theoretical price (credit, funding, capital…).
Later on: recognize that market prices deviate from their theoretical levels (since institutions
adjust their quotes for CVA/FVA…) to present an accurate picture of assets values in financial
statements.
Cost Accounting: aims at presenting detailed costs information to feed in internal
managerial decisions and control current operations by optimally allocating resources to the
most efficient and profitable business areas.
Financial Accounting: produces formalized financial statements (P&L account and Balance
Sheet) that are used by external stakeholders to get a “true and fair” picture of transactions,
and analyze the results and financial position of the firm on a given date.
Copyright © 2014 Murex S.A.S. All rights reserved 41
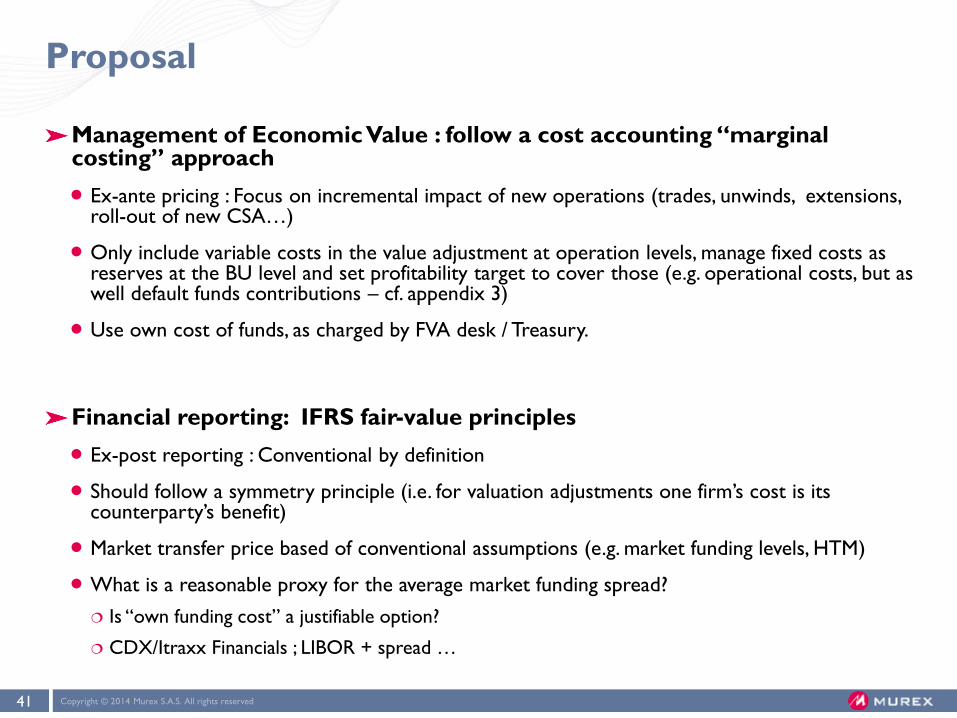
Proposal
Management of Economic Value : follow a cost accounting “marginal costing” approach
Ex-ante pricing : Focus on incremental impact of new operations (trades, unwinds, extensions, roll-out of new CSA…)
Only include variable costs in the value adjustment at operation levels, manage fixed costs as reserves at the BU level and set profitability target to cover those (e.g. operational costs, but as well default funds contributions – cf. appendix 3)
Use own cost of funds, as charged by FVA desk / Treasury.
Financial reporting: IFRS fair-value principles
Ex-post reporting : Conventional by definition
Should follow a symmetry principle (i.e. for valuation adjustments one firm’s cost is its counterparty’s benefit)
Market transfer price based of conventional assumptions (e.g. market funding levels, HTM)
What is a reasonable proxy for the average market funding spread?
Is “own funding cost” a justifiable option?
CDX/Itraxx Financials ; LIBOR + spread …
Copyright © 2014 Murex S.A.S. All rights reserved 42
One possible FVA operational model (1/2)
All trades are priced with OIS discounting and FVA adjustment:
Funding costs are priced via FVA adjustment(s), like credit is priced via CVA
FVA fees and positions are transferred to a FVA desk (can be part of Treasury or CVA desk),
leaving limited IR basis risks in the trading portfolio. Hedge ratios are identical for collateralised /
uncollateralised positions in the trader’s book.
A dedicated desk, reports and manages the Funding P&L (analysis, hedging / reserving for basis
effects, etc.)
As a default rule, assume that all trades are held to maturity (i.e. full lifetime
term-funding)
Some exceptions can be granted for specific counterparties (hedge funds) in order to price
competitively, they are managed through ad hoc processes.
Transaction extensions / roll-overs (or cash settled swaptions, exercised in delivery mode) incur
an incremental FVA charge – consistent with CVA.
Conversely early-terminations/unwinds can get back a FVA benefit fee.

Copyright © 2014 Murex S.A.S. All rights reserved 43
One possible FVA operational model (1/2)
Regarding the funding curve, an arrangement can be made with the FVA/Treasury desk:
Treasury agrees to apply a single FTP/funding rate (lend & borrow) based for a year on an industry benchmark (e.g. Libor + Xbp) - cf. Smirnov [9]
This rate is guaranteed for as long as the trading desk maintains positions within pre-agreed limits (gaps, CF ladders, PV01s…). Otherwise punitive rates are applied.
A reserve is passed at the BU level to cover for the risk of higher reset of the funding at year end (period cost)
Additional costs
Contribution to Liquidity buffer is not included in transaction prices as Treasury/ALM takes the responsibility to optimize the funding strategy (this premium is already included in the internal funding rate)
LCR/NSFR contributions can be incorporated in a KVA adjustment (being mindful of potential overlaps with liquidity buffers)
The CVA/FVA desk, Treasury and the Collateral Management function need to collaborate closely
Continuous alignment of pricing assumptions with Collateral Management practices (substitutions, re-hypothecation…)
Securities assets optimization (collateral & regulator capital)
Data management, implementation of new CSAs…
Copyright © 2014 Murex S.A.S. All rights reserved 44
Conclusion
Computing FVA for Economic Value assessment or Fair Value Accounting purpose may warrant using different modeling approaches, both in terms of methodology and inputs (e.g. choice of funding curves)
In the near future, the bulk of OTC derivatives positions will be split across:
Centrally cleared position (largest portion), where IMs, multipliers and default fund contributions generate additional funding requirements
New style CSAs (with two-ways IMs, re-hypothecation and haircuts)
Some old-style CSAs with buy-side institutions, corporates & SSAs – sometimes with the usual twists (one-way, thresholds…)
Exotics and uncollateralised transactions with corporates, SSAs (often structured trns), that can be quite sensitive to stochastic funding spreads and WWR effects.
In order to price incremental operations in a way that recognizes the economic benefits/costs of funding, a plain CSA-discounting valuation approach will not suffice anymore.
It may even provide distorted incentives by missing some important effects.
Current CSA-discounting implementations, will need to be complemented by additional computations (e.g. IMVA) or replaced by comprehensive exposure simulations.

Copyright © 2014 Murex S.A.S. All rights reserved 45
Acknowledgments
Sincere thanks to my colleagues, and in particular:
Gil Guillaumey
Guillaume Juge
Adrien Taÿ-Pamart
Copyright © 2014 Murex S.A.S. All rights reserved 46
References Industry papers
[1] G. Cesari & a. - 2009
« modeling, Pricing, and Hedging Counterparty Credit Exposure. A Technical Guide »
[2] R. Dodd, IMF paper – July 2009
« Exotic Derivatives Losses in Emerging Markets: Questions of Suitability, Concerns for Stability »
[3] C. Fries – February 2011
« Funded replication: Valuing with stochastic funding »
[4] A. Green, C. Kenyon, and C. R. Dennis – February 2014
« KVA: Capital Valuation Adjustment »
[5] J. Gregory – 2009
« Counterparty credit risk – The new challenge for global financial markets. »
[6] J. Hull & A. White – March 1998
« Incorporating volatility updating into the historical simulation for value at risk »
[7] J. Hull & A. White – June 2011
« CVA & Wrong Way Risk »
[8] M. Morini, WBS Fixed income conference – October 2012
« Model risk in today’s approaches to funding and collateral »
[9] I. Smirnov, WBS Fixed income conference – October 2013
« Liquidity & Capital in derivatives pricing »

Copyright © 2014 Murex S.A.S. All rights reserved 47
References Murex documents
[10] A. Bon, WBS CVA conference – March 2012 « OTC Collateralisation : Implementation Issues in CVA & FVA frameworks »
[10b] A. Bon – September 2010 « Specific WWR examples – case 3 : from right way to wrong way »
[11] D. Loiseau, MathFinance conference, March 2012 « Introducing Stochastic Spreads in a Multi-Curves Framework »
[12] A. Morali, HPCFinance Conference – May 2013 « American Monte Carlo for Portfolio CVA & PFE »
[13] InteDelta & Murex – May 2014 « CVA & Counterparty Risk Management : a survey of management, measurement and systems »
Regulation & institutional documents
[14] BCBS-IOSCO – September 2013 « Margin requirements for non-centrally cleared derivatives »
[15] ESMA-EBA – April 2014 « Draft RTS on risk-mitigation techniques for OTC-derivative contracts not cleared by a CCP »
[16] ISDA – December 2013 « Standard Initial Margin Model for Non-Cleared Derivatives »
[17] ISDA – April 2014 « Margin Survey 2014 »
[18] ISDA – 2014 « SIMM Methodology – SBA-Margin »

Copyright © 2014 Murex S.A.S. All rights reserved 48
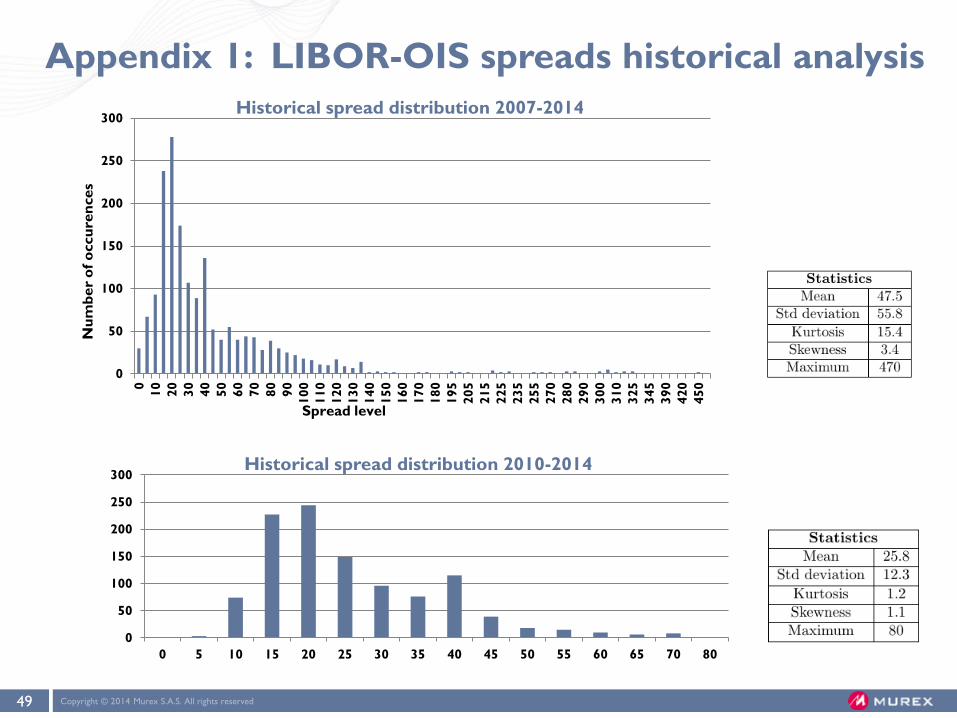
Appendix 1: LIBOR-OIS spreads historical analysis
0
20
40
60
80
100
120
140
160
180
200EUR Libor - EONIA spread (in bps)
Sp
read
0
20
40
60
80
100
120
140
160
180
200
EURIBOR - EONIA SpreadItraxx Senior Financial (Normalised)
EUR EONIA spreads Vs Credit spreads
0
50
100
150
200
250
300
350
400
450
500 USD Libor - FF spread (in bps)
Sp
read
0
50
100
150
200
250
300
350
400
450
500
USD Libor - FF spread
CDX Financial 5Y (Normalised)
USD Libor - FF spread (in bps)
Copyright © 2014 Murex S.A.S. All rights reserved 49
0
50
100
150
200
250
300
0
10
20
30
40
50
60
70
80
90
100
110
120
130
140
150
160
170
180
195
205
215
225
235
255
270
280
290
300
310
325
345
390
420
450
Historical spread distribution 2007-2014 N
um
ber
of
occu
ren
ces
Spread level
0
50
100
150
200
250
300
0 5 10 15 20 25 30 35 40 45 50 55 60 65 70 80
Historical spread distribution 2010-2014
Appendix 1: LIBOR-OIS spreads historical analysis
Copyright © 2014 Murex S.A.S. All rights reserved 50
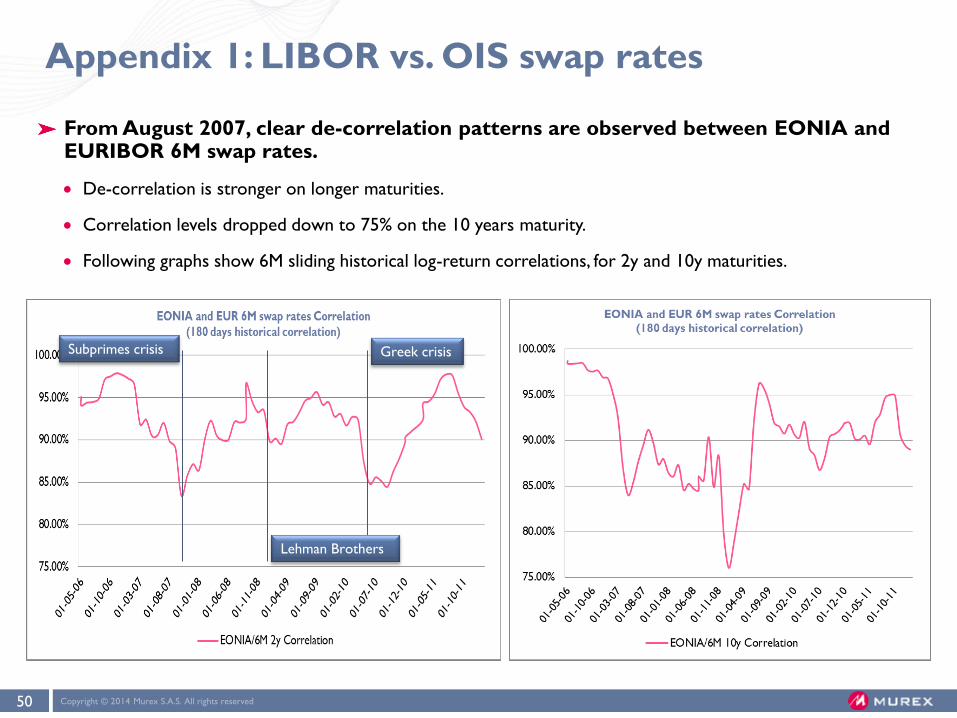
From August 2007, clear de-correlation patterns are observed between EONIA and EURIBOR 6M swap rates.
De-correlation is stronger on longer maturities.
Correlation levels dropped down to 75% on the 10 years maturity.
Following graphs show 6M sliding historical log-return correlations, for 2y and 10y maturities.
Subprimes crisis
Lehman Brothers
Greek crisis
Appendix 1: LIBOR vs. OIS swap rates

Copyright © 2014 Murex S.A.S. All rights reserved 51
Appendix 2: the new CSAs
New regulation aiming at “reducing systemic risk and promoting central clearing”
BCBS-IOSCO “Margin requirements for non-centrally cleared derivatives”, bcbs 261, Sep 2013 [14]
ESMA-EBA “Draft RTS on risk-mitigation techniques for OTC-derivative contracts not cleared by a CCP”, Apr 2014 , on-going consultation [15]
Applicable to Financial Institutions (interbank) with over €8bn notional of non-centrally cleared derivatives - gradual roll-out from Dec 2015 to Dec 2019
Key provisions in a FVA context
Mandatory exchange of “two-way initial margins”
Margin segregations and no re-hypothecation / re-use rights
Internal models or Standardised schedule methods for determining IMs and collateral haircuts
FX mismatch haircut
Group-level threshold (max €50m) across legal entities and netting agreements
De facto killed the S-CSA initiative
Dec 2013 : ISDA SIMM proposal for an internal model Initial [16]
On-going : second SIMM version aligning with market risk regulatory capital practices
Copyright © 2014 Murex S.A.S. All rights reserved 52
Appendix 2: IM requirements in the new CSA
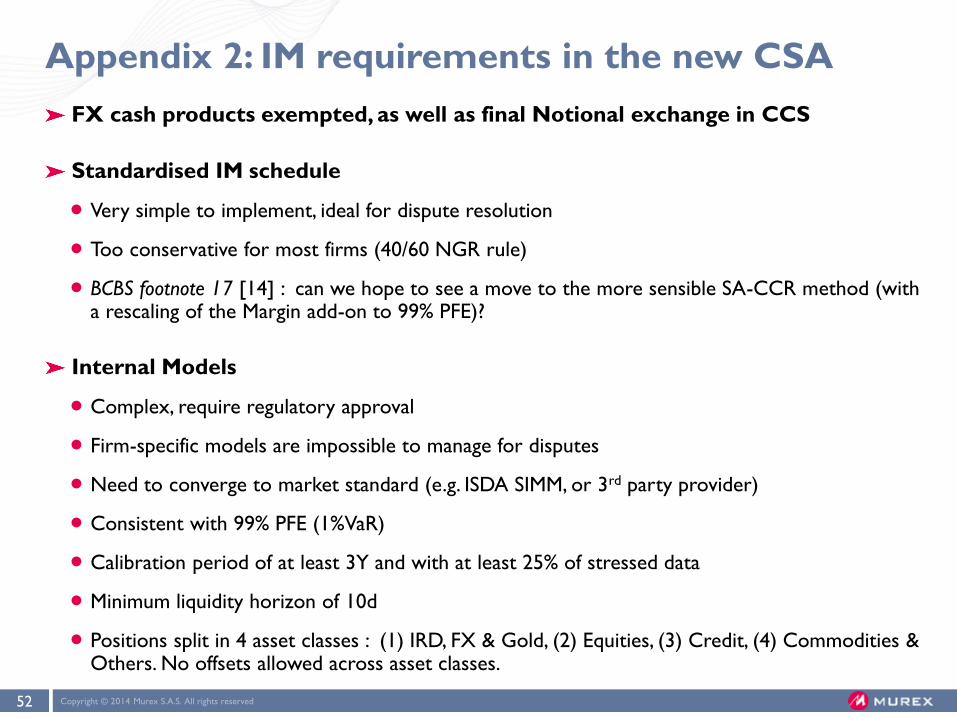
FX cash products exempted, as well as final Notional exchange in CCS
Standardised IM schedule
Very simple to implement, ideal for dispute resolution
Too conservative for most firms (40/60 NGR rule)
BCBS footnote 17 [14] : can we hope to see a move to the more sensible SA-CCR method (with a rescaling of the Margin add-on to 99% PFE)?
Internal Models
Complex, require regulatory approval
Firm-specific models are impossible to manage for disputes
Need to converge to market standard (e.g. ISDA SIMM, or 3rd party provider)
Consistent with 99% PFE (1%VaR)
Calibration period of at least 3Y and with at least 25% of stressed data
Minimum liquidity horizon of 10d
Positions split in 4 asset classes : (1) IRD, FX & Gold, (2) Equities, (3) Credit, (4) Commodities & Others. No offsets allowed across asset classes.

Copyright © 2014 Murex S.A.S. All rights reserved 53
Appendix 2: computation of IMs at CCPs
Different CCPs can apply different methodogies
Listed products usually SPAN-based methods
OTC derivatives usually VaR-based:
10 years historical series with EWMA decay (e.g. LCH SwapClear) or EWMA vol re-
scaling (cf. Hull & White [6]).
5d/10d risk factor shocks are applied (with overlapping sampling)
High percentile VaR or Expected Shortfall (e.g. 99.7%)
CCP-specific pricing conventions (e.g. OIS discounting)
Credit & Liquidity Multipliers:
Can be material too
Can show some cliff effects
Copyright © 2014 Murex S.A.S. All rights reserved 54
Appendix 3: economic costs of cleared trades
On-going clearing costs for DCMs:
Unsecured funding of excess collateral balance :
Function of the trade specifics w.r.t the legacy portfolio and the CCP methodology, as well as
effective collateral rate
Proposal : should be handled as a trade-level variable cost and measured a priori.
Default fund contribution :
Monthly charge function of the relative volume transacted with the CCP vs. other participants.
Can only be measured a posteriori
Proposal : handled as a business unit level period cost (that can be reserved for) since the impact
of a single trade is unclear and this component should not drive the decision to make an
incremental transaction.
Other Costs:
Clearing Fees (semi-variable: fixed+volume based), Settlement & CSD charges, Bank Charges,
Operating costs
Can be allocated as trade variable costs, can be difficult to analyse but require no complex
modeling
Copyright © 2014 Murex S.A.S. All rights reserved 55
Appendix 3: economic costs of cleared trades
Proposal : unsecured funding of excess collateral balance : should be
handled as a trade-level variable cost and measured a priori.
Additional on-going clearing costs for DCMs:
Default fund contribution :
Monthly charge function of the relative volume transacted with the CCP vs. other participants.
Can only be measured a posteriori
Proposal : handled as a business unit level period cost (that can be reserved for) since the impact
of a single trade is unclear and this component should not drive the decision to make an
incremental transaction.
Other Costs:
Clearing Fees (semi-variable: fixed + volume based), Settlement & CSD charges, Bank Charges,
Operating costs
Can be allocated as trade variable costs, can be difficult to analyse but require no complex
modeling

THANK YOU