risks and reservoir operations: droughts vs floods ... and reservoir operations: droughts vs floods...
TRANSCRIPT
Risks and Reservoir Operations: Droughts vs Floods & People vs Power
Bruce McGurk, Ph.D., Operations Manager & Hydrologist San Francisco Public Utilities Commission Hetch Hetchy Water & Power PO Box 160 Moccasin, CA 95347
Tel: (209) 989-2124 Fax: (209) 989-2045 Email: [email protected] Web: http://sfwater.org
BIOGRAPHICAL SKETCH Dr. Bruce McGurk spent 15 years as a research hydrologist with the USDA Forest Service Pacific Southwest Station. He managed the Central Sierra Snow Laboratory and published on rain on snow, snowmelt processes, water flow through snow, environmental instrumentation. He spent nine years working for Pacific Gas and Electric in forecasting and reservoir operations, and was also involved in numerous hydro project relicensing proceedings. He has been with Hetch Hetchy Water and Power for three years and leads the Water and Power Planning group. He is general chair of the Western Snow Conference and president of the Watershed Management Council.
ABSTRACT
Droughts and floods cause immense hardship for an area’s residents. The water infrastructure of California not only to moves water from where it is plentiful to where it is rare and/or needed, as well as protecting against very wet years/very big storms and the critically dry years, especially ones in sequence. Reservoir operators use risk management to meet water supply needs and/or maximize power generation across the range of water conditions from drought to floods. Forecasting seasonal snowmelt runoff using both historical monthly statistical models and 5- and 10-day hydrologic simulation models guides decisions about holding or releasing water. Power operations seek to maximize revenue from storage, and failing to fill when dry years occur is acceptable. Water supply operations seek to keep storage high under all water year types, but when excess water is available at very low risk to water supply, generation occurs. Challenges to power and water supply operations exist due to global warming, increased environmental flows, whitewater recreation demands, and population and demand growth.
Risks & Reservoir Ops: Drought Risks & Reservoir Ops: Drought vsvsFlood & Water Supply Flood & Water Supply vsvs Power Power
Bruce Bruce McGurkMcGurkOperations Manager & HydrologistOperations Manager & HydrologistSFPUC, SFPUC, HetchHetch HetchyHetchy Water and PowerWater and Power
Yosemite Falls, photo by B.McGurk
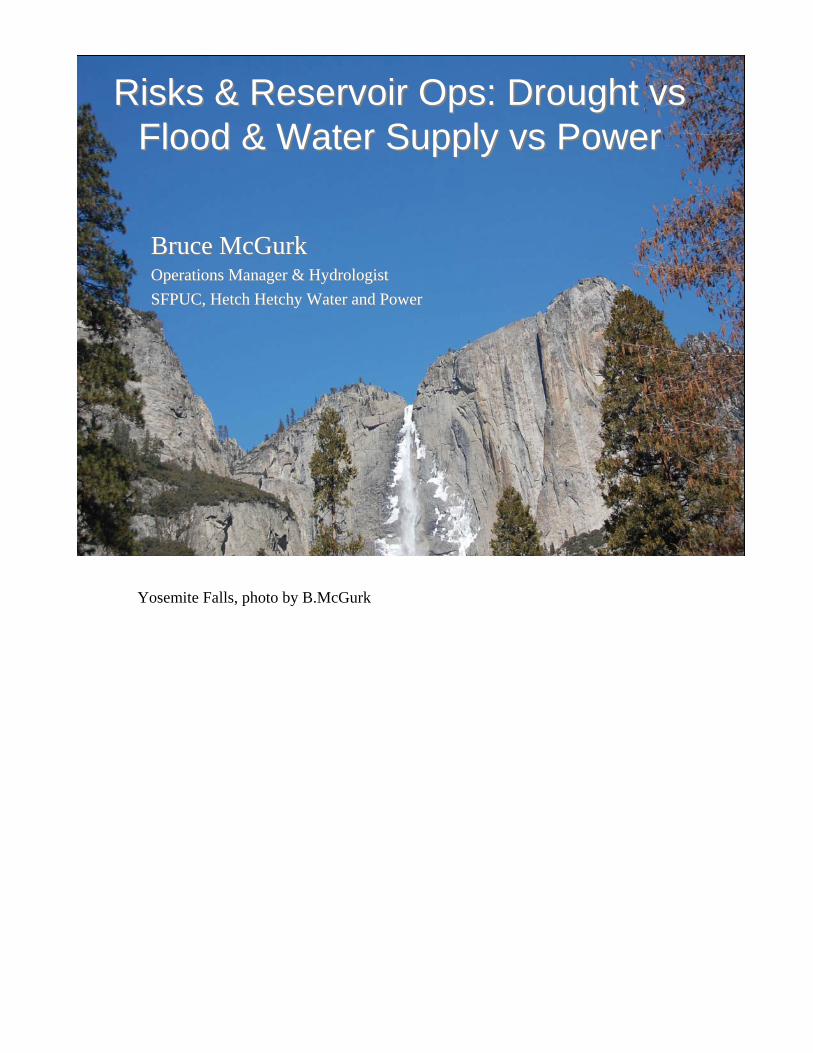
Three Homeowner’s Questions
1. How much does a house weigh?
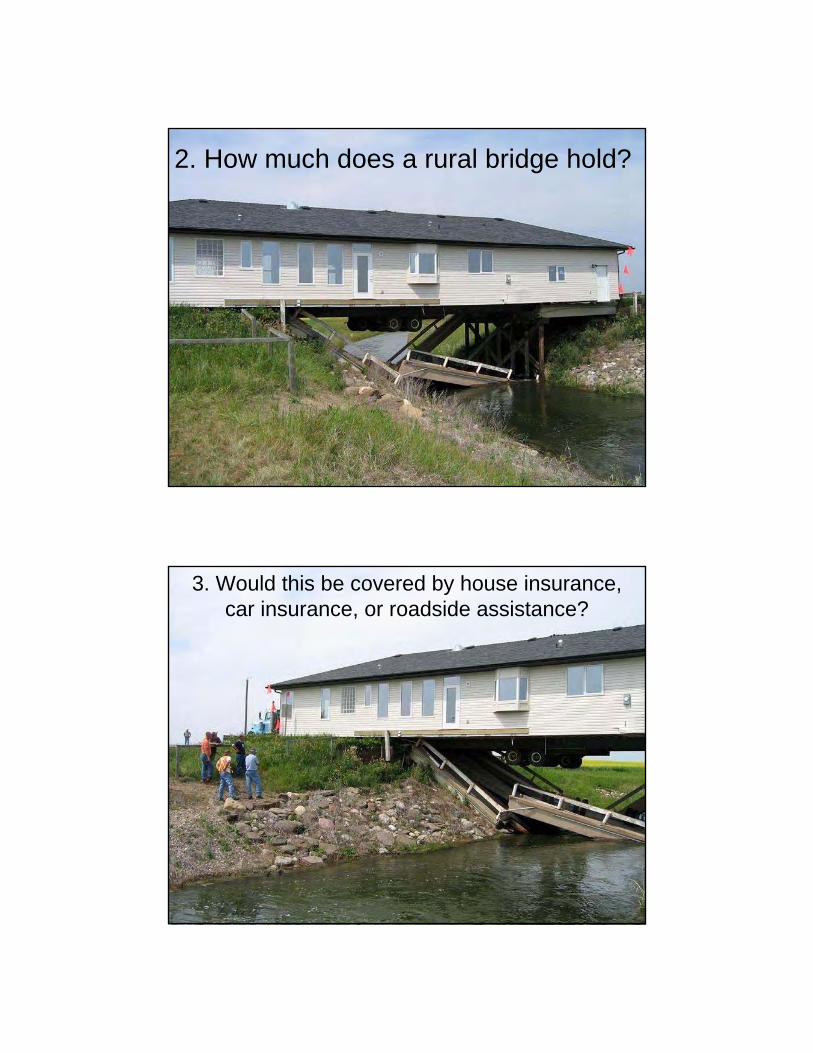
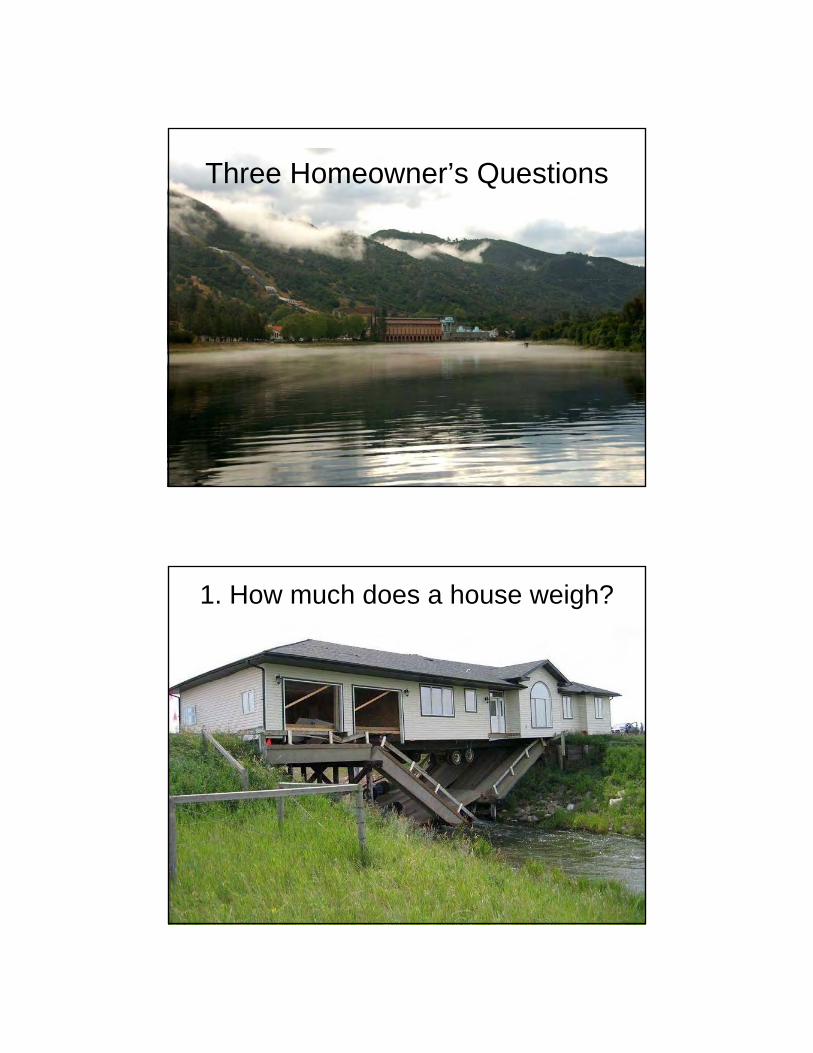
2. How much does a rural bridge hold?
3. Would this be covered by house insurance, car insurance, or roadside assistance?
OutlineOutline
Reservoirs and operationsReservoirs and operationsWestern reservoir opsWestern reservoir opsForecasting toolsForecasting toolsPower goals and opsPower goals and opsWater supply goals & opsWater supply goals & opsChallengesChallenges
We spent the morning hearing about how dry it has been, can be, and will be, and next speaker will talk about floods. So what defense do we have against these thankfully-rare events?
The water infrastructure of Cal is the answer – not only to moving water from where it is plentiful to where it is rare and/or needed, but to mitigate against the vagaries of nature and the unpredictable but certain to occur very wet years/very big storms and the critically dry years, especially ones in sequence.
Photo of Hetch Hetchy Reservoir, May 2009, by B.McGurk
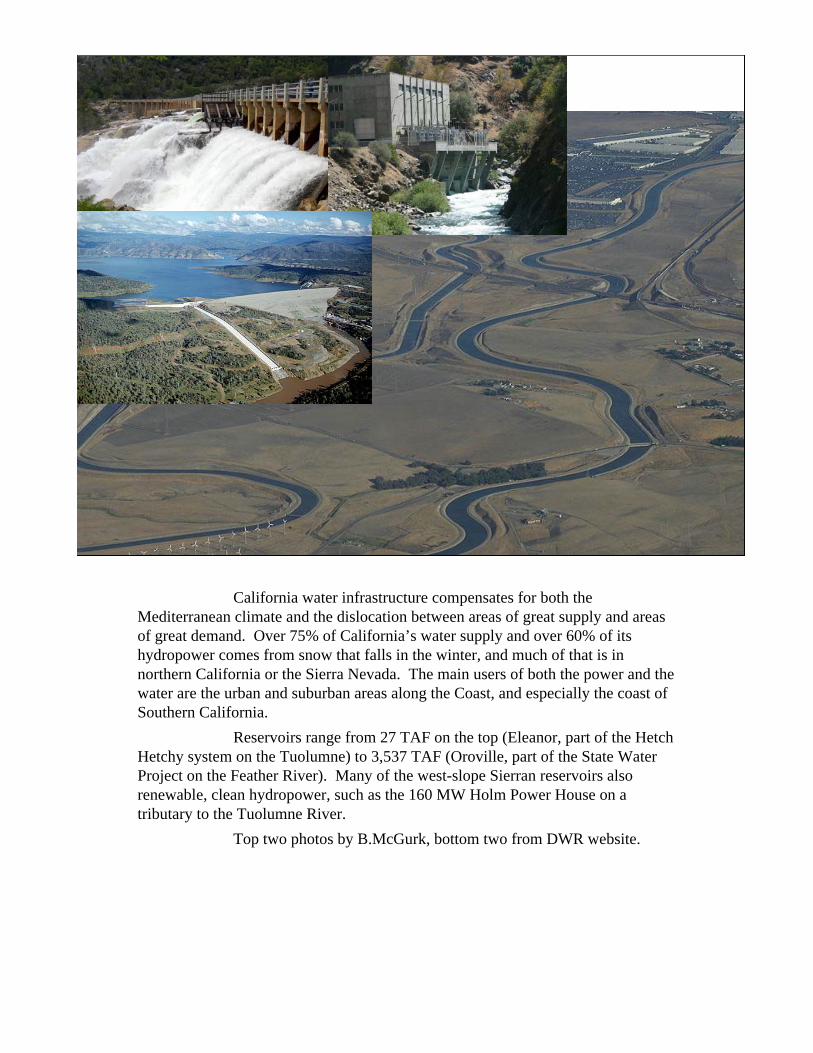
California water infrastructure compensates for both the Mediterranean climate and the dislocation between areas of great supply and areas of great demand. Over 75% of California’s water supply and over 60% of its hydropower comes from snow that falls in the winter, and much of that is in northern California or the Sierra Nevada. The main users of both the power and the water are the urban and suburban areas along the Coast, and especially the coast of Southern California.
Reservoirs range from 27 TAF on the top (Eleanor, part of the Hetch Hetchy system on the Tuolumne) to 3,537 TAF (Oroville, part of the State Water Project on the Feather River). Many of the west-slope Sierran reservoirs also renewable, clean hydropower, such as the 160 MW Holm Power House on a tributary to the Tuolumne River.
Top two photos by B.McGurk, bottom two from DWR website.
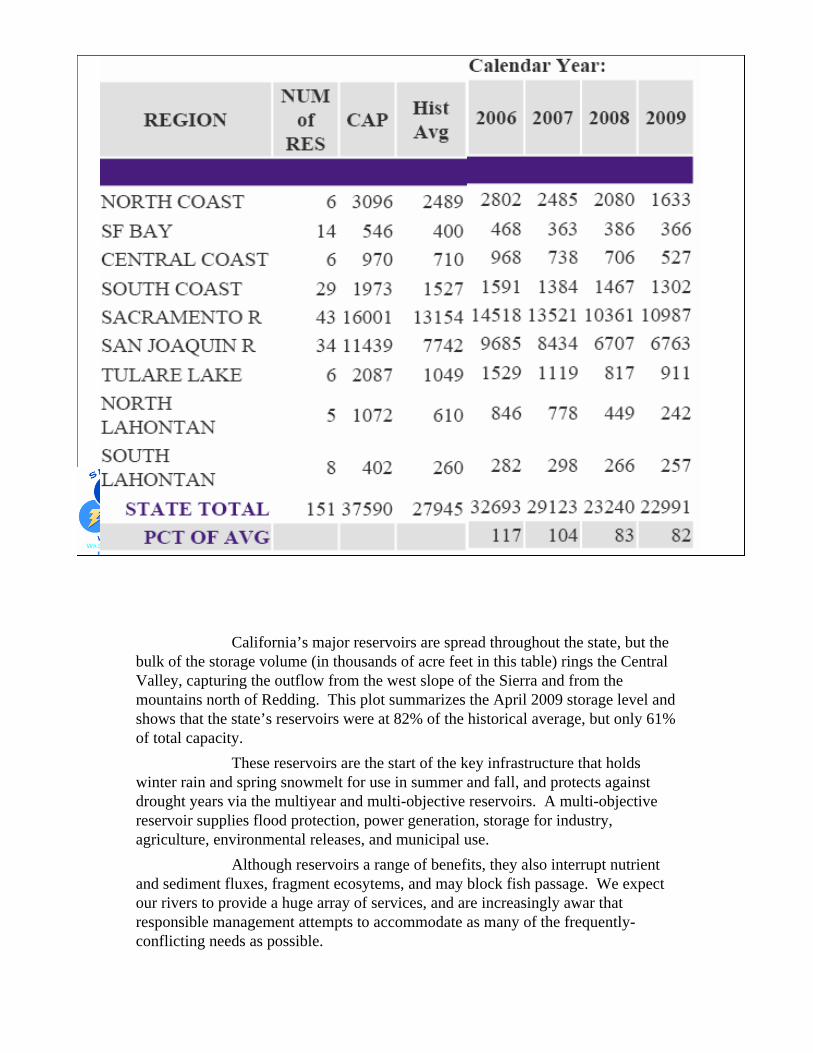
California’s major reservoirs are spread throughout the state, but the bulk of the storage volume (in thousands of acre feet in this table) rings the Central Valley, capturing the outflow from the west slope of the Sierra and from the mountains north of Redding. This plot summarizes the April 2009 storage level and shows that the state’s reservoirs were at 82% of the historical average, but only 61%of total capacity.
These reservoirs are the start of the key infrastructure that holds winter rain and spring snowmelt for use in summer and fall, and protects against drought years via the multiyear and multi-objective reservoirs. A multi-objective reservoir supplies flood protection, power generation, storage for industry, agriculture, environmental releases, and municipal use.
Although reservoirs a range of benefits, they also interrupt nutrient and sediment fluxes, fragment ecosytems, and may block fish passage. We expect our rivers to provide a huge array of services, and are increasingly awar that responsible management attempts to accommodate as many of the frequently-conflicting needs as possible.

Example of the California Central Valley water infrastructure connections, from UC Davis Calvin model, Lund et al.
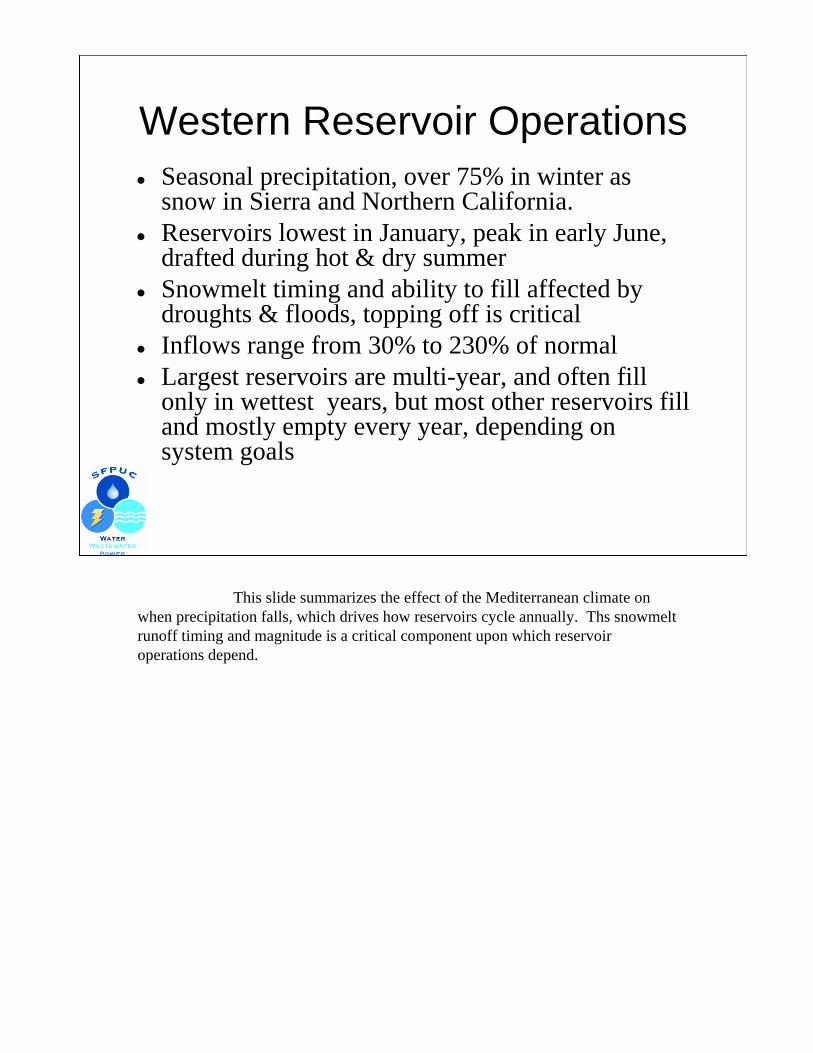
Western Reservoir OperationsSeasonal precipitation, over 75% in winter as snow in Sierra and Northern California.Reservoirs lowest in January, peak in early June, drafted during hot & dry summerSnowmelt timing and ability to fill affected by droughts & floods, topping off is criticalInflows range from 30% to 230% of normalLargest reservoirs are multi-year, and often fill only in wettest years, but most other reservoirs fill and mostly empty every year, depending on system goals
This slide summarizes the effect of the Mediterranean climate onwhen precipitation falls, which drives how reservoirs cycle annually. Ths snowmelt runoff timing and magnitude is a critical component upon which reservoir operations depend.
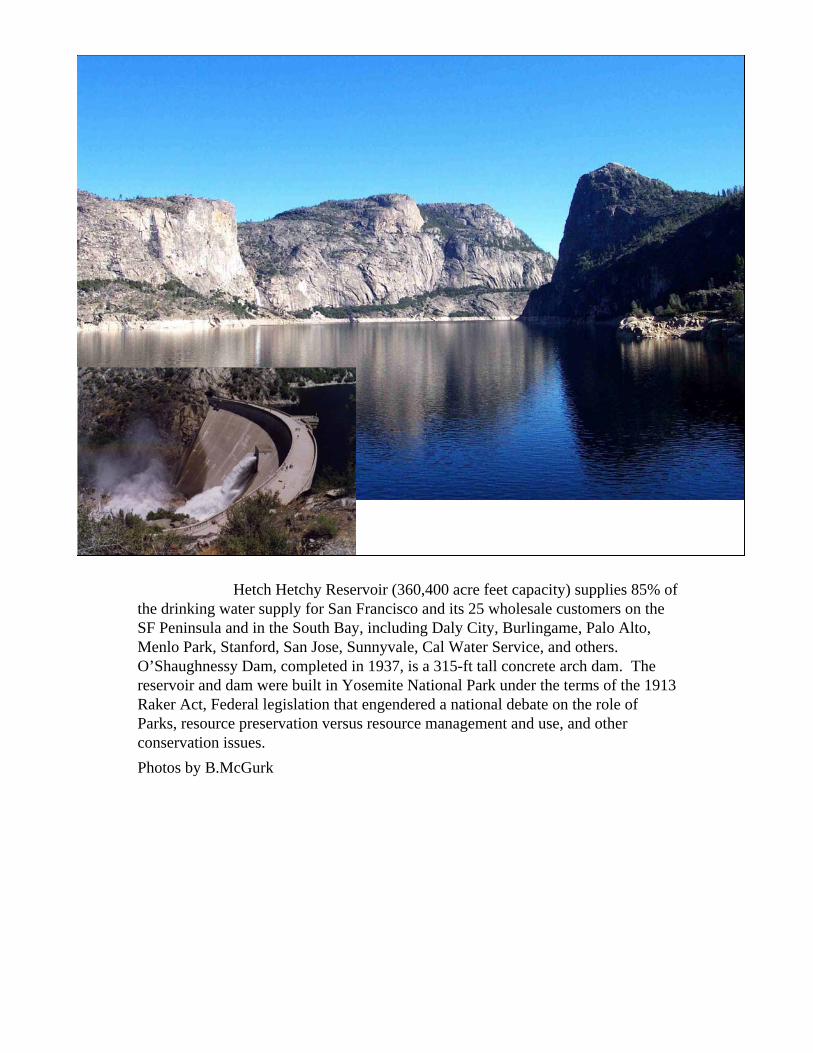
Hetch Hetchy Reservoir (360,400 acre feet capacity) supplies 85% of the drinking water supply for San Francisco and its 25 wholesale customers on the SF Peninsula and in the South Bay, including Daly City, Burlingame, Palo Alto, Menlo Park, Stanford, San Jose, Sunnyvale, Cal Water Service, and others. O’Shaughnessy Dam, completed in 1937, is a 315-ft tall concrete arch dam. The reservoir and dam were built in Yosemite National Park under the terms of the 1913 Raker Act, Federal legislation that engendered a national debate on the role of Parks, resource preservation versus resource management and use, and other conservation issues. Photos by B.McGurk
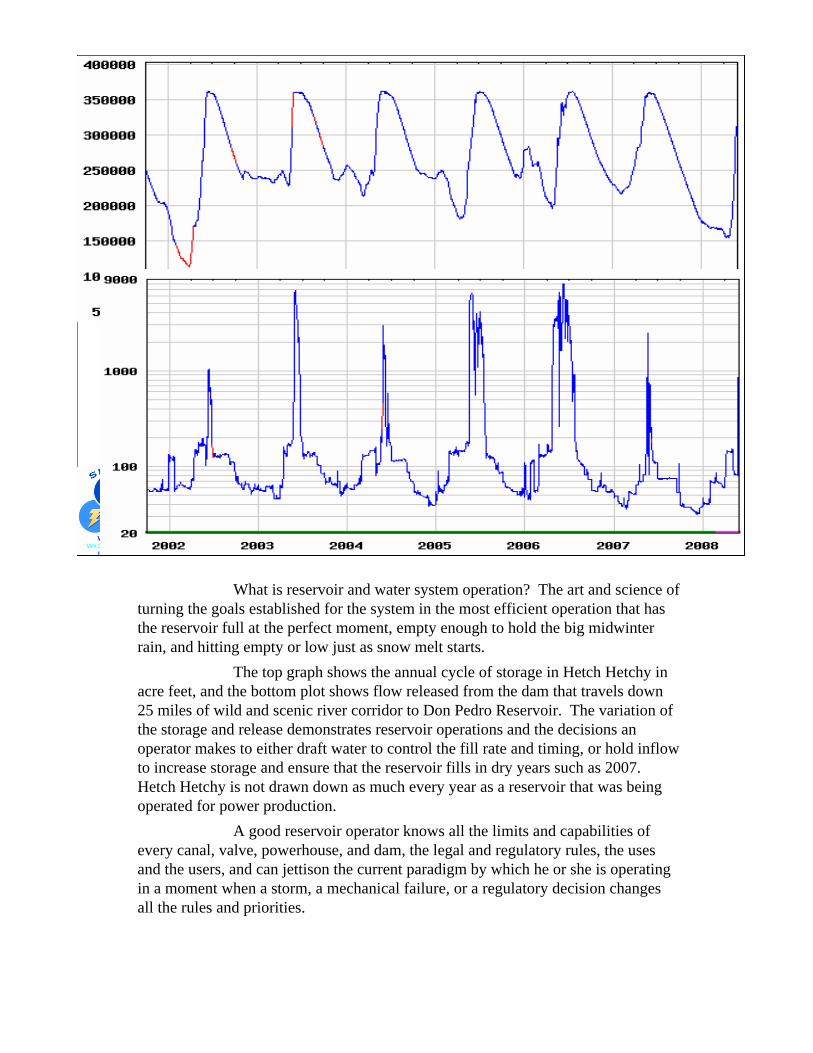
What is reservoir and water system operation? The art and science of turning the goals established for the system in the most efficient operation that has the reservoir full at the perfect moment, empty enough to hold the big midwinter rain, and hitting empty or low just as snow melt starts.
The top graph shows the annual cycle of storage in Hetch Hetchy in acre feet, and the bottom plot shows flow released from the dam that travels down 25 miles of wild and scenic river corridor to Don Pedro Reservoir. The variation of the storage and release demonstrates reservoir operations and the decisions an operator makes to either draft water to control the fill rate and timing, or hold inflow to increase storage and ensure that the reservoir fills in dry years such as 2007. Hetch Hetchy is not drawn down as much every year as a reservoir that was being operated for power production.
A good reservoir operator knows all the limits and capabilities of every canal, valve, powerhouse, and dam, the legal and regulatory rules, the uses and the users, and can jettison the current paradigm by which he or she is operating in a moment when a storm, a mechanical failure, or a regulatory decision changes all the rules and priorities.
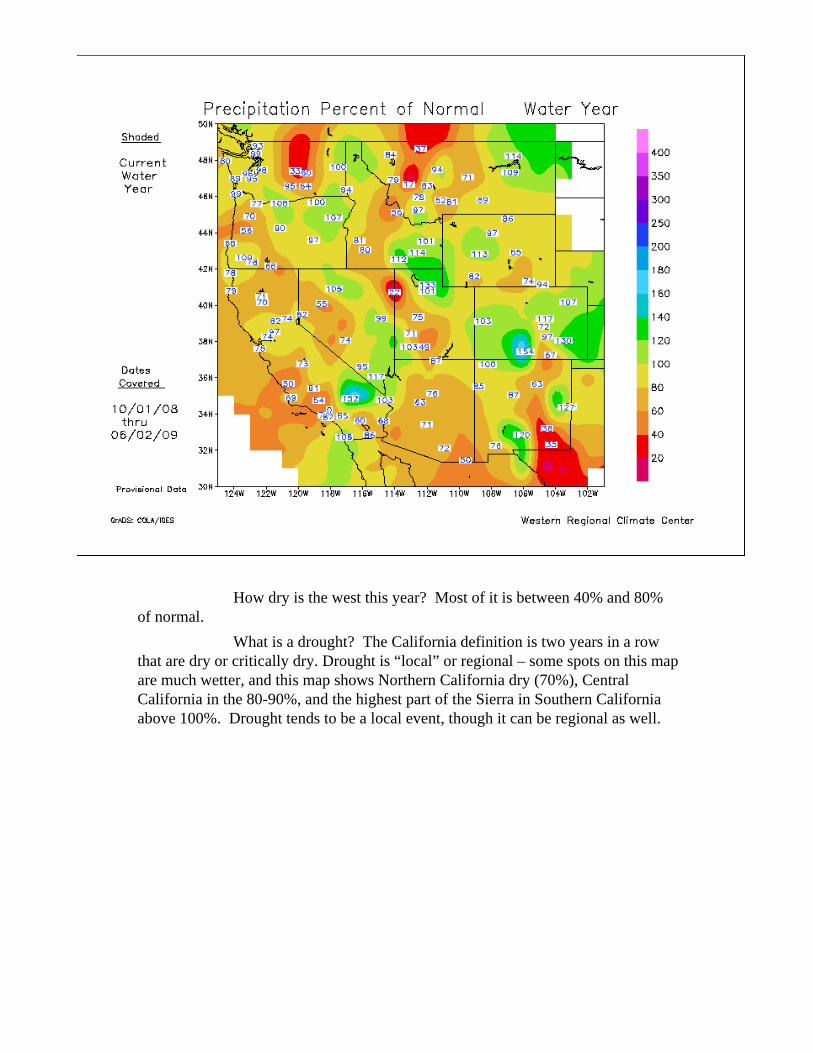
How dry is the west this year? Most of it is between 40% and 80% of normal.
What is a drought? The California definition is two years in a row that are dry or critically dry. Drought is “local” or regional – some spots on this map are much wetter, and this map shows Northern California dry (70%), Central California in the 80-90%, and the highest part of the Sierra in Southern California above 100%. Drought tends to be a local event, though it can be regional as well.
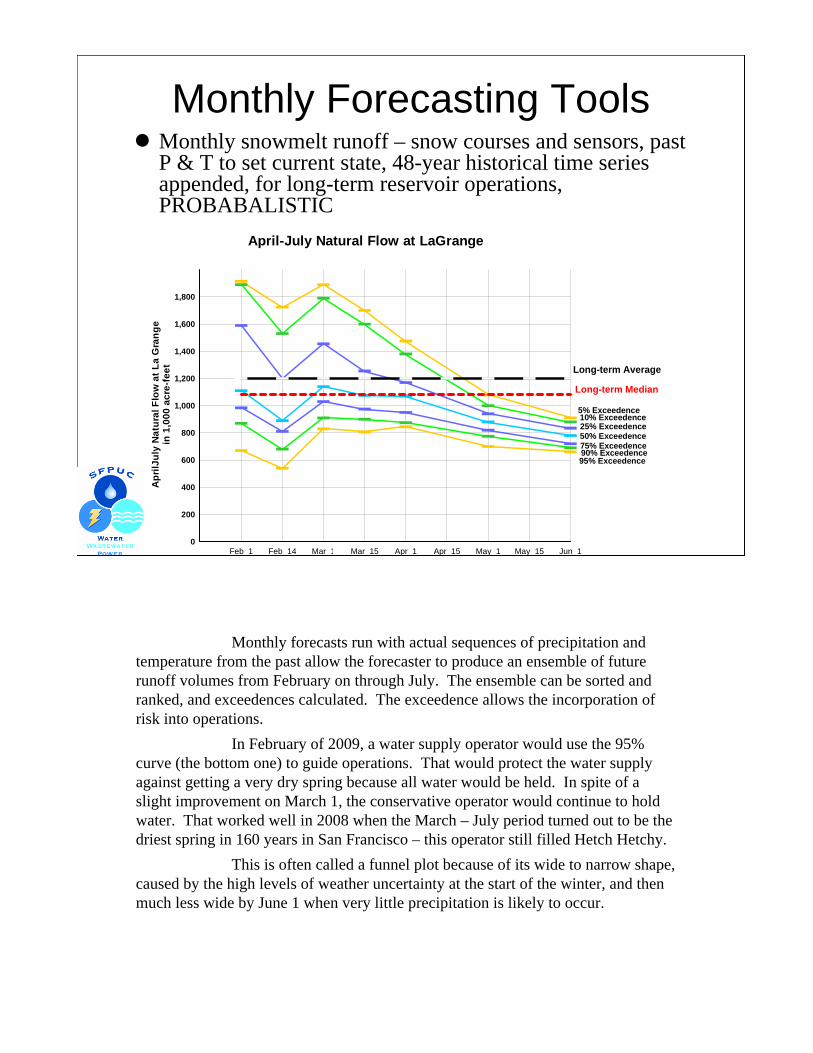
Monthly Forecasting ToolsMonthly snowmelt runoff – snow courses and sensors, past P & T to set current state, 48-year historical time series appended, for long-term reservoir operations, PROBABALISTIC
Feb_1 Feb_14 Mar_1 Mar_15 Apr_1 Apr_15 May_1 May_15 Jun_10
200
400
600
800
1,000
1,200
1,400
1,600
1,800
Apr
ilJul
y N
atur
al F
low
at L
a G
rang
ein
1,0
00 a
cre-
feet
April-July Natural Flow at LaGrange
Long-term Average
Long-term Median
5% Exceedence10% Exceedence25% Exceedence50% Exceedence75% Exceedence90% Exceedence95% Exceedence
Monthly forecasts run with actual sequences of precipitation andtemperature from the past allow the forecaster to produce an ensemble of future runoff volumes from February on through July. The ensemble can be sorted and ranked, and exceedences calculated. The exceedence allows the incorporation of risk into operations.
In February of 2009, a water supply operator would use the 95% curve (the bottom one) to guide operations. That would protect the water supply against getting a very dry spring because all water would be held. In spite of a slight improvement on March 1, the conservative operator would continue to hold water. That worked well in 2008 when the March – July period turned out to be the driest spring in 160 years in San Francisco – this operator still filled Hetch Hetchy.
This is often called a funnel plot because of its wide to narrow shape, caused by the high levels of weather uncertainty at the start of the winter, and then much less wide by June 1 when very little precipitation is likely to occur.
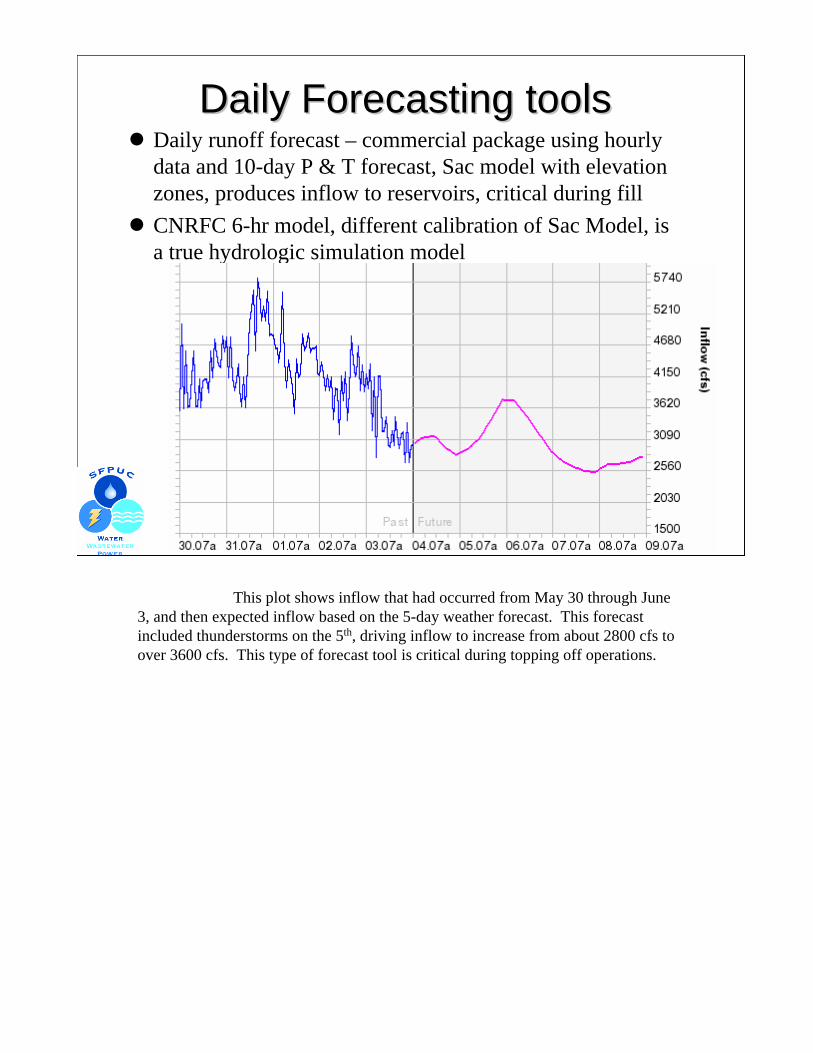
Daily Forecasting toolsDaily Forecasting toolsDaily runoff forecast – commercial package using hourly data and 10-day P & T forecast, Sac model with elevation zones, produces inflow to reservoirs, critical during fillCNRFC 6-hr model, different calibration of Sac Model, is a true hydrologic simulation model
This plot shows inflow that had occurred from May 30 through June 3, and then expected inflow based on the 5-day weather forecast. This forecast included thunderstorms on the 5th, driving inflow to increase from about 2800 cfs to over 3600 cfs. This type of forecast tool is critical during topping off operations.
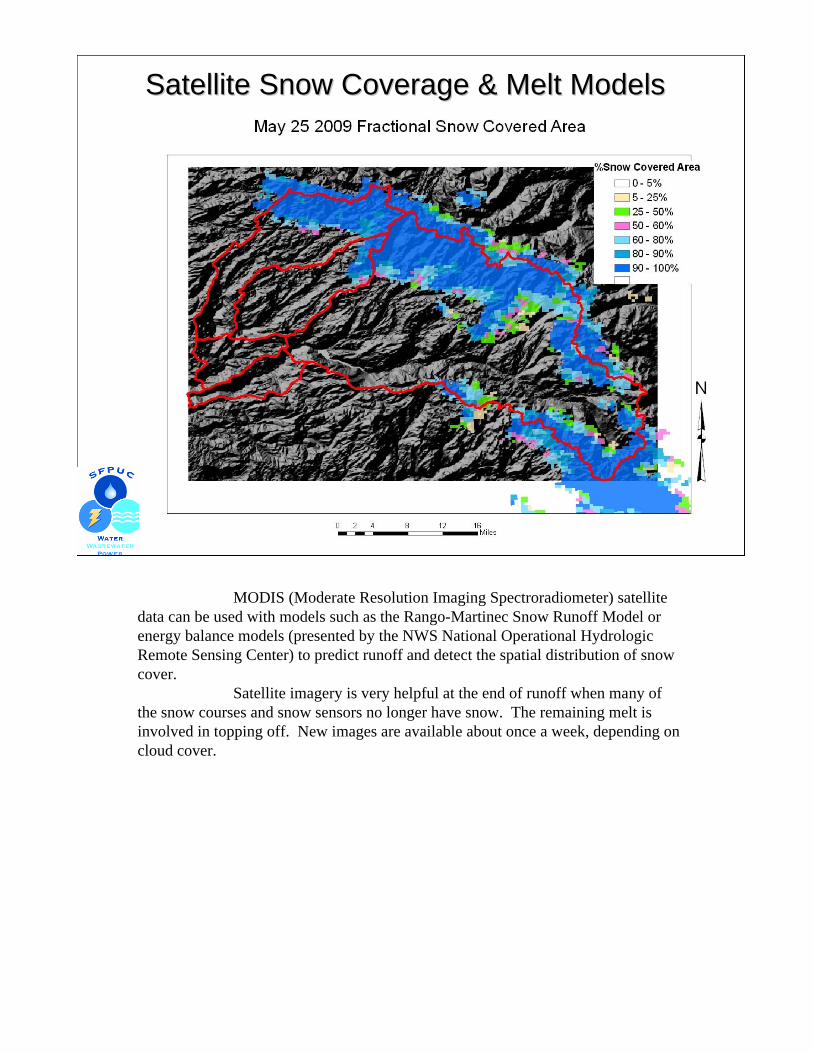
Satellite Snow Coverage & Melt ModelsSatellite Snow Coverage & Melt Models
MODIS (Moderate Resolution Imaging Spectroradiometer) satellite data can be used with models such as the Rango-Martinec Snow Runoff Model or energy balance models (presented by the NWS National Operational Hydrologic Remote Sensing Center) to predict runoff and detect the spatial distribution of snow cover.
Satellite imagery is very helpful at the end of runoff when many of the snow courses and snow sensors no longer have snow. The remaining melt is involved in topping off. New images are available about once a week, depending on cloud cover.
Forecasts, Drafts, and StorageForecasts, Drafts, and Storage
310,000
320,000
330,000
340,000
350,000
360,000
20-May 22-May 24-May 26-May 28-May 30-May 1-Jun
Het
ch H
etch
y St
orag
e (a
cre-
feet
)
500
1500
2500
3500
4500
5500
6500
7500
8500
Flow (cfs)
VISTA FillNWS FillObserved FillVISTA InflowNWS inflowPowerdraftValve Release
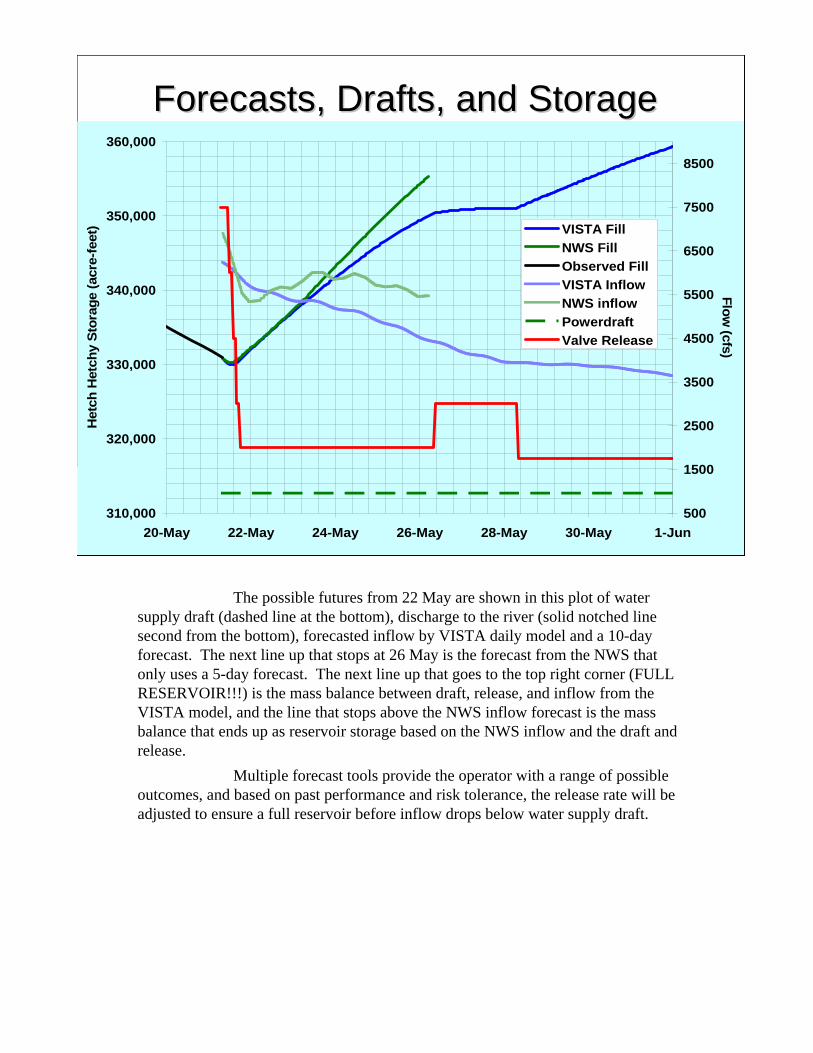
The possible futures from 22 May are shown in this plot of watersupply draft (dashed line at the bottom), discharge to the river (solid notched line second from the bottom), forecasted inflow by VISTA daily model and a 10-day forecast. The next line up that stops at 26 May is the forecast from the NWS that only uses a 5-day forecast. The next line up that goes to the top right corner (FULL RESERVOIR!!!) is the mass balance between draft, release, and inflow from the VISTA model, and the line that stops above the NWS inflow forecast is the mass balance that ends up as reservoir storage based on the NWS inflow and the draft and release.
Multiple forecast tools provide the operator with a range of possible outcomes, and based on past performance and risk tolerance, the release rate will be adjusted to ensure a full reservoir before inflow drops below water supply draft.

Power OperationsPower Operations
Hydro generation plays a key part of Cal’s energy supply, 20% of total daily load and grid stabilityHydro and nuclear power are exact opposites in every way, but both decrease use of fossil fuelGoal is to maximize revenue from storage, which depends on the marketPrice curve guides water allocation, and risk analysis is performed to evaluate opportunity cost of different strategies
The photo shows a Pelton wheel and the generator windings in one of the horizontal-axle turbine-generator systems at PG&E’s Electra Powerhouse. Because this powerhouse is supplied by a forebay, it can increase and decrease load in steps governed by the California Independent System Operator to stabilize the grid. As demand changes, Electra changes its output in minutes. Gas-fired and some other generating systems also ramp up and down to follow the daily demand cycle, but hydro does it fastest and first.
The dryer the year or the lower the storage, the higher price that hydro commands to meet this need. Photo by B.McGurk
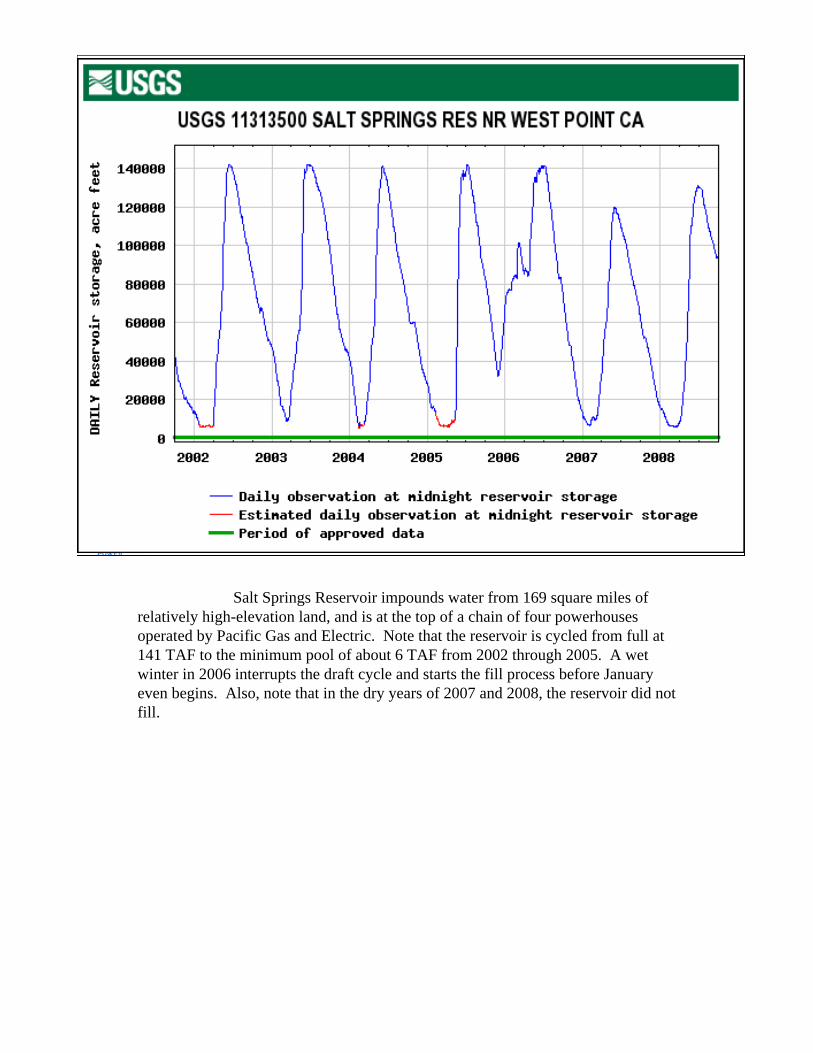
Salt Springs Reservoir impounds water from 169 square miles of relatively high-elevation land, and is at the top of a chain of four powerhousesoperated by Pacific Gas and Electric. Note that the reservoir is cycled from full at 141 TAF to the minimum pool of about 6 TAF from 2002 through 2005. A wet winter in 2006 interrupts the draft cycle and starts the fill process before January even begins. Also, note that in the dry years of 2007 and 2008, the reservoir did not fill.
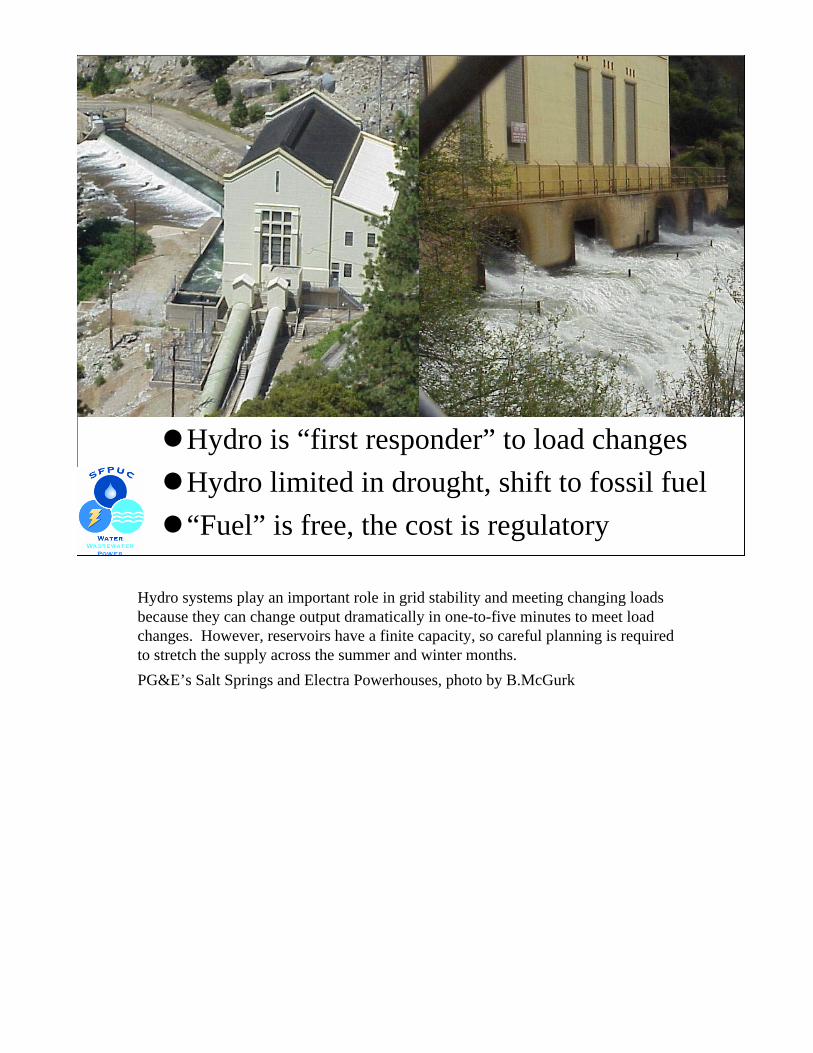
Hydro is “first responder” to load changesHydro limited in drought, shift to fossil fuel“Fuel” is free, the cost is regulatory
Hydro systems play an important role in grid stability and meeting changing loads because they can change output dramatically in one-to-five minutes to meet load changes. However, reservoirs have a finite capacity, so careful planning is required to stretch the supply across the summer and winter months. PG&E’s Salt Springs and Electra Powerhouses, photo by B.McGurk
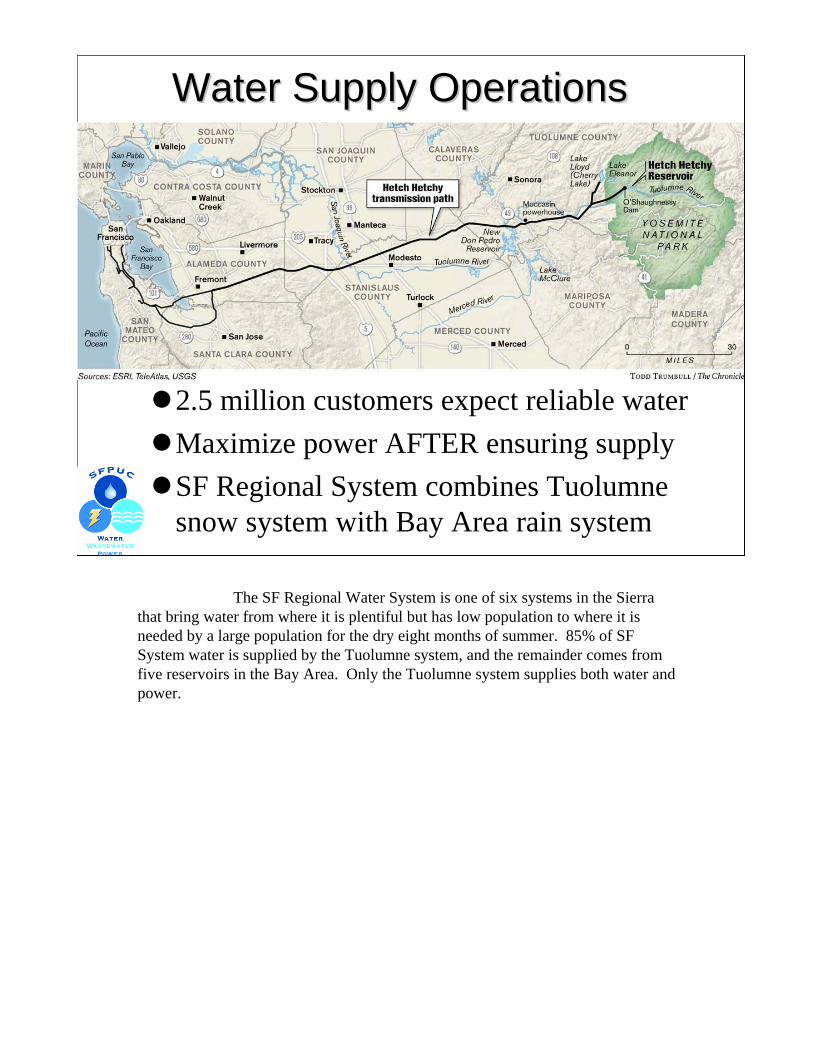
Water Supply OperationsWater Supply Operations
2.5 million customers expect reliable waterMaximize power AFTER ensuring supplySF Regional System combines Tuolumne snow system with Bay Area rain system
The SF Regional Water System is one of six systems in the Sierrathat bring water from where it is plentiful but has low population to where it is needed by a large population for the dry eight months of summer. 85% of SF System water is supplied by the Tuolumne system, and the remainder comes from five reservoirs in the Bay Area. Only the Tuolumne system supplies both water and power.
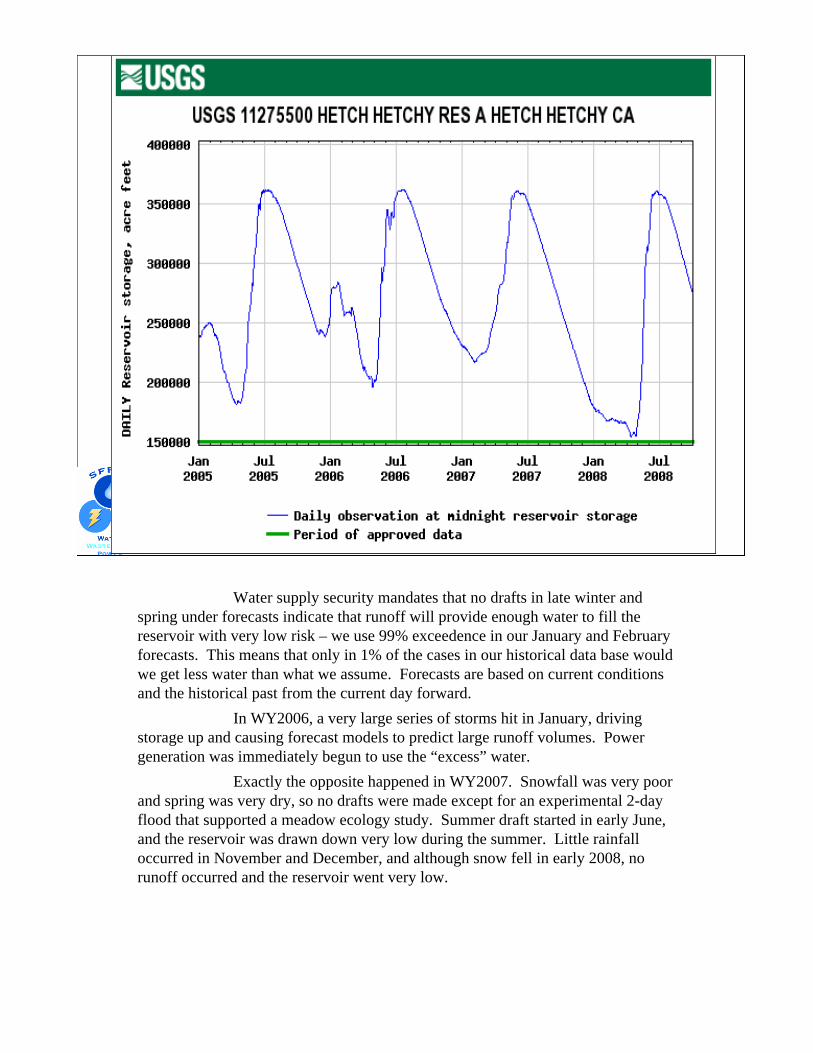
Water supply security mandates that no drafts in late winter andspring under forecasts indicate that runoff will provide enough water to fill the reservoir with very low risk – we use 99% exceedence in our January and February forecasts. This means that only in 1% of the cases in our historical data base would we get less water than what we assume. Forecasts are based on current conditions and the historical past from the current day forward.
In WY2006, a very large series of storms hit in January, drivingstorage up and causing forecast models to predict large runoff volumes. Power generation was immediately begun to use the “excess” water.
Exactly the opposite happened in WY2007. Snowfall was very poorand spring was very dry, so no drafts were made except for an experimental 2-day flood that supported a meadow ecology study. Summer draft started in early June, and the reservoir was drawn down very low during the summer. Little rainfall occurred in November and December, and although snow fell in early 2008, no runoff occurred and the reservoir went very low.
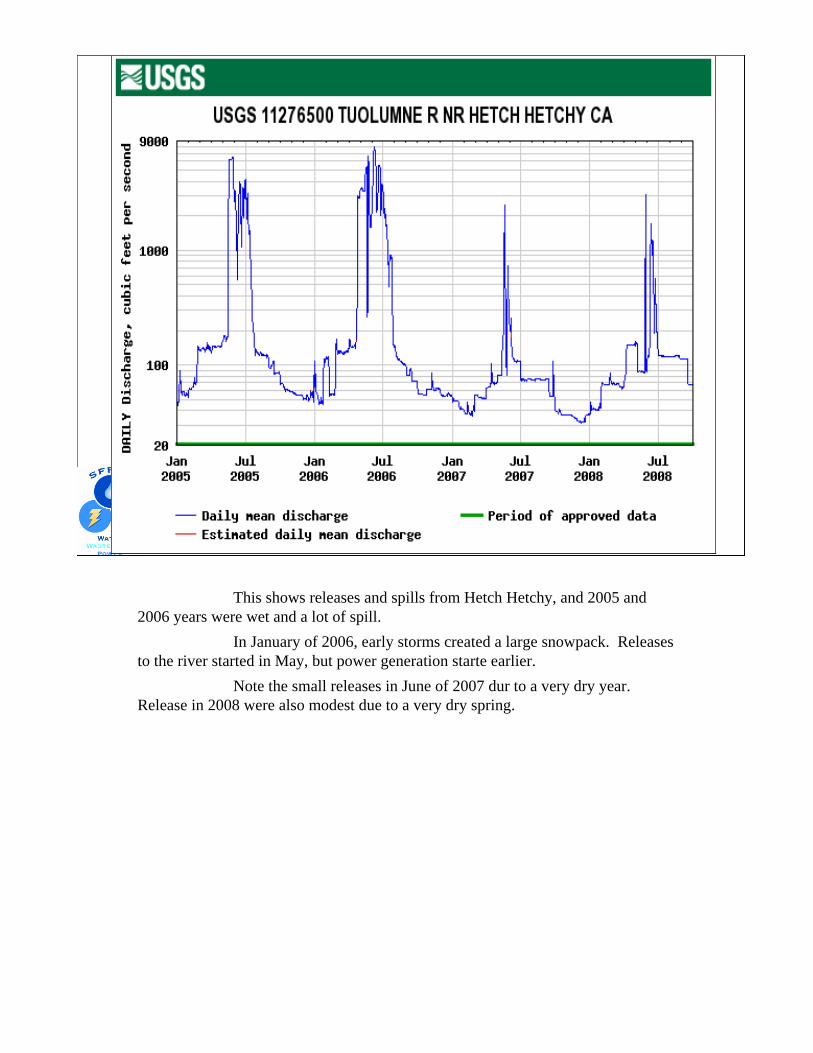
This shows releases and spills from Hetch Hetchy, and 2005 and 2006 years were wet and a lot of spill.
In January of 2006, early storms created a large snowpack. Releases to the river started in May, but power generation starte earlier.
Note the small releases in June of 2007 dur to a very dry year. Release in 2008 were also modest due to a very dry spring.
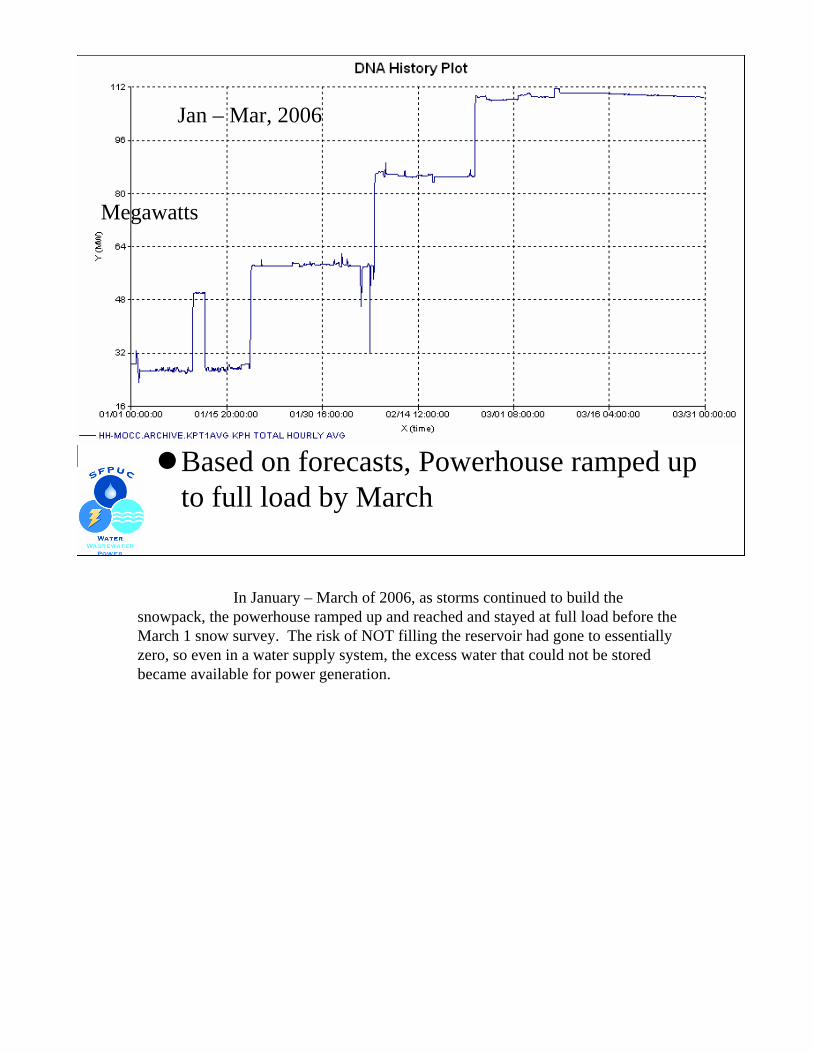
Based on forecasts, Powerhouse ramped up to full load by March
Jan – Mar, 2006
Megawatts
In January – March of 2006, as storms continued to build the snowpack, the powerhouse ramped up and reached and stayed at full load before the March 1 snow survey. The risk of NOT filling the reservoir had gone to essentially zero, so even in a water supply system, the excess water that could not be stored became available for power generation.
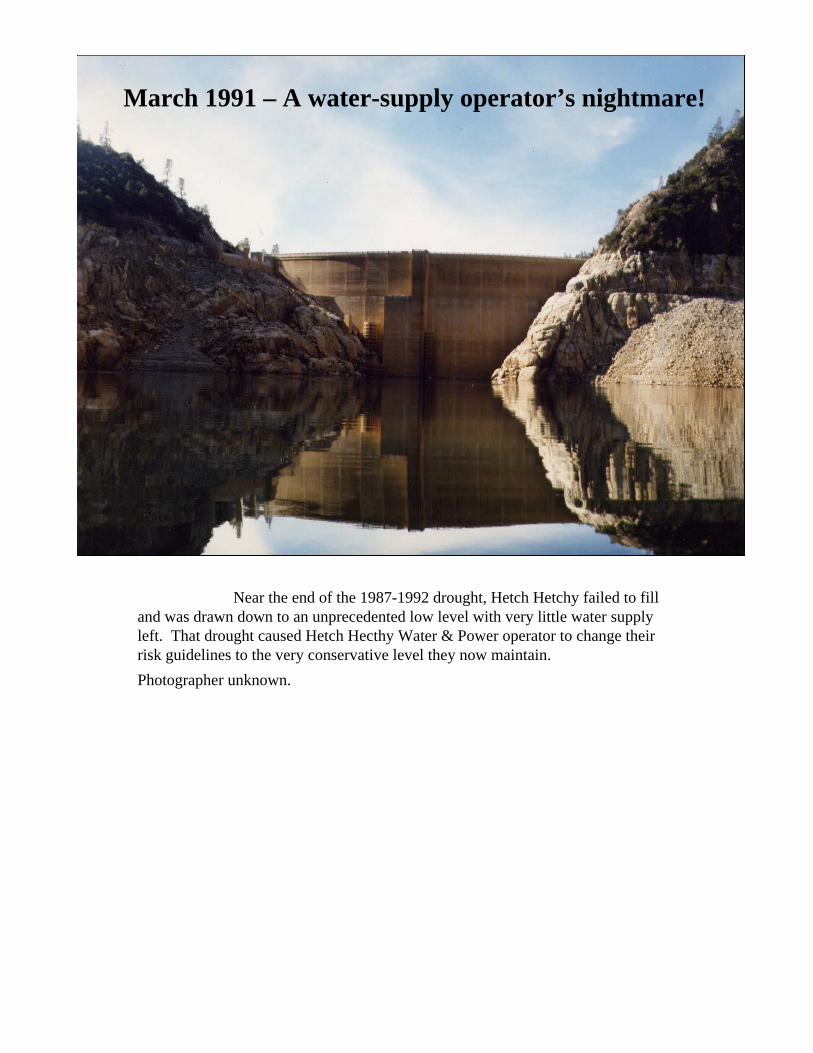
March 1991 – A water-supply operator’s nightmare!
Near the end of the 1987-1992 drought, Hetch Hetchy failed to fill and was drawn down to an unprecedented low level with very little water supply left. That drought caused Hetch Hecthy Water & Power operator to change their risk guidelines to the very conservative level they now maintain.Photographer unknown.
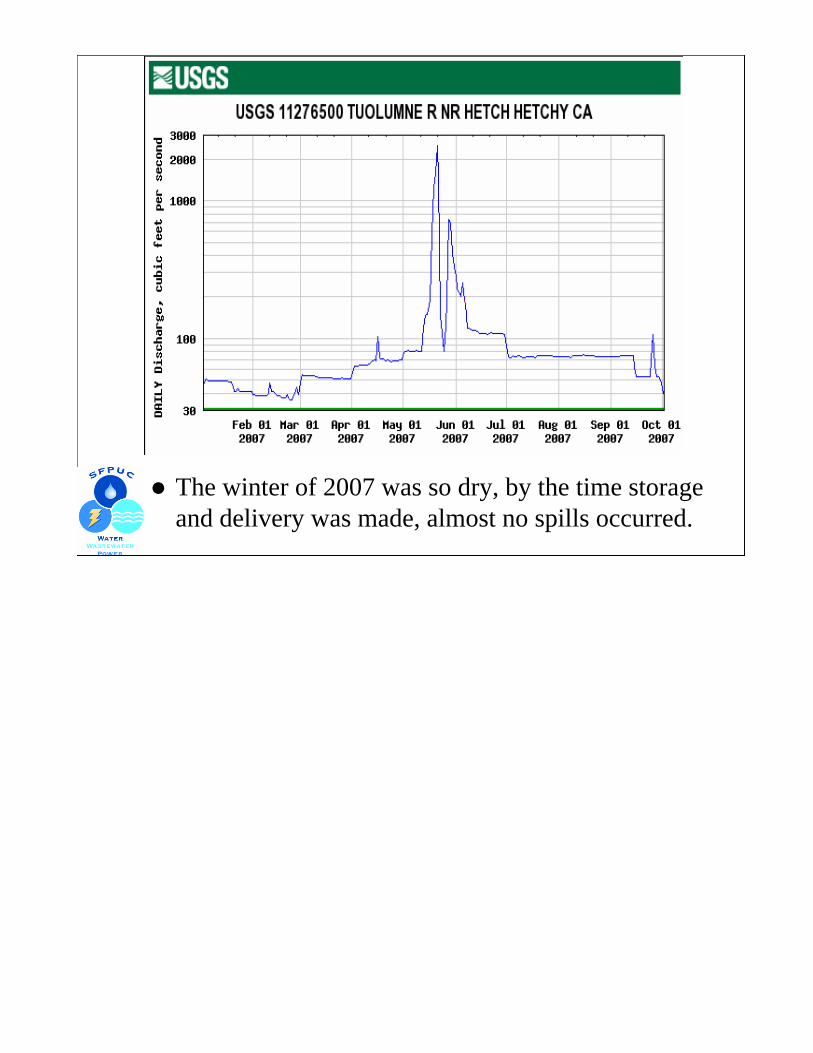
The winter of 2007 was so dry, by the time storage and delivery was made, almost no spills occurred.
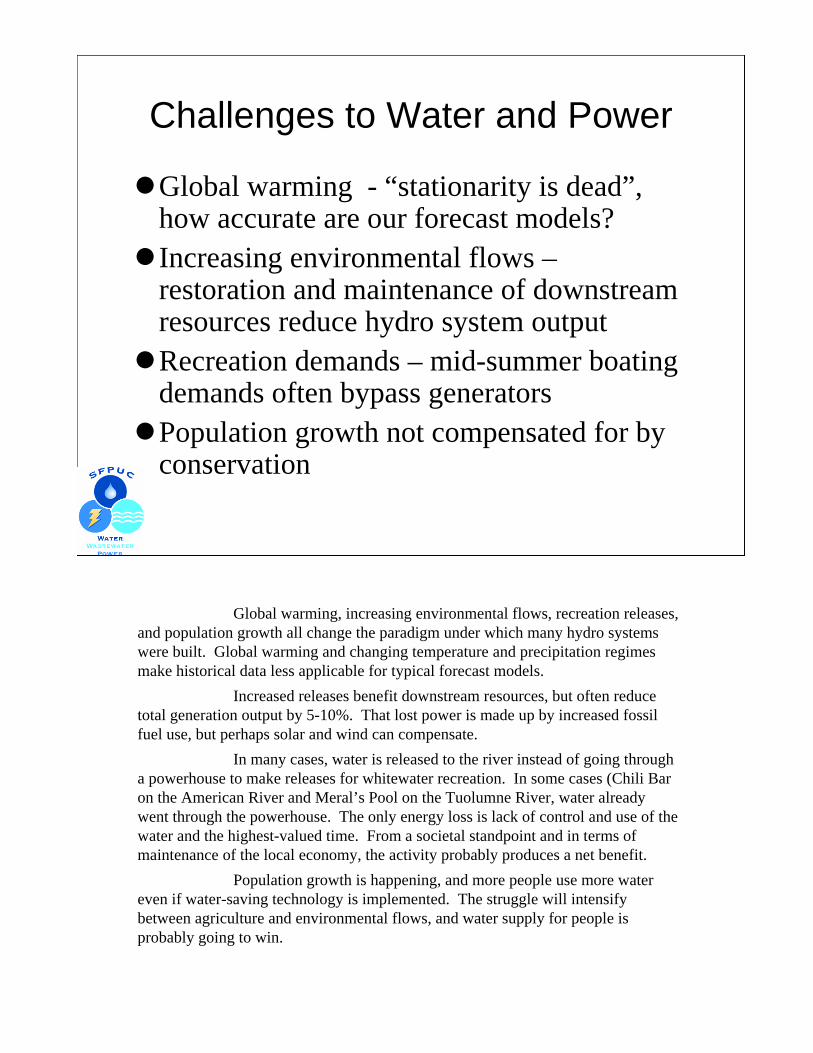
Challenges to Water and Power
Global warming - “stationarity is dead”, how accurate are our forecast models?Increasing environmental flows –restoration and maintenance of downstream resources reduce hydro system outputRecreation demands – mid-summer boating demands often bypass generatorsPopulation growth not compensated for by conservation
Global warming, increasing environmental flows, recreation releases, and population growth all change the paradigm under which many hydro systems were built. Global warming and changing temperature and precipitation regimes make historical data less applicable for typical forecast models.
Increased releases benefit downstream resources, but often reduce total generation output by 5-10%. That lost power is made up by increased fossil fuel use, but perhaps solar and wind can compensate.
In many cases, water is released to the river instead of going through a powerhouse to make releases for whitewater recreation. In some cases (Chili Bar on the American River and Meral’s Pool on the Tuolumne River, water already went through the powerhouse. The only energy loss is lack of control and use of the water and the highest-valued time. From a societal standpoint and in terms of maintenance of the local economy, the activity probably produces a net benefit.
Population growth is happening, and more people use more water even if water-saving technology is implemented. The struggle will intensify between agriculture and environmental flows, and water supply for people is probably going to win.
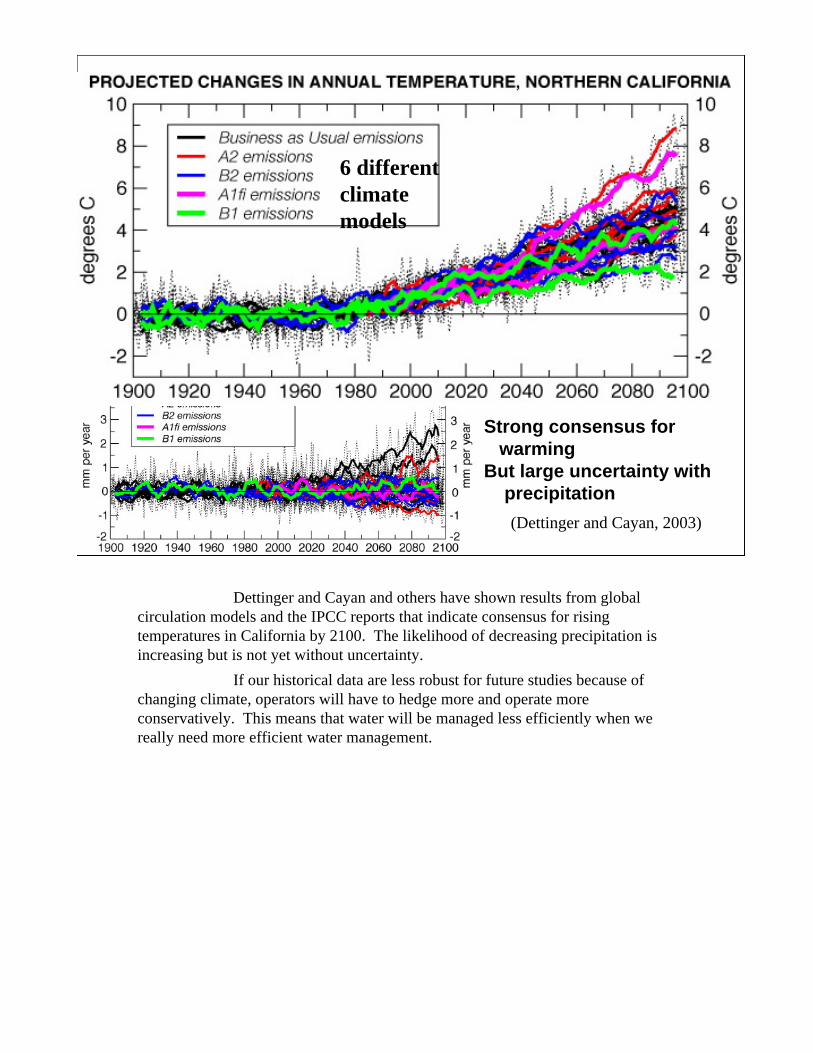
Strong consensus for warming
But large uncertainty withprecipitation
6 differentclimatemodels
(Dettinger and Cayan, 2003)
Dettinger and Cayan and others have shown results from global circulation models and the IPCC reports that indicate consensus for rising temperatures in California by 2100. The likelihood of decreasing precipitation is increasing but is not yet without uncertainty.
If our historical data are less robust for future studies because of changing climate, operators will have to hedge more and operate more conservatively. This means that water will be managed less efficiently when we really need more efficient water management.
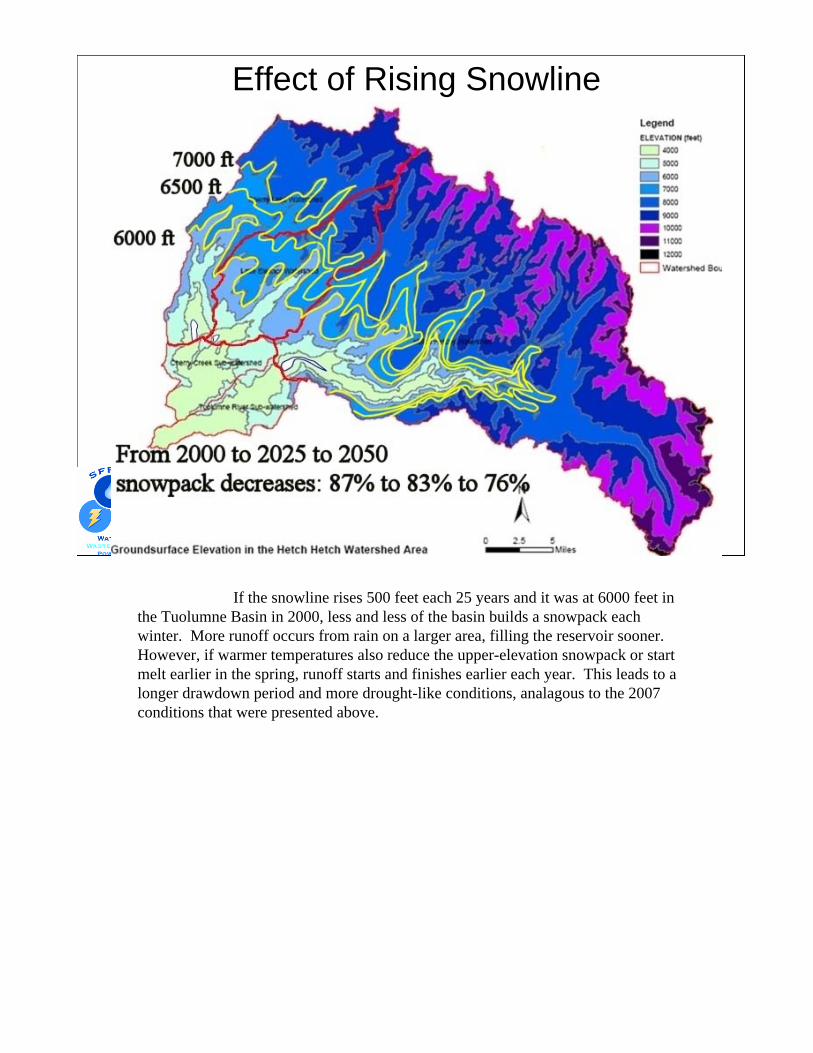
Effect of Rising Snowline
If the snowline rises 500 feet each 25 years and it was at 6000 feet in the Tuolumne Basin in 2000, less and less of the basin builds a snowpack each winter. More runoff occurs from rain on a larger area, filling the reservoir sooner. However, if warmer temperatures also reduce the upper-elevation snowpack or start melt earlier in the spring, runoff starts and finishes earlier each year. This leads to a longer drawdown period and more drought-like conditions, analagous to the 2007 conditions that were presented above.
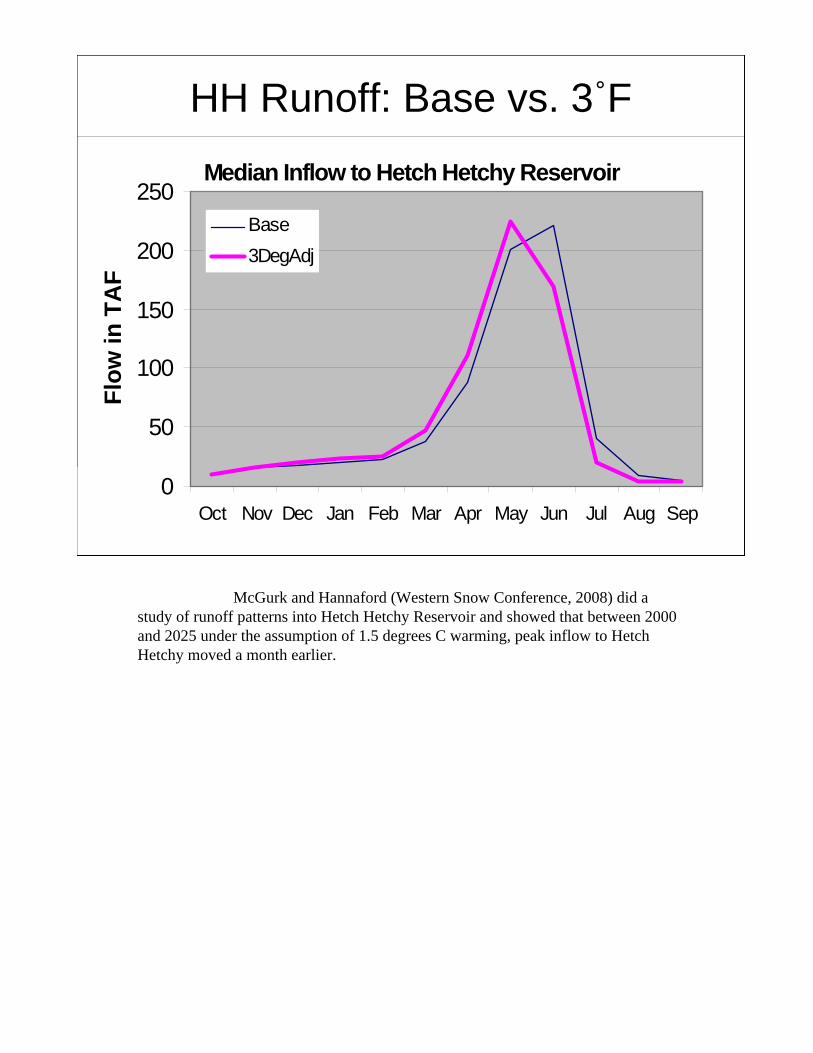
HH Runoff: Base vs. 3˚FMedian Inflow to Hetch Hetchy Reservoir
0
50
100
150
200
250
Oct Nov Dec Jan Feb Mar Apr May Jun Jul Aug Sep
Flow
in T
AF
Base3DegAdj
McGurk and Hannaford (Western Snow Conference, 2008) did a study of runoff patterns into Hetch Hetchy Reservoir and showed that between 2000 and 2025 under the assumption of 1.5 degrees C warming, peak inflow to Hetch Hetchy moved a month earlier.
Thank you!
Acknowledgements:• Adam Mazurkiewicz, HHWP• Michael Tsang, HHWP
Inflow into Hetch Hetchy Reservoir, a recent gage installation and available at:http://cdec.water.ca.gov/cgi-progs/queryF?s=TGCPhoto by B.McGurkThe author wishes to gratefully acknowledge the forecasting and graphical products produced by Adam Mazurkiewicz and Michael Tsang, HHWP Water and Power Planning staff.