risks and spillovers: use of national balance sheet data · why national balance sheets matter?...
TRANSCRIPT
BOPCOM—14/10
Twenty-Seventh Meeting of the
IMF Committee on Balance of Payments Statistics
Washington, D.C.
October 27–29, 2014
Risks and Spillovers: Use of National Balance Sheet Data
Prepared by the Strategy, Policy, and Review Department
International Monetary Fund

R. SEAN CRAIG
Survei l lance Policy Divis ion Strategy, Policy and Review Department
Presentation to the IMF Committee on
BOP Statist ics
Risks and Spillovers: Use of National Balance Sheet Data
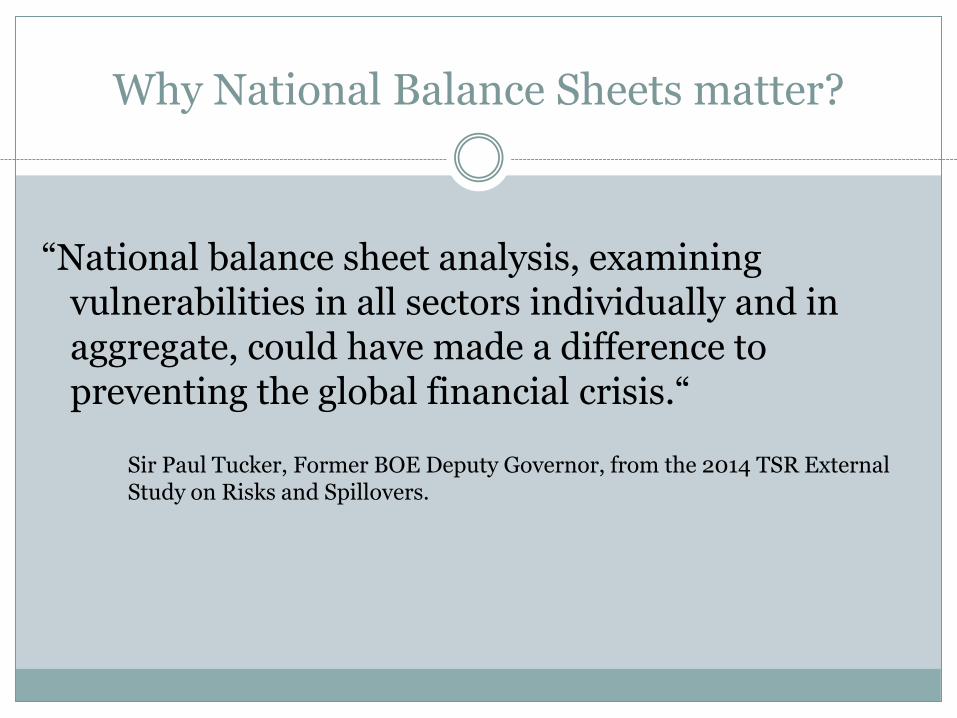
Why National Balance Sheets matter?
“National balance sheet analysis, examining vulnerabilities in all sectors individually and in aggregate, could have made a difference to preventing the global financial crisis.“
Sir Paul Tucker, Former BOE Deputy Governor, from the 2014 TSR External Study on Risks and Spillovers.
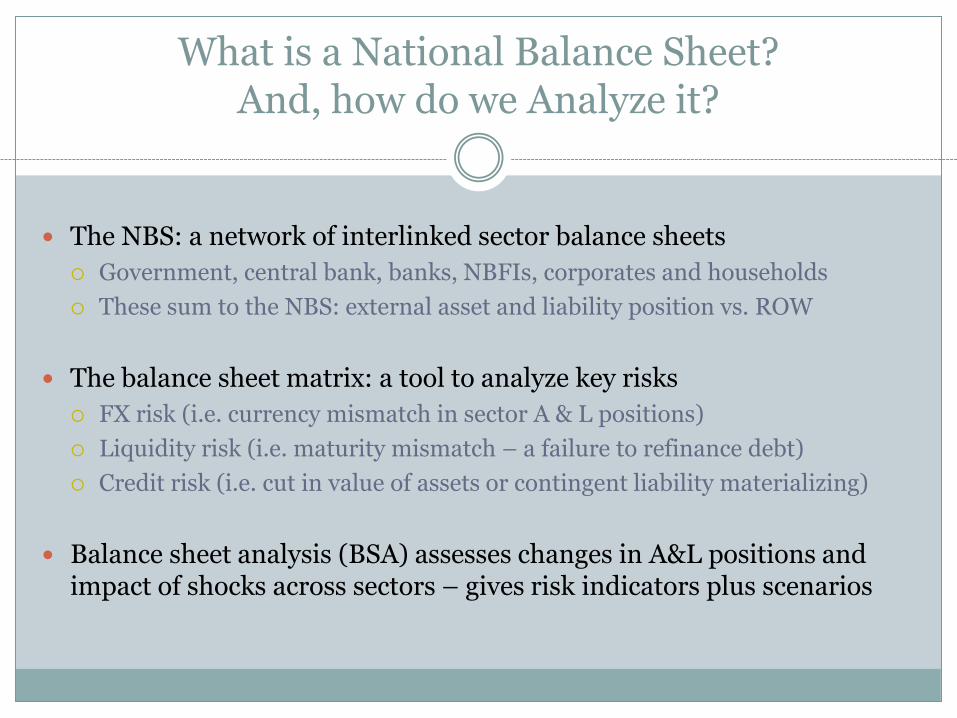
What is a National Balance Sheet? And, how do we Analyze it?
The NBS: a network of interlinked sector balance sheets
Government, central bank, banks, NBFIs, corporates and households
These sum to the NBS: external asset and liability position vs. ROW
The balance sheet matrix: a tool to analyze key risks
FX risk (i.e. currency mismatch in sector A & L positions)
Liquidity risk (i.e. maturity mismatch – a failure to refinance debt)
Credit risk (i.e. cut in value of assets or contingent liability materializing)
Balance sheet analysis (BSA) assesses changes in A&L positions and impact of shocks across sectors – gives risk indicators plus scenarios
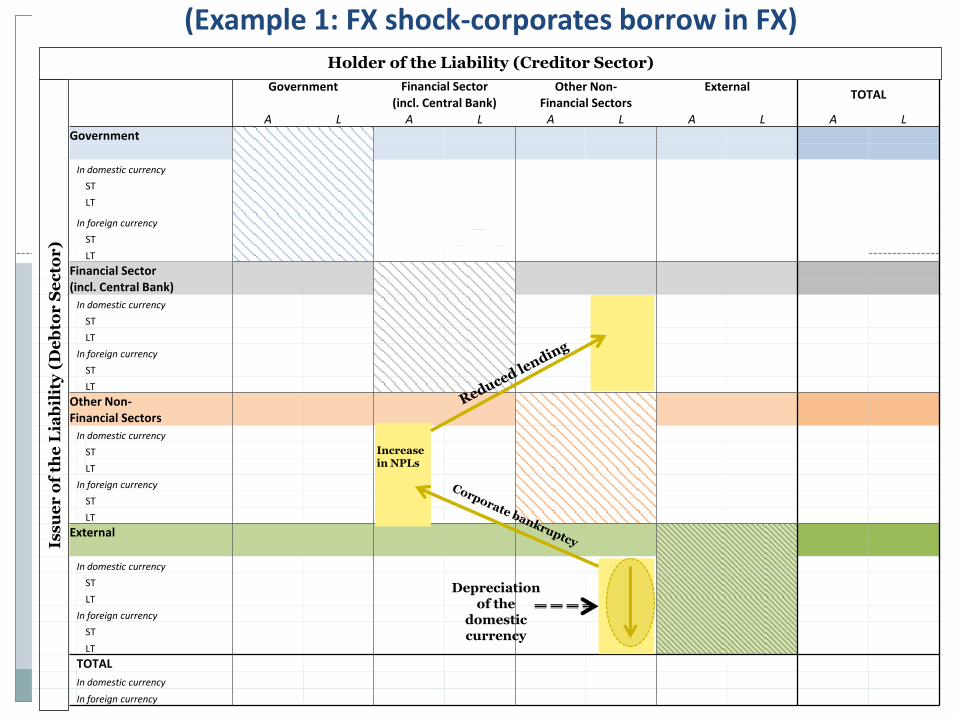
(Example 1: FX shock-corporates borrow in FX)
Government Financial Sector Other Non- External
TOTAL
(incl. Central Bank) Financial Sectors
A L A L A L A L A L
Government
In domestic currency
ST
LT
In foreign currency
ST
LT
Financial Sector
(incl. Central Bank)
In domestic currency
ST
LT
In foreign currency
ST
LT
Other Non-
Financial Sectors
In domestic currency
ST
LT
In foreign currency
ST
LT
External
In domestic currency
ST
LT
In foreign currency
ST
LT
TOTAL
In domestic currency
In foreign currency
Iss
ue
r o
f th
e L
iab
ilit
y (
De
bto
r S
ec
tor
) Holder of the Liability (Creditor Sector)
Increase in NPLs
Depreciation of the
domestic currency
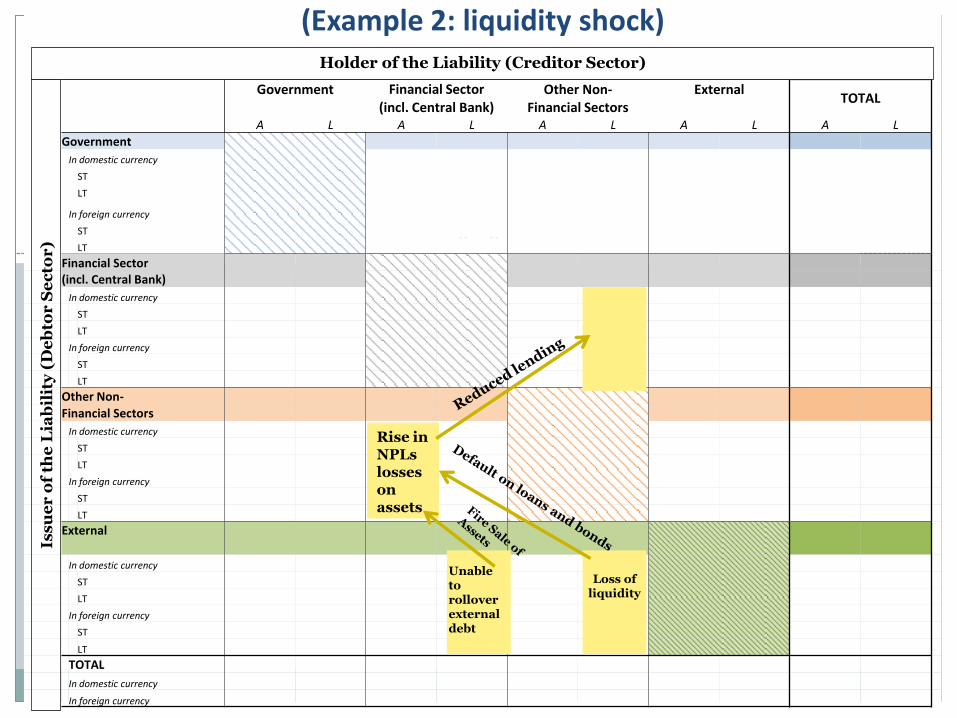
(Example 2: liquidity shock)
Government Financial Sector Other Non- External
TOTAL
(incl. Central Bank) Financial Sectors
A L A L A L A L A L
Government
In domestic currency
ST
LT
In foreign currency
ST
LT
Financial Sector
(incl. Central Bank)
In domestic currency
ST
LT
In foreign currency
ST
LT
Other Non-
Financial Sectors
In domestic currency
ST
LT
In foreign currency
ST
LT
External
In domestic currency
ST
LT
In foreign currency
ST
LT
TOTAL
In domestic currency
In foreign currency
Iss
ue
r o
f th
e L
iab
ilit
y (
De
bto
r S
ec
tor
) Holder of the Liability (Creditor Sector)
Unable to rollover external debt
Loss of liquidity
Rise in NPLs losses on assets

(Example 3: contingent liabilities materialize)
Government Financial Sector Other Non- External
TOTAL
(incl. Central Bank) Financial Sectors
A L A L A L A L A L
Government
In domestic currency
ST
LT
In foreign currency
ST
LT
Financial Sector
(incl. Central Bank)
In domestic currency
ST
LT
In foreign currency
ST
LT
Other Non-
Financial Sectors
In domestic currency
ST
LT
In foreign currency
ST
LT
External
In domestic currency
ST
LT
In foreign currency
ST
LT
TOTAL
In domestic currency
In foreign currency
Iss
ue
r o
f th
e L
iab
ilit
y (
De
bto
r S
ec
tor
) Holder of the Liability (Creditor Sector)
Reduced lending
Rise in interest rates
Banks' exposure to sovereign
Feedback loop to
government
Rise in debt from
contingent liability
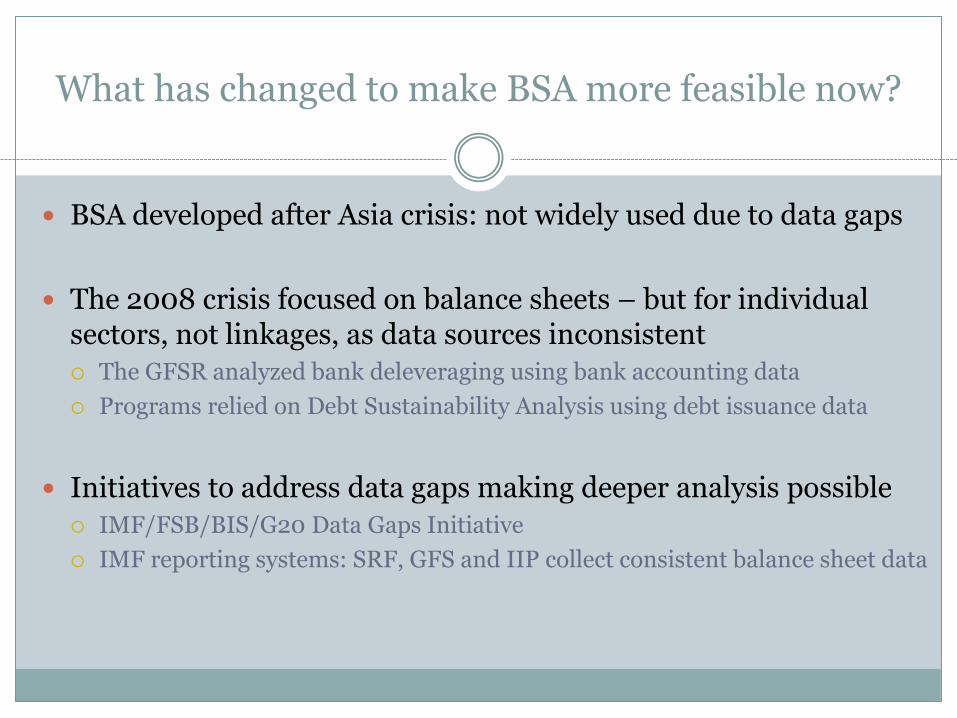
What has changed to make BSA more feasible now?
BSA developed after Asia crisis: not widely used due to data gaps
The 2008 crisis focused on balance sheets – but for individual sectors, not linkages, as data sources inconsistent
The GFSR analyzed bank deleveraging using bank accounting data
Programs relied on Debt Sustainability Analysis using debt issuance data
Initiatives to address data gaps making deeper analysis possible
IMF/FSB/BIS/G20 Data Gaps Initiative
IMF reporting systems: SRF, GFS and IIP collect consistent balance sheet data

How will the BSA be integrated into IMF surveillance?
Triennial Surveillance Review mainstreams BSA: Deepening analysis of risks and spillovers
More tailored and expert policy advice for countries
Improving policy cooperation and evenhandedness
TSR proposes reviving and adapting BSA Desks monitor balance sheet vulnerability indicators (FX mismatch)
Trace domestic or external shocks across sectors in BSA matrix
Strategy: develop easy to use tools – the BSA matrix Start with basic sector disaggregation possible with IMF data and expand
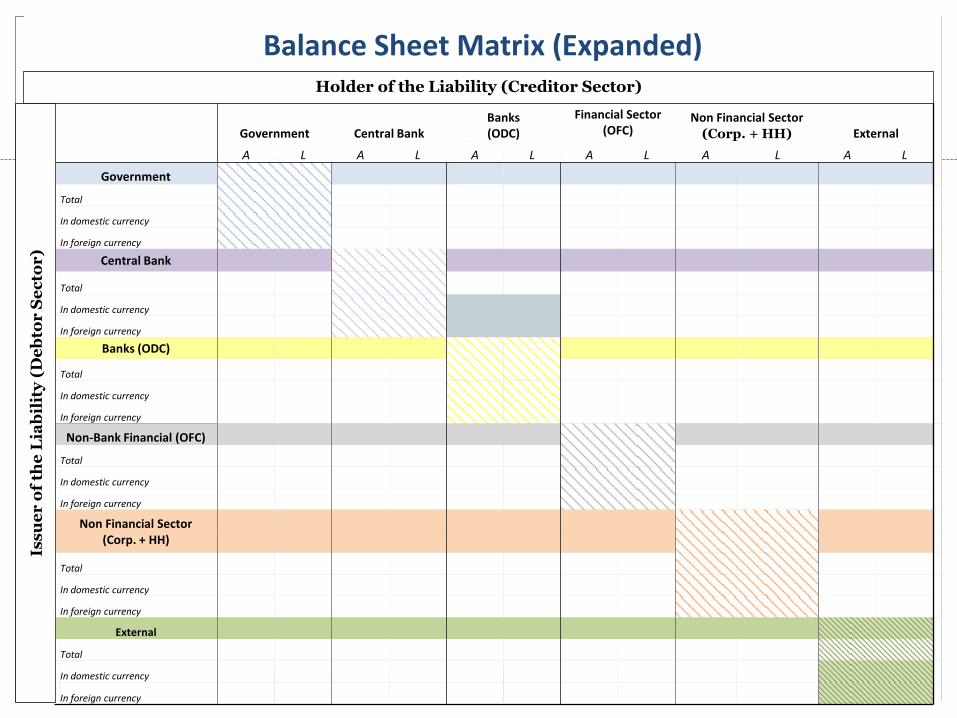
Balance Sheet Matrix (Expanded) d
Government Central Bank
Banks (ODC)
Financial Sector (OFC)
Non Financial Sector (Corp. + HH) External
A L A L A L A L A L A L
Government
Total
In domestic currency
In foreign currency
Central Bank
Total
In domestic currency
In foreign currency
Banks (ODC)
Total
In domestic currency
In foreign currency
Non-Bank Financial (OFC)
Total
In domestic currency
In foreign currency
Non Financial Sector
(Corp. + HH)
Total
In domestic currency
In foreign currency
External
Total
In domestic currency
In foreign currency
Holder of the Liability (Creditor Sector)
Iss
ue
r o
f th
e L
iab
ilit
y (
De
bto
r S
ec
tor
)

To what extent is BSA possible with available data?
Matrix constructed with balance sheet data from three IMF reporting systems
SRF form: balance sheet data for banks, OFC, central banks
GFS form: government balance sheet data
IIP form: external asset and liabilities
Each defines bilateral balance sheet linkage to other sectors
Corporate and household data not collected
Accounting identity allows these data to be estimated using IMF data
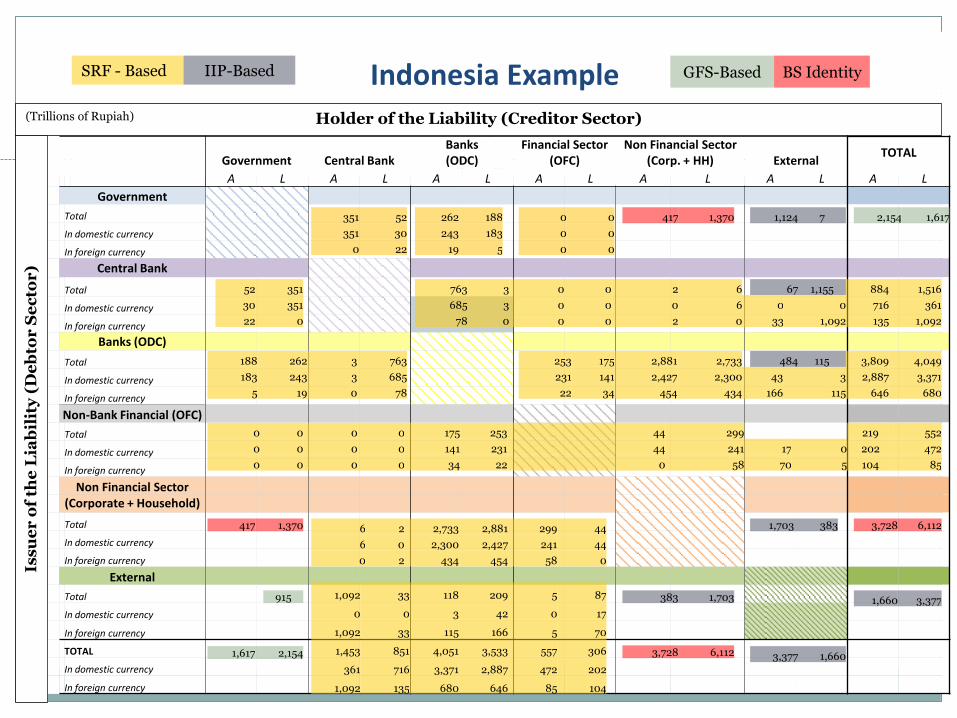
Indonesia Example
Government Central Bank
Banks (ODC)
Financial Sector (OFC)
Non Financial Sector (Corp. + HH) External
TOTAL
A L A L A L A L A L A L A L
Government
Total
In domestic currency
In foreign currency
Central Bank
Total
In domestic currency
In foreign currency
Banks (ODC)
Total
In domestic currency
In foreign currency
Non-Bank Financial (OFC)
Total
In domestic currency
In foreign currency
Non Financial Sector
(Corporate + Household)
Total
In domestic currency
In foreign currency
External
Total
In domestic currency
In foreign currency
TOTAL
In domestic currency
In foreign currency
Holder of the Liability (Creditor Sector)
Iss
ue
r o
f th
e L
iab
ilit
y (
De
bto
r S
ec
tor
)
351 52
351 30
0 22
262 188
243 183
19 5
0 0
0 0
0 0
52 351
30 351
22 0
763 3 0 0 2 6 884 1,516
685 3 0 0 0 6 0 0 716 361
78 0 0 0 2 0 33 1,092 135 1,092
188 262 3 763
183 243 3 685
5 19 0 78
253 175 2,881 2,733 3,809 4,049
231 141 2,427 2,300 43 3 2,887 3,371
22 34 454 434 166 115 646 680
0 0 0 0 175 253 44 299 219 552
0 0 0 0 141 231 44 241 17 0 202 472
0 0 0 0 34 22 0 58 70 5 104 85
6 2 2,733 2,881 299 44
6 0 2,300 2,427 241 44
0 2 434 454 58 0
1,092 33 118 209 5 87
0 0 3 42 0 17
1,092 33 115 166 5 70
1,453 851 4,051 3,533 557 306
361 716 3,371 2,887 472 202
1,092 135 680 646 85 104
SRF - Based
1,124 7
67 1,155
484 115
1,703 383
383 1,703 1,660 3,377
3,377 1,660
2,154 1,617
915
1,617 2,154
GFS-Based
417 1,370
417 1,370 3,728 6,112
3,728 6,112
BS Identity IIP-Based
(Trillions of Rupiah)
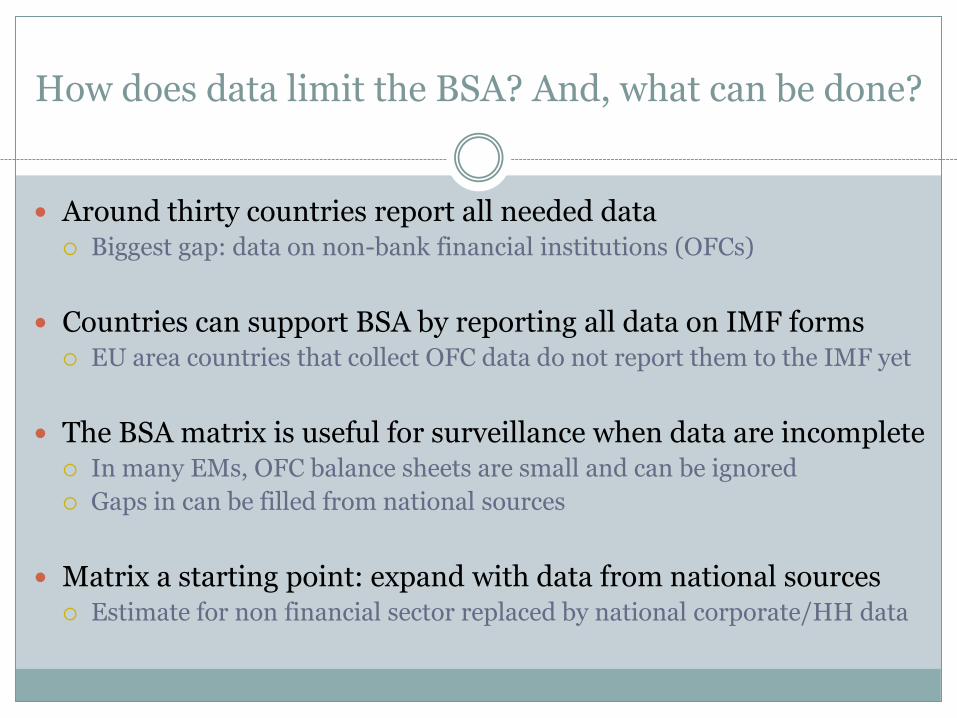
How does data limit the BSA? And, what can be done?
Around thirty countries report all needed data Biggest gap: data on non-bank financial institutions (OFCs)
Countries can support BSA by reporting all data on IMF forms EU area countries that collect OFC data do not report them to the IMF yet
The BSA matrix is useful for surveillance when data are incomplete In many EMs, OFC balance sheets are small and can be ignored
Gaps in can be filled from national sources
Matrix a starting point: expand with data from national sources Estimate for non financial sector replaced by national corporate/HH data

Balance Sheet Matrix (with Corporate and Households separated)
Government Central Bank Banks (ODC)
Other Financial Corporation (OFC) Corporate Sector Household Sector External
A L A L A L A L A L A L A L
Government
Total
In domestic currency
In foreign currency
Central Bank
Total
In domestic currency
In foreign currency
Banks (ODC)
Total
In domestic currency
In foreign currency
Non-Bank Financial (OFC)
Total
In domestic currency
In foreign currency
Non Financial Sector
(Corp.)
Total
In domestic currency
In foreign currency
Non Financial Sector
(HH)
Total
In domestic currency
In foreign currency
External
Total
In domestic currency
In foreign currency
Holder of the Liability (Creditor Sector)
Iss
ue
r o
f th
e L
iab
ilit
y (
De
bto
r S
ec
tor
)

What challenges face users and compilers?
To use BSA to identify balance sheets risks and conduct scenarios a new, easy-to-use tool – the BSA Matrix – needs to be developed
Data has improved to where BSA feasible but data gaps still limit analysis: there should be no let up in efforts to fill them

The future: A Global Flow-of-Funds analysis
TSR: GFF matrix would show spillover channels between NBS
The IMF, Fed, BOE, BOJ and ECB constructed a GFF matrix A proof-of-concept only: data needed for full matrix made it impractical
Construct partial GFF matrix to analyze financial spillovers IIP, BIS IBS and CPIS data give cross country bilateral financial linkages
Example: GFF matrix mapping shocks between country sectors
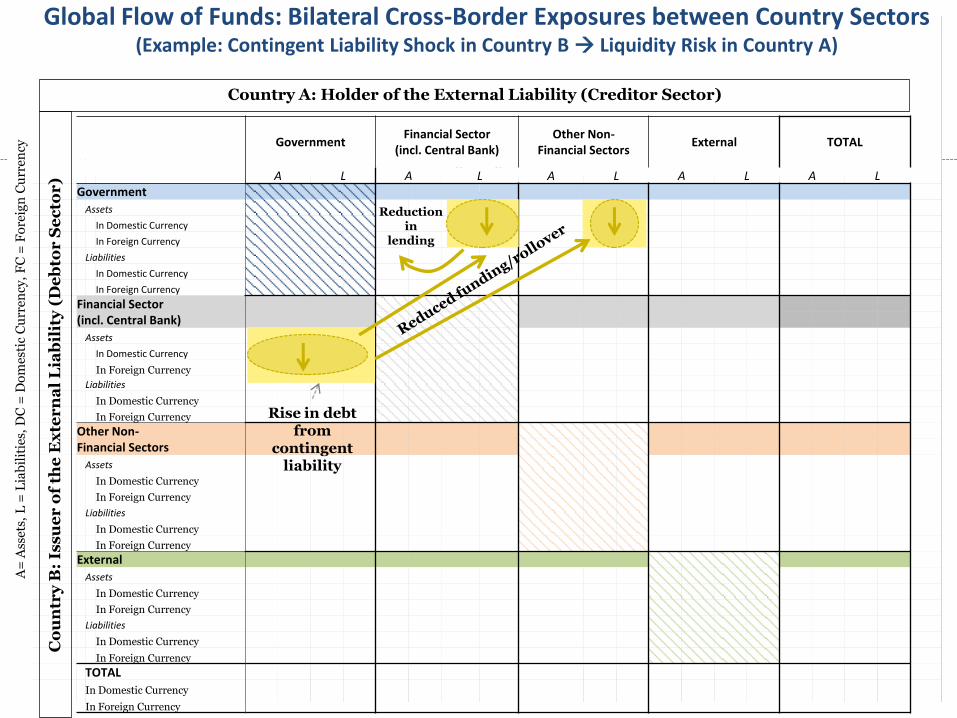
Global Flow of Funds: Bilateral Cross-Border Exposures between Country Sectors (Example: Contingent Liability Shock in Country B Liquidity Risk in Country A)
Government Financial Sector
(incl. Central Bank) Other Non-
Financial Sectors External TOTAL
A L A L A L A L A L
Government
Assets
In Domestic Currency
In Foreign Currency
Liabilities
In Domestic Currency
In Foreign Currency
Financial Sector
(incl. Central Bank)
Assets
In Domestic Currency
In Foreign Currency
Liabilities
In Domestic Currency
In Foreign Currency
Other Non-
Financial Sectors
Assets
In Domestic Currency
In Foreign Currency
Liabilities
In Domestic Currency
In Foreign Currency
External
Assets
In Domestic Currency
In Foreign Currency
Liabilities
In Domestic Currency
In Foreign Currency
TOTAL
In Domestic Currency
In Foreign Currency
Co
un
try
B:
Iss
ue
r o
f th
e E
xte
rn
al
Lia
bil
ity
(D
eb
tor
Se
cto
r)
Country A: Holder of the External Liability (Creditor Sector)
A=
Ass
ets,
L =
Lia
bil
itie
s, D
C =
Do
mes
tic
Cu
rren
cy,
FC
= F
ore
ign
Cu
rren
cy
Rise in debt from
contingent liability
Reduction in
lending