rmx report greater mumbai region
TRANSCRIPT

RMC Study
HOLTEC CONSULTINGJune 2007
Greater Mumbai
Plant Location ClustersLegendWadala
Nerul
Mahape
GhodbanderRoad
Deonar
Dahisar

07101
i
INDEX CHAPTER SECTION TOPIC PAGE NUMBER
SITUATION ANALYSIS 1.1 – 1.30 1 Preamble 1.1 2 The Business 1.2
2.1 RMC Industry Structure 1.2 2.2 Product Life Cycle 1.4 3 The Markets 1.6
3.1 Total Market Size - Concrete 1.6 3.2 Total Market Size - RMC 1.6 3.3 RMC Product Mix and Prices 1.7
3.4 Customer Segmentation and Market Share 1.8
3.5 RMC vs Batching Plant in Greater Mumbai 1.10
3.6 RMC - Facilitating and Hindering Factors 1.11
3.7 Zone-wise Acceptance of RMC 1.12 4 The Players 1.13
4.1 Overview 1.13 4.2 Zones Serviced by Location Clusters 1.14 4.3 Categories of RMC players 1.16
4.4 Practices followed by local RMC players 1.17
4.5 Estimated Cost of Production – Reputed players and Local players 1.17
4.6 Raw Material, Sources and Delivered Cost 1.19
4.7 Types of Cement used 1.19 5 Outlook for the future 1.19
5.1 Demand 1.19
5.1.1 Salient features of proposed Master Plan for Greater Mumbai 1.19
5.1.2 Future Scenario 1.21
1
5.1.3 Concrete Consumption – Zone wise and Segment wise 1.22

07101
ii
CHAPTER SECTION TOPIC PAGE NUMBER
5.1.4 Envisaged Product Life Cycle and Market Share of RMC Players 1.23
5.1.5 Share of RMC - Revisited 1.27 5.2 Supply 1.28
5.2.1 Professionalism in the RMC Industry 1.28 5.2.2 New RMC Plants 1.28 5.2.3 Supply Scenario by FY 2008 1.29
5.2.4 Demand Vs Supply – FY 2012 1.30 STRATEGIC IMPLICATIONS 2.1 – 2.4
1 Preamble 2.1 2 Opportunities and Threats 2.1 3 Key Success Factors 2.1 4 Changing User Segments 2.2 5 Change in Product Mix 2.3 6 Input Material Requirements 2.3
2
7 Conclusion 2.4 3 ZONAL MARKET PROFILES 3.1 – 3.14 4 PLANT PROFILES 4.1 – 4.74
5 Annexure 1 METHODOLOGY TO ESTIMATE CONCRETE DEMAND A1.1 – A1.2
6 Annexure 2 SOME MAJOR PROJECTS IN GREATER MUMBAI A2.1 – A 2.5
7 Annexure 3 FUTURE CEMENT AND CONCRETE DEMAND IN GREATER MUMBAI A3.1

07101 1.1
CHAPTER 1: SITUATION ANALYSIS 1. PREAMBLE: The objective of this study is to gain transparency of the Ready Mix Concrete (RMC) scenario in the Greater Mumbai region, forecast future trends and thereby establish a base for consequent strategy development. Greater Mumbai has been divided into 3 market zones, viz., Mumbai City, Thane and Navi Mumbai. These zones are depicted in Chart 1.1.
Chart 1.1: Greater Mumbai Zones
RMC is defined as ready-mix concrete plants set-up by private parties for sale of concrete to other users; where as, batching plants are defined as concrete production units set-up by “building contractors/ construction companies”, primarily for captive consumption. Data for this study has been collected from RMC players, contractors, large construction companies, architects, end-users (like, individual house builders), raw material suppliers, government bodies, etc.
Mumbai City
Navi Mumbai
Thane

07101 1.2
This chapter presents the situation analysis of this study. While Chapter 2 discusses strategic implications, Chapters 3 and 4 are dedicated to zonal market profiles and player profiles, respectively. Annexure 1 describes the methodology adopted to derive the demand for concrete. Annexure 2 details some major projects in Greater Mumbai Region. Annexure 3 gives the estimated forecast of cement and concrete demand. 2. THE BUSINESS 2.1 RMC INDUSTRY STRUCTURE The RMC industry is analysed using Porter’s five forces model.
Rivalry among existing competitors Rivalry among existing competitors in Greater Mumbai is high. There are two categories of RMC players in the Greater Mumbai Region. Reputed players like ACC, L&T, UltraTech Ready Mix and RMC India, represent the first type and local players, the other. In the last 4 years, the number of RMC plants has increased from 13 to 37. Bargaining power of buyers RMC buyers can be classified in 3 distinct segments:
Individual House Builders
Institutional Builders (Housing and Commercial Complex Contractors/ Construction Companies and Factories/ Industrial units)
Infrastructure related Construction Companies.
Bargaining power of suppliers
Threat of new entrants
Threat of substitute products
Rivalry among existing competitors
Bargaining power of buyers

07101 1.3
Individual House Builders primarily use on-site-mixed concrete (OMC). Institutional Builders are generally found to be the largest users of RMC. Infrastructure related construction companies mostly have their own batching plants and use RMC on a need basis, i.e., they buy RMC when they are unable to produce enough concrete in-house. RMC users, in Greater Mumbai have low-medium brand loyalty, however are in a position to dictate prices, as switching-costs are virtually non-existent. This, along with presence of price undercutting by local players, has led to the buyers having substantial power in influencing the RMC prices in this region. Bargaining power of suppliers The most important cost component in RMC is the price of cement. On account of high demand - low supply conditions, cement retail prices have increased from around Rs 160 - 170/- bag in FY 2003 to around Rs 255 - 265/- bag in FY 2007. Cement prices have increased across all customer-segments and markets, due to low supply – high demand pressure. In other words, cement companies have increased prices not only for RMC producers, but also for all cement users. While the bargaining power of cement is high, the bargaining power of other raw material suppliers (such as sand, aggregates etc.) is relatively low on account of abundant availability. Almost all RMC players are using hired transit mixers and pumps, in addition to their own. Thus, their dependence on the hire sources is relatively high. It is therefore seen that the bargaining power of such transit mixer and pump sources is rather high, a fact manifested by progressively increasing rental values. Threat of substitutes Concrete, as a product, has no known substitutes. However, concrete made by batching plants and on-site-mix can, for all practical purposes, be considered as substitutes for RMC. Threat of new entrants Entry cost into the RMC industry is rather low-medium. With availability of land (in Navi Mumbai and Thane) for putting up a RMC unit on lease and transit mixers & pump on hire, the initial investment cost is rather low. However, in Mumbai City, land availability at a reasonable lease rate is a major constraint in recent times, and thus the low financial returns discourages players from setting up of a new RMC plant in this zone. According local regulations, batching plants are only allowed to be set up for meeting the concrete requirements of a specific infrastructure project and need to be disbanded as soon as the project is completed. RMC plants in Greater Mumbai are located in all the zones. Over the last 4 years, RMC plants have increased almost three-fold and are expected to increase even further. Given the initial low investment cost and gestation period (3-4 months), the threat of new entrants is consequently rather high. Conclusion Structural analysis of the RMC industry indicates buyer-dominated price-sensitivity, high dependence on cement sources, easy availability of substitutes and a high threat of new entrants. All this is manifested in an EBIDTA margin of around 10-11 %. Given these

07101 1.4
margins and the market characteristics, the RMC business in the target markets, appears to be in a growth phase. 2.2 PRODUCT LIFE CYCLE The Product Life Cycle (PLC) of the RMC market is examined in this section. All the zones are plotted on a PLC curve for inter-zone comparison. There are four distinct stages of this curve. These are:
Entry Stage: This is the stage when a product is introduced to the market. Sales growth is low. Profits are nearly non-existent in this stage.
Growth Stage: In this stage a rapid growth takes place due to market acceptance. Profits show a gradual improvement.
Saturation Stage: This is a period of slowdown in sales growth because the product has achieved acceptance by most potential buyers. Profits, generally, stabilize at this stage.
Decline Stage: In this stage, sales show a down drift.
Chart 1.2: Zone wise RMC Product Life Cycle
RMC as a percentage of total concrete is seen to be the highest in Mumbai City. Navi Mumbai is the second highest in terms of RMC percentage of total concrete, followed by Thane which is the lowest in terms of RMC percentage of total concrete. RMC penetration in Navi Mumbai and Thane are at the take-off stage. Monthly estimates of zone-wise Concrete demand and RMC supply for FY 2007 is given in Table 1.1. The estimated RMC supply is based on information gathered from RMC plants.
FY 2007
RM
C a
s pe
rcen
tage
of C
oncr
ete
GROWTH STAGE ENTRY
STAGE
SATURATION STAGE
DECLINE STAGE
Navi Mumbai
Mumbai City
Thane

07101 1.5
Zone Estimated Concrete
Requirement per month (cu m)
Estimated RMC Supply per month
(cu m)
Share of RMC in Total Concrete
Requirement (%) Mumbai City 391,945 121,750 31 Navi Mumbai 352,690 33,225 9 Thane 169,390 11,600 7 TOTAL 914,025 166,575 18
Table 1.1: Estimated Zone wise Concrete requirement and RMC supply – FY 2007 Mumbai City displays a higher RMC %, not only on account of the type and volume of new construction but also the proximity of RMC sources. The dependence on RMC for concreting is highest (compared to other zones) due space constraint for setting up batching plants and material storages. Mumbai City is witnessing high construction growth in terms of infrastructure and residential projects. Construction of flyovers and concreting & widening of roads is under way to decongest the current high traffic congestion. There are around 30 old textile mills in this zone, which have been acquired by almost every big builder and developer of Mumbai. These mills are now being converted to high-rise residential buildings after demolishing the existing old buildings. Majority of the RMC plants are located in this zone and the demand for concrete in this zone is very high. The zone also has the highest RMC consumption. Navi Mumbai displays second highest RMC %. Currently in this zone, intense construction activity is limited to northern part of the zone, areas such as Nerul, Vashi, Khargarh, etc. This zone is witnessing infrastructure development along with residential and commercial projects. Major builders & developers have already started working on acquiring land for their housing projects. Most of the projects under construction in this zone have their own batching plants, specifically infrastructure projects. Navi Mumbai has the second highest number of plants, after Mumbai City,. This zone has tremendous potential in the coming years due to boom in construction of mega projects such as SEZ, international airport, mass housing plan, etc. Thane displays the lowest RMC % among all the zones. This zone is witnessing construction growth particularly of residential projects as most of the builders and developers have now shifted focus from Mumbai City towards Thane. Moreover, availability of land for construction of new projects is not a constraint in this zone, which presents a very good opportunity for construction growth. RMC consumption in this zone is the lowest as compared to the other two zones. One of the reasons could be that there are only three RMC plants in this zone, out of which two are partly dedicated for their own consumption. Almost all the zones have seen rapid construction in the recent years. Large-scale housing and commercial complexes have mushroomed, property prices have spiraled upwards and infrastructure development has also been high.

07101 1.6
3. THE MARKETS 3.1 TOTAL MARKET SIZE - CONCRETE Greater Mumbai The estimated market size of concrete, in Greater Mumbai, in FY 2003 and FY 2007 is given in Chart 1.3. The concrete market size, for both the periods, has been estimated based on cement consumed for concreting works and by using construction norms. More details on the methodology are given in Annexure 1. Concrete spend has been estimated based on average prices and proportion of concrete produced by batching plants, on site mixers and RMC.
10.97
8.73
1,998
3,710
0.0
4.0
8.0
12.0
FY 2003 FY 20070
1,500
3,000
4,500
Volume Spendmio cu m Rs Crores
Chart 1.3: Estimated Concrete Market Size- Greater Mumbai (per annum)
The concrete market size (volume) has increased by an average 6 % pa during the past 4 years. The low growth is attributed to the overall low cement growth (average of 6 % pa in the last 4 years) in Greater Mumbai. The concrete spend per cu m has increased by around 10 % pa. This is mainly attributed to the increase in cement prices. Cement retail prices have increased by around 12 % pa per t over the last 4 years. The average retail price of cement, which was around Rs 3,300 per t in FY 2003, is currently seen to be around 5,200 per t. Moreover, cost of other input materials have also increased in last 4 years. 3.2 TOTAL MARKET SIZE - RMC The estimated market size of RMC, in Greater Mumbai, in FY 2003 and FY 2007 is given in Chart 1.4. The information for FY 2007 is based on April 2006- March 2007 data collected during the market survey.

07101 1.7
RMC consumption volumes have been determined based on the RMC produced during the periods. RMC spend has been estimated based on the average delivered price of RMC in FY 2003 and FY 2007.
0.70
2.00
826
2390.0
0.5
1.0
1.5
2.0
FY 2003 FY 20070
250
500
750
1,000
Volume Spendmio cu m Rs Crores
Chart 1.4: Estimated RMC Market Size- Greater Mumbai (per annum)
RMC has seen a good growth in its sales volume over the past 4 years (an average of around 30 % pa). While market demand has obviously been a contributing factor, the increase is possibly more supply-driven, i.e., more attributable to the increase in the number of RMC plants. In FY 2003 there were 13 plants with a total capacity of 1,040 cu m/ hr (around 191,000 cu m/ month), whereas, at present the number of plants have increased to 37 with a total capacity of around 2,110 cu m/ hr (393,500 cu m/ month). Though the number of plants has increased 3-folds, the capacity has only doubled. The main reason for this is that the new plants are mostly of 30 cu m/ hr and 60 cu m/ hr capacity, and some of the large capacity plants that existed in FY 2003 have closed. RMC plants are located in all the zones of Greater Mumbai, which has facilitated in increasing the RMC consumption due to better supply from plants within each zone. The overall RMC spend per cu m has increased by almost 5 % pa. As mentioned earlier, cement prices have increased by around 12 % pa during the past 4 years and the price of other input materials have also risen during the same period. This indicates that RMC players are earning a lower EBIDTA margin in FY 2007 than what they were earning in FY 2003 (over 20 %) and they have not been able to pass on the increase in input materials cost to the consumers. Given the high volume growth of RMC (30 % pa in the last 4 years), it can be inferred that increase in the number of RMC suppliers leads to an increase in consumption. 3.3 RMC PRODUCT MIX AND PRICES RMC companies produce almost all grades of concrete, starting from M 7.5 to M 50. The most commonly produced grades are M 25, M 30, M 35 and M 40. These grades constitute around 85 - 90 % of their product mix. The grade wise product mix is shown in Chart 1.5.

07101 1.8
M 2010%
M 3031%
M 3517%
Others 3%M 40
25% M 2514%
Chart 1.5: RMC Product Mix
RMC suppliers are of 2 categories, viz., reputed and local. Players like, ACC, UltraTech Ready Mix, RMC India and L&T fall under the “reputed supplier” category, whereas, other RMC players fall under the “local supplier” category. Prices of “reputed suppliers” are seen to be slightly higher than that of “local suppliers”. The current grade-wise average RMC prices are given in Table 1.2.
Reputed Suppliers Local Suppliers Grade
OPC PPC OPC PPC M 15 3,100 – 3,150 3,250 – 3,300 3,000 – 3,050 3,150 – 3,200 M 20 3,250 – 3,300 3,400 – 3,450 3,150 – 3,200 3,300 – 3,350 M 25 3,350 – 3,400 3,500 – 3,550 3,250 – 3,300 3,400 – 3,450 M 30 3,550 – 3,600 3,700 – 3,750 3,450 – 3,500 3,600 – 3,650 M 35 3,750 – 3,800 3,850 – 3,900 3,650 – 3,700 3,750 – 3,800 M 40 3,900 – 3,950 4,050 – 4,100 3,800 – 3,850 3,950 – 4,000
Note: Prices are in Rs/ cu m and without tax, but including pumping and average transportation costs Table 1.2: Average RMC Prices
Delivered prices of RMC in Navi Mumbai are lower, primarily on account of lower input material costs (i.e. sand and aggregate), as the sources of these raw materials are closer to these plants. Delivered prices of RMC in other zones (i.e. Mumbai City and Thane) are higher due to high input material cost compared to Navi Mumbai. However, the “local RMC suppliers” tend to have slightly lower prices as they have relatively lower overheads and often produce lower quality of concrete. 3.4 CUSTOMER SEGMENTATION AND MARKET SHARE The customer base of RMC is depicted in Chart 1.6 and segment-wise market share of RMC is given in Chart 1.7.

07101 1.9
Chart 1.6: RMC Customer Base
The above chart indicates that RMC players dispatch higher volumes to the institutional segment, followed by the infrastructure segment. Dispatches to IHB segment is virtually non-existent, as new construction in this segment is minimal and is primarily in and around Panvel in Navi Mumbai. Greater Mumbai is characterized by multistory residential with very few individual houses.
10%
26%
0%
5%
10%
15%
20%
25%
30%
Institutional Infrastructure
Chart 1.7: Segment wise Market Share of RMC RMC has a highest penetration in the Institutional segment. This is due to the fact that majority of the projects undertaken by this segment have a very tight construction schedule which in effect results in fast paced construction. Therefore, to keep up with the construction pace, consumers in the Institutional segment also procure RMC, in addition to concrete prepared by their own batching plants. RMC presence in the Infrastructure segment is low. The low presence in this segment is attributed to this segment being well equipped with their own batching plants, and they only purchase RMC in the event of breakdown of their own batching plants or during the peak concrete demand when they are unable to produce the desired concrete quantity.
85%
15%
Institutional
Infrastructure

07101 1.10
RMC has a no penetration in the IHB segment in Greater Mumbai. This is because the IHB segment is virtually non-existent in Greater Mumbai. Multi story residential buildings primarily fulfill residential needs of Greater Mumbai. 3.5 RMC vs BATCHING PLANT IN GREATER MUMBAI Institutional and Infrastructure segments consume almost the entire RMC produced by all the players in Greater Mumbai. However, majority of the concrete demand in these segments is fulfilled by captive batching plants. These batching plants are mostly located on site or at a short distance from the site. RMC is also consumed over and above the concrete produced by these batching plants, either when their batching plant are shutdown or when there is a shortfall in quantity produced by them. The typical cost of M 30 grade concrete produced by a RMC plant and a Batching plant is given in Table 1.3 and Table 1.4, respectively.
Details Units (per cu m of concrete)
Rate (Rs/ unit)
Cost (Rs/ cu m of
concrete) OPC PPC OPC PPC Cement 320 kgs 380 kgs Rs 235 / bag 1,504 1,786 Fly Ash 110 kgs - Rs 1700 / t 187 0 Aggregate 930 kgs 771 kgs Rs 18 / cu ft 389 323 Sand 910 kgs 1,126 kgs Rs 24 / cu ft 437 540 Water 170 ltrs 170 ltrs Rs 350 per 12000ltr 5 5 Plastizers 4.2 ltrs 4.6 ltrs Rs 25/ ltr 105 115 Power 1.5 units 1.5 units Rs 6.5 / unit 10 10 Overheads - - - 250 250 Pumping - - - 115 115 Transportation 40 km 40 km Rs 9 / km 360 360 Depreciation & Interest - - - 60 60
Total Cost 3,422 3,564 Average Landed Price inclusive of VAT 12.5 % 4,000 4,150
Table 1.3: Typical concrete producing cost for RMC
Details Units (per cu m of concrete)
Rate (Rs/ unit)
Cost (Rs/ cu m of concrete)
OPC PPC OPC PPC Cement 320 kgs 380 kgs Rs 235 / bag 1,504 1,786 Fly Ash 110 kgs - Rs 1700 / t 187 0 Aggregate 930 kgs 771 kgs Rs 18 / cu ft 389 323 Sand 910 kgs 1,126 kgs Rs 24 / cu ft 437 540 Water 170 ltrs 170 ltrs Rs 350 per 12000ltr 5 5 Plastizers 4.2 ltrs 4.6 ltrs Rs 25/ ltr 105 115 Power 1.5 units 1.5 units Rs 6.5 / unit 10 10 Overheads - - - 100 100 Pumping - - - 110 110 Transportation 15 km 15 km Rs 9 / km 135 135

07101 1.11
Details Units (per cu m of concrete)
Rate (Rs/ unit)
Cost (Rs/ cu m of concrete)
OPC PPC OPC PPC Depreciation & Interest - - - 25 25
Total Cost 3,007 3,149 Add: 5 % to account for overall contractor profit 150 157 Landed price 3,157 3,306
Table 1.4: Typical concrete producing cost for Batching Plant From the above tables it is evident that the cost of concrete produced by RMC plant is higher than that of a batching plant by around 14 % for OPC and around 13 % for PPC. However, taking into account the VAT levied, the difference between the landed price of RMC and the landed price of concrete produced by batching plant, increases to around 27 % for OPC and around 26 %. This substantial price difference is a significant reason for consumers to opt for setting up their own batching plant for their major concrete requirements and only procure concrete from RMC suppliers in case of shortfall. Apart from the price difference, the fact that RMC is generally unavailable at short notice, large contractors prefer to have their own batching plant to keep up with their construction schedule rather than depend on the supply schedule of RMC suppliers. Majority of contractors and builders believe that the quality of RMC is comparable to concrete produced by their own batching plants, thus have a perception that the quality of RMC is over-rated vis-à-vis it’s price. This perception has further contributed to their preference for concrete produced by their own batching plants, instead of using RMC. Despite the perceived advantages of batching plant over RMC, consumers still buy concrete from RMC suppliers when they have requirement of higher grades of concrete (M45 and above) and when they are unable to produce desired quantity in their peak construction time. On site batching plants of smaller capacity are not equipped to produce higher grades of concrete with reliable quality. When there is a space constraint to setup a batching plant, contractors prefer RMC, as cost of managing the batching plant at a distant location would result in increased overall cost of construction and additional man management burden. 3.6 RMC – FACILITATING AND HINDERING FACTORS The major facilitating and hindering factors that have influenced RMC consumption in Greater Mumbai, in recent years, are: Facilitating Factors
The presence of increased number of RMC plants has led to increased RMC availability.
The boom in the construction of high-rise buildings has led to higher usage of concrete. Builders, apart from using concrete produced by their own batching plants, often make use of externally purchased RMC.
RMC offers good consistent quality for all kinds of concreting jobs. This leads to lower maintenance of the structure over its life. Builders, architects and structural engineers are aware of RMC and its advantages. This is borne out by the price premiums enjoyed by these players. This is, possibly, an important facilitating factor.

07101 1.12
To improve reliable availability, RMC players have stated their willingness to set up plants at their customers’ sites to achieve single source supply. This has ensured that these builders only use RMC (against them setting up a batching plant). An example of such a business model being implemented is UltraTech Concrete setting up its plant for captive consumption by HCC project for B L Kashyap in Kanjur, ACC for JVLR project, ACC for Lodha Builders in Lower Parel and L&T Concrete for residential project in Goregaon.
Construction contactors, involved in infrastructure projects, have their own batching plants. In peak concrete usage periods, these contractors also use RMC.
The reduced man management required in construction using RMC is a facilitating factor for the product. The builders recognize and appreciate this advantage.
Lack of space to store large quantity of aggregate, sand, cement, etc has also facilitated higher usage of RMC in the Institutional Segment. An example of this is the higher penetration of RMC in Mumbai City.
Credit facility offered by RMC suppliers. Hindering Factors
Higher delivered cost of RMC is one of the main reasons for the Institutional Segment (Housing and Commercial Complex) preferring concrete produced by own batching plants/ mixers to that produced by RMC players. The estimated cost of concrete (M-30 grade) produced by batching plants/ mixers (including pumping cost) is around 21% lower as compared to the average delivered price of RMC.
High traffic congestion especially in Mumbai City is a deterrent factor for higher penetration of RMC.
Night concreting is mostly opposed by the residents, due to noise created by concrete pumps. Thus no concreting work is believed to be done beyond 8:00 PM.
As per the traffic regulations, transit mixers are not allowed to carry more than 5 cu m of concrete. This increases the delivered cost of RMC, as the transportation cost has to be appropriated over 5 cu m/ trip instead of 6–7 cu m/ trip (i.e., utilizing its full carrying capacity).
Inability of most RMC players to deliver concrete at short notices acts as a deterrent.
Lack of sales promotional activities. Despite the hindering factors, RMC business has seen a growth in the past few years on account of the overriding facilitating factors. Most small sized contractors and the IHB segment are not very particular about quality. Low price is the main influencing factor for them to choose an RMC supplier. 3.7 ZONE-WISE ACCEPTANCE OF RMC Mumbai City is the highest consumer of RMC. However, in this zone, RMC has a share (of the total concrete market) of 31 %. Concrete requirement of this zone is fulfilled by the batching plants setup on site and RMC plants. Highest concrete requirement of this zone vis-à-vis the other zones, along with new construction and presence of RMC players are the main facilitators for RMC penetration.

07101 1.13
Navi Mumbai is the second largest RMC consuming zone in Greater Mumbai. This zone also has the second highest RMC/ total concrete share of around 9 %. Construction is on a high in this zone, especially in the northern part of Navi Mumbai (i.e. Nerul, Vashi, etc). This zone also has the second highest number of RMC plants among all the zones. Thane is the lowest consumer of RMC. RMC has a share (of the total concrete market) of around 7 %, which is the lowest penetration among all the zones. Construction is on a high in this zone, but this is of recent times. The batching plants meet most of the concrete requirement in this zone. This is the primary reason for the low RMC share/ penetration. Moreover, this zone has the least number of RMC plants (only 3 nos.), out of which two plants are partially dedicated for projects. Considering the quantum and type of future projects specifically the new international airport proposed, this zone offers a good potential for RMC usage. Detailed information about each zonal market is given in Chapter 3 of this report. 4. THE PLAYERS 4.1 OVERVIEW An overview of the number of RMC players in Greater Mumbai is given in Table 1.5. The clusters in which these units are located are shown in Chart 1.8. Number of Players 19 nos
Number of Plants 37 nos
Total Capacity 2,110 cu m/ hr (393,500 cu m/ month)
Average Production 166,575 cu m/ month
Location Clusters wise details Location Clusters Production per month (cu m) Mumbai City (25 plants) 121,750 Navi Mumbai (9 plants) 33,225 Thane (3 plants) 11,600 Total 166,575
Table 1.5: Overview of RMC Players

07101 1.14
Chart 1.8: RMC Location Clusters
Detailed information about each RMC player is given in Chapter 4 of this report. 4.2 ZONES SERVICED BY LOCATION CLUSTERS Location of an RMC plant influences its geographic coverage. Table 1.6 gives shows the zones typical covered and distance and time taken by each RMC supplying cluster.
Location Clusters Zones Typically Serviced Average Distance and Time Taken to Service
the Market
Wadala Mumbai City – Sion, Chembur, Kurla, Matunga, Andheri, Byculla, Parel, Vikhroli, etc.
15-20 Km, 1.5 – 2.0 hrs
Deonar Mumbai City and Navi Mumbai - Deonar, Chembur, Ghatkopar, Nerul, etc.
15-20 Km, 1.5 – 2.0 hrs
Dahisar Mumbai City – Dahisar, Goregaon, Borivilli, Bhandup, Kurla, etc. 15-20 Km, 1.5 – 2.0 hrs

07101 1.15
Location Clusters Zones Typically Serviced Average Distance and Time Taken to Service
the Market
Ghodbander Road Thane – Ghodbander Road 15-20 Km, 1.0 – 1.5 hrs
Mahape Navi Mumbai - Vashi, Panvel, Nerul, Khargarh Vashi, Nerul, Khargarh, Turbhe, Airoli, etc.
15-20 Km, 1.0 – 1.5 hrs
Nerul Navi Mumbai -Vashi, Panvel, Nerul, Khargarh, Turbhe, etc. 15-20 Km, 1.0 – 1.5 hrs
Table 1.6: RMC Cluster-wise Zones Serviced
From Chart 1.8 and Table 1.6 it may be easily inferred that the distance to a high RMC consumption zone is very important while determining the location of a new plant. The following illustration depicts the importance of proximity of a plant to a market.
Chart 1.9: Illustration depicting importance of proximity of a RMC plant to a market The above illustration shows the weighted average unit transport costs (in Rs/ cu m of RMC) of various inputs (Cement, Aggregates, Sand, etc) to an RMC plant and the different freights to different markets. In a general case, the choice of a plant location could be optimized by minimizing the input plus output transportation costs. In Greater Mumbai, since the delivered cost of major inputs, which subsumes their transport components, varies within a range of + 10 %, the distance/ freight cost of the input material to the plant site and the freight cost of RMC to the market gains more importance while selecting a plant location/ site.
F4
F3
F2
F1
RMC
CC
CA
CS
CX
Market 1
Market 2
Market 3
Market 4

07101 1.16
4.3 CATEGORIES OF RMC PLAYERS There are two categories of RMC players, in Greater Mumbai, viz., Reputed RMC players and Local RMC players. Table 1.7 classifies all the RMC players in these two categories.
Reputed RMC Players Local RMC Players • ACC • L&T Concrete • UltraTech Concrete (previously known
as Birla Readymix) • RMC India
• ABL RMC • Blue Star RMC • Chirag Readymix • Godrej • IVRCL • Jindal RMC • J M Mahatre • Jyoti RMC
• RCC Concrete • S C Thakur • Shree RMC • Shree Naman • Instacrete • Saket RMC • Tarmat RMC
Table 1.7: List of Reputed and Other RMC Players The two categories of players have been graded in Table 1.8 based on the feedback from the market.
Score are out of 10
Parameters Reputed Players Local Players Price Premium 5 3 Capacity Utilisation 5 3 Product Range 8 6 Quality 8 6 Market Coverage 7 7 Delivery Time 6 6 Market Share 7 3 Promotion 3 1
Table 1.8: Grading of Reputed Vs Local Players Some important observations are:
Local players are perceived to have a lower product range than reputed players
In terms of delivery time and market coverage, both the categories of players are perceived to have the same capability.
The quality of RMC produced by reputed players is considered better than that produced by local players. This is also the reason why users are willing to give a premium to the RMC supplied by reputed players.
Parameter-wise grading of reputed players is given in Table 1.9.
Score are out of 10
Parameters ACC RMC UltraTech Concrete L&T Concrete RMC India Price Premium 5 5 6 5 Capacity Utilisation 3 5 9 5 Product Range 8 8 8 8 Quality 7 7 8 7 Market Coverage 7 7 8 6

07101 1.17
Parameters ACC RMC UltraTech Concrete L&T Concrete RMC India Delivery Time 7 7 8 7 Market Share 6 6 8 5 Promotion 3 3 4 1
Table 1.9: Grading of Reputed Players Some important observations are:
All the reputed players are perceived to charge a similar price. L&T is perceived to charge a price premium over other reputed players
L&T Concrete, UltraTech and ACC are perceived to deliver RMC anywhere in the Greater Mumbai. However, amongst these 3 players, L&T is perceived to have higher market coverage.
L&T is perceived to have a faster delivery time.
L&T, followed by UltraTech and ACC, are considered to be expending greater promotional as compared to other players.
4.4 PRACTICES FOLLOWED BY LOCAL RMC PLAYERS There is no significant difference in the practices of local players and reputed players in Greater Mumbai. They generally try to follow the same practices as that followed by reputed RMC players. However, some of the practices followed by them are listed below:
Often the local players agree to supply concrete at low prices. However, to make profit, these players either supply a lower grade of concrete or change the design mix such that lesser quantity of cement is used.
These players, sometimes, are reported to deal in cash, whereby the customer gets a lower price and the RMC player does not have to pay taxes. The delivered price quoted by the local players for cash sales is lower than prices that reputed players offer.
Some of the infrastructure contractors and builders who have their own batching plants also supply concrete to other builders during their own lean concrete requirement period. They charge a 10 % profit margin over the production cost of the concrete. Concrete is delivered without charging VAT. These players only deal in cash.
There is no directive that indicates that a “weights and inspection” body is constituted to oversee the quality of concrete being produced by RMC players. If such a body were to be functional, local RMC players would not be able to follow some of the practices that reduce the quality of concrete. In such an event, the phenomenon of under-cutting price at the cost of quality would, possibly, be minimized. The RMC Association of India, situated in Mumbai, is a defunct organization. It neither has any information about the production or capacities of RMC players in India, nor does it play any developmental/ regulatory role in the building of the comparatively nascent industry. 4.5 ESTIMATED COST OF PRODUCTION OF POPULAR GRADES AND EBIDTA
MARGIN OF REPUTED PLAYERS AND LOCAL PLAYERS The cost of production (COP) and EBIDTA margin is estimated assuming the following:
RMC players are using both OPC and PPC.
VAT paid on input material is offset against VAT chargeable on selling price.

07101 1.18
M-30 is the most popular concrete grade produced by RMC players. COP calculations have therefore been estimated for this grade.
The estimated typical cost of production (COP) and EBIDTA margin of reputed players is given in Table 1.10.
Units (per cu m of concrete)
Cost (Rs/ cu m of concrete) Details
OPC PPC
Rate (Rs/ unit) OPC PPC
Cement 320 kgs 380 kgs Rs 235 / bag 1,504 1,786 Fly Ash 110 kgs - Rs 1700 / t 187 0 Aggregate 930 kgs 771 kgs Rs 18 / cu ft 389 323 Sand 910 kgs 1,126 kgs Rs 24 / cu ft 437 540 Water 170 ltrs 170 ltrs Rs 350 per 12000ltr 5 5 Plastizers 4.2 ltrs 4.6 ltrs Rs 25/ ltr 105 115 Power 1.5 units 1.5 units Rs 6.5 / unit 10 10 Overheads - - - 250 250 Pumping - - - 115 115 Transportation 40 km 40 km Rs 9 / km 360 360 Depreciation & Interest - - - 60 60
Total Cost 3,422 3,564 Selling Price (inclusive of VAT) 4,000 4,150 VAT payable on sales 444 461 VAT already paid (on cement) 167 198 Net VAT payable 277 263 Net Profit 301 323 EBIDTA 361 383 EBIDTA Margin 9.0 % 9.2 %
Table 1.10: Estimated COP and EBIDTA for M-30 Grade for reputed players The estimated typical cost of production (COP) and EBIDTA margin of local players is given in Table 1.11.
Units (per cu m of concrete)
Cost (Rs/ cu m of concrete) Details
OPC PPC
Rate (Rs/ unit) OPC PPC
Cement 310 kgs 370 kgs Rs 235 / bag 1,457 1,739 Fly Ash 110 kgs - Rs 1700 / t 187 0 Aggregate 930 kgs 771 kgs Rs 18 / cu ft 389 323 Sand 910 kgs 1,126 kgs Rs 24 / cu ft 437 540 Water 170 ltrs 170 ltrs Rs 350 per 12000ltr 5 5 Plastizers 4.2 ltrs 4.6 ltrs Rs 25/ ltr 105 115 Power 1.5 units 1.5 units Rs 6.5 / unit 10 10 Overheads - - - 125 125 Pumping - - - 110 110 Transportation 40 km 40 km Rs 9 / km 360 360 Depreciation & Interest - - - 25 25

07101 1.19
Units (per cu m of concrete)
Cost (Rs/ cu m of concrete) Details
OPC PPC
Rate (Rs/ unit) OPC PPC
Total Cost 3,210 3,352 Selling Price (inclusive of VAT) 3,900 4,050 VAT payable on sales 433 450 VAT already paid (on cement) 162 193 Net VAT payable 271 257 Net Profit 419 441 EBIDTA 444 466 EBIDTA Margin 11.4 % 11.5 %
Table 1.11: Estimated COP and EBIDTA for M-30 Grade for local players Typical EBIDTA Margin of RMC players in Greater Mumbai, for M 30 grade, has fallen from 20.0 % - 21.0 % in FY 2003 to 9 % - 9.5 % in FY 2007. 4.6 RAW MATERIAL, SOURCES AND DELIVERED COST
Raw Material Source/ Suppliers Delivered Cost (Rs) Source: Mahad, Vaitarna
Sand Some Major Suppliers: M/s Sai Enterprises, M/s Unique Enterprises, M/s S V Materials etc.
Rs 23 - 25 / cu ft
Source: Turbhe, Bhiwandi, Vasai, Jasai, Uran, Meondi Aggregates Some Major Suppliers: M/s Chetak Stone, M/s Shree Cost, M/s Sai Deep Trading, etc.
Rs 17 – 19 / cu ft
Admixtures Source: SWC, Choksey, BASF, Chembond, Supaplast Rs 23 – 25 / Kg
Fly Ash Source: Dhanu, Nashik Rs 1600 – 1800/ t Table 1.12: Raw Material, Sources and Delivered Cost
4.7 TYPES OF CEMENT USED Both OPC and PPC are used to make concrete. Consumers can choose between OPC based concrete or PPC based concrete, as per their design requirements. ACC uses both OPC and PPC. Taking into account the product mix of cement supplied to Greater Mumbai and practices of RMC players, the ratio of OPC: PPC usage in producing RMC is “guesstimated” as 50:50. 5. OUTLOOK FOR THE FUTURE 5.1 DEMAND 5.1.1 SALIENT FEATURES OF THE PROPOSED MASTER PLAN OF MASTER PLAN
FOR GREATER MUMBAI REGION AND ITS IMPACT ON RMC Greater Mumbai region comprises of Mumbai City, Thane and Navi Mumbai. Salient features of the Master Plan of Greater Mumbai region are as under:

07101 1.20
Master Plan facilitates land re-usage, which would enable usage of large excess land of old textile mills, Bombay Port Trust (BPT) and land under BPT warehousing to be utilised for both residential as well as commercial purposes.
Old existing buildings are to be demolished and reconstructed with 2.4 times of the permissible Floor Space Index (FSI). Incase of buildings of Government/ Semi- Government and Public Sector Units (PSU), additional 50 % of permissible FSI will be allowed.
A higher FSI is also proposed for slum development projects.
Dharavi slums are to be developed for commercial and residential usage at an estimated cost of Rs 9,250 Crores.
Old buildings, which cannot be demolished due to their architectural and aesthetic values, are to be redeveloped by internal restructuring and redesigning.
Export Processing Zones are to be developed on BPT land near Jawaharlal Nehru Port, in Navi Mumbai.
Total investment on infrastructure development is estimated to be around Rs 10,500 Crores, over a period of 10 years. Rs 2,648 Crores to be invested for infrastructure development in next 3 – 4 years on the projects mentioned below:
10 new-elevated roads are to be constructed to ease the traffic congestion. 41 flyovers to be constructed for smoother flow of traffic. 16 new Railway Over Bridges (ROB) to be constructed to eliminate the existing
railway level crossings. 10 vehicular subways are planned in areas where grade separators are not feasible. 56 pedestrian subways are to be constructed for safe passage of pedestrians.
Apart from the above, the other major projects/ development plans under implementation/ envisaged in Greater Mumbai region are:
A new International Airport is being planned near Panvel and construction work is expected to start by next year.
A new international airport is in the early stages of planning at Thane and is spread over 1800 acres of land.
Anil Ambani led consortium will build the first corridor, of Mumbai Metro Rail Project, at an estimated cost of Rs 2,356 Crores.
Bandra – Worli sea link is under construction.
Jogeshwari – Vikhroli link road is under construction.
Santa Cruz – Chembur link road is under planning stage.
Reliance Industries will setup a SEZ spread over 3,200 acres with an investment of Rs 25,000 Crores.
A new Mumbai – Navi Mumbai six-lane Trance Harbour link is planned at an estimated investment of Rs 4,000 Crores.
City and Industrial Development Corporation (CIDCO) has planned a new mass residential project “Seawood Estate”, which will have around 2,000 apartments.

07101 1.21
Private builders and developers are constructing many projects and also have plans for more residential and commercial projects in Greater Mumbai.
Implications for RMC The use of batching plants/ RMC plants is expected to augment significantly as a result of new projects planned in Greater Mumbai region. Contractors involved in these projects will use their batching plants or alternatively foster tie-ups with RMC players to meet the “contractors’ selection criteria”. Contractors involved in infrastructure projects, during mass concrete requirement, will continue to use RMC. RMC is expected to get a boost due to the projects under implementation and upcoming new projects 5.1.2 FUTURE SCENARIO Construction in Greater Mumbai is expected to grow at a high rate in the next decade. This section gives a macro overview of the envisaged development in each zone. Mumbai City Construction activities in Mumbai City are scattered all across the zone. Major builders and developers like Lodhas, Godrej Properties, etc. have started new projects in this zone, particularly in areas in and around Parel, which has around 30 old textile mills. These mills have been bought over by major builders and would be demolished to give way for the new multistory residential as well as commercial projects. Apart from this, Bnadra- Kurla Complex is the most sort after destination for construction of corporate offices and five star hotels, due to its vicinity to the airport. Infrastructure development is also in full swing in this zone. Mumbai Metropolitan Region Development Authority (MMRDA) is undertaking projects to convert all the bitumen roads to concrete roads. New flyovers are being constructed, both on the Eastern as well as Western Expressway, to reduce the existing high traffic congestion. To further facilitate smooth flow of traffic, a sea link project is being undertaken by Maharashtra State Road Development Corporation (MSRDC), which would connect Bandra to Worli and another trans-harbour sea link is being planned from Sevri to Nhava in Navi Mumbai. Construction activities are also envisaged to accelerate in the coming years, as a Slum Rehabilitation Program, Dharavi (Asia’s largest slum) is initiated to develop this area into 5 new self-sufficient townships at an estimated cost of Rs 9,250 Crores. Apart from this private builders and developers have also planned their new multistory residential and commercial projects in this zone. Navi Mumbai Navi Mumbai was conceived as and developed to ease the growing pressure for residential and commercial space on Mumbai City. It is considered as the world’s largest planned city. Currently, most of the construction related development has been taking place in the northern part of this zone.

07101 1.22
City and Industrial Development Corporation (CIDCO) have planned a new Mass Residential project “Seawood Estate”, which will have around 2,000 apartments. CIDCO is has also planned to allot around 650 acres of land for individual housing, under their housing project scheme. A new International Airport is also planned at Panvel, which would ease the current heavy aviation traffic at the existing Mumbai airport. The construction of the airport is expected to start by 2008. Reliance Industries has planned its Special Economic Zone (SEZ) in this zone. The work for this project is expected to start by the end of 2007. The SEZ will be spread over 3,200 acres and is expected to be developed at an estimated investment of Rs 25,000 Crores. This cost excludes further investment by various companies who will be opening their establishments within the SEZ. To facilitate easy access from the SEZ to Mumbai City, a six-lane Trans-Harbour sea link road has been planned at an investment cost of Rs 4,000 Crores. A new railway corridor is planned to till Jawahalal Nehru Port. Based on the planned development of this zone, Navi Mumbai is envisaged to experience a substantial growth in construction activities in future. Thane Compared to other zones, construction activities in Thane are of recent origin. Currently the major construction activity is around Ghodbander Road. All the RMC plants in Thane are located in this area only. Private builders and developers have commenced constructing multistory residential and commercial projects in this area. A major residential cum commercial project currently underway in this zone is being constructed by Hiranandani Developers (Hiranandani Estate). This project is being planned as a modern township, on similar lines to that of Hiranandani Gardens in Powai. Apart from the above, a international airport is being planned for this zone. The government is in the process of acquiring 1,800 acres of land for the airport project. Construction is expected to commence after the Navi Mumbai airport gets commissioned. A Mass Rapid Transport System (MRTS) is also being planned for this zone. Maharashtra State Road Development Corporation has been appointed as a nodal agency for carrying out the necessary studies and implementing the project. Due to good connectivity of Thane with Mumbai City (through the Eastern expressway), construction activities in this zone are envisaged to pick up in the near future. Most major builders and developers have announced their plans of constructing multistoryed residential and commercial projects. 5.1.3 Concrete Consumption – Zone Wise and Segment Wise The estimated concrete demand forecast in FY 2009 and FY 2012 is given in Table 1.13 and Table 1.14 below.

07101 1.23
Figures in cu m per month
Zone IHB Institutional Infrastructure Total
Mumbai City 30,830 329,670 147,470 507,970
Navi Mumbai 77,000 265,300 147,320 489,620
Thane 36,560 145,960 34,975 217,495
Total 144,390 740,930 329,765 1,215,085 Note: Institutional segment comprises of Housing and Commercial Complexes, and factories if any.
Table 1.13: Estimated Concrete Requirement in FY 2009
Figures in cu m per month
Zone IHB Institutional Infrastructure Total
Mumbai City 45,270 484,060 216,530 745,860
Navi Mumbai 93,295 515,430 278,905 887,630
Thane 39,635 214,270 47,395 301,300
Total 178,200 1,213,760 542,830 1,934,790 Note: Institutional segment comprises of Housing and Commercial Complexes, and factories if any.
Table 1.14: Estimated Concrete Requirement in FY 2012
Concrete consumption in Navi Mumbai, after 5 years, is estimated to overtake Mumbai City as the former is envisaged to grow at a higher rate. Thane has a low concrete base and its concrete consumption in FY 2012 is also estimated to be lower than that of the other 2 zonal markets. The institutional segment is envisaged to continue consuming the highest volume of concrete in the future. This seems plausible given the envisaged construction trend in all the zones. 5.1.4 Envisaged Product Life Cycle and Market Share of RMC Players The product life cycle in FY 2012 is estimated based on the following rationale:
The Greater Mumbai is witnessing a boom in construction and RMC usage. RMC volume in Greater Mumbai has grown by around 30 %, pa since FY 2003. Growth in RMC demand is attributed to growth in construction activity all across Greater Mumbai.
Given the construction practices in India, RMC is envisaged to command a maximum of 70 % market share in the future. The zone-wise maximum RMC share is based on the following three hypothesis:
The higher a zone on its Product Life Cycle, the higher the concrete to RMC conversion till it reaches its saturation point/ maximum conversion point
The concrete to RMC conversion rate is dependent upon the type and quantum of construction and thus the volume of concrete consumed
The concrete to RMC conversion rate is dependent construction practices Rate of conversion growth is also depended upon the presence or absence of
inhibitors, e.g., thoroughfare for RMC Transit Mixers, traffic congestion, etc.
The envisaged zone-wise maximum RMC market shares, irrespective of the year in which it materializes, are given in Table 1.15:

07101 1.24
ZONE MAXIMUM RMC SHARE Mumbai City 60 % Mumbai City is witnessing new construction, particularly in the Institutional segment. Land re-usage, as proposed in the Master Plan has opened new avenues for builders and developers. The builders have acquired the old textile mills in this zone for constructing new residential and commercial projects. Infrastructure development is also on a high in this zone and new flyovers, ROBs, subways, etc., are planned for this zone. Mumbai Metro Rail Project will be constructed with Government and private participation. This project will be constructed by Anil Ambani led consortium. The construction is envisaged to intensify in coming years and would last for at least another 5-7 years. On the basis of the socio-economic profile, RMC is envisaged to command a market share of around 75 % in the Institutional segment. Infrastructure activities are increasing. RMC players should target supplying around 40 % of the concrete needs of this segment. Navi Mumbai 65% Navi Mumbai is considered as the world’s largest planned city. Currently construction growth has been limited to the northern parts of this zone. CIDCO has been instrumental in developing this zone in a planned and phased manner. It has now planned a Mass Residential project, “Seawood Estate”, which will have 2,000 apartments. Reliance Industries has planned a SEZ spread over 3,200 acres at an estimated investment of Rs 25,000 Crores. A new International Airport has also been planned near Panvel, and construction is expected to start by 2008. On the basis of the socio-economic profile, RMC is envisaged to command a market share of over 25 % in the IHB segment and 80% in the Institutional segment. RMC players should target supplying around 50 % of the concrete needs of the Infrastructure segment. Thane 65% Thane has the lowest number of RMC plants in Greater Mumbai region. This has affected RMC penetration and this zone has the lowest RMC consumption in Greater Mumbai region. Currently, Thane is witnessing new construction along Ghodbander Road. Thane Municipal Corporation has recognized the need to develop a public transportation system and has appointed Maharashtra State Road Development Corporation as a nodal agency for carrying out the necessary studies and implementing the project. A new airport has been proposed, which is at the planning stage, and construction activities are envisaged to commence after the Navi Mumbai international airport is functional. On the basis of the socio-economic profile, RMC is envisaged to command a market share of 5 % - 10 % in the IHB segment and 75 % - 80 % in the Institutional segment. RMC players should target supplying around 50 % of the concrete needs of the Infrastructure segment.
Table 1.15: Zone-wise Maximum Market Share (irrespective in which year it materializes)

07101 1.25
The zone-wise product life cycles are given in Charts 1.10 to 1.12. For each zone, three scenarios are created (optimistic, realistic and pessimistic) where RMC reaches its peak.
MUMBAI CITY
Chart 1.10: Envisaged future PLC of RMC in Mumbai City RMC is envisaged to reach it’s peak anywhere between 2014-15 and 2019-20. Taking a 5-year perspective, RMC should have a market share, anywhere between 35 - 40 %, in 2011-12. The range of market share translates into a volume of 261,050 – 335,635 cu m/ month. NAVI MUMBAI
Chart 1.11: Envisaged future PLC of RMC in Navi Mumbai
FY07 FY25 FY20 FY22
RM
C a
s pe
rcen
tage
of C
oncr
ete 65%
9%
FY12
25% 20% 15%
FY07 FY20FY15 FY17
RM
C a
s pe
rcen
tage
of C
oncr
ete
50% 45%
40%
31%
FY12
35%
55% 60%

07101 1.26
RMC is envisaged to reach it’s peak anywhere between 2019-20 and 2024-25. Taking a 5-year perspective, RMC should have a market share anywhere between 15 - 25 % in 2011-12. The range of market share translates into a volume of 133,145 – 221,910 cu m/ month. THANE
Chart 1.12: Envisaged future PLC of RMC in Thane
RMC is envisaged to reach it’s peak anywhere between 2019-20 and 2024-25. Taking a 5-year perspective, RMC should have a market share anywhere between 15 - 25 % in 2011-12. The range of market share translates into a volume of 45,195 – 75,325 cu m/ month. A summary of the potential concrete volumes available to RMC players in FY 2012 is given in Table 1.16.
Zones RMC potential (in cu m/ month) Mumbai City 261,050 – 335,635 Thane 45,195 – 75,325 Navi Mumbai 133,145 – 221,910 Total Greater Mumbai 439,390 – 632,870
Table 1.16: RMC potential in 2012 Based on Table 1.16, the share of RMC in the total market for concrete, in Greater Mumbai, could increase from its current level of 18 %, to 23 % - 33% by FY 2012. The above table indicates that Mumbai City and Navi Mumbai would be the highest RMC users.
FY07 FY25 FY20 FY22
RM
C a
s pe
rcen
tage
of C
oncr
ete 65%
7%
FY12
25% 20% 15%

07101 1.27
5.1.5 Share of RMC – Revisited As shown in section 5.1.4, different zones in Greater Mumbai region would see different RMC growths and the maximum share that RMC can take of the total concrete in each zone would also differ. This implies that a certain portion of the concrete market will not convert to RMC. In other words, a certain portion of the concrete market is not a potential RMC market. Thus, the total market that is open to RMC is now being termed as PRMC (Potential RMC) market. In each zone’s PRMC market size, the current and future RMC market share has been re-estimated. An example to further clarify and illustrate this concept is: “In FY 2007, the total concrete market size in Mumbai City is 391,945 cu m/ month. As given in Table 1.15, RMC in Mumbai City, at a certain time in the future, would have a maximum market share of 60 %. Therefore, the PRMC market size is 391,945 x 60 % = 235,165 cu m/ month. RMC supply to Mumbai City in FY 2007 is around 121,750 cu m/ month and its share in the PRMC market is 52 %.” Table 1.17 gives the RMC market share, zone-wise, in FY 2007 in the PRMC market.
Figures in cu m
Zone Estimated Concrete
Requirement per month
Estimated PRMC market
size per month
Estimated RMC Supply per month
Share of RMC in the PRMC market (%)
Mumbai City 391,945 235,165 121,750 52 Thane 169,390 110,105 11,600 11 Navi Mumbai 352,690 229,250 33,225 14 Total 914,025 574,520 166,575 29
Table 1.17: Estimated Zone wise RMC Share in PRMC – FY 2007 The above table indicates that Mumbai City has a share of 52 %, while Thane and Navi Mumbai have shares of 11 % and 14 %, respectively, in the PRMC market in FY 2007. Likewise, the estimated zonal shares of RMC in FY 2012 are depicted in Table 1.18.
Figures in cu m
Zone Estimated Concrete
Requirement per month
Estimated PRMC market
size per month
Estimated RMC Supply per month
Share of RMC in the
PRMC market (%)
Mumbai City 745,860 447,515 261,050 – 335,635 58 – 75 Thane 301,300 195,845 45,195 – 75,325 23 – 38 Navi Mumbai 887,630 576,960 133,145 – 221,910 23 – 38 Total 1,934,790 1,220,320 439,390 – 632,870 36 – 52
Table 1.18: Estimated Zone wise RMC Share in PRMC – FY 2012 In Greater Mumbai, RMC is estimated to have a share in the range of 36 % – 52 % in the PRMC market in FY 2012. The range indicates the possible, minimum and maximum share that RMC can command.

07101 1.28
5.2 SUPPLY 5.2.1 PROFESSIONALISM IN THE RMC INDUSTRY In the past 4 years, the number of RMC plants has increased by almost three-folds. Due low entry barriers, many local players have entered in the market. On an overall basis, Greater Mumbai RMC market is the growth stage of its product life cycle. As depicted earlier, the total concrete volume in Greater Mumbai is estimated to grow at an average rate of 16 % pa over the next 5 years. We envisage that the construction boom will attract more RMC players, including local RMC players, in the next few years. However, more professional players could displace the local RMC players. The reasons for this include the following:
Computerization of all tax payers’ returns by the Income Tax (IT) department, stricter IT norms and checks, etc will no longer enable the local RMC players to continue with their current practices (cash deals, not paying their taxes, etc).
With the institutional segment increasing, which has high awareness level, better construction practices and quality consciousness, market will force the RMC players to deliver quality concrete and be open to stricter quality checks.
There is a possibility of RMC plants being further set-up at customer sites. This will ensure lower delivered price to the customer (very low transportation cost) and better quality control by the customer. Once a project is completed, the RMC player will shift the plant to another customer’s site. There is also a similar possibility of RMC players dedicating their plant for infrastructure projects. Only plants that can deliver quality RMC will be able to adopt this business-model for the quality-conscious customers.
More cement companies are envisaged to forward integrate into RMC business. As the RMC business grows and becomes an important cement distribution channel, cement companies will want to control this channel and would open their own RMC plants.
The above scenario could discourage new local players to enter into the RMC business and put pressure on the existing players to adopt higher levels of professional business practices. 5.2.2 NEW RMC PLANTS The new RMC plants are expected to come up in the Greater Mumbai are given in Table 1.19. This list is based on the information gathered during the market survey. S. No Player Location Capacity (cu m/ hr) Year/ Remarks
1. ACC Ghodbander Road 60 July 2007
2. ACC Digha 90 June 2007
3. ABL RMC Undecided 60 August 2007
4. L & T Concrete Turbhe 60 June 2007
5. L & T Concrete Deonar 60 July 2007
6. L & T Concrete Dahisar 60 August 2007

07101 1.29
S. No Player Location Capacity (cu m/ hr) Year/ Remarks
7. RMC India LBS Marg 60 End of 2007
8. UltraTech Concrete Goregaon 30 June 2007
9. UltraTech Concrete Hiranandani 120 August 2007
10. UltraTech Concrete Mahul 30 June 2007
11. UltraTech Concrete Mulund 30 July 2007 Table 1.19: New RMC Plants in Greater Mumbai
L&T already has a 30 cu m plant in Dahisar. A new plant of 60 cu m/ hr will be setup in the same location. RMC plants of UltraTech Concrete at Mahul and Mulund will be 100 % dedicated plants for projects. Both these plants are being considered as RMC plants, as it is a RMC player dedicating the plants to a project as a business model. 5.2.3 SUPPLY SCENARIO BY FY 2008 The estimated total RMC capacity in Greater Mumbai, location-cluster-wise by FY 2008 is given in Table 1.20. Number of Players 19 nos
Number of Plants 48 nos
Total Capacity 2,770 cu m/ hr (511,500 cu m/ month)
Location Clusters wise details
Location Clusters Capacity per month (cu m)
Mumbai City (31 plants) 356,000
Navi Mumbai (11 plants) 112,500
Thane (5 plants) 43,000
Total 511,500 Table 1.20: Estimated RMC capacity location-cluster-wise - FY 2008
From the past trend, it is seen that overall capacity utilization for commercial RMC supply for all the plants in Greater Mumbai is 40 %.

07101 1.30
5.2.4 DEMAND Vs SUPPLY – FY 2012 The estimated demand scenario in FY 2012 is given in Table 1.21.
Zones RMC potential (in cu m/ month) Mumbai City 261,050 – 335,635 Thane 45,195 – 75,325 Navi Mumbai 133,145 – 221,910
Total Greater Mumbai 439,390 – 632,870 Table 1.21: Estimated Demand Scenario - FY 2012
To meet the above demand, RMC players will need to expand their capacity. The following assumptions are used to derive the number of plants required to meet this demand:
The existing plants (as per Table 1.5) will continue.
Professional players will dominate RMC capacities and thus will consider capacity expansion when the average utilisation exceeds 70 %.
New plants in Greater Mumbai will be of at least 60 cu m/ hr capacities and would work at an average capacity utilisation of 70 %.
Based on the above assumptions, all the zones in Greater Mumbai, collectively, will require an additional 12 RMC plants to meet the 439,390 cu m/ month demand, or around 39 plants to meet the 632,870 cu m/ month demand. This comparison is made against the number of plants estimated by the end of FY 2008 (refer table 1.20). The exact location/ zone where ACC can set up new RMC plants will need to be examined in the strategy development phase after taking in consideration the delivered cost of raw material, lead distance and time to various consumption centers/ zones, cost to deliver RMC and other appropriate parameters.

07101 2.1
CHAPTER 2: STRATEGIC IMPLICATIONS 1. PREAMBLE: This chapter looks at the strategic implications of the situational analysis findings presented in Chapter 1. The implications have been categorized into the following sections:
Opportunities & Threats
Key Success Factors
Input material requirements
Changing user segments
Changes in Product Mix
Prices
Changes in RMC Industry 2. OPPORTUNITIES AND THREATS
Opportunities RMC in Greater Mumbai is in the growth stage - more plants are needed to meet the FY
2012 demand. Differential zonal market growths would necessitate differential capacity creation in
supplying clusters, to ensure competitiveness in each consumption zone Large players could backward integrate to assume strategic control of raw
materials used to make the product. The type of construction envisaged in future would result in an upward shift of the
product mix. All the above reasons could contribute towards a higher EBIDTA margin through a
combination of higher prices and lower delivered costs.
Threats In some zonal markets, emergence of local RMC players is a possibility. This could
perpetuate the phenomenon of price undercutting and unethical practices. In these zonal markets, larger players could see low EBIDTA margins
Any increase in price could be collectively resisted by builder lobbies while insisting on high quality.
Due to increased demand, suppliers of input materials like sand, aggregates and resources such as hiring of transit mixers could attempt to enhance their prices.
Delivery constraints, resulting in lower RMC consumption could be faced in areas where traffic congestion is seen to be spiraling.
3. KEY SUCCESS FACTORS The key success factors for an RMC player, based on the current situation of RMC in the Product Life Cycle, are given below. The factors are ranked based on their relative importance.

07101 2.2
Low delivered prices
Timely delivery
Proximity to consumption centers/ zones
Quality of concrete delivered The above key success factors and their ranking will change as the RMC’s proportion to “Non RMC” increases. The most likely key success factors, in order of their relative importance, when RMC demand is higher than “Non RMC” demand, are envisaged as:
Quality of concrete
Low delivery time-period between placing an order and order fulfillment
Proximity to consumption centers/ zones
Price It is evident that soft-factors gain higher importance over price, as RMC becomes the predominant product. An RMC player should position itself and create competencies depending upon where RMC is on the Product Life Cycle and how the particular company is perceived in the market. 4. CHANGING USER SEGMENTS The envisaged RMC user segment profile/ customer base in FY 2012 is depicted in Chart 2.1.
FY 2007 FY 2012 Chart 2.1: RMC Customer Base- Greater Mumbai
IHB: 5 % - 10 %
Institutional: 70 % - 80 %
Infrastructure: 20 % - 25 % Infrastructure 15 %
Institutional 85 %

07101 2.3
5. CHANGE IN PRODUCT MIX Given the changing customer base and product preferences, the product mix in FY 2012 is estimated in Chart 2.2.
M 2010%
M 3031%
M 3517%
Others 3%M 40
25% M 2514%
M205%
M3025%
M3525%
M2510%
M4030%
Others 5%
FY 2007 FY 2012
Chart 2.2: Envisaged RMC Product Mix in FY 2012- Greater Mumbai The change in product mix has been considered based on information collected during the market survey. The change in product mix will result in higher quantity of cement being consumed to make higher grades of concrete. This in turn will marginally increase cement demand. 6. INPUT MATERIAL REQUIREMENTS The RMC demand in Greater Mumbai, in FY 2012 is estimated in the range of 439,390 – 632,870 cu m/ month. The following assumptions have been considered to estimate the input materials’ requirement:
The grade wise product mix considered is M 20: 5 %, M 25: 10 %, M 30: 25 %, M 35: 25 %, M 40: 30 % and M 45: 5 %.
The input material considered to produce the respective grades of RMC are:
In kgs per cu m of concrete Input Material M 20
Grade M 25
Grade M 30
Grade M 35
Grade M 40
Grade M 45
Grade Cement 230 260 320 360 385 420 Fly Ash 120 120 110 100 100 90 Sand 1,045 1,030 910 895 880 815 Aggregates 870 860 930 920 900 935
Table 2.1: Input Material per cu m of RMC Based on the above assumptions, the RMC industry in Greater Mumbai would require the following quantity of raw materials in FY 2012:
Cement: 151,150 – 217,710 tons/ month
Fly Ash: 46,135 – 66,450 tons/ month

07101 2.4
Sand: 400,395 – 576,700 tons/ month
Aggregates: 399,295 – 575,120 tons/ month. 7. CONCLUSION RMC in Greater Mumbai is estimated to grow from the current 166,575 cu m/ month to 439,390 – 632,870 cu m/ month by FY 2012. The major consuming zonal markets would remain as Mumbai City and Navi Mumbai. Thane is also envisaged to witness an increase in RMC consumption in future, albeit at a lower rate. To meet the FY 2012 RMC demand (439,390 – 632,870 cu m/ month), the Greater Mumbai requires 12 - 39 new RMC plants of 60 cu m/ hr capacity. In FY 2007, the number of RMC plants in Greater Mumbai was 37. The exact location/ zone where ACC can set up new RMC plants will need to be examined taking into consideration the delivered cost of raw material, lead distance and time to various consumption centers/ zones, cost to deliver RMC and other appropriate parameters. The RMC industry is likely to become more professional, with unethical practices reducing. More cement companies are envisaged to forward integrate into the RMC business. Large/ reputed RMC companies can also backward integrate by taking control of important raw materials used to make the product. This will enable them to have strategic control over input material, reduce their input material costs and increase their EBIDTA margins. The share of RMC in the PRMC (Potential RMC) market is likely to increase from the current 29 % to around 36 - 52 % by FY 2012. RMC industry is also likely to see an upward trend in prices as RMC’s share increases relative to the NRMC (Non RMC) share. Despite this optimistic future, there will also be a need to undertake cost-reduction exercises to gain competitiveness and improve the bottom line.

07101 3.1
CHAPTER 3: ZONAL MARKET PROFILES
MUMBAI CITY Mumbai City comprises of Dadar, Nariman Point, Sion, Vikhroli, Andheri, Juhu, Malad, Kandivali, Borivali, etc.
Population (2007 est.) 13,329,700
Population Growth pa 2.6 %
Cement Consumption p.m. (FY 07)
208,000 t
Concrete Consumption p.m. (FY 07)
391,945 cum
Market Overview The construction activities are taking place in almost all areas in this zonal market. Major builders and developers like Lodhas, Rahejas, Godrej Properties, etc., have started new projects in this zone. In Parel, 30 old textile mills have been bought over by major builders and would soon be demolished to give way for new multistory residential as well as commercial projects. Apart from this, Bandra- Kurla Complex is another sort-after destination for construction of corporate offices and five star hotels, due to its vicinity to the airport. Infrastructure development is also in taking place in this zonal market. Mumbai Metropolitan Region Development Authority (MMRDA) has started converting all the bitumen roads to concrete roads. New flyovers are being constructed, both on the Eastern as well as Western Expressway to reduce the existing high traffic congestion. To facilitate further smooth-flow of traffic, a sea link project is being undertaken by Maharashtra State Road Development Corporation (MSRDC), which would connect Bandra to Worli and another trans-harbour sea link project is being planned from Sevri to Nhava (in Navi Mumbai). Construction activities are envisaged to accelerate in the coming years. One of the major projects in this region would be the Slum Rehabilitation Program at Dharavi. The slums in Dharavi are believed to Asia’s largest slums, and this area is planned to be rehabilitated by developing 5 new self-sufficient townships at an estimated cost of Rs 9,250 Crores. Apart from the above, private builders and developers have also planned new multistory residential and commercial projects in this zone.
Mumbai City

07101 3.2
Cement Consumption Segment-wise (FY 2007, t/ month)
20,80052,000
135,200
0
40,000
80,000
120,000
160,000
IHB Institutional Infrastructure
Cement Spend/ month IHB: Rs 10.2 Crores Institutional: Rs 63.5 Crores Infrastructure: Rs 24.4 Crores
Concrete Consumption Segment-wise (FY 2007, cu m/ month)
23,110
230,650
138,185
0
80,000
160,000
240,000
IHB Institutional Infrastructure
Concrete Spend/ month IHB: Rs 6.9 Crores Institutional: Rs 85.6 Crores Infrastructure: Rs 44.6 Crores
RMC Consumption Segment-wise (per month) (Volume in cu m and Spend in Rs ‘000)
121,750
503,680
0
150,000
300,000
450,000
Volume Spend
Details Individual House
Builders Institutional
Segment Infrastructure
Segment Most Used Concrete Grade M 25 M 30 & M 40 M 40 RMC Awareness Level Medium High High
Influencer for RMC usage House Owner, Contractor
Contractor, Architect
Structural Consultant
Decision Maker for RMC usage
House Owner, Contractor Client, Architect Structural
Consultant
Suppliers of Concrete On Site Mixed
Concrete (OMC), RMC
Batching Plants, RMC
Batching Plants, RMC

07101 3.3
Average Cost of Concrete per cu m Grade
Produced By M 25 M 30 & M 40 M 40
On Site Mix Rs 2,950 – 3,000 N/a N/a Batching Plant-Institutional N/a Rs 3,350 – 3,400 N/a Batching Plant-Infrastructure N/a N/a Rs 3,400 – 3,450 RMC Delivered Prices (approximate prices in Rs of popular grades using OPC)
3650 3800 4000 4250 4450
2000
3200
4400
5600
M-20 M-25 M-30 M-35 M-40
Prices are inclusive of:
12.5 % VAT Transportation Pumping
RMC Delivered Prices (approximate prices in Rs of popular grades using PPC)
3800 3950 4150 4400 4600
2000
3200
4400
5600
M-20 M-25 M-30 M-35 M-40
Prices are inclusive of:
12.5 % VAT Transportation Pumping

07101 3.4
RMC Product Life Cycle
Hypothesis Testing (Results given are based on the maximum number of replies)
Segments Hypothesis IHB Institutional Infrastructure
RMC quality is better than OMC
OMC and RMC perceived to be of same quality
NA NA
RMC quality is better than that concrete produced by batching plants
NA
Batching plant concrete and RMC perceived to be of same quality
Batching plant concrete and RMC perceived to be of same quality
Using RMC reduces the time taken to build a house/ complex The price of RMC is worth the quality RMC is over-priced Does using RMC lead to reduced inventories, storage at site, wastage and labour cost
Would you consume RMC if the price was reduced
RM
C a
s pe
rcen
tage
of C
oncr
ete GROWTH
STAGE
ENTRY STAGE
FY 2007
DECLINE STAGE
Mumbai City
SATURATION STAGE

07101 3.5
Facilitating and Hindering Factors Facilitating Factors
Awareness in the institutional and infrastructure segments Construction of large scale housing & commercial projects as well as infrastructure
projects Presence of RMC players Perception that RMC supply reduces the time taken for project execution Perception that RMC supply reduces inventory Credit facility offered by RMC suppliers (approx. 30 days) No traffic restrictions on the movement of Transit Mixers during daytime, except in
areas in and around Dadar (Heavy vehicle movement in this area is restricted from 8:00 AM till 12:00 PM and 5:00 PM till 8:00 PM)
Hindering Factors
Higher delivered price of RMC, compared to concrete produced by batching plants Owning a batching plant by a contractor is a prerequisite, in most cases, to qualify for
infrastructure project Preference of institutional and infrastructure segment to consume concrete produced
by their own batching plants over RMC Inability of RMC players to supply concrete at short notices High traffic congestion in the zone The concrete carrying capacity of a transit mixer has been limited to 5 cu m, instead of
6 – 7 cu m, as per the traffic regulations Objection by residents against night time concreting work.

07101 3.6
NAVI MUMBAI
Navi Mumbai comprises of Belapur, Nerul, Vashi, Turbhe, Koparkhairane, Ghansoli, Airoli, Digha, Raigarh etc.
Population (2007 est.) 997,800
Population Growth pa 6.9 %
Cement Consumption p.m. (FY 07)
208,000 t
Concrete Consumption p.m. (FY 07)
352,695 cum
Market Overview Navi Mumbai is the satellite twin city of Mumbai City and is considered as the world’s largest planned city. Currently, most of the development is in the northern part of this zone. Private builders and developers are constructing residential and commercial projects in areas like Nerul, Vashi, etc. City and Industrial Development Corporation (CIDCO) has planned a new mass residential project “Seawood Estate”, which will have around 2,000 apartments. Apart from this, a new International Airport is also planned at Panvel. The construction of the airport is expected to start by 2008. Reliance Industries has also planned its Special Economic Zone (SEZ) in this zone. The work for this project is expected to start by the end of this year (2007). The SEZ is planned to be spread over 3,200 acres and is expected to be developed at an investment cost of Rs 25,000 Crores. A six-lane harbour sea link road would connect this SEZ to the Mumbai City and is estimated to cost Rs 4,000 Crores. Looking at the planned development of this zone, Navi Mumbai is envisaged to experience massive growth in construction activities in the future.
Navi Mumbai

07101 3.7
Cement Consumption Segment-wise (FY 2007, t/ month)
114,400
31,200
62,400
0
40,000
80,000
120,000
160,000
IHB Institutional Infrastructure
Cement Spend/ month IHB: Rs 30.6 Crores Institutional: Rs 53.8 Crores Infrastructure: Rs 14.7 Crores
Concrete Consumption Segment-wise (FY 2007, cu m/ month)
69,335 82,910
200,450
0
80,000
160,000
240,000
IHB Institutional Infrastructure
Concrete Spend/ month IHB: Rs 20.6 Crores Institutional: Rs 69.5 Crores Infrastructure: Rs 26.3 Crores
RMC Consumption Segment-wise (per month) (Volume in cu m and Spend in Rs ‘000)
33,225
136,495
0
40,000
80,000
120,000
Volume Spend
Details Individual House
Builders Institutional
Segment Infrastructure
Segment Most Used Concrete Grade M 25 M 30 & M 40 M 40 RMC Awareness Level Medium High High
Influencer for RMC usage House Owner, Contractor
Contractor, Architect
Structural Consultant
Decision Maker for RMC usage
House Owner, Contractor Client, Architect Structural
Consultant
Suppliers of Concrete On Site Mixed
Concrete (OMC), RMC
Batching Plants, RMC
Batching Plants, RMC

07101 3.8
Average Cost of Concrete per cu m Grade
Produced By M 25 M 30 & M 40 M 40
On Site Mix Rs 2,950 – 3,000 N/a N/a Batching Plant-Institutional N/a Rs 3,350 – 3,400 N/a Batching Plant-Infrastructure N/a N/a Rs 3,400 – 3,450 RMC Delivered Prices (approximate prices in Rs of popular grades using OPC)
3550 3700 3900 4150 4350
2000
3200
4400
5600
M-20 M-25 M-30 M-35 M-40
Prices are inclusive of:
12.5 % VAT Transportation Pumping
RMC Delivered Prices (approximate prices in Rs of popular grades using PPC)
3700 3850 4050 4300 4500
2000
3200
4400
5600
M-20 M-25 M-30 M-35 M-40
Prices are inclusive of:
12.5 % VAT Transportation Pumping

07101 3.9
RMC Product Life Cycle
Hypothesis Testing (Results given are based on the maximum number of replies)
Segments Hypothesis IHB Institutional Infrastructure
RMC quality is better than OMC
OMC and RMC perceived to be of same quality
NA NA
RMC quality is better than that concrete produced by batching plants
NA
Batching plant concrete and RMC perceived to be of same quality
Batching plant concrete and RMC perceived to be of same quality
Using RMC reduces the time taken to build a house/ complex The price of RMC is worth the quality RMC is over-priced Does using RMC lead to reduced inventories, storage at site, wastage and labour cost
Would you consume RMC if the price was reduced
RM
C a
s pe
rcen
tage
of C
oncr
ete GROWTH
STAGE
ENTRY STAGE
FY 2007
DECLINE STAGE
Navi Mumbai
SATURATION STAGE

07101 3.10
Facilitating and Hindering Factors Facilitating Factors
Awareness in the institutional and infrastructure segments Construction of large scale housing & commercial projects as well as infrastructure
projects Presence of RMC players Perception that RMC supply reduces the time taken for project execution Perception that RMC supply reduces inventory Credit facility offered by RMC suppliers (approx. 30 days) No traffic restrictions on the movement of transit mixers during daytime No traffic congestion
Hindering Factors
Higher delivered price of RMC, compared to concrete produced by batching plants OMC cost is lower than the delivered RMC price thus, there is a low willingness to use
RMC Owning a batching plant by a contractor is a prerequisite to qualify for infrastructure
project Preference of institutional and infrastructure segment to consume concrete produced
by their own batching plants over RMC The concrete carrying capacity of a transit mixer has been limited to 5 cu m, instead of
6 – 7 cu m, as per the traffic regulations Inability of RMC players to supply concrete at short notices Inability to deliver small quantities of RMC to IHB segment

07101 3.11
THANE
Thane comprises of Ghodbunder Road, Mumbra, Kalwa, Wagle Estate, Kopri, Gawand Baug, etc.
Population (2007 est.) 1,641,300
Population Growth pa 5.1 %
Cement Consumption p.m. (FY 07)
104,000 t
Concrete Consumption p.m. (FY 07)
169,390 cum
Market Overview The major construction activity in Thane is taking place along Ghodbander Road. Builders and developers are undertaking multistory residential projects in this area. Hiranadani Estate, a modern township, is being developed by Hiranadani Developers in this zone. Some of the major infrastructure projects expected in the near future include a international airport over 1,800 acres of land and a Mass Rapid Transport System (MRTS). Maharashtra State Road Development Corporation has been appointed as a nodal agency for carrying out the necessary studies and finally implementing the MRTS project. Major builders and developers are constructing residential and commercial buildings/ projects in this zone. The construction related development in this zone is expected to continue and is envisaged to grow further in the coming years.
Cement Consumption Segment-wise (FY 2007, t/ month)
62,400
10,400
31,200
0
20,000
40,000
60,000
80,000
IHB Institutional Infrastructure
Cement Spend/ month IHB: Rs 15.3 Crores Institutional: Rs 29.3 Crores Infrastructure: Rs 4.9 Crores
Thane

07101 3.12
Concrete Consumption Segment-wise (FY 2007, cu m/ month)
107,090
27,63534,665
0
50,000
100,000
150,000
IHB Institutional Infrastructure
Concrete Spend/ month IHB: Rs 10.3 Crores Institutional: Rs 37.0 Crores Infrastructure: Rs 8.5 Crores
RMC Consumption Segment-wise (per month) (Volume in cu m and Spend in Rs ‘000)
48,390
11,600
0
18,000
36,000
54,000
Volume Spend
Details Individual House
Builders Institutional
Segment Infrastructure
Segment Most Used Concrete Grade M 25 M 30 & M 40 M 40 RMC Awareness Level Medium High High
Influencer for RMC usage House Owner, Contractor
Contractor, Architect
Structural Consultant
Decision Maker for RMC usage
House Owner, Contractor Client, Architect Structural
Consultant
Suppliers of Concrete On Site Mixed
Concrete (OMC), RMC
Batching Plants, RMC
Batching Plants, RMC
Average Cost of Concrete per cu m Grade
Produced By M 25 M 30 & M 40 M 40
On Site Mix Rs 2,950 – 3,000 N/a N/a Batching Plant-Institutional N/a Rs 3,350 – 3,400 N/a Batching Plant-Infrastructure N/a N/a Rs 3,400 – 3,450

07101 3.13
RMC Delivered Prices (approximate prices in Rs of popular grades using OPC)
3650 3800 4000 4250 4450
2000
3200
4400
5600
M-20 M-25 M-30 M-35 M-40
Prices are inclusive of:
12.5 % VAT Transportation Pumping
RMC Delivered Prices (approximate prices in Rs of popular grades using PPC)
3800 3950 4150 4400 4600
2000
3200
4400
5600
M-20 M-25 M-30 M-35 M-40
Prices are inclusive of:
12.5 % VAT Transportation Pumping
RMC Product Life Cycle
RM
C a
s pe
rcen
tage
of C
oncr
ete GROWTH
STAGE
ENTRY STAGE
FY 2007
DECLINE STAGE
Thane
SATURATION STAGE
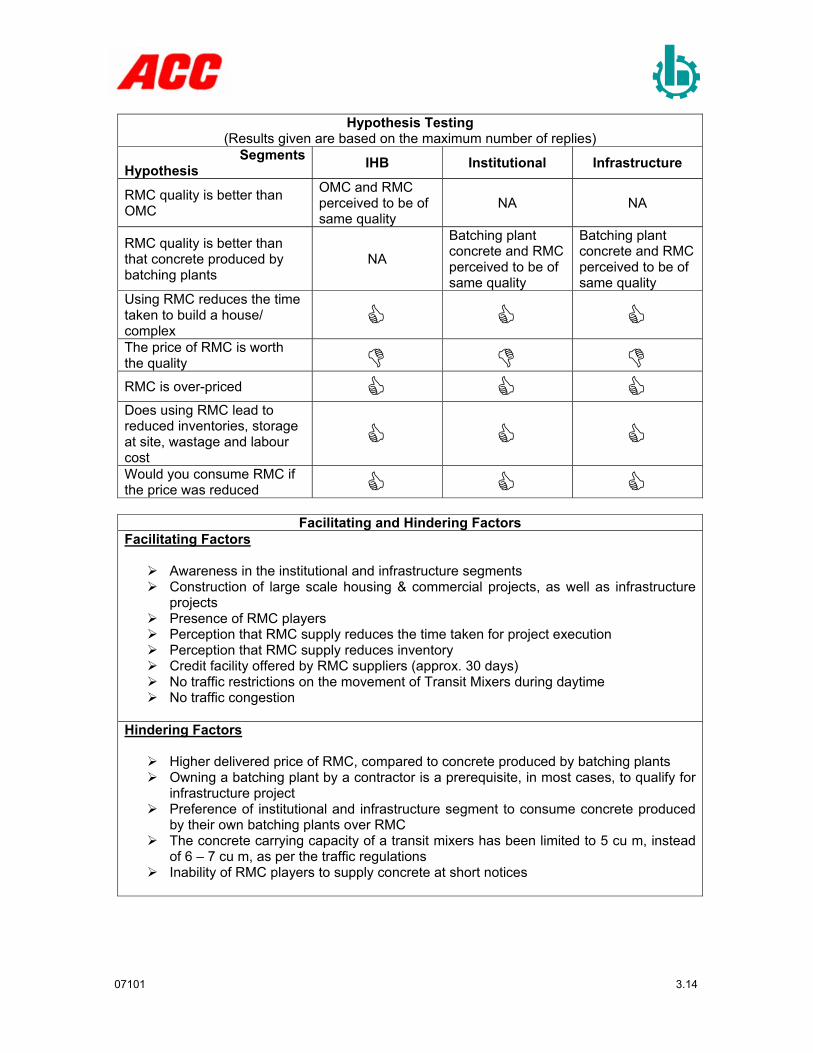
07101 3.14
Hypothesis Testing (Results given are based on the maximum number of replies)
Segments Hypothesis IHB Institutional Infrastructure
RMC quality is better than OMC
OMC and RMC perceived to be of same quality
NA NA
RMC quality is better than that concrete produced by batching plants
NA
Batching plant concrete and RMC perceived to be of same quality
Batching plant concrete and RMC perceived to be of same quality
Using RMC reduces the time taken to build a house/ complex The price of RMC is worth the quality RMC is over-priced Does using RMC lead to reduced inventories, storage at site, wastage and labour cost
Would you consume RMC if the price was reduced
Facilitating and Hindering Factors Facilitating Factors
Awareness in the institutional and infrastructure segments Construction of large scale housing & commercial projects, as well as infrastructure
projects Presence of RMC players Perception that RMC supply reduces the time taken for project execution Perception that RMC supply reduces inventory Credit facility offered by RMC suppliers (approx. 30 days) No traffic restrictions on the movement of Transit Mixers during daytime No traffic congestion
Hindering Factors
Higher delivered price of RMC, compared to concrete produced by batching plants Owning a batching plant by a contractor is a prerequisite, in most cases, to qualify for
infrastructure project Preference of institutional and infrastructure segment to consume concrete produced
by their own batching plants over RMC The concrete carrying capacity of a transit mixers has been limited to 5 cu m, instead
of 6 – 7 cu m, as per the traffic regulations Inability of RMC players to supply concrete at short notices

07101 4.1
CHAPER 4: PLANT PROFILES
ACC RMC
Group ACC
Group’s Main Business Cement
Plant Name ACC Ready Mix
Plant Location Sion
Plant Type In Line Bin
Plant Capacity 120 cu m/ hr
Average Monthly Production 7,000 cu m
Markets Serviced Mumbai City (Sion, Chembur, Kurla, Matunga, Andheri, Parel, etc)
M-2520%
M-4010%
M-3510% M-20
10%
M-1515%
M-3035%
Product Mix
10%
15%
75%
Individuals
Institutions
Infrastructure
Customer Segmentation
39303750
35703390
3260
310033003500370039004100
M-20 M-25 M-30 M-35 M-40
Average Delivered Prices (OPC based RMC)
(In Rs. per cu m, excluding taxes)
33903520
37003880
4060
320034003600380040004200
M-20 M-25 M-30 M-35 M-40
Average Delivered Prices (PPC based RMC)
(In Rs. per cu m, excluding taxes)

07101 4.2
NOTE: Prices for both OPC and PPC based RMC are given as both OPC and PPC are used in approximately equal quantities to manufacture concrete by RMC plants in Greater Mumbai. Transport Leads Average distance to markets: 15 -20 Kms Average time to markets: 1 – 1.5 hrs Tax Rate 12.5 % VAT There are 28 transit mixers of 7 cu m each and 4 line pumps. These are collectively used with ACC Jogeshwari plant (dedicated plant for Jogeshwari-Vikhorli Link Road project). ACC also has 1 boom pump which is utilized by all the four ACC RMC plants. Additional information: Raw Material Sources:
Cement: ACC. Believed to be sourced at approx. price of Rs. 230 – Rs. 240 per bag (including taxes).
Sand: Vaitarna and Mahad. Sourced at approx. Rs. 23 – Rs. 25 per cu ft. Aggregates: Turbhe. Sourced at approx. Rs. 17 – Rs. 19 per cu ft. Admixture: SWC and Choksey. Sourced at approx. Rs. 25 per Kg.

07101 4.3
ACC RMC
Group ACC
Group’s Main Business Cement
Plant Name ACC Ready Mix
Plant Location Deonar
Plant Type In Line Bin
Plant Capacity 120 cu m/ hr
Average Monthly Production 7,600 cu m
Markets Serviced
Mumbai City (Deonar, Chembur, Ghatkopar, Nerul, etc)
M-3050%
M-4015%
M-205%
M-105%
M-3525%
Product Mix
40%
60%Institutions
Infrastructure
Customer Segmentation
39303750
35703390
3260
310033003500370039004100
M-20 M-25 M-30 M-35 M-40
Average Delivered Prices (OPC based RMC)
(In Rs. per cu m, excluding taxes)
33903520
37003880
4060
320034003600380040004200
M-20 M-25 M-30 M-35 M-40
Average Delivered Prices (PPC based RMC)
(In Rs. per cu m, excluding taxes) NOTE: Prices for both OPC and PPC based RMC are given as both OPC and PPC are used in approximately equal quantities to manufacture concrete by RMC plants in Greater Mumbai. Transport Leads Average distance to markets: 15 -20 Kms Average time to markets: 1 – 1.5 hrs Tax Rate 12.5 % VAT

07101 4.4
There are 23 transit mixers of 7 cu m each and 2 line pumps. ACC also has 1 boom pump which is utilized by all the four ACC RMC plants. Additional information: Raw Material Sources:
Cement: ACC. Believed to be sourced at approx. price of Rs. 230 – Rs. 240 per bag (including taxes).
Sand: Vaitarna and Mahad. Sourced at approx. Rs. 23 – Rs. 25 per cu ft. Aggregates: Turbhe. Sourced at approx. Rs. 17 – Rs. 19 per cu ft. Admixture: SWC and Choksey. Sourced at approx. Rs. 25 per Kg.

07101 4.5
ACC RMC Group ACC
Group’s Main Business Cement
Plant Name ACC Ready Mix
Plant Location Apollo Mills, Lower Parel
Plant Type In Line Bin
Plant Capacity 60 cu m/ hr
Average Monthly Production
5,200 cu m (50 % of this production is dedicated for the Apollo project. 100 % of production considered as RMC sale)
Markets Serviced Mumbai City (Parel, Dadar, etc)
M3510%
M4510%
M3050%
M2520%M40
10%
Product Mix
10%
15%
75%
Individuals
Institutions
Infrastructure
Customer Segmentation
39303750
35703390
3260
310033003500370039004100
M-20 M-25 M-30 M-35 M-40
Average Delivered Prices (OPC based RMC)
(In Rs. per cu m, excluding taxes)
33903520
37003880
4060
320034003600380040004200
M-20 M-25 M-30 M-35 M-40
Average Delivered Prices (PPC based RMC)
(In Rs. per cu m, excluding taxes) NOTE: Prices for both OPC and PPC based RMC are given as both OPC and PPC are used in approximately equal quantities to manufacture concrete by RMC plants in Greater Mumbai.

07101 4.6
Transport Leads Average distance to markets: 15 -20 Kms Average time to markets: 1 – 1.5 hrs Tax Rate 12.5 % VAT There are 8 transit mixers of 7 cu m each, 1 line pump. ACC also has 1 boom pump which is utilized by all the four ACC RMC plants. Additional information: Raw Material Sources:
Cement: ACC. Believed to be sourced at approx. price of Rs. 230 – Rs. 240 per bag (including taxes).
Sand: Vaitarna and Mahad. Sourced at approx. Rs. 23 – Rs. 25 per cu ft. Aggregates: Turbhe. Sourced at approx. Rs. 17 – Rs. 19 per cu ft. Admixture: SWC and Choksey. Sourced at approx. Rs. 25 per Kg.

07101 4.7
ACC RMC
Group ACC
Group’s Main Business Cement
Plant Name ACC Ready Mix
Plant Location JVLR
Plant Type In Line Bin
Plant Capacity 120 cu m/ hr
Average Monthly Production
5,200 cu m (100 % of this production is dedicated for the JVLR project. 100 % of production considered as RMC sale)
Markets Serviced Not applicable
M3015%
M4025%
M2520%
M2015%
M3525%
Product Mix
100%Infrastructure
Customer Segmentation
Data not available as this plant is 100 % dedicated for the project
Average Delivered Prices
(In Rs. per cu m, excluding taxes) Transport Leads Average distance to markets: Not applicable Average time to markets: Not applicable Tax Rate Not applicable There are 28 transit mixers of 7 cu m each and 4 line pumps. These are collectively used with ACC Sion plant. ACC also has 1 boom pump which is utilized by all the four ACC RMC plants.

07101 4.8
Additional information: Raw Material Sources:
Cement: ACC. Believed to be sourced at approx. price of Rs. 230 – Rs. 240 per bag (including taxes).
Sand: Vaitarna and Mahad. Sourced at approx. Rs. 23 – Rs. 25 per cu ft. Aggregates: Turbhe. Sourced at approx. Rs. 17 – Rs. 19 per cu ft. Admixture: SWC and Choksey. Sourced at approx. Rs. 25 per Kg.

07101 4.9
ABL RMC
Group Ashoka Buildcon Ltd.
Group’s Main Business Construction
Plant Name Ashoka RMC
Plant Location Wadala
Plant Type In Line Bin
Plant Capacity 90 cu m/ hr
Average Monthly Production
10,000 cu m (60 % of this production is dedicated for its own project. 40 % of production considered as RMC sale)
Markets Serviced
Mumbai City (Andheri, Vikhroli, Chembur, Dadar, Parel, Byculla, etc)
M305%
M455%
M4035%
M255%
M2010%
M3540%
Product Mix
90%
10%
Instutional
Infrastructure
Customer Segmentation
38403660
34803300
3170
300032003400360038004000
M-20 M-25 M-30 M-35 M-40
Average Delivered Prices (OPC based RMC)
(In Rs. per cu m, excluding taxes)
33003430
36103790
3970
310033003500370039004100
M-20 M-25 M-30 M-35 M-40
Average Delivered Prices (PPC based RMC)
(In Rs. per cu m, excluding taxes) NOTE: Prices for both OPC and PPC based RMC are given as both OPC and PPC are used in approximately equal quantities to manufacture concrete by RMC plants in Greater Mumbai.

07101 4.10
Transport Leads Average distance to markets: 15 –20 Kms Average time to markets: 1 – 1.5 hrs Tax Rate 12.5 % VAT There are 20 transit mixers of 7 cu m each and 3 line pumps. Additional information: Raw Material Sources:
Cement: Ambuja and UltraTech. Believed to be sourced at approx. price of Rs. 230 – Rs. 240 per bag (including taxes).
Sand: Vaitarna. Sourced at approx. Rs. 23 – Rs. 25 per cu ft. Aggregates: Turbhe. Sourced at approx. Rs. 17 – Rs. 19 per cu ft. Admixture: BASF. Sourced at approx. Rs. 25 per Kg.

07101 4.11
Chirag Ready Mix
Group Chirag Construction
Group’s Main Business Construction
Plant Name Chirag RMC
Plant Location Deonar
Plant Type In Line Bin
Plant Capacity 60 cu m/ hr
Average Monthly Production
6,000 cu m (10 % of this production is dedicated for its own project. 90 % of production considered as RMC sale)
Markets Serviced Mumbai City (Deonar, Chembur, Ghatkopar, Nerul, etc)
M-3040%
M-4030%
M-2510%
M-2010%
M-3510%
Product Mix
90%
10%
Instutional
Infrastructure
Customer Segmentation
38403660
34803300
3170
300032003400360038004000
M-20 M-25 M-30 M-35 M-40
Average Delivered Prices (OPC based RMC)
(In Rs. per cu m, excluding taxes)
33003430
36103790
3970
310033003500370039004100
M-20 M-25 M-30 M-35 M-40
Average Delivered Prices (PPC based RMC)
(In Rs. per cu m, excluding taxes) NOTE: Prices for both OPC and PPC based RMC are given as both OPC and PPC are used in approximately equal quantities to manufacture concrete by RMC plants in Greater Mumbai.

07101 4.12
Transport Leads Average distance to markets: 15 -20 Kms Average time to markets: 1 – 1.5 hrs Tax Rate 12.5 % VAT There are 17 transit mixers of 7 cu m each and 3 line pumps. These are collectively used with Chirag Kandivali plant. Additional information: Raw Material Sources:
Cement: Ambuja and UltraTech. Believed to be sourced at approx. price of Rs. 230 – Rs. 240 per bag (including taxes).
Sand: Vaitarna. Sourced at approx. Rs. 23 – Rs. 25 per cu ft. Aggregates: Turbhe. Sourced at approx. Rs. 17 – Rs. 19 per cu ft. Admixture: Supaplast. Sourced at approx. Rs. 25 per Kg.

07101 4.13
Chirag Ready Mix
Group Chirag Construction
Group’s Main Business Construction
Plant Name Chirag RMC
Plant Location Kandivali
Plant Type Star
Plant Capacity 30 cu m/ hr
Average Monthly Production
4,500 cu m (80 % of this production is dedicated for its own project. 20 % of production considered as RMC sale)
Markets Serviced
Mumbai City (Kandivali, Goregaon, Malad, Borivali, Dahisar, etc)
M-3040%
M-4030%
M-2510%
M-2010%
M-3510%
Product Mix
10%
15%
75%
Individuals
Institutions
Infrastructure
Customer Segmentation
35903465
3280
3,100
3,300
3,500
3,700
3,900
M30 M35 M40
Average Delivered Prices (OPC based RMC)
(In Rs. per cu m, including 10 % profit margin on cost of concrete)
34353530
3695
3,300
3,500
3,700
3,900
M30 M35 M40
Average Delivered Prices (PPC based RMC)
(In Rs. per cu m, including 10 % profit margin on cost of concrete)

07101 4.14
NOTE: Prices for both OPC and PPC based RMC are given as both OPC and PPC are used in approximately equal quantities to manufacture concrete by RMC plants in Greater Mumbai. Transport Leads Average distance to markets: 15 -20 Kms Average time to markets: 1 – 1.5 hrs
Tax Rate No VAT charged since this is a dedicated plant which also sells RMC to other builders (at times without proper paperwork).
There are 17 transit mixers of 7 cu m each and 3 line pumps (these are collectively used with Chirag’s Deonar plant). Additional information: Raw Material Sources:
Cement: Ambuja and UltraTech. Believed to be sourced at approx. price of Rs. 230 – Rs. 240 per bag (including taxes).
Sand: Vaitarna. Sourced at approx. Rs. 23 – Rs. 25 per cu ft. Aggregates: Turbhe. Sourced at approx. Rs. 17 – Rs. 19 per cu ft. Admixture: Supaplast. Sourced at approx. Rs. 25 per Kg.

07101 4.15
Godrej
Group Godrej & Boyce Mfg. Co. Ltd. (Construction Division)
Group’s Main Business Construction
Plant Name Godrej Ready Mix Concrete
Plant Location Vikhroli
Plant Type In Line Bin
Plant Capacity 90 cu m/ hr
Average Monthly Production 6,000 cu m
Markets Serviced Mumbai City (Bhandup, Mulund, Vikroli, Chembur, Andheri, etc)
M4040%
M3060%
Product Mix
10%
15%
75%
Individuals
Institutions
Infrastructure
Customer Segmentation
38403660
34803300
3170
300032003400360038004000
M-20 M-25 M-30 M-35 M-40
Average Delivered Prices OPC based RMC)
(In Rs. per cu m, excluding taxes)
33003430
36103790
3970
310033003500370039004100
M-20 M-25 M-30 M-35 M-40
Average Delivered Prices (PPC based RMC)
(In Rs. per cu m, excluding taxes) NOTE: Prices for both OPC and PPC based RMC are given as both OPC and PPC are used in approximately equal quantities to manufacture concrete by RMC plants in Greater Mumbai. Transport Leads Average distance to markets: 15 -20 Kms Average time to markets: 1 – 1.5 hrs

07101 4.16
Tax Rate 12.5 % VAT There are 22 transit mixers of 7 cu m each and 5 line pumps (these are collectively used with Godrej Byculla plant). Additional information: Raw Material Sources:
Cement: Ambuja and UltraTech. Believed to be sourced at approx. price of Rs. 230 – Rs. 240 per bag (including taxes).
Sand: Vaitarna. Sourced at approx. Rs. 23 – Rs. 25 per cu ft. Aggregates: Turbhe. Sourced at approx. Rs. 17 – Rs. 19 per cu ft. Admixture: BASF and Sika. Sourced at approx. Rs. 25 per Kg.

07101 4.17
Godrej
Group Godrej & Boyce Mfg. Co. Ltd. (Construction Division)
Group’s Main Business Construction
Plant Name Godrej Ready Mix Concrete
Plant Location Byculla
Plant Type In Line Bin
Plant Capacity 60 cu m/ hr
Average Monthly Production
3,500 cu m (70 % of this production is dedicated for its own project. 30 % of production considered as RMC sale)
Markets Serviced Mumbai City (Parel and Dadar)
M4040%
M3060%
Product Mix
10%
15%
75%
Individuals
Institutions
Infrastructure
Customer Segmentation
38403660
34803300
3170
300032003400360038004000
M-20 M-25 M-30 M-35 M-40
Average Delivered Prices (OPC based RMC)
(In Rs. per cu m, excluding taxes)
33003430
36103790
3970
310033003500370039004100
M-20 M-25 M-30 M-35 M-40
Average Delivered Prices (PPC based RMC)
(In Rs. per cu m, excluding taxes) NOTE: Prices for both OPC and PPC based RMC are given as both OPC and PPC are used in approximately equal quantities to manufacture concrete by RMC plants in Greater Mumbai.

07101 4.18
Transport Leads Average distance to markets: 15 -20 Kms Average time to markets: 1 – 1.5 hrs Tax Rate 12.5 % VAT There are 22 transit mixers of 7 cu m each and 5 line pumps These are collectively used with Godrej Vikroli plant. Additional information: Raw Material Sources:
Cement: Ambuja and UltraTech. Believed to be sourced at approx. price of Rs. 230 – Rs. 240 per bag (including taxes).
Sand: Vaitarna. Sourced at approx. Rs. 23 – Rs. 25 per cu ft. Aggregates: Turbhe. Sourced at approx. Rs. 17 – Rs. 19 per cu ft. Admixture: BASF and Sika. Sourced at approx. Rs. 25 per Kg.

07101 4.19
Instacrete
Group Prime Builders
Group’s Main Business Construction
Plant Name Prime Instacrete
Plant Location Wadala
Plant Type Star
Plant Capacity 30 cu m/ hr
Average Monthly Production
4,500 cu m (60 % of this production is dedicated for its own projects. 40 % of production considered as RMC sale)
Markets Serviced Mumbai City (Andheri, Vikroli, Chembur, Dadar, Parel, Byculla, etc)
M3040%
M4040%
M255%
M205%
M3510%
Product Mix
100%Instutional
Customer Segmentation
35903465
3280
3,100
3,300
3,500
3,700
3,900
M30 M35 M40
Average Delivered Prices (OPC based RMC)
(In Rs. per cu m, including 10 % profit margin on cost of concrete)
34353530
3695
3,300
3,500
3,700
3,900
M30 M35 M40
Average Delivered Prices (PPC based RMC)
(In Rs. per cu m, including 10 % profit margin on cost of concrete)

07101 4.20
NOTE: Prices for both OPC and PPC based RMC are given as both OPC and PPC are used in approximately equal quantities to manufacture concrete by RMC plants in Greater Mumbai. Transport Leads Average distance to markets: 15 -20 Kms Average time to markets: 1 – 1.5 hrs
Tax Rate No VAT charged since this is a dedicated plant which also sells RMC to other builders (at times without proper paperwork).
There are 8 transit mixers of 7 cu m each and 2 line pumps. Additional information: Raw Material Sources:
Cement: Ambuja. Believed to be sourced at approx. price of Rs. 230 – Rs. 240 per bag (including taxes).
Sand: Vaitarna and Mahad. Sourced at approx. Rs. 23 – Rs. 25 per cu ft. Aggregates: Turbhe. Sourced at approx. Rs. 17 – Rs. 19 per cu ft. Admixture: SWC. Sourced at approx. Rs. 25 per Kg.

07101 4.21
L & T Concrete
Group Larsen & Toubro Ltd.
Group’s Main Business Construction
Plant Name L&T Concrete
Plant Location Powai
Plant Type Star
Plant Capacity 30 cu m/ hr
Average Monthly Production 7,500 cu m
Markets Serviced
Mumbai City (Hiranandani Garden, Powai, Andheri, Aarey Colony, etc)
M3035%
M4025%
M2515%
M2010%
M3515%
Product Mix
100%Instutional
Customer Segmentation
39803800
36203440
3310
3200
3400
3600
3800
4000
M-20 M-25 M-30 M-35 M-40
Average Delivered Prices (OPC based RMC)
(In Rs. per cu m, excluding taxes)
34403570
37503930
4110
320034003600380040004200
M-20 M-25 M-30 M-35 M-40
Average Delivered Prices (PPC based RMC)
(In Rs. per cu m, excluding taxes) NOTE: Prices for both OPC and PPC based RMC are given as both OPC and PPC are used in approximately equal quantities to manufacture concrete by RMC plants in Greater Mumbai. Transport Leads Average distance to markets: 15 -20 Kms Average time to markets: 1 – 1.5 hrs

07101 4.22
Tax Rate 12.5 % VAT There are 78 transit mixers of 7 cu m each, 19 line pumps and 1 boom pump. These are collectively used by all the L&T RMC plants. Additional information: Raw Material Sources:
Cement: Ambuja and UltraTech. Believed to be sourced at approx. price of Rs. 230 – Rs. 240 per bag (including taxes).
Sand: Vaitarna. Sourced at approx. Rs. 23 – Rs. 25 per cu ft. Aggregates: Vasai. Sourced at approx. Rs. 17 – Rs. 19 per cu ft. Admixture: BASF and SWC. Sourced at approx. Rs. 25 per Kg.

07101 4.23
L & T Concrete
Group Larsen & Toubro Ltd.
Group’s Main Business Construction
Plant Name L&T Concrete
Plant Location Wadala
Plant Type Inline Bin
Plant Capacity 60 cu m/ hr
Average Monthly Production 9,500 cu m
Markets Serviced Mumbai city Zone (Andheri, Vikroli, Chembur, Dadar, Parel, Byculla, etc)
M-305%
M-455%
M-4035%
M-255%
M-2010%
M-3540%
Product Mix
10%
15%
75%
Individuals
Institutions
Infrastructure
Customer Segmentation
39803800
36203440
3310
3200
3400
3600
3800
4000
M-20 M-25 M-30 M-35 M-40
Average Delivered Prices (OPC based RMC)
(In Rs. per cu m, excluding taxes)
34403570
37503930
4110
320034003600380040004200
M-20 M-25 M-30 M-35 M-40
Average Delivered Prices (PPC based RMC)
(In Rs. per cu m, excluding taxes) NOTE: Prices for both OPC and PPC based RMC are given as both OPC and PPC are used in approximately equal quantities to manufacture concrete by RMC plants in Greater Mumbai. Transport Leads Average distance to markets: 15 -20 Kms Average time to markets: 1 – 1.5 hrs Tax Rate 12.5 % VAT

07101 4.24
There are 78 transit mixers of 7 cu m each, 19 line pumps and 1 boom pump. These are collectively used by all the L&T RMC plants. Additional information: Raw Material Sources:
Cement: Ambuja and UltraTech. Believed to be sourced at approx. price of Rs. 230 – Rs. 240 per bag (including taxes).
Sand: Vaitarna and Mahad . Sourced at approx. Rs. 23 – Rs. 25 per cu ft. Aggregates: Turbhe. Sourced at approx. Rs. 17 – Rs. 19 per cu ft. Admixture: BASF. Sourced at approx. Rs. 25 per Kg.

07101 4.25
L & T Concrete
Group Larsen & Toubro Ltd.
Group’s Main Business Construction
Plant Name L&T Concrete
Plant Location Dahisar
Plant Type Star
Plant Capacity 30 cu m/ hr
Average Monthly Production 7,500 cu m
Markets Serviced
Mumbai City (Dahisar, Goregaon, Borivali, Kandivali, Malad, Aarey Colony, etc)
M3035%
M4025%
M2515%
M2010%
M3515%
Product Mix
80%
20%
Instutional
Infrastructure
Customer Segmentation
39803800
36203440
3310
3200
3400
3600
3800
4000
M-20 M-25 M-30 M-35 M-40
Average Delivered Prices (OPC based RMC)
(In Rs. per cu m, excluding taxes)
34403570
37503930
4110
320034003600380040004200
M-20 M-25 M-30 M-35 M-40
Average Delivered Prices (PPC based RMC)
(In Rs. per cu m, excluding taxes) NOTE: Prices for both OPC and PPC based RMC are given as both OPC and PPC are used in approximately equal quantities to manufacture concrete by RMC plants in Greater Mumbai. Transport Leads Average distance to markets: 15 –20 Kms Average time to markets: 1 – 1.5 hrs

07101 4.26
Tax Rate 12.5 % VAT There are 78 transit mixers of 7 cu m each, 19 line pumps and 1 boom pump. These are collectively used by all L&T RMC plants. Additional information: Raw Material Sources:
Cement: Ambuja and UltraTech. Believed to be sourced at approx. price of Rs. 230 – Rs. 240 per bag (including taxes).
Sand: Vaitarna. Sourced at approx. Rs. 23 – Rs. 25 per cu ft. Aggregates: Vasai. Sourced at approx. Rs. 17 – Rs. 19 per cu ft. Admixture: BASF and SWC. Sourced at approx. Rs. 25 per Kg.

07101 4.27
L & T Concrete
Group Larsen & Toubro Ltd.
Group’s Main Business Construction
Plant Name L&T Concrete
Plant Location Goregaon
Plant Type In Line Bin
Plant Capacity 60 cu m/ hr
Average Monthly Production
5,000 cu m (100 % of this production is dedicated for a residential project. 100 % of production considered as RMC sale)
Markets Serviced Not applicable
M3035%
M4025%
M2515%
M2010%
M3515%
Product Mix
100%Instutional
Customer Segmentation
Data not available as this plant is 100 % dedicated for the project
Average Delivered Prices
(In Rs. per cu m, excluding taxes) Transport Leads Average distance to markets: Not applicable Average time to markets: Not applicable Tax Rate Not applicable There are 78 transit mixers of 7 cu m each, 19 line pumps and 1 boom pump. These are collectively used by all the L&T RMC plants.

07101 4.28
Additional information: Raw Material Sources:
Cement: Ambuja and UltraTech. Believed to be sourced at approx. price of Rs. 230 – Rs. 240 per bag (including taxes).
Sand: Vaitarna. Sourced at approx. Rs. 23 – Rs. 25 per cu ft. Aggregates: Vasai. Sourced at approx. Rs. 17 – Rs. 19 per cu ft. Admixture: BASF and SWC. Sourced at approx. Rs. 25 per Kg.

07101 4.29
RMC India
Group RMC India Ltd.
Group’s Main Business Ready Mix Concrete
Plant Name RMC India
Plant Location Kandivali
Plant Type Inline Bin
Plant Capacity 60 cu m/ hr
Average Monthly Production 5,500 cu m
Markets Serviced
Mumbai City (Kandivali, Goregaon, Malad, Borivali, Aarey Colony, etc)
M-3010%
M-455%M-40
10%
M-2550%
M-2015%
M-3510%
Product Mix
85%
15%
Instutional
Infrastructure
Customer Segmentation
39303750
35703390
3260
310033003500370039004100
M-20 M-25 M-30 M-35 M-40
Average Delivered Prices (OPC based RMC)
(In Rs. per cu m, excluding taxes)
33903520
37003880
4060
320034003600380040004200
M-20 M-25 M-30 M-35 M-40
Average Delivered Prices (PPC based RMC)
(In Rs. per cu m, excluding taxes) NOTE: Prices for both OPC and PPC based RMC are given as both OPC and PPC are used in approximately equal quantities to manufacture concrete by RMC plants in Greater Mumbai. Transport Leads Average distance to markets: 15 -20 Kms Average time to markets: 1 – 1.5 hrs

07101 4.30
Tax Rate 12.5 % VAT There are 42 transit mixers of 7 cu m each and 7 line pumps. These are collectively used by all the RMC India plants. Additional information: Raw Material Sources:
Cement: Ambuja and Haathi. Believed to be sourced at approx. price of Rs. 230 – Rs. 240 per bag (including taxes).
Sand: Vaitarna. Sourced at approx. Rs. 23 – Rs. 25 per cu ft. Aggregates: Bhiwandi. Sourced at approx. Rs. 17 – Rs. 19 per cu ft. Admixture: SWC. Sourced at approx. Rs. 25 per Kg.

07101 4.31
RMC India
Group RMC India Ltd.
Group’s Main Business Ready Mix Concrete
Plant Name RMC India
Plant Location Kurla
Plant Type Inline Bin
Plant Capacity 60 cu m/ hr
Average Monthly Production 8,000 cu m
Markets Serviced Mumbai City (Kurla, Vikhroli, Andheri, Ghatkopar, Chembur, Sion, etc)
M3010%
M455%M40
10%
M2550%
M2015%
M3510%
Product Mix
85%
15%
Instutional
Infrastructure
Customer Segmentation
39303750
35703390
3260
310033003500370039004100
M-20 M-25 M-30 M-35 M-40
Average Delivered Prices (OPC based RMC)
(In Rs. per cu m, excluding taxes)
33903520
37003880
4060
320034003600380040004200
M-20 M-25 M-30 M-35 M-40
Average Delivered Prices (PPC based RMC)
(In Rs. per cu m, excluding taxes) NOTE: Prices for both OPC and PPC based RMC are given as both OPC and PPC are used in approximately equal quantities to manufacture concrete by RMC plants in Greater Mumbai. Transport Leads Average distance to markets: 15 -20 Kms Average time to markets: 1 – 1.5 hrs Tax Rate 12.5 % VAT

07101 4.32
There are 42 transit mixers of 7 cu m each and 7 line pumps. These are collectively used by all the RMC India plants. Additional information: Raw Material Sources:
Cement: Ambuja and Haathi. Believed to be sourced at approx. price of Rs. 230 – Rs. 240 per bag (including taxes).
Sand: Vaitarna. Sourced at approx. Rs. 23 – Rs. 25 per cu ft. Aggregates: Turbhe. Sourced at approx. Rs. 17 – Rs. 19 per cu ft. Admixture: SWC. Sourced at approx. Rs. 25 per Kg.

07101 4.33
RMC India
Group RMC India Ltd.
Group’s Main Business Ready Mix Concrete
Plant Name RMC India
Plant Location Vidya Vihar
Plant Type Star
Plant Capacity 30 cu m/ hr
Average Monthly Production
3,500 cu m (50 % of this production is dedicated for a project. 100 % of production considered as RMC sale)
Markets Serviced Mumbai City (Kurla, Vikhroli, Andheri, Ghatkopar, Chembur, Sion, etc)
M3010%
M455%M40
10%
M2550%
M2015%
M3510%
Product Mix
85%
15%
Instutional
Infrastructure
Customer Segmentation
39303750
35703390
3260
310033003500370039004100
M-20 M-25 M-30 M-35 M-40
Average Delivered Prices (OPC based RMC)
(In Rs. per cu m, excluding taxes)
33903520
37003880
4060
320034003600380040004200
M-20 M-25 M-30 M-35 M-40
Average Delivered Prices (PPC based RMC)
(In Rs. per cu m, excluding taxes) NOTE: Prices for both OPC and PPC based RMC are given as both OPC and PPC are used in approximately equal quantities to manufacture concrete by RMC plants in Greater Mumbai.

07101 4.34
Transport Leads Average distance to markets: 15 -20 Kms Average time to markets: 1 – 1.5 hrs Tax Rate 12.5 % VAT There are 42 transit mixers of 7 cu m each and 7 line pumps. These are collectively used by all the RMC India plants. Additional information: Raw Material Sources:
Cement: Ambuja and Haathi. Believed to be sourced at approx. price of Rs. 230 – Rs. 240 per bag (including taxes).
Sand: Vaitarna. Sourced at approx. Rs. 23 – Rs. 25 per cu ft. Aggregates: Turbhe. Sourced at approx. Rs. 17 – Rs. 19 per cu ft. Admixture: SWC. Sourced at approx. Rs. 25 per Kg.

07101 4.35
RCC Concrete
Group Relcon Infraprojects Pvt. Ltd.
Group’s Main Business Construction
Plant Name Relcon Ready Mix Concrete
Plant Location Wadala
Plant Type In line Bin
Plant Capacity 60 cu m/ hr
Average Monthly Production
6,000 cu m (30 % of this production is dedicated for its own projects. 70 % of production considered as RMC sale)
Markets Serviced Mumbai City (Andheri, Vikroli, Chembur, Dadar, Parel, Byculla, etc)
M-4060%
M-3040%
Product Mix
100%Instutional
Customer Segmentation
38403660
34803300
3170
300032003400360038004000
M-20 M-25 M-30 M-35 M-40
Average Delivered Prices (OPC based RMC)
(In Rs. per cu m, excluding taxes)
33003430
36103790
3970
310033003500370039004100
M-20 M-25 M-30 M-35 M-40
Average Delivered Prices (PPC based RMC)
(In Rs. per cu m, excluding taxes) NOTE: Prices for both OPC and PPC based RMC are given as both OPC and PPC are used in approximately equal quantities to manufacture concrete by RMC plants in Greater Mumbai.

07101 4.36
Transport Leads Average distance to markets: 15 -20 Kms Average time to markets: 1 – 1.5 hrs Tax Rate 12.5 % VAT There are 17 transit mixers of 7 cu m each and 3 line pumps. These are collectively used with RCC Dahisar plant. Additional information: Raw Material Sources:
Cement: ACC and Haathi. Believed to be sourced at approx. price of Rs. 230 – Rs. 240 per bag (including taxes).
Sand: Vaitarna. Sourced at approx. Rs. 23 – Rs. 25 per cu ft. Aggregates: Turbhe. Sourced at approx. Rs. 17 – Rs. 19 per cu ft. Admixture: BASF and Sika. Sourced at approx. Rs. 25 per Kg.

07101 4.37
RCC Concrete
Group Relcon Infraprojects Pvt. Ltd.
Group’s Main Business Construction
Plant Name Relcon Ready Mix Concrete
Plant Location Dahisar
Plant Type Star
Plant Capacity 30 cu m/ hr
Average Monthly Production
5,000 cu m (40 % of this production is dedicated for its own projects. 60 % of production considered as RMC sale)
Markets Serviced
Mumbai City (Dahisar, Goregaon, Borivali, Kandivali, Malad, Aarey Colony, etc)
M3040%M40
60%
Product Mix
100%Instutional
Customer Segmentation
38403660
34803300
3170
300032003400360038004000
M-20 M-25 M-30 M-35 M-40
Average Delivered Prices (OPC based RMC)
(In Rs. per cu m, excluding taxes)
33003430
36103790
3970
310033003500370039004100
M-20 M-25 M-30 M-35 M-40
Average Delivered Prices (PPC based RMC)
(In Rs. per cu m, excluding taxes) NOTE: Prices for both OPC and PPC based RMC are given as both OPC and PPC are used in approximately equal quantities to manufacture concrete by RMC plants in Greater Mumbai.

07101 4.38
Transport Leads Average distance to markets: 15 -20 Kms Average time to markets: 1 – 1.5 hrs Tax Rate 12.5 % VAT There are 17 transit mixers of 7 cu m each and 3 line pumps. These are collectively used with RCC Wadala plant. Additional information: Raw Material Sources:
Cement: ACC and Haathi. Believed to be sourced at approx. price of Rs. 230 – Rs. 240 per bag (including taxes).
Sand: Vaitarna. Sourced at approx. Rs. 23 – Rs. 25 per cu ft. Aggregates: Turbhe. Sourced at approx. Rs. 17 – Rs. 19 per cu ft. Admixture: BASF and Sika. Sourced at approx. Rs. 25 per Kg.

07101 4.39
Shree Naman
Group Shree Naman Developers Ltd.
Group’s Main Business Construction
Plant Name Shree Naman RMC
Plant Location Wadala
Plant Type Star
Plant Capacity 30 cu m/ hr
Average Monthly Production
6,000 cu m (70 % of this production dedicated for its own projects. 30 % of production considered as RMC sale)
Markets Serviced Mumbai City (Andheri, Vikroli, Chembur, Dadar, Parel, Byculla, etc)
M3040%
M4040%
M255%
M205%
M3510%
Product Mix
100%Instutional
Customer Segmentation
35903465
3280
3,100
3,300
3,500
3,700
3,900
M30 M35 M40
Average Delivered Prices (OPC based RMC)
(In Rs. per cu m, including 10 % profit margin on cost of concrete)
34353530
3695
3,300
3,500
3,700
3,900
M30 M35 M40
Average Delivered Prices (PPC based RMC)
(In Rs. per cu m, including 10 % profit margin on cost of concrete)
NOTE: Prices for both OPC and PPC based RMC are given as both OPC and PPC are used in approximately equal quantities to manufacture concrete by RMC plants in Greater Mumbai.

07101 4.40
Transport Leads Average distance to markets: 15 -20 Kms Average time to markets: 1 – 1.5 hrs
Tax Rate No VAT charged since this is a dedicated plant which also sells RMC to other builders (at times without proper paperwork).
There are 15 transit mixers of 7 cu m each and 2 line pumps. Additional information: Raw Material Sources:
Cement: Ambuja and UltraTech. Believed to be sourced at approx. price of Rs. 230 – Rs. 240 per bag (including taxes).
Sand: Vaitarna and Mahad. Sourced at approx. Rs. 23 – Rs. 25 per cu ft. Aggregates: Turbhe and Jasai. Sourced at approx. Rs. 17 – Rs. 19 per cu ft. Admixture: SWC. Sourced at approx. Rs. 25 per Kg.

07101 4.41
Saket RMC
Group Saket Engineering Construction Company
Group’s Main Business Construction
Plant Name Saket RMC
Plant Location Wadala
Plant Type Inline Bin
Plant Capacity 120 cu m/ hr
Average Monthly Production
3,500 cu m (60 % of this production is dedicated for its own project. 40 % of production considered as RMC sale)
Markets ServicedMumbai City (Andheri, Vikroli, Chembur, Dadar, Parel, Byculla, etc)
M3040%
M4040%
M255%
M205%
M3510%
Product Mix
10%
15%
75%
Individuals
Institutions
Infrastructure
Customer Segmentation
35903465
3280
3,100
3,300
3,500
3,700
3,900
M30 M35 M40
Average Delivered Prices (OPC based RMC)
(In Rs. per cu m, including 10 % profit margin on cost of concrete)
34353530
3695
3,300
3,500
3,700
3,900
M30 M35 M40
Average Delivered Prices (PPC based RMC)
(In Rs. per cu m, including 10 % profit margin on cost of concrete)
NOTE: Prices for both OPC and PPC based RMC are given as both OPC and PPC are used in approximately equal quantities to manufacture concrete by RMC plants in Greater Mumbai.

07101 4.42
Transport Leads Average distance to markets: 15 -20 Kms
Average time to markets: 1 – 1.5 hrs
Tax Rate No VAT charged since this is a dedicated plant which also sells RMC to other builders (at times without proper paperwork).
There are 18 transit mixers of 7 cu m each and 2 line pumps. Additional information: Raw Material Sources:
Cement: Ambuja and UltraTech. Believed to be sourced at approx. price of Rs. 230 – Rs. 240 per bag (including taxes).
Sand: Vaitarna. Sourced at approx. Rs. 23 – Rs. 25 per cu ft. Aggregates: Turbhe. Sourced at approx. Rs. 17 – Rs. 19 per cu ft. Admixture: Sound Build Care. Sourced at approx. Rs. 25 per Kg.

07101 4.43
Tarmat RMC
Group Roman Tarmat Ltd.
Group’s Main Business Construction
Plant Name Tarmat RMC
Plant Location Goregaon
Plant Type Star
Plant Capacity 30 cu m/ hr
Average Monthly Production
3,500 cu m (80 % of this production is dedicated for its own projects. 20 % of production considered as RMC sale)
Markets Serviced Mumbai City (Kandivali, Goregaon, Malad, Borivali, Dahisar, etc)
M3035%
M4030%
M2510%
M2020%
M355%
Product Mix
50%50%
Instutional
Infrastructure
Customer Segmentation
35903465
3280
3,100
3,300
3,500
3,700
3,900
M30 M35 M40
Average Delivered Prices (OPC based RMC) Institutional segment
(In Rs. per cu m, including 10 % profit margin on cost of concrete)
2830
34153535
2,7002,9003,1003,3003,5003,700
M20 M35 M40
Average Delivered Prices (OPC based RMC) Infrastructure segment
(In Rs. per cu m, including 10 % profit margin on cost of concrete)
NOTE: Prices for both OPC and PPC based RMC are given as both OPC and PPC are used in approximately equal quantities to manufacture concrete by RMC plants in Greater Mumbai.

07101 4.44
Transport Leads Average distance to markets: 15 -20 Kms Average time to markets: 1 – 1.5 hrs
Tax Rate No VAT charged since this is a dedicated plant which also sells RMC to other builders (at times without proper paperwork).
There are 10 transit mixers of 7 cu m each and 1 line pump. Additional information: Raw Material Sources:
Cement: Ambuja. Believed to be sourced at approx. price of Rs. 230 – Rs. 240 per bag (including taxes).
Sand: Vaitarna. Sourced at approx. Rs. 23 – Rs. 25 per cu ft. Aggregates: Turbhe. Sourced at approx. Rs. 17 – Rs. 19 per cu ft. Admixture: Chem Bond. Sourced at approx. Rs. 25 per Kg.

07101 4.45
UltraTech Concrete
Group Grasim Industries Ltd.
Group’s Main Business Cement
Plant Name UltraTech Concrete
Plant Location Deonar
Plant Type In line Bin
Plant Capacity 80 cu m/ hr
Average Monthly Production 11,000 cu m
Markets Serviced Mumbai City (Deonar, Chembur, Ghatkopar, Nerul, etc)
M4015%
M2010%
M3045%
M3530%
Product Mix
90%
10%
Instutional
Infrastructure
Customer Segmentation
39303750
35703390
3260
310033003500370039004100
M-20 M-25 M-30 M-35 M-40
Average Delivered Prices (OPC based RMC)
(In Rs. per cu m, excluding taxes)
33903520
37003880
4060
320034003600380040004200
M-20 M-25 M-30 M-35 M-40
Average Delivered Prices (PPC based RMC)
(In Rs. per cu m, excluding taxes) NOTE: Prices for both OPC and PPC based RMC are given as both OPC and PPC are used in approximately equal quantities to manufacture concrete by RMC plants in Greater Mumbai. Transport Leads Average distance to markets: 15 -20 Kms Average time to markets: 1 – 1.5 hrs Tax Rate 12.5 % VAT

07101 4.46
There are 27 transit mixers of 7 cu m each and 3 line pumps. These are collectively used with UltraTech’s Wadala & Kanjur RMC plants. Additional information: Raw Material Sources:
Cement: UltraTech. Believed to be sourced at approx. price of Rs. 230 – Rs. 240 per bag (including taxes).
Sand: Vaitarna and Mahad. Sourced at approx. Rs. 23 – Rs. 25 per cu ft. Aggregates: Turbhe. Sourced at approx. Rs. 17 – Rs. 19 per cu ft. Admixture: BASF. Sourced at approx. Rs. 25 per Kg.

07101 4.47
UltraTech Concrete
Group Grasim Industries Ltd.
Group’s Main Business Cement
Plant Name UltraTech Concrete
Plant Location Wadala
Plant Type Inline Bin
Plant Capacity 60 cu m/ hr
Average Monthly Production 3,500 cu m
Markets Serviced Mumbai City (Andheri, Vikroli, Chembur, Dadar, Parel, Byculla, etc)
M4015%
M2010%
M3045%
M3530%
Product Mix
100%Instutional
Customer Segmentation
39303750
35703390
3260
310033003500370039004100
M-20 M-25 M-30 M-35 M-40
Average Delivered Prices (OPC based RMC)
(In Rs. per cu m, excluding taxes)
33903520
37003880
4060
320034003600380040004200
M-20 M-25 M-30 M-35 M-40
Average Delivered Prices (PPC based RMC)
(In Rs. per cu m, excluding taxes) NOTE: Prices for both OPC and PPC based RMC are given as both OPC and PPC are used in approximately equal quantities to manufacture concrete by RMC plants in Greater Mumbai. Transport Leads Average distance to markets: 15 -20 Kms Average time to markets: 1 – 1.5 hrs Tax Rate 12.5 % VAT

07101 4.48
There are 27 transit mixers of 7 cu m each and 3 line pumps These are collectively used with UltraTech’s Deonar & Kanjur RMC plants. Additional information: Raw Material Sources:
Cement: UltraTech. Believed to be sourced at approx. price of Rs. 230 – Rs. 240 per bag (including taxes).
Sand: Vaitarna and Mahad. Sourced at approx. Rs. 23 – Rs. 25 per cu ft. Aggregates: Turbhe. Sourced at approx. Rs. 17 – Rs. 19 per cu ft. Admixture: BASF. Sourced at approx. Rs. 25 per Kg.

07101 4.49
UltraTech Concrete
Group Grasim Industries Ltd.
Group’s Main Business Cement
Plant Name UltraTech Concrete
Plant Location Kanjur
Plant Type Star
Plant Capacity 30 cu m/ hr
Average Monthly Production
5,500 cu m (80 % of this production is dedicated for a project. 100 % of production considered as RMC sale)
Markets Serviced Mumbai City (Kanjur, Bhandup and Vikhroli)
M3510%
M2010%
M2510%
M4030%
M3040%
Product Mix
100%Instutional
Customer Segmentation
39303750
35703390
3260
310033003500370039004100
M-20 M-25 M-30 M-35 M-40
Average Delivered Prices (OPC based RMC)
(In Rs. per cu m, excluding taxes)
33903520
37003880
4060
320034003600380040004200
M-20 M-25 M-30 M-35 M-40
Average Delivered Prices (PPC based RMC)
(In Rs. per cu m, excluding taxes) NOTE: Prices for both OPC and PPC based RMC are given as both OPC and PPC are used in approximately equal quantities to manufacture concrete by RMC plants in Greater Mumbai.

07101 4.50
Transport Leads Average distance to markets: 15 -20 Kms Average time to markets: 1 – 1.5 hrs Tax Rate 12.5 % VAT There are 27 transit mixers of 7 cu m each and 3 line pumps These are collectively used with UltraTech’s Wadala & Deonar RMC plants. Additional information: Raw Material Sources:
Cement: UltraTech. Believed to be sourced at approx. price of Rs. 230 – Rs. 240 per bag (including taxes).
Sand: Vaitarna. Sourced at approx. Rs. 23 – Rs. 25 per cu ft. Aggregates: Turbhe. Sourced at approx. Rs. 17 – Rs. 19 per cu ft. Admixture: BASF. Sourced at approx. Rs. 25 per Kg.

07101 4.51
ACC RMC
Group ACC
Group’s Main Business Cement
Plant Name ACC Ready Mix
Plant Location Dronagiri
Plant Type In Line Bin
Plant Capacity 120 cu m/ hr
Average Monthly Production 4,300 cu m
Markets Serviced Navi Mumbai (Panvel, Taloje, Khargarh, Rashi, Khapoli, etc)
M2535%
M405%M35
15%
M2015%
M1515%
M3015%
Product Mix
95%
5%
Instutional
Infrastructure
Customer Segmentation
38303650
34703290
3160
300032003400360038004000
M-20 M-25 M-30 M-35 M-40
Average Delivered Prices (OPC based RMC)
(In Rs. per cu m, excluding taxes)
32903420
36003780
3960
310033003500370039004100
M-20 M-25 M-30 M-35 M-40
Average Delivered Prices (PPC based RMC)
(In Rs. per cu m, excluding taxes) NOTE: Prices for both OPC and PPC based RMC are given as both OPC and PPC are used in approximately equal quantities to manufacture concrete by RMC plants in Greater Mumbai. Transport Leads Average distance to markets: 30 -35 Kms Average time to markets: 1.5 – 2.0 hrs Tax Rate 12.5 % VAT

07101 4.52
There are 20 transit mixers of 7 cu m each and 2 line pumps. ACC also has 1 boom pump which is utilized by all the four ACC RMC plants. Additional information: Raw Material Sources:
Cement: ACC. Believed to be sourced at approx. price of Rs. 230 – Rs. 240 per bag (including taxes).
Sand: Mahad. Sourced at approx. Rs. 23 – Rs. 25 per cu ft. Aggregates: Uran, Jasai and Ulva. Sourced at approx. Rs. 17 – Rs. 19 per cu ft. Admixture: SWC and Choksey. Sourced at approx. Rs. 25 per Kg.
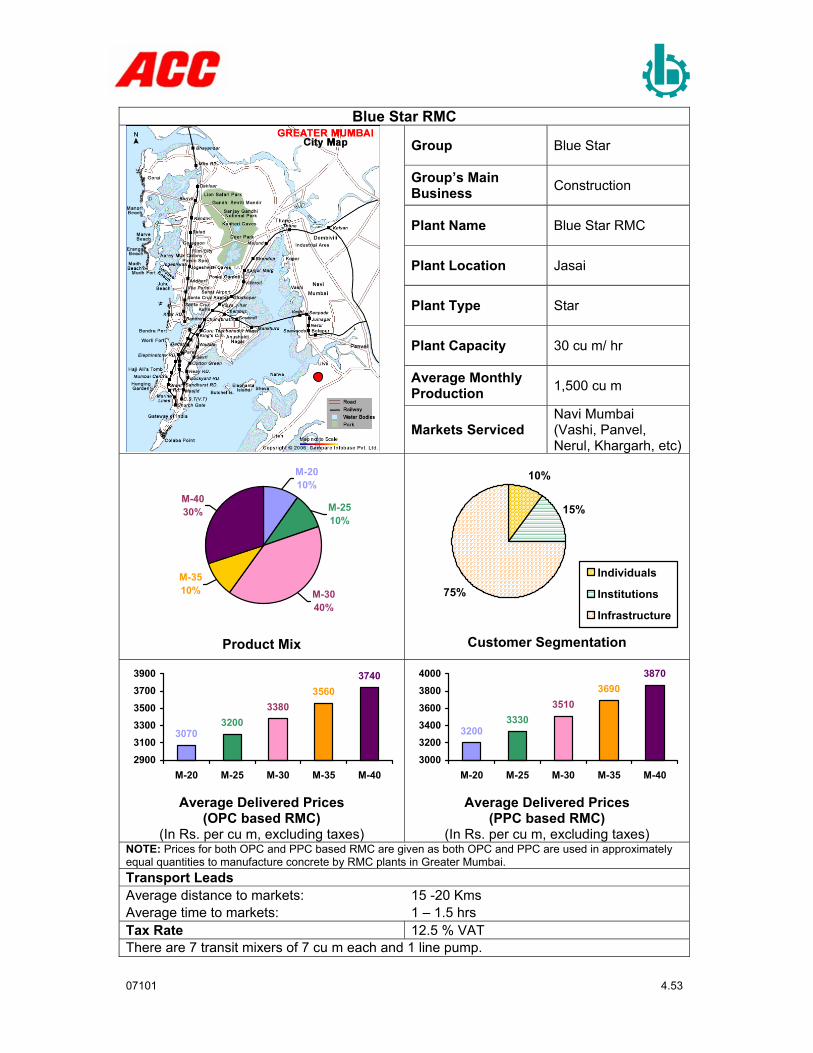
07101 4.53
Blue Star RMC
Group Blue Star
Group’s Main Business Construction
Plant Name Blue Star RMC
Plant Location Jasai
Plant Type Star
Plant Capacity 30 cu m/ hr
Average Monthly Production 1,500 cu m
Markets Serviced
Navi Mumbai (Vashi, Panvel, Nerul, Khargarh, etc)
M-3040%
M-4030% M-25
10%
M-2010%
M-3510%
Product Mix
10%
15%
75%
Individuals
Institutions
Infrastructure
Customer Segmentation
37403560
33803200
3070
290031003300350037003900
M-20 M-25 M-30 M-35 M-40
Average Delivered Prices (OPC based RMC)
(In Rs. per cu m, excluding taxes)
32003330
35103690
3870
300032003400360038004000
M-20 M-25 M-30 M-35 M-40
Average Delivered Prices (PPC based RMC)
(In Rs. per cu m, excluding taxes) NOTE: Prices for both OPC and PPC based RMC are given as both OPC and PPC are used in approximately equal quantities to manufacture concrete by RMC plants in Greater Mumbai. Transport Leads Average distance to markets: 15 -20 Kms Average time to markets: 1 – 1.5 hrs Tax Rate 12.5 % VAT There are 7 transit mixers of 7 cu m each and 1 line pump.

07101 4.54
Additional information: Raw Material Sources:
Cement: Ambuja. Believed to be sourced at approx. price of Rs. 230 – Rs. 240 per bag (including taxes).
Sand: Vaitarna. Sourced at approx. Rs. 21 – Rs. 23 per cu ft. Aggregates: Uran and Jasai. Sourced at approx. Rs. 13 – Rs. 15 per cu ft. Admixture: SWC. Sourced at approx. Rs. 25 per Kg.

07101 4.55
IVRCL
Group IVR Construction Ltd.
Group’s Main Business Construction
Plant Name IVRCL
Plant Location Vashi
Plant Type Star
Plant Capacity 30 cu m/ hr
Average Monthly Production
3,500 cu m (85 % of this production is dedicated for its infrastructure project. 15 % of production considered as RMC sale)
Markets Serviced Navi Mumbai (Vashi, Nerul, Khargarh, Panvel, Turbhe, etc)
M3040%
M4030% M25
10%
M2010%
M3510%
Product Mix
15%
85%
Instutional
Infrastructure
Customer Segmentation
37403560
33803200
3070
290031003300350037003900
M-20 M-25 M-30 M-35 M-40
Average Delivered Prices (OPC based RMC)
(In Rs. per cu m, excluding taxes)
32003330
35103690
3870
300032003400360038004000
M-20 M-25 M-30 M-35 M-40
Average Delivered Prices (PPC based RMC)
(In Rs. per cu m, excluding taxes) NOTE: Prices for both OPC and PPC based RMC are given as both OPC and PPC are used in approximately equal quantities to manufacture concrete by RMC plants in Greater Mumbai.

07101 4.56
Transport Leads Average distance to markets: 15 -20 Kms Average time to markets: 1 – 1.5 hrs Tax Rate 12.5 % VAT There are 6 transit mixers of 7 cu m each and 1 line pump. Additional information: Raw Material Sources:
Cement: UltraTech. Believed to be sourced at approx. price of Rs. 230 – Rs. 240 per bag (including taxes).
Sand: Vaitarna. Sourced at approx. Rs. 21 – Rs. 23 per cu ft. Aggregates: Uran and Jasai. Sourced at approx. Rs. 13 – Rs. 15 per cu ft. Admixture: SWC. Sourced at approx. Rs. 25 per Kg.

07101 4.57
Jindal RMC
Group Jindal Contractor
Group’s Main Business Construction
Plant Name Jindal Ready Mix
Plant Location Nerul
Plant Type Star
Plant Capacity 30 cu m/ hr
Average Monthly Production 3,500 cu m
Markets Serviced Navi Mumbai (Vashi, Nerul, Khargarh, Panvel, Turbhe, etc)
M2525%
M3515%
M2010%
M1510%
M3040%
Product Mix
85%
15%
Instutional
Infrastructure
Customer Segmentation
37403560
33803200
3070
290031003300350037003900
M-20 M-25 M-30 M-35 M-40
Average Delivered Prices (OPC based RMC)
(In Rs. per cu m, excluding taxes)
32003330
35103690
3870
300032003400360038004000
M-20 M-25 M-30 M-35 M-40
Average Delivered Prices (PPC based RMC)
(In Rs. per cu m, excluding taxes) NOTE: Prices for both OPC and PPC based RMC are given as both OPC and PPC are used in approximately equal quantities to manufacture concrete by RMC plants in Greater Mumbai. Transport Leads Average distance to markets: 15 -20 Kms Average time to markets: 1 – 1.5 hrs

07101 4.58
Tax Rate 12.5 % VAT There are 8 transit mixers of 7 cu m each and 2 line pumps. Additional information: Raw Material Sources:
Cement: Ambuja. Believed to be sourced at approx. price of Rs. 230 – Rs. 240 per bag (including taxes).
Sand: Vaitarna. Sourced at approx. Rs. 21 – Rs. 23 per cu ft. Aggregates: Turbhe and Meondi. Sourced at approx. Rs. 13 – Rs. 15 per cu ft. Admixture: SWC and BASF. Sourced at approx. Rs. 25 per Kg.

07101 4.59
J M Mhatre
Group J M Mhatre
Group’s Main Business Construction
Plant Name J M Mhatre RMC
Plant Location Nerul
Plant Type Star
Plant Capacity 30 cu m/ hr
Average Monthly Production
5,000 cu m (90 % dedicated supply for its infrastructure project. 10 % of production considered as RMC sale)
Markets Serviced Navi Mumbai (Vashi, Nerul, Khargarh, Panvel, Turbhe, etc)
M3040%
M4030% M25
10%
M2010%
M3510%
Product Mix
10%
90%
Instutional
Infrastructure
Customer Segmentation
37403560
33803200
3070
290031003300350037003900
M-20 M-25 M-30 M-35 M-40
Average Delivered Prices (OPC based RMC)
(In Rs. per cu m, excluding taxes)
32003330
35103690
3870
300032003400360038004000
M-20 M-25 M-30 M-35 M-40
Average Delivered Prices (PPC based RMC)
(In Rs. per cu m, excluding taxes) NOTE: Prices for both OPC and PPC based RMC are given as both OPC and PPC are used in approximately equal quantities to manufacture concrete by RMC plants in Greater Mumbai.

07101 4.60
Transport Leads Average distance to markets: 15 -20 Kms Average time to markets: 1 – 1.5 hrs Tax Rate 12.5 % VAT There are 8 transit mixers of 7 cu m each and 2 line pumps. Additional information: Raw Material Sources:
Cement: UltraTech. Believed to be sourced at approx. price of Rs. 230 – Rs. 240 per bag (including taxes).
Sand: Vaitarna. Sourced at approx. Rs. 21 – Rs. 23 per cu ft. Aggregates: Uran and Jasai. Sourced at approx. Rs. 13 – Rs. 15 per cu ft. Admixture: SWC. Sourced at approx. Rs. 25 per Kg.

07101 4.61
L & T Concrete
Group Larsen & Toubro Ltd.
Group’s Main Business Construction
Plant Name L&T Concrete
Plant Location Mahape
Plant Type Star
Plant Capacity 30 cu m/ hr
Average Monthly Production
8,500 cu m (60 % of this production is dedicated for a project. 100 % of production considered as RMC sale)
Markets Serviced
Navi Mumbai (Mahape, Airoli, Nerul, Vashi, Turbhe, Khargarh, etc)
M305%
M455%
M4035%
M255%
M2010%
M3540%
Product Mix
90%
10%
Instutional
Infrastructure
Customer Segmentation
38803700
35203340
3210
300032003400360038004000
M-20 M-25 M-30 M-35 M-40
Average Delivered Prices (OPC based RMC)
(In Rs. per cu m, excluding taxes)
33403470
36503830
4010
310033003500370039004100
M-20 M-25 M-30 M-35 M-40
Average Delivered Prices (PPC based RMC)
(In Rs. per cu m, excluding taxes) NOTE: Prices for both OPC and PPC based RMC are given as both OPC and PPC are used in approximately equal quantities to manufacture concrete by RMC plants in Greater Mumbai.

07101 4.62
Transport Leads Average distance to markets: 15 -20 Kms Average time to markets: 1 – 1.5 hrs Tax Rate 12.5 % VAT There are 78 transit mixers of 7 cu m each, 19 line pumps and 1 boom pump. These are collectively used by all L&T RMC plants. Additional information: Raw Material Sources:
Cement: Ambuja and UltraTech. Believed to be sourced at approx. price of Rs. 230 – Rs. 240 per bag (including taxes).
Sand: Vaitarna. Sourced at approx. Rs. 21 – Rs. 23 per cu ft. Aggregates: Turbe and Meondi. Sourced at approx. Rs. 13 – Rs. 15 per cu ft. Admixture: BASF and SWC. Sourced at approx. Rs. 25 per Kg.

07101 4.63
RMC India
Group RMC India Ltd.
Group’s Main Business Ready Mix Concrete
Plant Name RMC India
Plant Location Mahape
Plant Type Inline Bin
Plant Capacity 80 cu m/ hr
Average Monthly Production 6,500 cu m
Markets Serviced
Navi Mumbai (Mahape, Airoli, Nerul, Vashi, Turbhe, Khargarh, etc)
M3540%
M2010% M25
5%
M4035%
M455%
M305%
Product Mix
60%
40%
Instutional
Infrastructure
Customer Segmentation
38303650
34703290
3160
300032003400360038004000
M-20 M-25 M-30 M-35 M-40
Average Delivered Prices (OPC based RMC)
(In Rs. per cu m, excluding taxes)
32903420
36003780
3960
310033003500370039004100
M-20 M-25 M-30 M-35 M-40
Average Delivered Prices (PPC based RMC)
(In Rs. per cu m, excluding taxes) NOTE: Prices for both OPC and PPC based RMC are given as both OPC and PPC are used in approximately equal quantities to manufacture concrete by RMC plants in Greater Mumbai. Transport Leads Average distance to markets: 15 -20 Kms Average time to markets: 1 – 1.5 hrs

07101 4.64
Tax Rate 12.5 % VAT There are 42 transit mixers of 7 cu m each and 7 line pumps. These are collectively used by all the RMC India plants. Additional information: Raw Material Sources:
Cement: Ambuja and Haathi. Believed to be sourced at approx. price of Rs. 230 – Rs. 240 per bag (including taxes).
Sand: Vaitarna. Sourced at approx. Rs. 21 – Rs. 23 per cu ft. Aggregates: Turbhe and Meondi. Sourced at approx. Rs. 13 – Rs. 15 per cu ft. Admixture: SWC. Sourced at approx. Rs. 25 per Kg.

07101 4.65
S C Thakur
Group S C Thakur
Group’s Main Business Construction
Plant Name S C Thakur
Plant Location Turbhe
Plant Type Star
Plant Capacity 30 cu m/ hr
Average Monthly Production
4,000 cu m (90 % of this production is dedicated for its own projects. 10 % of production considered as RMC sale)
Markets Serviced Navi Mumbai (Vashi, Nerul, Khargarh, Panvel, Turbhe, etc)
M3510%
M2010%
M2510%
M4030%
M3040%
Product Mix
10%
90%
Instutional
Infrastructure
Customer Segmentation
3780
35603380
32003070
290031003300350037003900
M-20 M-25 M-30 M-35 M-40
Average Delivered Prices (OPC based RMC)
(In Rs. per cu m, excluding taxes)
32003330
35103690
3870
300032003400360038004000
M-20 M-25 M-30 M-35 M-40
Average Delivered Prices (PPC based RMC)
(In Rs. per cu m, excluding taxes) NOTE: Prices for both OPC and PPC based RMC are given as both OPC and PPC are used in approximately equal quantities to manufacture concrete by RMC plants in Greater Mumbai.

07101 4.66
Transport Leads Average distance to markets: 15 -20 Kms Average time to markets: 1 – 1.5 hrs Tax Rate 12.5 % VAT There are 7 transit mixers of 7 cu m each and 2 line pumps. Additional information: Raw Material Sources:
Cement: UltraTech. Believed to be sourced at approx. price of Rs. 230 – Rs. 240 per bag (including taxes).
Sand: Vaitarna. Sourced at approx. Rs. 21 – Rs. 23 per cu ft. Aggregates: Uran and Jasai. Sourced at approx. Rs. 13 – Rs. 15 per cu ft. Admixture: SWC. Sourced at approx. Rs. 25 per Kg.

07101 4.67
UltraTech Concrete
Group Grasim Industries Ltd.
Group’s Main Business Cement
Plant Name UltraTech Concrete
Plant Location Pawna
Plant Type Inline Bin
Plant Capacity 60 cu m/ hr
Average Monthly Production 7,500 cu m
Markets Serviced
Navi Mumbai (Mahape, Airoli, Nerul, Vashi, Turbhe, Khargarh, etc)
M-3015%
M-4015%
M-2535%
M-2020%
M-3515%
Product Mix
85%
15%
Instutional
Infrastructure
Customer Segmentation
38303650
34703290
3160
300032003400360038004000
M-20 M-25 M-30 M-35 M-40
Average Delivered Prices (OPC based RMC)
(In Rs. per cu m, excluding taxes)
32903420
36003780
3960
310033003500370039004100
M-20 M-25 M-30 M-35 M-40
Average Delivered Prices (PPC based RMC)
(In Rs. per cu m, excluding taxes) NOTE: Prices for both OPC and PPC based RMC are given as both OPC and PPC are used in approximately equal quantities to manufacture concrete by RMC plants in Greater Mumbai. Transport Leads Average distance to markets: 15 -20 Kms Average time to markets: 1 – 1.5 hrs

07101 4.68
Tax Rate 12.5 % VAT There are 18 transit mixers of 7 cu m each and 3 line pumps. Additional information: Raw Material Sources:
Cement: UltraTech. Believed to be sourced at approx. price of Rs. 230 – Rs. 240 per bag (including taxes).
Sand: Vaitarna. Sourced at approx. Rs. 21 – Rs. 23 per cu ft. Aggregates: Turbhe and Meondi. Sourced at approx. Rs. 13 – Rs. 15 per cu ft. Admixture: BASF. Sourced at approx. Rs. 25 per Kg.

07101 4.69
Jyoti RMC
Group Jyoti Construction
Group’s Main Business Construction
Plant Name Jyoti RMC
Plant Location Ghodbander Road
Plant Type Star
Plant Capacity 30 cu m/ hr
Average Monthly Production
4,000 cu m (30 % of this production is dedicated for its own projects. 70 % of production considered as RMC sale)
Markets Serviced Thane (Ghodbander Road)
M3040%
M4030% M25
10%
M2010%
M3510%
Product Mix
100%Instutional
Customer Segmentation
38403660
34803300
3170
300032003400360038004000
M-20 M-25 M-30 M-35 M-40
Average Delivered Prices (OPC based RMC)
(In Rs. per cu m, excluding taxes)
33003430
36103790
3970
310033003500370039004100
M-20 M-25 M-30 M-35 M-40
Average Delivered Prices (PPC based RMC)
(In Rs. per cu m, excluding taxes) NOTE: Prices for both OPC and PPC based RMC are given as both OPC and PPC are used in approximately equal quantities to manufacture concrete by RMC plants in Greater Mumbai.

07101 4.70
Transport Leads Average distance to markets: 15 -20 Kms Average time to markets: 1 – 1.5 hrs Tax Rate 12.5 % VAT There are 7 transit mixers of 7 cu m each and 1 line pump. Additional information: Raw Material Sources:
Cement: Ambuja. Believed to be sourced at approx. price of Rs. 230 – Rs. 240 per bag (inclusive taxes).
Sand: Vaitarna. Sourced at approx. Rs. 23 – Rs. 25 per cu ft. Aggregates: Own Quary behind the plant. Admixture: Supaplast. Sourced at approx. Rs. 25 per Kg.

07101 4.71
L & T Concrete
Group Larsen & Toubro Ltd.
Group’s Main Business Construction
Plant Name L&T Concrete
Plant Location Ghodbander Road
Plant Type Star
Plant Capacity 30 cu m/ hr
Average Monthly Production 6,000 cu m
Markets Serviced
Thane (Ghodbander Road and Vasant Vihar)
M3050%
M2510%
M2010%
M4030%
Product Mix
100%Instutional
Customer Segmentation
39803800
36203440
3310
3200
3400
3600
3800
4000
M-20 M-25 M-30 M-35 M-40
Average Delivered Prices (OPC based RMC)
(In Rs. per cu m, excluding taxes)
34403570
37503930
4110
320034003600380040004200
M-20 M-25 M-30 M-35 M-40
Average Delivered Prices (PPC based RMC)
(In Rs. per cu m, excluding taxes) NOTE: Prices for both OPC and PPC based RMC are given as both OPC and PPC are used in approximately equal quantities to manufacture concrete by RMC plants in Greater Mumbai. Transport Leads Average distance to markets: 15 -20 Kms Average time to markets: 1 – 1.5 hrs Tax Rate 12.5 % VAT

07101 4.72
There are 78 transit mixers of 7 cu m each, 19 line pumps and 1 boom pump. These are collectively used by all L&T RMC plants. Additional information: Raw Material Sources:
Cement: UltraTech. Believed to be sourced at approx. price of Rs. 230 – Rs. 240 per bag (including taxes).
Sand: Vaitarna. Sourced at approx. Rs. 23 – Rs. 25 per cu ft. Aggregates: Turbe and Kalyan. Sourced at approx. Rs. 17 – Rs. 19 per cu ft. Admixture: BASF and SWC. Sourced at approx. Rs. 25 per Kg.

07101 4.73
Shree RMC
Group Shree Construction Company
Group’s Main Business Construction
Plant Name Shree Ready Mix Concrete
Plant Location Ghodbander Road
Plant Type Inline Bin
Plant Capacity 60 cu m/ hr
Average Monthly Production
4,000 cu m (30 % of this production is dedicated for its own projects. 70 % of production considered as RMC sale)
Markets Serviced Thane (Ghodbander Road)
M3510%
M2010%
M2510%
M4030%
M3040%
Product Mix
100%Instutional
Customer Segmentation
38403660
34803300
3170
300032003400360038004000
M-20 M-25 M-30 M-35 M-40
Average Delivered Prices (OPC based RMC)
(In Rs. per cu m, excluding taxes)
33003430
36103790
3970
310033003500370039004100
M-20 M-25 M-30 M-35 M-40
Average Delivered Prices (PPC based RMC)
(In Rs. per cu m, excluding taxes) NOTE: Prices for both OPC and PPC based RMC are given as both OPC and PPC are used in approximately equal quantities to manufacture concrete by RMC plants in Greater Mumbai.

07101 4.74
Transport Leads Average distance to markets: 15 -20 Kms Average time to markets: 1 – 1.5 hrs Tax Rate 12.5 % VAT There are 9 transit mixers of 7 cu m each and 3 line pumps. Additional information: Raw Material Sources:
Cement: ACC. Believed to be sourced at approx. price of Rs. 230 – Rs. 240 per bag (including taxes).
Sand: Vaitarna. Sourced at approx. Rs. 23 – Rs. 25 per cu ft. Aggregates: Vasai. Sourced at approx. Rs. 17 – Rs. 19 per cu ft. Admixture: SWC, Fosroc and Chembond. Sourced at approx. Rs. 25 per Kg.

07101 A1.1
Annexure 1
METHODOLOGY TO ESTIMATE CONCRETE DEMAND In order to estimate concrete demand, cement, for which reliable information is available, was used as a base. Estimation of concrete demand was derived from cement that goes into concrete, based on market feedback and accepted norms. Current Demand
The cement demand for each zone, in FY 2007, was estimated from data collected from cement companies.
In each zone, the user segmentation was mapped to understand segment-wise cement consumption. The segments are: • Individual House Builders • Institutional Segment (Housing and Commercial Complexes and factories) • Infrastructure
Zone-wise cement user segmentation, for FY 2007, was collected from cement companies and is given below: Zone IHB Institutional Infrastructure Mumbai City 10% 65% 25% Thane 30% 60% 10% Navi Mumbai 30% 55% 15%
In each segment, the percentage of cement that is used for concreting works was
determined, and is given below: Description IHB Institutional Infrastructure % Cement used for concreting works
50 % 60 % - 75 % depending upon the
nature of building
95%
Thereafter, constructions norms were applied to calculate the total concrete used in each
of segment. Based on the typical quantity of cement used to make concrete in each segment, the segment-wise concrete demand was estimated. While considering the typical quantity of cement used to make a cu m of concrete in each segment, the cement types, grades used, kind of suppliers (on site mix, batching plants and RMC) and if flyash is also used to make concrete for a particular segment, was taken into account. The segment-wise cement usage norms considered are:
Description IHB Institutional Infrastructure Cement used to make 1 cu m of concrete
450 kgs 350 – 410 kgs 350 – 430 kgs depending upon the nature of construction

07101 A1.2
Future Demand
Cement demand forecast for each zone was estimated based on National and State level forecast along with the volume and kind of construction envisaged in each zone. Cement forecast was estimated for 5 years. The future cement demand of Maharashtra is estimated to grow at an average rate of 12 % pa in the medium term. The current share of Greater Mumbai and Pune cement consumption of the total cement consumption of Maharashtra is around 50 %. Based on past trend and the kind of construction envisaged in Greater Mumbai and Pune, the future cement demand is envisaged to grow at 14 % pa in Greater Mumbai and 13 %pa in Pune. Cement demand in the other cities of Mahrasthra are envisaged to grow at a lower rate that that in Greater Mumbai and Pune, thereby giving Maharasthra an average growth of 12 % pa in the next 5 years. The average cement growth rates considered for the various zonal markets in Greater Mumbai, for the next 5 years (FY 2007 to FY 2012), are: • Mumbai City: 14.4 % pa • Thane: 11.4 %pa • Navi Mumbai: 15.1 % pa
In each zone, any changes envisaged in the user segments were appropriately adjusted
while segmenting the market. In each segment, the percentage of cement that is used for concreting works was used,
as mentioned earlier, along with constructions norms to derive the future zone and segment-wise concrete demand.

06309 A2.1
Annexure-2
SOME MAJOR PROJECTS IN GREATER MUMBAI REGION
S no. Name of the Project/ Builder Project Details
1 Onkar Commercial 2 Neelkanth Residential 3 Filix Commercial
4 Infinity Residential
5 Mahavir Universe Residential/
6 HDIL Commercial
7 Neptune Living Point Residential
8 Zeneith Residential
9 Aakruti Group Residential 10 Aakruti Group Commercial 11 Jaswanti Landmark Commercial 12 Orchid Park Residential 13 Siemens Commercial 14 RBK Commercial 15 Flyover at airport road Infrastructure 16 Rahejas Residential 17 Rahejas Commercial 18 Neelkanth Commercial 19 Mindspace Commercial 20 Reliable Fibre Industrial 21 Reliance Industrial 22 Akruti City World Commercial 23 City Park Commercial 24 Powai Plaza Commercial 25 IBIS Hotel 26 Omkar Commercial 27 DLF- Retail Edge Commercial 28 Lido Towers Residential 29 Kohinoor Square Residential 30 Oberoi Residential 32 Vasant Lawns Residential 33 Monarch Residential 34 Garden City Residential 35 Siddhanthal Residential 36 Lalani Group Residential 37 Hirandani Estate Residential

06309 A2.2
S no. Name of the Project/ Builder Project Details 38 Varun Gardens Residential 39 Shubaramb Residential 40 Prakrati Park Residential 41 Laxmi Narayan Residential 42 Yashraj Park Commercial 43 Cosmos Park Commercial 44 Vijay Annexe Commercial 45 Regency Towers Commercial 46 Swasti K Commercial 47 Siddeshwar Arcade Commercial 48 Akash Ganga Residential 49 International Airport at Navi Mumbai Infrastructure 50 Lodha Pavilion Commercial 51 Maher foundation Commercial 52 Orbit Construction Residential 53 Jadrid Corporation Residential 54 Viderabha Mahesh Residential 55 Suraj Plaza Commercial 56 Suraj Plaza Hotel 57 Regency Towers Residential 58 M K Plaza Commercial 59 Ruby Builders Commercial 60 Shree Shristi Residential 61 Jethmalani Residential 62 Puranik City Residential 63 Om Sai Plaza Commercial 64 Jogeshwari- Titanium Commercial 65 Oberoi- Garden City Commercial 66 Express Zone Commercial 67 Flyover at Goregaon Infrastructure 68 Tanika Commercial 69 J kumar- Flyover at kandivilli Infrastructure 70 Sampan Residential 71 Spectra Motors Commercial 72 Celebrations Commercial 73 Flyover at Dahisar Infrastructure 74 Sky Heights Commercial 75 RNA Builders Commercial 76 I- think Techno Campus 77 Symphony Residential 78 HCC Commercial 79 Sonata Residential 80 Lodhas Commercial 81 Sun Heights Residential 82 Rehaja’s- Acropolis Residential

06309 A2.3
S no. Name of the Project/ Builder Project Details 83 Hirandani Gardens Residential 84 Kalpatra Estate Residential 85 Razas Castle Residential 86 TCS- Banyan Park Commercial 88 Silver Sand Five Star Hotel 89 Lido Towers Residential 90 The Lounge Commercial 91 Flyover from Bandra to Marine Drive Infrastructure 92 Sarawat Cooperative Bank Commercial 93 Rehaja’s- The Legend Residential 94 Ivory Residential 95 Ispat Industrial Corporation Commercial 96 Tridon Hilton Five Star Hotel 97 US Conciliate Commercial 98 Softel Hotel 99 Veldum Residential 100 Kala Builders Residential 101 Ashok Towers Residential 102 Kingsten Residential 103 Ashok Gardens Residential 104 Platina Commercial 105 Preeti Chambers Ltd Commercial 106 Flowtech Industries Ltd Commercial 107 Cyber Towers Commercial 108 Feroz Factories Ltd Commercial 109 Merint infrastructure Ltd Commercial 110 Devan Builders Commercial 111 JMC Projects Ltd- Flyover Infrastructure 112 Palm Paradise Residential 113 Full Stop Commercial 114 Solitaire Commercial 115 Palm Beach Residential 116 MRM Associates Residential 117 Keshav Kunj Residential 118 Shreejee Heights Residential 119 Seawoods Estate Residential 120 Reliance Industries Ltd- SEZ Commercial 121 Road work at Uran Infrastructure 122 Bridge work at Uran Infrastructure 123 Bridge work across Panvel Infrastructure 124 Mega City Residential 125 Sagar Sangam Railway Station complex Commercial 126 Sagar Sangam- Water Transport Terminal Infrastructure 127 Vishal Associates Residential 128 Om Developers- Om Paradise Residential

06309 A2.4
S no. Name of the Project/ Builder Project Details 129 Bhoomi Commercial 130 Raheja’s Commercial 131 Raheja’s Five Star Hotel 132 Raheja’s Residential 133 Real Tech Park Commercial 134 Rupa Commercial 135 Bhartiya Vidya Bhavan Institutional 136 RNA- Azzor Commercial 137 Bank of Baroda- Office Commercial 138 Income Tax – Office Commercial 139 Enam Finance Commercial 140 Reliance Conventional Centre Commercial 141 Triden Group Hotel 142 PNB- Office Commercial 143 Sealink- Bandra to Worli Infrastructure 144 Kalpatru Group Residential 145 Kohinoor Mill Commercial 146 Lodha Towers Residential 147 Oberoi Skies Residential 148 Four Season Hotel 149 Rajesh Builders Residential 150 Rajesh Builders Hotel 151 Morarjee Reality Commercial 152 Morajee Reality Residential 153 India Bulls Commercial 154 Runwal Group Commercial 155 Marithon Commercial 156 Nirmal Lifestyle Commercial 157 Sewage Treatment Plant at Nirul Infrastructure 158 Sewage Treatment Plant at Vashi Infrastructure 159 Sewage Treatment Plant at Airoli Infrastructure 160 Trans-Harbour Sea Link Infrastructure 161 International Infotech Park Commercial 162 Rail Project from Thane–Turbhe-Vashi Infrastructure 163 Rail Project from Nerul-Belapur-Uran Infrastructure 164 Rail Project from Belapur-Panvel Infrastructure 165 Amusement Park Commercial 166 International Convention Centre Commercial 167 Commercial City Centre Commercial 168 The Main Spine Commercial 169 Administrative City Centre Commercial 170 International Sports Complex Commercial 171 International Technology Centre Commercial 172 Mass Rapid Transport System (MRTS) Infrastructure 173 Kothari Builders Residential

06309 A2.5
S no. Name of the Project/ Builder Project Details 174 Omaxe Residential 175 Mittal Builders Residential 176 Sagar Builders Residential 177 Evershine Builders Residential 178 Pramukh Enterprises Residential 179 Deshmukh Bulders Residential 180 Supreme Builders Residential 181 Dheeraj Group Residential 182 Kukreja Constructions Residential 183 Gundecha Builders Residential 184 Kumar Builders Residential 185 Atul Builders Residential 186 Everest Developers Commercial 187 Sanghavi Builders Commercial 188 Sanghavi Builders Residential 189 P R Builders Residential 190 Haware Builders Residential 191 Nirmal Group Residential 192 Vikas Construction Residential 193 National Builders & Developers Residential 194 Rizvi Builders Residential 195 Vijay Group Residential 196 Agarwal Group Residential 197 Jawahar Developers Residential 198 Ajmera Group Residential 199 Garodia Group Residential 200 Airport at Thane Infrastructure 201 Lok Group Residential

07101 A3.1
Annexure-3
FUTURE CEMENT AND CONCRETE DEMAND IN GREATER MUMBAI
Estimated Cement Demand (FY 2007 - FY 2012):
Figures in ‘000 t per annum
Year Mumbai City Thane Navi Mumbai Total
2006-07 2,495 1,250 2,495 6,240 2007-08 2,895 1,410 2,880 7,185 2008-09 3,330 1,580 3,325 8,235 2009-10 3,830 1,770 3,840 9,440 2010-11 4,365 1,965 4,420 10,750 2011-12 4,890 2,140 5,040 12,070
Note: ACC has a market share of around 19 % in Greater Mumbai market. Estimated Concrete Demand (FY 2007 - FY 2012):
Figures in ‘000 cu m per annum
Year Mumbai City Thane Navi Mumbai Total
2006-07 4,705 2,035 4,230 10,970 2007-08 5,300 2,295 5,380 12,975 2008-09 6,095 2,610 5,875 14,580 2009-10 7,010 2,990 7,035 17,035 2010-11 7,990 3,315 8,205 19,510 2011-12 8,950 3,615 10,650 23,215

Holtec Consulting Private Limited Holtec Centre A Block, Sushant Lok Gurgaon-122 001, Haryana, India Phone: + 91 124 2385095, 2385096, 4047900*
Fax: + 91 124 2385114, 2385116* *From Delhi Prefix ‘95124’