ro - national stock exchange of india
TRANSCRIPT

January 28, 2021
The SecretaryNational Stock Exchange of India LimitedExchange Plaza,Bandra Kurla ComplexMumbai - 400051
The SecretaryBSE LimitedPhiroze jeejeebhoy TowersDalai StreetMumbai - 400 001
Symbol : EQU1TASBNK Scrip Code : 543243
Dear Sir/ Madam
Sub: Intimation under Regulation 30 of Securities and Exchange Board of India (ListingObligations and Disclosure Requirements) Regulations, 2015 -Investor Presentation -03
Pursuant to Regulations 30 & 46 of the 5EB! (Listing Obligations and DisclosureRequirements) Regulations, 2015 "SEB1 (LODR) 2015", the Investor Presentation on theunaudited financial results for the quarter ended December 31, 2020 to be made to Analystsand Investors is enclosed .The above information will be made available on the Bank's website www,equitasbank.coin.
Kindly take the above information on record.
Thanking you.
Yours trulyfor Equitas Small Finance Bank Limited
i
Sampathkumai K RCompany Secretary w / Chennai
roroEquitas Small Finance Bank Limited tO
(Previously known as Equitas Finance Limited) CO4,f' Floor, Phase II, Spencer Plaza, No.769, Mount Road, Anna Salal, Chennai, Tamil Nadu, India - 600 002T: +91 444299 5000 | F: +91 44 4299 5050 j [email protected] | wvwv.equitasbank.com
Toll Free 1800 103 1222 | C1NNoU65191TN1993PLC0252B0 C.

Q3FY21 Investor Presentation

Disclaimer
Disclaimer:
The information in this document, including facts and figures, is being provided by Equitas Small Finance Bank Limited (the “Bank”) for informational purposes only andcould be subject to change without notice. The information has also not been independently verified. No representation or warranty, express implied, is made as to theaccuracy, completeness or fairness of the presentation and the information contained herein and no reliance should be placed on such information. The Bank or anyother parties whose name appears herein shall not be liable for any statements made herein or any event or circumstances arising therefrom.
This presentation or any part of it or the fact of its, form the basis of, or be relied on in connection with, any contract or commitment therefore. This document has notbeen and will not be reviewed or approved by any statutory or regulatory authority in India or any other jurisdiction or by any stock exchanges in India or elsewhereThis document and the contents hereof are restricted for only the intended recipient(s). This document and the contents hereof should not be (forwarded or deliveredor transmitted in any manner whatsoever, to any other person, other than the intended recipients(s) or reproduced in any manner whatsoever. Any forwarding,distribution or reproducing of this document in whole or in part is unauthorized.
Forward Looking Statements:
Certain statements in this document with words or phrases such as “ will”,“ etc. and similar expressions or variation of these expressions or those concerning our futureprospects are forward looking statements. Actual results may differ materially from those suggested by the forward looking statements, due to a number of risks oruncertainties associated with the expectations. These risks and uncertainties include, but not limited to, our ability to successfully implement our strategies, change ingovernment policies etc. The Bank may, from time to time, make additional written and oral forward looking statements, including statements contained in the Bank’sfilings with the stock exchanges and our reports to shareholders.
The Bank does not undertake to update any forward looking statements that may be made from time to time by or on behalf of the Bank.
2

Contents
3
02Financial Performance
Page : 11
03Advances
Page : 15
04Liabilities & Branch Banking
Page : 24
05Financials
Page : 34
01Key Highlights
Page : 06

4
Journey of building a Stable, Sustainable and Scalable Bank
22.90% 21.80% 21.50%19.70% 19.22% 18.90% 18.88%
10.70% 10.10% 9.40%8.00% 8.55% 9.11% 8.47%
46.53% 46.42%
53.16%
66.33%
70.72%
75.39%
79.21%
5.00%
15.00%
25.00%
35.00%
45.00%
55.00%
65.00%
75.00%
85.00%
-
2,00 0
4,00 0
6,00 0
8,00 0
10,0 00
12,0 00
14,0 00
16,0 00
18,0 00
20,0 00
FY15 FY16 FY17 FY18 FY19 FY20 Q3FY21
Micro Finance Small Business Loans Vehicle Finance MSE Finance NBFC Yield NIM Secured Book %
4,0106,125
7,1768,238
11,704
15,367
17,373
Demonetisation
Cyclone Gaja
Covid-19
IndicatorsFY15 - FY21
Change
Yield -4.02
NIM -2.23
CoF 4.67
Cost to Assets 1.87
Net positive impact
0.29

12.10%11.30%
10.10%
8.49%8.21% 7.97%
7.39%
FY15 FY16 FY17 FY18 FY19 FY20 9MFY21
5
53.60% 52.98%
63.44%
79.97%
70.30%66.38%
59.93%
FY15 FY16 FY17 FY18 FY19 FY20 9MFY21
2.96% 3.09%
2.02%
0.30%
1.45% 1.39%1.64%
FY15 FY16 FY17 FY18 FY19 FY20 9MFY21
11.15%
13.30%8.92%
1.57%
9.85% 9.84%
12.34%
FY15 FY16 FY17 FY18 FY19 FY20 9MFY21
Road to profitability
Improving profitability despite COVID-19 impact shows sustainability of our model
SFB ConversionNBFC
Operating Leverage
NBFC Demonetization COVID - 19
Co
st o
f Fu
nd
sC
ost
to
Inco
me
Ro
AR
oE

Key Highlights
6

Snapshot
7
Yield on Gross Advances:18.88% [18.63%]
Deposits Per Branch (branch banking outlets): Rs. 41 Cr [Rs. 26 Cr]
Operational
17 States and UTs
861 Banking Outlets
330 ATMs
296 Business Correspondents
40+ Lac total customers16,036 employees
Asset Offerings Liability Profile Financials
Gross Advances: Rs. 17,373 Cr [Rs. 14,615 Cr]SBL- 43%, VF - 25%, MFI- 20%, MSE – 6%, NBFC – 5%
Disbursements: Rs. 2,461 Cr [Rs. 3,080 Cr]SBL – 35%, VF - 25%, MFI – 24%, MSE – 4%, NBFC – 10%
Asset Quality*: GNPA: 4.16% [2.86%]NNPA: 1.71% [1.73%]PCR: 59.88% [43.44%]
Total Deposits: Rs. 15,862 Cr [Rs. 10,493 Cr]
Third Party Products:Insurance Premium Collected Rs. 16.28 Crs [Rs. 8.78 Cr]Mutual Fund AUM Rs. 138.41 Cr [Rs. 135.96 Cr]
Daily Average Cost of Funds: 7.27%SA – 6.49%, TD – 7.62%
PAT: Q3FY21 Rs. 111 Cr [Rs. 94 Cr]9MFY21 Rs 271 Cr [Rs. 201 Cr]
Shareholders funds CRAR – 21.58% Tier I – 20.81%Tier II – 0.77%
RoA: 1.83% [2.11%]RoE: 14.32% [14.86%]
NIM:Q3FY21 – 8.47% [9.17%]
* Proforma NPA assuming NPA recognition as per IRAC norms
Actual GNPA & NNPA with standstill benefit due to Supreme Court Order is 2.23% and 0.65% respectively
GNPA & NNPA including IBPC
Figures in [] represent
Q3FY20 data
SBL – Small Business Loans,
VF – Vehicle Finance MF – Micro Finance
MSE – Micro & Small Enterprise

Highlights – Q3FY21
8
Advances:
• Advances as of Q3FY21 was at Rs. 17,373 Cr, Advances growth of 19% YoY
• Disbursement at 80% pre-Covid level, disbursed Rs. 2,461 Cr in Q3FY21
• 79.21% of advances is secured loans, Microfinance loans constitute 20% with no exposure in Assam and West Bengal
• Collection & Billing efficiency for the month of December 2020 at 105.36% and 88.73% respectively
• Collection efficiency nears pre-covid levels:
• MFI X Bucket Collection efficiency for the month of December 2020, December 2019 & February 2020 at 98.30%, 98.40% & 98.50% respectively
• SBL X Bucket Collection efficiency for the month of December 2020, December 2019 & February 2020 at 99.05%, 99.34% & 99.41% respectively
• VF X Bucket Collection efficiency for the month of December 2020, December 2019 & February 2020 at 95.72%, 95.09% & 96.50% respectively
Liabilities:
• Deposits excluding CD at Rs. 15,691 Cr, growth of 62% YoY and 25% QoQ
• Retail TD at Rs. 5,500 Cr, growth of 79% YoY and 10% QoQ
• Savings Account deposits at Rs. 3,524, growth of 96% YoY and 24% QoQ
• CASA stood at Rs. 3,967 Cr, CASA is 25% of Total Deposits
• Acquired & On boarded over ~1,28,000 Savings Account Customers through Integrated Digital Marketing

Highlights – Q3FY21
9
Profit & Loss:
• Net Interest Income for Q3FY21 at Rs. 484 Cr as against Rs. 384 Cr in Q3FY20, growth of 26% YoY. NIM at 8.47%
• Core Income (Net Income other than PSL Fees, Treasury & Others) at 87%
• PBT before provisions and write off for Q3FY21 at Rs. 275 Cr as against Rs. 158 Cr in Q3FY20, growth of 74%
• PAT for Q3FY21 at Rs. 111 cr as against Rs. 94 Cr in Q3FY20, growth of 18%
Asset Quality:
• COVID related provisions as at December 31, 2020 stood at Rs. 57.01 crore after adjusting Rs 113.62 crores against actual provisioning requirements for slippages in respect of specific loan accounts
• In accordance with the Resolution Framework for COVID-19 announced by RBI on August 6, 2020, as at December 31, 2020, the Bank has approved, for certain eligible borrowers, one-time restructuring of 1.97% of advances
• GNPA at 2.23% in Q3FY21 as compared to 2.39% in Q2FY21 and 2.86% in Q3FY20
• NNPA at 0.65% in Q3FY21 as compared to 1.00% in Q2FY21 and 1.73% in Q3FY20
• The Bank has not classified any NPAs since August 31, 2020; basis the interim order of Hon. Supreme Court. If the Bank had classified borrowers accounts as NPA after August 31, 2020, the Bank's Gross NPA Ratio and net NPA Ratio would have been 4.16% and 1.71% respectively. Pending the decision of the Court, in respect of these accounts made a contingent provision (including on interest accrued) of Rs 180.28 Crores, as a matter of prudence
• Provision coverage ratio to directionally improve as Bank further accelerates IRAC provision norms across DPD buckets

Highlights – Q3FY21
10
Treasury & Liquidity:
• The Bank currently maintains ‘excess’ liquidity in the form High Quality Liquid Assets (HQLA). Liquidity Coverage Ratio (LCR) as on 31.12.2020 at 196%. The Bank intends to revert to ‘adequate surplus liquidity’ of ~130%
• During the quarter, Bank repaid TLTRO borrowings of Rs 124 crores to RBI. Associated Non-SLR securities were shifted out of HTM and partially sold. Profit realised on such sale amounted to Rs. 3 Crore
• During the quarter, Bank sold certain SLR securities from HTM (through OMO / secondary market) and realised profits amounting to Rs. 33 Crore
• During the quarter, Bank sold PSLCs worth Rs. 1,800 Crore. Income recognised on sale of PSLCs for this quarter amounted to Rs. 17.4 Crore
Key Ratios:
• Cost to Income improves to 56.35% for Q3FY21 as compared to 66.24% for Q3FY20 and 58.15% for Q2FY21
• RoA and RoE for Q3FY21 at 1.83% and 14.32% respectively
Capital:
• As of September 30, 2020 Total CRAR at 21.58% and Tier-I CRAR of 20.81%; Well above minimum regulatory requirements of 15% and 7.5%. Tier II Capital at 0.77%
Human Capital:
• Leadership team strengthened with the appointment of Rohit Padhke to spear head Mortgages and vehicle finance and Siby Sebastin as EVP - Operations
• Chief Digital Officer and Deputy CTO appointed to strengthen the Banks digital transformation

Financial Performance
11

8.01%
7.77%
7.56%
7.36%7.27%
Q3FY20 Q4FY20 Q1FY21 Q2FY21 Q3FY21
Cost of Funds Net Interest Margin (NIM)^ Cost to Assets RoA
Credit Cost GNPA & NNPA* Provision Coverage Ratio RoE
Key Ratios
12
9.17%
9.54%
8.63%
9.02%
8.47%
Q3FY20 Q4FY20 Q1FY21 Q2FY21 Q3FY21
6.96%6.54%
5.81% 5.58%5.89%
Q3FY20 Q4FY20 Q1FY21 Q2FY21 Q3FY21
2.11%
0.91%1.15%
1.88% 1.83%
Q3FY20 Q4FY20 Q1FY21 Q2FY21 Q3FY21
1.16%
3.47%
1.77%2.08%
2.96%
Q3FY20 Q4FY20 Q1FY21 Q2FY21 Q3FY21
2.86% 2.72% 2.68% 2.76%
4.16%
1.64% 1.50% 1.39% 1.40% 1.71%
Q3FY20 Q4FY20 Q1FY21 Q2FY21 Q3FY21
GNPA NNPA
43.44% 45.22% 48.79%58.84%
71.16%
Q3FY20 Q4FY20 Q1FY21 Q2FY21 Q3FY21
14.86%
6.31%8.32%
14.44% 14.32%
Q3FY20 Q4FY20 Q1FY21 Q2FY21 Q3FY21
*Actual GNPA and NNPA due to Hon Supreme Court Order (Standstill) is at 2.23% and 0.65% respectively
^ Drop in NIM on account of excess liquidity being carried on the balance sheet
Figure in red box represent proforma PCR
49.87%
59.88%

13
Net income evolution (in Rs. Cr)
Other Income Break-up (Rs. Cr)
Non-interest income * evolution
* Non Interest Income = Other income + PSLC fee income | Net Income is NII + Other Income + PSLC
1.85%
1.52%
0.57%1.11%
2.30%18.26%
14.79%
6.83%
12.13%
23.22%
0.0 0%
5.0 0%
10. 00%
15. 00%
20. 00%
25. 00%
0.5 0%
0.7 0%
0.9 0%
1.1 0%
1.3 0%
1.5 0%
1.7 0%
1.9 0%
2.1 0%
2.3 0%
2.5 0%
Q3FY20 Q4FY20 Q1FY21 Q2FY21 Q3FY21
Non Interest Income as a % of assets Non Interest Income as a % of Net Income
Income Evolution
27%
26%
36%
12%
Liabitlities Segment Fee Income Treasury Gain/ Loss [Net]
Asset Segment Fee Income PSLC Fee Income
384 424 404 461 484
86 74 30 64 146
Q3FY20 Q4FY20 Q1FY21 Q2FY21 Q3FY21
NII Other Income
16%
84%
Banking Fees & Other Charges
Distribution Fee Income

14
Opex evolution
Rs Cr Q3FY20 Q4FY20 Q1FY21 Q2FY21 Q3FY21
Employee expenses 184 187 194 188 205
Other expenses 101 100 78 99 131
Depreciation 26 22 19 19 19
Total Operating expenses 311 309 292 305 355
No. of employees 15,836 16,104 15,843 15,879 16,036
Cost to income (%) Opex / Net Income [ Total Income- Finance Cost]| Cost to assets (%) – Opex/ Total Assets
Opex Evolution
6.96%
6.54%
5.81%
5.58%5.89%
66.24%
62.14%
67.27%
58.15% 56.35%
50. 00%
52. 00%
54. 00%
56. 00%
58. 00%
60. 00%
62. 00%
64. 00%
66. 00%
68. 00%
70. 00%
4.0 0%
4.5 0%
5.0 0%
5.5 0%
6.0 0%
6.5 0%
7.0 0%
7.5 0%
Q3FY20 Q4FY20 Q1FY21 Q2FY21 Q3FY21
Cost to Assets % Cost to Income %

Advances
15

16
Advances Evolution & Diversified Book
Rs Cr Q3FY21 Q3FY20 YoY Growth %
Micro Finance 3,491 3,504 -0.37%
Small Business Loans(Incl. HF)
7,496 5,931 26%
Vehicle Finance 4,275 3,591 19%
MSE Finance 988 563 75%
NBFC 898 760 18%
Others † 225 266 -15%
Gross Advances 17,373 14,615 19%
3,491 , 20%
7,496 ,43%
4,275 ,25%
988 , 6%
898 , 5%
225 , 1%
Micro Finance Small Business Loans Vehicle Finance
MSE Finance NBFC Others
† Others includes loan-against-gold, unsecured business loans, overdrafts against fixed deposits and staff loans| Housing Finance (HF) | Micro Small Enterprises (MSE)

17
Advances Evolution & Diversified Book
Rs Cr Q3FY20 Q4FY20 Q1FY21 Q2FY21 Q3FY21
Micro Finance 3,504 3,616 3,618 3,641 3,491
Small Business Loans (Incl. HF) 5,939 6,279 6,484 7,052 7,496
Small Business Loans 4,739 4,995 5,152 5,580 5,890
Housing Finance 536 604 629 715 834
Agri Loans 664 680 703 757 772
Vehicle Finance 3,591 3,760 3,777 4,137 4,275
Used CV 2,550 2,625 2,628 2,835 2,862
New CV 1,041 1,135 1,149 1,302 1,413
MSE Finance 563 669 712 936 988
NBFC 760 818 772 734 898
Others† 258 225 210 231 225
Gross Advances 14,615 15,367 15,573 16,731 17,373
† Others includes loan-against-gold, unsecured business loans, overdrafts against fixed deposits and staff loans| Housing Finance (HF) | Micro Small Enterprises (MSE)

18
Product Segment Details
Product SegmentNumber ofLive Loans
ATS @ Disbursement (Lacs)
ATS @ Portfolio (Lacs)
GNPA*(%)
PCR(%)
Micro Finance 21,31,905 0.26 0.16 5.22% 89.60%
Small Business Loans (Incl. HF) 2,28,962 5.52 3.27 3.02% 35.71%
Vehicle Finance 1,29,911 4.06 3.29 5.49% 47.43%
MSE Finance 1,558 53.69 63.41 1.95% 29.94%
NBFC 76 2,048 1,181 0.69% 20.43%
* Proforma GNPA
ATS stands for Average Ticket Size
45% 27% 28%
MFI AFC HFC
NBFC Exposure Mix MSE Finance
26% 58% 16%
Manufacturing Trading
Services
40%
29%
31%
Less than Rs.5 lakhs
Rs. 5 to Rs. 10 lakhs
Above Rs. 10 lakhs
49%
35%
16%
Less than Rs.5 lakhs
Rs. 5 to Rs. 10 lakhs
Above Rs. 10 lakhs
Small Business Loans Ticket Size Split
Vehicle FinanceTicket Size Split

19
Disbursements Product Wise
Rs Cr Q3FY20 Q4FY20 Q1FY21 Q2FY21 Q3FY21
Micro Finance 1,022 814 132 390 596
Small Business Loans (Incl. HF) 943 682 266 708 873
Small Business Loans 744 532 204 523 654
Housing Finance 107 92 30 115 151
Agri Loans 92 58 32 70 68
Vehicle Finance 815 592 104 508 621
Used CV 566 419 70 309 392
New CV 249 173 34 199 229
MSE Finance 151 135 36 85 100
NBFC 139 171 19 166 245
Others 10 11 7 45 26
Total Disbursements 3,080 2,405 564 1,902 2,461
3,080
2,405
564
1,902
2,461
Q3FY20 Q4FY20 Q1FY21 Q2FY21 Q3FY21
Disbursement (Rs. Cr)

20
417.96 417.32 416.67 399.65 387.60 255.40 247.61 232.37 198.92 130.86
2.86% 2.72% 2.68%2.39%
2.23%1.64% 1.50% 1.39%
1.00%0.65%
-1.00%
-0.50%
0.0 0%
0.5 0%
1.0 0%
1.5 0%
2.0 0%
2.5 0%
3.0 0%
3.5 0%
50.0 0
100 .00
150 .00
200 .00
250 .00
300 .00
350 .00
400 .00
450 .00
Q3FY20 Q4FY20 Q1FY21 Q2FY21 Q3FY21
GNPA (Rs. Cr) NNPA (Rs. Cr) GNPA % NNPA %
Gross NPA Movement (Rs Cr) Q3FY20 Q4FY20 Q1FY21 Q2FY21 Q3FY21
Opening GNPA Balance 377.22 417.96 417.32 416.67 399.65
Add: Additions during the period 127.24 94.13 15.39 22.92 36.47
Less:
i. Upgradations 29.14 39.73 3.19 10.62 11.57
ii. Recoveries (excluding recoveries made from upgraded accounts) 35.34 33.26 4.69 15.82 18.65
iii. Technical or Prudential write-offs 3.64 4.79 5.21 5.54 5.28
Write-offs other than those under (iii) above 18.38 16.99 2.95 7.96 13.02
Closing GNPA Balance 417.96 417.32 416.67 399.65 387.60
Asset Quality Trend
If the Bank had classified borrower accounts as NPA after August 31, 2020, GNPA & NNPA would be 4.16% and 1.71% respectively

21
Collection Efficiency
Product SegmentsCollection Efficiency
December 2020Billing EfficiencyDecember 2020
Micro Finance 97.98% 91.29%
Small Business Loans 104.56% 90.56%
Vehicle Finance 108.39% 82.25%
MSE Finance 192.55% 88.88%
Corporate 149.36% 94.51%
Total 105.36% 88.73%
1. Collection efficiency represents total collections during the month as a percentage of December months total EMIs due2. Billing efficiency represents only the EMIs of December alone collected as a percentage of December months total EMIs due
Major Product SegmentsX Bucket Collection Efficiency
December 2020X Bucket Collection Efficiency
February 2019X Bucket Collection Efficiency
December 2019
Small Business Loans 99.05% 99.41% 99.34%
Vehicle Finance 95.72% 96.50% 95.09%
Micro Finance 98.30% 98.50% 98.40%
Collections touch pre-Covid levels
22
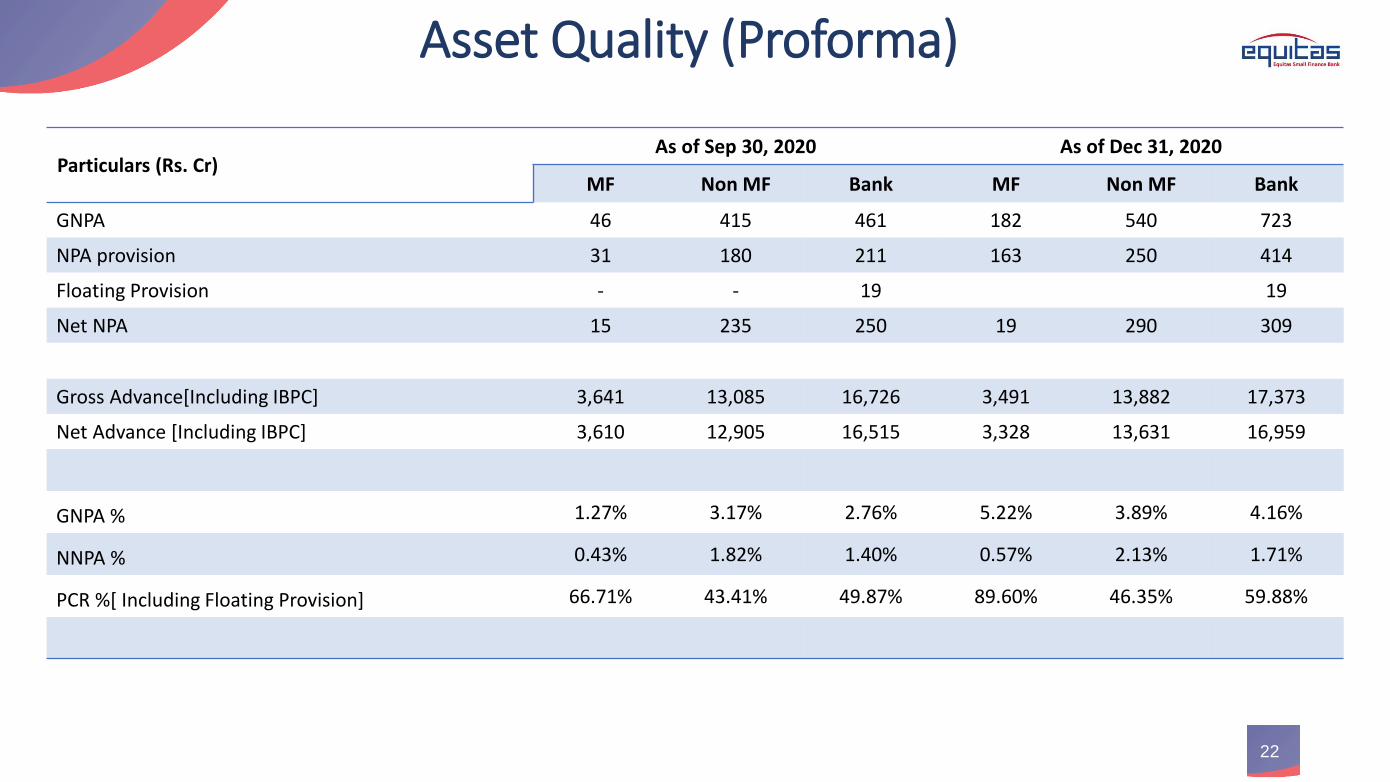
Asset Quality (Proforma)
Particulars (Rs. Cr)As of Sep 30, 2020 As of Dec 31, 2020
MF Non MF Bank MF Non MF Bank
GNPA 46 415 461 182 540 723
NPA provision 31 180 211 163 250 414
Floating Provision - - 19 19
Net NPA 15 235 250 19 290 309
Gross Advance[Including IBPC] 3,641 13,085 16,726 3,491 13,882 17,373
Net Advance [Including IBPC] 3,610 12,905 16,515 3,328 13,631 16,959
GNPA % 1.27% 3.17% 2.76% 5.22% 3.89% 4.16%
NNPA % 0.43% 1.82% 1.40% 0.57% 2.13% 1.71%
PCR %[ Including Floating Provision] 66.71% 43.41% 49.87% 89.60% 46.35% 59.88%

23
Provisions & Contingency
Sr. No Provisions and Contingencies for the Q3FY21 Rs. Cr
1 NPA Provision for the quarter 20.68
Add: Loan assets written off 18.29 38.97
2 Contingency Provision [Standstill]* 85.99
3 Additional Contingency Provision [Standstill due to Acceleration of Provisioning Rates] 78.87
Accelerated Provision for NPA Assets 37.29
116.16
Less: Adjustment of Covid-19 Provision (113.62) 2.54
4 Standard Assets Provisioning 6.8
5 Provision for Depreciation on Government Securities (8.21)
Total Provision for the quarter 126.09
*Includes Rs. 18.07 Crs of interest reversals

Liabilities & Branch Banking
24

25
Customer Deposits Evolution
as on 31 December 2020CA
[Current Account]
SA [Savings Account]
CASA[Low cost deposits]
TD[Term Deposits]
CASA+TD[Customer Deposits]
Balance (Cr) 442 3,524 3,967 11,724 15,691
as a % of total borrowings (Rs. 21,429 Cr) 2% {11%} 16% 18% 55% 73%
as a % of total deposits (Rs. 15,862 Cr) 3% 22% 25% 74% 99%
Avg. balance (Branch Banking Customers) 77,248 58,045 - 8,47,654 -
Update for Q3Y21
Customer Deposits evolution (Rs. Cr)
394 350 330 401 4421,802 1,859 2,024
2,845 3,524
7,473 8,092
9,117 9,342
11,724
Q3FY20 Q4FY20 Q1FY21 Q2FY21 Q3FY21
CA SA TD† Cost of Customer Deposits = Interest paid on Customer Deposits as a % of Average Customer Deposits | Customer Deposits = CASA + Term Deposits
Cost of Deposits = Interest paid on Total Deposits as a % of Average Total Deposits | Total Deposits = Customer Deposits + Certificate of Deposits [CDs]
Daily Average Cost of Deposits (%)
7.66%7.58%
7.49%
7.39%
7.17%
7.64%
7.53%7.47%
7.38%
7.16%
Q3FY20 Q4FY20 Q1FY21 Q2FY21 Q3FY21
Cost of Customer Deposits Cost of Deposits
Figures in {} represent CA as a % of CASA

26
Customer Deposit Profile
930 1,188 1,786
2,378 1,392
1,526
1,703
1,906
Q4FY20 Q1FY21 Q2FY21 Q3FY21
Mass Affluent Customer* (Deposit in Rs. Cr)
Elite Wings
37%
47% 48%
53%
47%
63%
53% 52%
47%
53%
Q3FY20 Q4FY20 Q1FY21 Q2FY21 Q3FY21
Term Deposits (TD) %
Retail TD Bulk TD
46.91%
10.69%
42.40%
Term Deposits Value Slabs
< 2Cr 2Cr to < 10Cr 10Cr +
8.04%
25.71%
28.71%
15.52%
22.02%
Savings Account Value Slabs
< 1L 1L to < 10L 10L to < 1Cr 1Cr to < 10Cr 10Cr +
43%
33%
9%
6%
4%
4%
1%
INDIVIDUALS +PARTNERSHIP FIRMS +PROPRIETORSHIP…
BANKS
PVT.CORPORATES
GOVT./LOCAL BODIES
TRUSTS
OTHERS
PENSION/PROVIDENTFUNDS/ INSURANCE
Deposits by Category
*CASA and TD balances of Premium (Wings & Elite) CASA account holders | Retail TD as defined by RBI

Update on Channels, Acquisition & Product Initiatives
NRI Account Acquisition
218 170
624
829
Q4FY20 Q1FY21 Q2FY21 Q3FY21
Corporate Salary AccountAcquisition
191 185
3,740
6,173
Q4FY20 Q1FY21 Q2FY21 Q3FY21
CASA Account Acquisition
51,076
82,793
1,19,790 1,33,902
Q4FY20 Q1FY21 Q2FY21 Q3FY21
3,380 3,949
9,898 9,778
Q4FY20 Q1FY21 Q2FY21 Q3FY21
High Variant Account Acquisition
27
• In partnership with Aditya Birla Securities Ltd
• Launched in Nov’20
• 5,000+ Accounts opened
• Equitas Eva - Exclusive Women’s account
• Cricketer – Smriti Mandhana as brand ambassador
• 6,000+ Accounts opened
• Dion – Platform for MF investments
• Much improved platform with good UI/UX for investments
• Platform Live
3 in 1 Account
Women’s Account
MF Platform
All acquisition data represent number of accounts

Alliances and Partnerships
28
Sponsorship/ Monetisation of Payments Services• Sub membership for Co-operative Banks
• Looking to onboard a few Medium/Small cooperative Banks
• Micro ATM Services:• 2 to 3 Major players (Paynearby, Spice
Money are using our platform
• Prepaid Cards: Live with one major partnership
• API Banking: Live with 5 partners
Major Fintech Partnerships
• Wealth Management Platform• FD as an investment option to customers• Currently Live
• Neobanking player• Creating a digital platform for NRI segment• Already live for NR with good traction
Other Digital Opportunities
BBPS Biller Acquiring• We are live on bill payment including fetch &
pay

29
2,590 3,512 3,058
29,606
16,52011,609
Q1FY21 Q2FY21 Q3FY21
# Of Policies Issued
GI
LI
6.849.82 8.88
6.88
8.927.40
Q1FY21 Q2FY21 Q3FY21
Premium Collected (Rs. Cr)
LI
GI
Traditional76.2%
Term18.8%
ULIP5.0%
Life InsurancePolicies Sold in Q3FY21
Grp H &PA82.0%
Motor13.0%
Fire3.0%
Others2.0%
General InsurancePolicies Sold in Q3FY21
Overview of TPP Business
121.51
127.16
138.41
Q1FY21 Q2FY21 Q3FY21
MF AUM (Rs. Cr)

30
Debit Card & Spends Snapshot
2,828 7,443 7,847 10,725 18,247 16,289 15,323 24,037
3.17 2.31 2.63
5.73 7.98
9.80 9.02
16.03
-
2.00
4.00
6.00
8.00
10.0 0
12.0 0
14.0 0
16.0 0
18.0 0
-
5,00 0
10,0 00
15,0 00
20,0 00
25,0 00
30,0 00
May June July Aug Sept Oct Nov Dec
Month on Month FasTag Issuance
Month on Month FasTag Issuance FasTag Income (Rs. Lakhs)
35,214 45,501
55,226 59,598 66,145
74,635 79,840 83,352
88,740
April May June July Aug Sept Oct Nov Dec
Unique Card Transactions - ATM
45,652 85,751 92,962 1,04,383 1,11,629
1,84,021
3,93,130
Others RupayPlatinum
VisaSignature
VisaPlatinum
Visa Classic Visa VirtualDebit
RupayClassic
Cards Issued
26 27 25
11 15 22 23 25 28 32 35 37
1.50 1.50 1.50
0.70 0.80
1.20 1.30 1.30 1.50
1.70 1.80 1.80
0.20
0.40
0.60
0.80
1.00
1.20
1.40
1.60
1.80
2.00
0
5
10
15
20
25
30
35
40
Jan-20 Feb-20 Mar-20 Apr-20 May-20 Jun-20 Jul-20 Aug-20 Sep-20 Oct-20 Nov-20 Dec-20
Debit Card Transaction Trend
Spends (Rs. Cr) Transaction Count (in Lakhs)

31
As on 31 December 2020In Rs Cr September 2020 December 2020
TD 9,342 11,724
Refinance 5,571 5,047
CASA 3,246 3,967
CD 312 171
Sub Debt 220 220
Term Borrowing 260 -
IBPC 600 300
Repo Borrowing 124 -
Total Borrowings 19,675 21,429
55%
24%
19%
1%1%
1%
TD
Refinance
CASA
IBPC
Certificate of Deposit
Sub-ordinated Debt
Funding Profile
6.21% 6.21% 6.02% 6.03% 5.86%6.43% 6.49%
8.60% 8.56% 8.39% 8.23% 8.06% 7.90% 7.62%
8.23% 8.25% 8.01% 7.77% 7.56% 7.36% 7.27%
Q1FY20 Q2FY20 Q3FY20 Q4FY20 Q1FY21 Q2FY21 Q3FY21
Daily Average Cost of Funds
Deposit cost - SA Deposit cost- TD Cost of Funds

32
PSLCs
• During the quarter, Bank sold PSLCs worth Rs. 1,800 Crore, Income recognised on sale of PSLCs for this quarter amounted to Rs.17.4 Crore
Borrowings & Liquidity:
• The Bank’s Certificate of Deposit (CD) programme for Rs. 2,000 Crore has highest rating from at CRISIL A1+
• The Bank has adequate advances to avail fresh refinance or raise funds through IBPC (with mix of PSL / Non-PSL) wheneverrequired which provides strong cushion to ALM position of the Bank
• The Bank currently maintains ‘excess’ liquidity in the form High Quality Liquid Assets (HQLA). Liquidity Coverage Ratio (LCR) as on31.12.2020 at 196%. The Bank intends to revert to ‘adequate surplus liquidity’ of ~130%
Category (Rs. Cr) Book Value
SLR 3,691
Non SLR 74
Total 3,765
Investments
Treasury
Total Investment Portfolio of Rs. 3,765 Crore comprises of SLR and Non SLR as given below:
• During the quarter, Bank opted to repay TLTRO borrowings of Rs. 124 Crs to RBI. Associated Non-SLR securities were shifted out of HTM and partially sold. Profit realised on such sale amounted to Rs. 3 Crore
• During the quarter, Bank sold certain SLR securities from HTM (through OMO / secondary market) and realised profits amounting to Rs. 33 Crore

33
Pan India Presence
State Wise Advances
54%13%
11%
4%
3%
4%
2%
2%
2%
2%
1%
1%
0.34%
0.35%
0.10%
Tamil Nadu
Maharashtra
Karnataka
Rajasthan
Madhya…
Gujarat
Haryana
Telangana
Delhi
Punjab
Andhra…
Chattisgarh
Chandigarh
Pondicherry
Uttar…
State Wise Deposits
24%
21%
11%
7%
7%
6%
6%
6%
3%
2%
2%
1%
1%
1%
0.32%
Tamil Nadu
Maharash…
Punjab
Karnataka
Delhi
Haryana
Rajasthan
Chandigarh
Gujarat
Madhya…
Chattisgarh
Uttar…
Andhra…
Telangana
Pondichery
Banking Outlets

Financials
34

35
Particulars (in Rs Cr) Dec-20 Dec-19 YoY% Sept-20 QoQ%
Capital & Liabilities
Capital 1,138 1,053 8% 1,053 8%
Reserves & Surplus 2,143 1,652 30% 1,852 16%
Networth 3,280 2,705 21% 2,905 13%
Deposits 15,862 10,493 51% 12,901 23%
Borrowings 5,266 4,663 13% 6,174 -15%
Other Liabilities & Provision 1,004 649 55% 870 16%
Total 25,414 18,510 37% 22,850 11%
Assets
Cash and Balances With Reserve Bank of India 502 482 4% 426 18%
Balances With Banks and Money At Call and Short Notice 3,547 1,378 157% 1,475 140%
Investments 3,766 2,347 60% 4,292 -12%
Advances 16,816 13,703 23% 15,930 6%
Fixed Assets 188 208 -10% 195 -4%
Other Assets 595 392 52% 532 12%
Total 25,414 18,510 37% 22,850 11%
AUM [On Book + Off Book] 17,373 14,615 19% 16,731 4%
Balance Sheet

36
Particulars (in Rs Cr) Q3FY21 Q3FY20 YoY% Q2FY21 QoQ%
Interest Income from Loans 773 621 24% 730 6%
Income on Investments 60 41 46% 57 5%
Interest on balances with Reserve Bank of India and other inter bank funds
24 15 60% 11 118%
Total Interest Income 857 677 27% 798 7%
Finance Cost
Interest on deposits 259 187 39% 227 14%
Interest on RBI / inter-bank borrowings 2 8 -75% 6 -67%
Other interest 112 98 14% 104 8%
Total Finance Cost 373 293 27% 336 11%
Net Interest Income 484 384 26% 462 5%
Other Income
Processing and Other Fees 50 53 -6% 37 35%
Interest on Securitization / Assignment 3 2 50% 3 0%
PSLC Fee Income 17 14 21% - -
Gain on Sale of G-Secs 38 0 - 1 -
ATM Acquirer Fee Income & TPP Income 17 7 143% 13 31%
Others 22 9 144% 10 120%
Total Other Income 146 86 70% 64 128%
Profit & Loss Statement

37
Profit & Loss Statement
Particulars (in Rs Cr) Q3FY21 Q3FY20 YoY% Q2FY21 QoQ%
Net Income 630 469 34% 525 20%
Employee Cost 205 184 11% 188 9%
Opex 150 127 18% 117 28%
Total Operating Expenditure 355 311 14% 305 16%
PBT before provision & Write-off 275 158 74% 220 25%
Credit Cost 126 40 215% 84 50%
PBT 149 118 26% 136 10%
Taxes 38 24 58% 33 15%
PAT 111 94 18% 103 8%

Thank YouInvestor Relations
Equitas Small Finance Bank Limited
Website – https://ir.equitasbank.com/
Email – [email protected]
Twitter - @EquitasIR
4th Floor, Phase II, Spencer Plaza, No. 769, Mount Road, Anna
Salai, Chennai 600 002, Tamil Nadu