road infrastructure cost and revenue in...
TRANSCRIPT
Report Karlsruhe/Delft, April 2008 Authors: Claus Doll (Fraunhofer-ISI)
Huib van Essen (CE Delft)
Road infrastructure cost and revenue in Europe
Produced within the study Internalisation Measures and Policies
for all external cost of Transport (IMPACT) – Deliverable 2
Version 1.0
CE Delft Solutions for environment, economy and
technology
Oude Delft 180
2611 HH Delft
The Netherlands
tel: +31 15 2150 150
fax: +31 15 2150 151
e-mail: [email protected]
website: www.ce.nl
KvK 27251086
CE DelftSolutions for
environment,
economy and
technology
Oude Delft 180
2611 HH Delft
The Netherlands
tel: +31 15 2 150 150
fax: +31 15 2 150 151
e-mail: [email protected]
website: www.ce.nl
KvK 27251086
Publication Data
Bibliographical data: Road infrastructure cost and revenue in Europe Produced within the study Internalisation Measures and Policies for all external cost of Transport (IMPACT) – Deliverable 2 Delft, CE, 2008 Transport / Infrastructure / Roads / EC / Costs / Policy / Taxes / Charges / Pricing / International / Regional Publication number: 08.4288.17 CE-publications are available from www.ce.nl Commissioned by: European Commission DG TREN. Further information on this study can be obtained from the contact Huib van Essen. © copyright, CE, Delft
This report is printed on 100% recycled paper.
CE Delft Solutions for environment, economy and technology
CE Delft is an independent research and consultancy organisation specialised in developing structural and
innovative solutions to environmental problems. CE Delfts solutions are characterised in being politically
feasible, technologically sound, economically prudent and socially equitable.
For the latest information on CE Delft check out our website: www.ce.nl.

Contents
Executive Summary 1
1 Introduction - formulating the challenge 5 1.1 Background and aim of the IMPACT project 5 1.2 Scope of this report 6 1.3 Framework and purpose of this report 7 1.4 Incorporating the results into the IMPACT scenarios 8 1.5 Structure of the report 10
2 Total and average road infrastructure costs for Europe 11 2.1 Overview of accounts 12 2.2 Review of methods and options 12
2.2.1 Expenditures vs. economic costs 12 2.2.2 The Perpetual Inventory Method 14 2.2.3 The Synthetic Method 16 2.2.4 Comparing the PIM approach to the Synthetic Method 17 2.2.5 Cost categories 20 2.2.6 Interest rates and depreciation models 22 2.2.7 Cost allocation procedures 23
2.3 Studies and results 24 2.4 Accounting framework for European cost estimates 26
2.4.1 Road network classification 26 2.4.2 Vehicle types 27 2.4.3 Vehicle kilometres 28 2.4.4 Socio-economic data 29
2.5 Procedure for cost extrapolation 30 2.5.1 Data structures and methods for total cost estimation 31 2.5.2 Application of existing studies 33 2.5.3 Regression analysis on unit infrastructure costs 33 2.5.4 Cost allocation and average costs 36
2.6 Results for unit costs per network kilometre 39 2.7 Average road Infrastructure cost accounts 41
3 Marginal road infrastructure costs for Europe 45 3.1 Methodological issues and options 45
3.1.1 Scope and rationale of marginal infrastructure cost estimation excluding congestion 45 3.1.2 Short and long term marginal infrastructure construction costs46 3.1.3 Option 1: Econometric models 46 3.1.4 Option 2: The duration or engineering approach 47
3.2 Available studies and results 47 3.2.1 Results on total cost elasticities 47 3.2.2 Average and marginal costs 50
3.3 Value transfer procedure 52
4 Road revenue accounts 55 4.1 Earmarked tax revenues 55 4.2 The revenue accounting framework 57
4.2.1 Revenue categories 57 4.2.2 Data sources 58
4.3 Average road transport-related revenues for Europe 58 4.4 Revenue to cost ratios 61
5 Core findings and conclusions 67 5.1 Full cost accounting methods 67 5.2 Cost allocation procedures 67 5.3 Total road infrastructure cost results for Europe 68 5.4 Average costs by vehicle category 69 5.5 Marginal costs of infrastructure use 69 5.6 Revenue to cost ratios 70 5.7 The policy perspective 70 5.8 Need for further research 71
References 73
A Selected output tables of the cost and revenue database 87

4.288.1/Road infrastructure cost and revenue in Europe – IMPACT D2 April 2008
1
Executive Summary
The estimation and internalisation of the external costs of transport have been important issues for European transport research and policy development for many years. In the light of Article 1(9) of the Eurovignette Directive 2006/38/EC (amending Article 11 of the previous Directive 1999/62/EC), the central aim of the IMPACT study is to provide an overview of approaches for estimating and internalising the external costs of transport. The results are presented in the separate deliverables of the IMPACT project, Deliverable 1 and Deliverable 3 respectively. These deliverables cover environmental, accidents and congestion costs. The internalisation of these various types of external costs is strongly related to the charging for the use of transport infrastructures. Within the framework of the IMPACT project, the Commission therefore also requested an analysis of infrastructure cost. Contrary to the other deliverables of IMPACT, the scope of this work is limited to road transport. Deliverable 2 of the IMPACT study summarises the current cost structures and revenues of European road infrastructure. It extends the External Cost Handbook (IMPACT Deliverable 1), which does not cover infrastructure costs, and provides direct input to the pricing scenarios defined and analysed in IMPACT Deliverable 3. The cost structures include discussions of total costs and their variability with region and traffic characteristics, average costs by vehicle type as well as the marginal social infrastructure costs. Revenues associated with road transport are classified by type and variability. Estimating the economic costs of transport infrastructure including depreciation and interest on capital and running costs can be done using the Perpetual Inventory Method (PIM) or the Synthetic Method. Each of these accounting philosophies has its own strengths and weaknesses. Having conducted a thorough check of each of the arguments, we recommend the Synthetic Method for infrastructure accounting purposes. This method is considered superior if there is no tradition of calculating infrastructure costs with the PIM approach due to the better availability of the required data, the reflection of current infrastructure quality and the relation of cost accounting to existing physical objects of the road network. Total costs have been derived by analysing the results of recent studies. The UNITE country accounts and the national studies for Germany, Switzerland, Austria and the Netherlands were the most important ones. The unit costs per road kilometre by road class were derived from these sources. Data quality is considered to be detailed for six and general for ten countries, while no sufficient data was found at all for thirteen countries.

4.288.1/Road infrastructure cost and revenue in Europe – IMPACT D2 April 2008 2
There are similarities of cost levels and cost structures between the big Western European countries. For these countries we found values between € 600,000 (Austria, Germany, Italy, Spain) and € 800,000 (France) per motorway kilometre. The main findings were that unit costs for motorways are roughly ten times higher than for trunk or urban roads. Only motorway costs showed some, but very limited, co-linearity with the price index for construction services across countries. Regional results for Austria and Switzerland reveal that the running costs are 20 to 50% higher in mountainous areas than in relatively flat regions. Results for capital costs are not available, but it can be suspected that the need for more bridge and tunnel constructions pushes up construction costs in mountainous areas considerably. Average costs are derived by dividing the total costs by the traffic volume (in vehicle kilometres). The level of average costs is thus not only driven by construction prices, running costs and accounting methodologies, but to a large extent by traffic density. Accordingly, the remote countries (Sweden, Finland, Ireland) show much higher values than the central transit countries. For HGVs on motorways, the specific average costs have been found to vary considerably with vehicle weight from 4 €-ct/vkm for a 5.5t lorry to 19 €-ct/vkm for a 40t truck and trailer combination. The GRACE case studies indicate that variable average costs may be a good proxy for the marginal costs of infrastructure use. For motorways in the six countries with detailed accounting information, the share of variable costs across all vehicle categories is 22%. For all other countries and road classes, the share of variable infrastructure use costs is 26%. Pure marginal infrastructure cost pricing would thus lead to a deficit of more than 74% of total infrastructure costs. For the six countries with detailed accounting information, the marginal costs for light lorries (3.5t to 7.5t) range between 0.20 €-ct/vkm (France and Italy) and 51 €-ct/vkm (Switzerland). For HGVs above 32t, the range is from 5.57 €-ct/vkm for Austria to 52 €-ct/vkm for Sweden. These extreme ranges make it questionable, whether the proxy of average variable costs for marginal infrastructure use costs remains valid. Marginal costs appear to be considerably higher on secondary roads than on motorways in countries with dense motorway traffic. The ratio between trunk roads and motorways was above six for Italy and 0.7 for Sweden. In the EUR-29, the average marginal costs on trunk roads are roughly double the costs on motorways for 40t HGVs. The study reviewed several sources on national taxes and charges to estimate total and average revenues. The comparison with infrastructure costs shows that, when considering all transport-related taxes and charges, HGV traffic on motorway roughly covers its infrastructure costs, but does not contribute to public budget financing. If the tax share which is not earmarked for transport purposes is removed, the cost coverage drops to 60%. Comparing variable taxes and

4.288.1/Road infrastructure cost and revenue in Europe – IMPACT D2 April 2008
3
charges with variable costs shows that countries with road user charge systems considerably overprice lighter HGVs. It can be concluded that a rough computation of road infrastructure costs for all European countries is possible using simple value transfer rules. But in order to obtain reliable information, national studies per road type are inevitable. Further additional research on the development of investment, running, average and marginal costs is required which takes regional characteristics into account. This report contains a set of indicative figures on the total costs and total revenues for twenty-seven countries, nine vehicle classes, three road classes and variability. The figures obtained can in no way replace detailed national studies.

4.288.1/Road infrastructure cost and revenue in Europe – IMPACT D2 April 2008 4

4.288.1/Road infrastructure cost and revenue in Europe – IMPACT D2 April 2008
5
1 Introduction - formulating the challenge
1.1 Background and aim of the IMPACT project
The estimation and internalisation of the external costs of transport have been important issues for European transport research and policy development for many years. The European Commission has raised the issue of internalising the external costs of transport in several strategy papers, such as the Green Book on fair and efficient pricing (1995), the White Paper on efficient use of infrastructure, the European Transport Policy 2010 (2001) and its midterm review of 2006. The issues of external cost estimation and internalisation have also been extensively studied in a number of European Framework Programme projects (e.g. UNITE, PETS, ExternE, IMPRINT, REVENUE, MC-ICAM, TRENEN, GRACE). With the amendment of Directive 1999/62/EC on the charging of heavy goods vehicles for the use of certain infrastructures the subject has come to the forefront of attention. Article 1(9) of the Eurovignette Directive 2006/38/EC (amending Article 11 of the old Directive 1999/62/EC) requires the Commission to present a generally applicable, transparent and comprehensible model for the assessment of all external costs (including those caused by non-road modes). This model is to serve as the basis for future calculations of infrastructure charges. The model must be accompanied by an impact analysis on the internalisation of external costs for all modes of transport and a strategy for a stepwise implementation. The aim of the IMPACT study is to provide a comprehensive overview of approaches estimating external costs, and an analysis of internalisation strategies, including an assessment of the impacts of various alternatives. The results of IMPACT, based on the enormous amount of material available on these issues, should help the Commission with the development of a Communication as requested by Directive 2006/38/EC. The issue of internalising external environmental, accidents and congestion costs is strongly related to charging for infrastructure costs. Within the framework of the IMPACT project, the Commission therefore also requested an analysis of infrastructure costs. Contrary to the other work within IMPACT, the scope here is limited to road transport. In brief, the results of the IMPACT study are laid down in three deliverables: 1 Deliverable 1 - Handbook on external cost estimates. 2 Deliverable 2 - Report on road infrastructure costs, taxes and charges. 3 Deliverable 3 - Report on internalisation strategies. This report constitutes the second deliverable. It extends the External Cost Handbook (IMPACT Deliverable 1) which does not cover infrastructure costs. In addition, the quantitative results of this deliverable (estimating road infrastructure
4.288.1/Road infrastructure cost and revenue in Europe – IMPACT D2 April 2008 6
costs and revenues of road transport taxes and charges) have been used in the impact assessment of Deliverable 3. Deliverable 2 focuses on the estimation of infrastructure costs. It does not discuss the various options for charging these costs. This issue is touched upon in Deliverable 3 to the extent that it is related to internalisation approaches, which are the core subject of that deliverable.
1.2 Scope of this report
Given the importance of the road sector in the transport pricing debate, this deliverable seeks to quantify a number of key cost and revenue figures for the European road network. This report aims: 1 To provide an overview of the full economic costs of the European road
network by network type, country, user group and cost variability. 2 To derive appropriate levels of user costs related to the investment, wear and
tear and operation of the road network. 3 To analyse current tax and charge levels by type, country, road class, user
group and variability. 4 To benchmark average costs, marginal costs and revenues against each
other to identify equity and financial viability issues. The scope of this study is the extended European Union (EU-27) plus Norway and Switzerland. Data is provided for the year 2005 for three road classes: motorways, other trunk roads and local streets. Costs and revenues are further broken down into 10 vehicle classes according to the TREMOVE classification. These are: 1 Small cars including station wagons. 2 Big cars including SUVs. 3 Motorcycles. 4 Bus and coach. 5 Light duty vehicles (LDVs) <3.5t, incl. delivery vans. 6 Heavy goods vehicles (HGVs) 3.5 t-7.5t. 7 Heavy goods vehicles (HGVs) 7.5 t-18t. 8 Heavy goods vehicles (HGVs) 18t -32t. 9 Heavy goods vehicles (HGVs) >32t. In the end, cost elements are assigned to fixed and variable cost blocks as a starting point for deriving marginal costs. Variable cost elements in the framework of this study refers to a medium time horizon, including the life expectancy of major road infrastructure assets. This is commonly 30 to 40 years, but differs between assets.

4.288.1/Road infrastructure cost and revenue in Europe – IMPACT D2 April 2008
7
1.3 Framework and purpose of this report
Current EU legislation encourages Member States to charge vehicles for the use of transport infrastructure by levying average or marginal infrastructure costs. While Directive 2006/38/EC requires the road user charges on the trans-European networks to be based on weighted average infrastructure costs1, i.e. to charge weighted average tolls, the Commission’s vision for a fair and efficient transport system laid down in the 1998 White Paper and its implementation in the second railway package by Directive 2001/14/EC recommend marginal social cost based tariffs (paragraph (3-4)) and a system of mark-ups to recover total costs (paragraph 8 (1)). The term ‘weighted average’ tolls in the Eurovignette Directive means that tariffs may be differentiated by various criteria (vehicle weight, emissions, time of day, etc.) as long as the total revenues meet the total costs for operating, maintaining, renewing and financing the road network. Thus, both types of charging systems need to be taken into consideration. Although the Eurovignette Directive permits Member States to set weighted average tolls below weighted average infrastructure costs, the coverage of total costs by transport pricing revenues will remain an important aspect in European transport policy for the coming decades due to the public budget considerations of the Member States and given the growing interest in Public Private Partnerships (PPP) to finance transport infrastructure. Covering total costs can be achieved by setting average cost-based infrastructure prices, by imposing various types of mark-ups on marginal infrastructure costs or by fine tuning a system of marginal infrastructure and congestion costs, which includes the thorough consideration of incentive and intermodal and interregional cross-funding schemes. The decision criteria for selecting one of these options include the dominance of fiscal rules, the expected predictability and robustness of costs and revenue flows, technical options, transaction costs and of course network and demand structures. Against this background, Deliverable 2 of the IMPACT study summarises the evidence on the current cost structures and revenues of the European road infrastructure. Cost structures include discussions of total costs and their variability with regional and traffic characteristics, average costs by vehicle type as well as the marginal social costs of infrastructure use. The marginal infrastructure costs presented in this study are relevant from the perspective of marginal social cost pricing, which is the benchmark of pricing schemes under ideal conditions. They have been based on estimated average costs and on the ratios between marginal and average infrastructure costs following the elasticity approach proposed by the GRACE project (Lindberg, 2006).
1 Paragraph 1 (2e) amending §7 (9) and (10) of Directive 1999/62/EC and Annex II, Section 2 amending
Annex III of DIR 1999/62/EC.

4.288.1/Road infrastructure cost and revenue in Europe – IMPACT D2 April 2008 8
In addition to the marginal infrastructure costs, estimates for total (full) and weighted average infrastructure costs are presented as well as including capital costs due to investment activities. These figures are relevant for several reasons: 1 Weighted average costs by type of activity (investment, renewal,
maintenance, operation) are used in this report for calculating marginal social infrastructure costs.
2 Even under a marginal social cost pricing regime, the recovery of total infrastructure costs remains a politically relevant issue. Data on full or average infrastructure costs help to understand whether and under which conditions a marginal infrastructure cost based pricing scenario could meet the total budget requirements of transport network providers. Total or average infrastructure cost levels may, for instance, help in setting politically acceptable caps on congestion charges.
3 Under prevailing legal conditions, weighted average infrastructure costs are the basis for setting maximum levels of road user charges as permitted by the Eurovignette Directive 1999/62/EC (Annex III) and its current amendment (Directive 2006/38/EC). Without actually preventing Member States from setting lower charges, the Directive does recommend that toll revenues should meet total infrastructure costs. The German Governmental Commission on Transport Infrastructure Financing (Paellmann, 2000) advocates a decoupling of transport financing from fluctuating public budgets in this respect with limited cross-financing between modes.
In addition to road infrastructure costs, this study also presents revenues from the taxes and charges associated with road transport. These revenues are classified by type and variability. Cost and revenue figures are generated for all 27 EU Member States plus Switzerland and Norway for the year 2005. Missing data are estimated in order to provide a complete and consistent data set across Europe, covering all cost and revenue categories. It should be noted that road infrastructure costs and revenues are regarded in a European perspective. Limitations in the project resources may cause deviations of the reported figures from the transport account statistics for individual countries. The figures presented here give a well balanced picture of road infrastructure costs across Europe, but may not be used to benchmark national pricing systems. Local studies are required to do so.
1.4 Incorporating the results into the IMPACT scenarios
Five scenarios, including seven different variants, were defined for the impact assessment (see IMPACT Deliverable 3). These scenarios with strategies for internalising the external costs of all modes of transport throughout the EU consider two alternative treatments of road infrastructure costs: − Existing charge systems remain in place. − Replacing the current infrastructure charges by a system of tariffs based on
marginal infrastructure costs, to some extent with added marginal social congestion charges.

4.288.1/Road infrastructure cost and revenue in Europe – IMPACT D2 April 2008
9
The scenarios differ in the way internalisation is pursued, and also in their ambition level regarding internalisation. It should be noted that another option, namely charging for average infrastructure costs across the entire European road network with added measures for internalising external costs, has not been assessed. The reason for this is that the scenarios (selected in consultation with the Commission services) focus on approaches for internalising external costs (being the subject of the study) rather than on variants for charging infrastructure costs. An overview of the parts of the scenarios that are related to road transport2 is given in Table 1.
Table 1 Summary of IMPACT scenarios (measures for road transport)
Scenario Infrastructure charges (tolls)
Circulation tax Fuel tax Bottleneck /cordon charges
1 Reference Existing tolls + for HGV at level of fixed charges (revenue neutral)
Current purchase + circulation taxes, CO2 based
EU minimum where national rates are lower; elsewhere current rates
-
2 Internalisation through fuel taxes
As (1) As (1) EU minimum + external costs (accidents, air, noise)
3 Internalisation through km-charges
As (1) + circulation taxes (1) for cars + externalities (accidents, air, noise) for all vehicles, all roads
Non for cars, as (1) for HGVs
EU minimum
4A Smart charging with minimum fuel tax
As (3)
4B Smart charging with current fuel tax
Marginal infra costs + externalities (air, accidents, noise) for all vehicles
Non for cars, as (1) for HGVs
As (1)
Congestion (selected modes only)
5A Pragmatic, HGV charges on all roads
As (1) for cars, marginal infra costs + externalities (air, accidents, noise) for HGVs on all roads
5B Pragmatic, HGV charges on motorways
As (5A) with HGV charges on motorways only
As (1) for all vehicles + externalities (noise, air, accidents) for cars
As (1) for all vehicles, reduction according to increase of other taxes (not below minimum) for HGV
As (4)
Note: EU minimum = minimum excise duty rates as foreseen by the commercial diesel proposal.
2 Note that the internalisation scenarios cover all modes of transport. The full scenario descriptions can be
found in IMPACT Deliverable 3.

4.288.1/Road infrastructure cost and revenue in Europe – IMPACT D2 April 2008 10
1.5 Structure of the report
In addition to this introduction, the report consists of six chapters. Chapter 2 discusses selected theoretical issues related to the pricing of infrastructures. It thus paves the way for the compilation of the cost and revenue database. Chapter 3 presents the approach, the data sources and the results of estimating the total and average infrastructure costs for all European countries, road types and vehicle classes. It therefore contains a section on road traffic demand which is used in other sections, too. Chapter 4 presents the available evidence on the marginal costs of road infrastructure and allocates them to the various countries and road classes. With this information the chapter accomplishes the road cost database building on the work of the previous section. Chapter 5 describes the process and the results of collecting road transport related revenue data. Chapter 6 compares average costs, marginal costs and revenue using various characteristics. The emerging policy conclusions are finally discussed in Chapter 7.

4.288.1/Road infrastructure cost and revenue in Europe – IMPACT D2 April 2008
11
2 Total and average road infrastructure costs for Europe
The introductory chapter emphasised the importance of total and average cost estimates for deriving marginal cost figures and setting the IMPACT scenarios in relation to road network (re)financing needs. Accordingly, this chapter aims at building up a quantitative database on total road infrastructure costs for all 29 countries considered and all road classes. By allocating these costs to cost categories and to vehicle types, weighted average road infrastructure costs are obtained, where the weights are set according to vehicle characteristics which impact the costs of road construction, renewal, maintenance and operation. Environmental and safety aspects are disregarded in this report. Due to the poor data situation of European road accounts, the figures were mainly generated using a limited number of country studies, which were extrapolated to all 29 countries. The results of this report can thus in no way replace national studies when designing local pricing policies. According to the mandate, this report is restricted to road infrastructure. However, rail and aviation infrastructure, where a high degree of privatisation has occurred over the last decades, were also briefly considered while reviewing the studies. The insights gained from this include the following: 1 The data situation for rail transport appears to be even worse than for roads.
This is due to the still strong presence of the public sector in network management combined with the privacy rules of new market structures enforced by the railway packages of the EC. The management of railway networks is still dominated by the decision power of small regional units; central planning systems are established only slowly.
2 In aviation, local and municipal authorities play a big role in financing airport infrastructure as airports are expected to be catalysts for economic development. Thus, the sector is granted considerable subsidies which are commonly hidden in other public budget titles. Moreover, airports are generally a mixture between transport and commercial (retail) infrastructure. Separating investment grants or running expenditures for the transport sector appears to be difficult or extremely arbitrary.
3 The data availability for rail and aviation facilities is even worse than for roads on account of the privacy status of railway undertakings after the liberalisation of European rail markets and the partly private status of many airports. Thus, it will hardly be possible to establish a comparably comprehensive cost database as was able to be done within the scope of this study for the road sector.
4.288.1/Road infrastructure cost and revenue in Europe – IMPACT D2 April 2008 12
2.1 Overview of accounts
Accounting for the economic costs of road transport is a tradition mainly in the German speaking countries. The following international studies were analysed: 1 Doll (2005): Results of European road accounting studies new approaches to
allocate common costs. 2 UNITE (2003): EC project determining infrastructure and external cost
accounts for 18 European countries, all modes and three years (1996, 1998, 2005). Moreover, the project has carried out several case studies on the marginal costs of different cost categories across Europe.
3 GRACE (2007): EC Study quantifying the variation of marginal costs of all modes and categories with traffic and exogenous parameters on the basis of several European case studies.
4 ASECAP (2007): Statistics on revenues and traffic performance on European toll roads.
On a national level, the following accounting studies were used: 5 ProgTrans/IWW (2007): Succeeding Prognos/IWW (2002): Calculation of the
tariffs of the German HGV motorway charge according to the provisions of Directives 1999/62/EC and 2006/38/EC on behalf of the German Ministry for Transport, Building and Urban Development (BMVBS).
6 Herry/IWW/NEA/Sniezek (2002): Study for the Austrian Motorway and Express Roads Financing Society (ASFINAG) on calculating the tariffs for the national HGV motorway charging system in Austria.
7 ITS (2001): Study quantifying the external costs of transport for the UK in 1998.
8 BFS (2007): Swiss road accounts for 2005. Methodology and results of costs and revenues of the Swiss road sector.
The subsequent elaborations use key values and findings from these studies updated for the year 2005.
2.2 Review of methods and options
2.2.1 Expenditures vs. economic costs
Accounting for the total resources consumed by the construction, maintenance and operation of long life infrastructures can either be done by simply summing up expenses or by using real economic accounts. The latter take into account the direct expenses plus the financing costs or - regarded from a different point of view - the opportunity costs for not spending the resources for more profitable purposes. Financing and opportunity costs are expressed by the interest on capital, where the interest rates vary with the legal status of the investor. Private investors expect greater profits and account for more profitable, alternative forms of money spending than public bodies and thus assign higher interest rates to the computation of capital costs.

4.288.1/Road infrastructure cost and revenue in Europe – IMPACT D2 April 2008
13
As financing and budget allocation are issues for public bodies as well as for private investors, full economic accounts are preferred to summing up expenditures in all cases. Further, the examples of road expenditures given in the tables below demonstrate that these figures may vary widely by year and area. This is due to the long planning and construction phases of big projects, varying quality standards, local conditions and budgetary reasons. The examples show the expenditures for new and enlargement projects (Table 2) and the expenditures for maintenance (including reinvestment and rehabilitation measures) for selected countries and years relative to the length of the respective networks. Expenditure accounts can help to compare cost structures among countries, provide the basic data for deriving economic costs and transfer economic accounts between countries. By consulting national statistics, the following figures were collected for new construction, for investment and routine maintenance and for the operation and management of the highway networks in Austria, Switzerland and Germany. The data have been normalised to road kilometres expressed in Euros re-indexed to the year 2005 to allow comparison among countries.
Table 2 National expenditures for new road construction, maintenance and operation in selected countries
Country Network Capacity enlargement
Investive maintenance
Routine maintenance
Operation, management
& finance
Total
Euro (2005 prices) per km of total network length Austria 1) ASFINAG network 331,134 197,917 108,406 637,456Switzerland 2) National roads 783,502 288,239 78,867 99,053 1,249,661 Canton roads 32,035 9,634 20,902 17,124 79,695 Municipal roads 7,403 2,325 14,831 4,589 29,148Germany 3) Federal motorways 197,528 83,826 39,383 320,737 Federal trunk roads 23,410 21,173 11,576 56,1591 ASFINAG (2007), annual expenses of ASFINAG for motorways and express roads 2006. 2 BFS (2007), preliminary values for 2005. 3 BMVBS (2006), expenses of the federal Government 2005, general road network expenses are
allocated 50% / 50% to motorways and federal roads, respectively. The data shows big differences across road classes and across countries. Motorway maintenance and operation costs range between 178,000 €/km in Switzerland and 40,000 €/km in Germany. But, according to BMVBS (2006), the German figures only contain direct federal government expenses and ignore the costs to federal states and the costs of enforcement (traffic police) and operation of the road network. These costs are contained in the Swiss road accounts (BFS, 2007) and in the ASFINAG balance sheets (ASFINAG, 2006). It is not possible to compare new capacity provision costs between countries or maintenance costs as all the figures relate to the length of the existing network and are thus driven by unit construction costs and the volume of new construction or extension projects. Furthermore, extension projects also contain elements of renewal in the case of added traffic lanes.

4.288.1/Road infrastructure cost and revenue in Europe – IMPACT D2 April 2008 14
Economic accounts can either be based on the capitalisation of historical expenditure data (Perpetual Inventory Method - PIM) or on the assessment of the future financing needs of the present network (Synthetic method). These two options are described and compared below.
2.2.2 The Perpetual Inventory Method
The Perpetual Inventory Method (PIM) builds on long time series of infrastructure expenditure data which are classified into types of activity: Investment and operation. As a rule, both are further distinguished in sub-categories specifying the type of asset and the nature of management and operation activities (see section 2.2.5). The distinction into expenditure categories is required because individual cost blocks react differently with varying investment and maintenance levels, changing traffic volumes and over time. For each category of investment expenditure, the PIM calculates the annual depreciation costs by distributing the initial investments over the asset’s lifetime. Costs are not necessarily distributed evenly across years. The most recent infrastructure cost studies use probability functions to describe the statistical distribution of the maximum life expectancy of construction elements of transport infrastructure. These may be defined on the basis of statistical analyses (UNITE, 2002), experiences of road administrations (Herry, 2002), or engineering considerations (ProgTrans/IWW, 2007).
Figure 1 General scheme of end-of-life probabilities and annual depreciation levels for longlife infrastructures
t 1 t M
%
t100%
100%D
A
D = Linear Depreciation A = Written-down ("lost") Assets I = Investments
Source: DIW.
Source: UNITE (2000).

4.288.1/Road infrastructure cost and revenue in Europe – IMPACT D2 April 2008
15
The sum of the investment costs which are not fully written off at the period of accounting equals the gross asset value of the network in question. Commonly, the historical investment costs are adapted to the current price level using construction price indices. Subtracting the annual depreciation in current prices from the gross asset value yields the net asset value. The ratio between the gross and the net asset value can be regarded as a measure of the average age or modernity of the network. Interest costs express a variety of real and imputed cost blocks borne by the infrastructure owner or concessionaire. They are computed by multiplying the net asset value by an appropriate interest rate. Interest rates depend on the legal status of the infrastructure owner, the valuation of assets and the selected depreciation model. The latter two drivers in particular determine whether to apply real (excluding inflation) or nominal (including inflation) interest rates. Capital costs equal the sum of depreciation and interest costs. In contrast all those expenditure elements with a lifetime below one or two years (operation, management, energy supply, minor repairs) are not capitalised. These running costs are taken directly into account when computing total infrastructure costs. Total annual costs thus equal the sum of annual capital costs plus annual running costs (or expenses). The historical expenditure series may either be taken as they are (in current prices) or may be transformed into reinvestment values by applying appropriate price indices. Besides expenditure time series, the most important parameters driving total costs in the PIM model are thus (see details in section 2.2.5): − The assessment of investment value (historical expenses vs. replacement
values). − Functions of life expectancy. − Interest rates (real or nominal, cost elements included). Finally, the average costs by vehicle category are strongly dependent on the cost allocation procedure applied. Different types of assets are affected differently by certain vehicle characteristics, but the uncertainties associated with quantifying these impacts are huge. Available cost allocation models are presented in section 2.2.7. Current PIM applications abstract from physically existing networks, which means that investment expenditures which are fully written down according to the time series may still exist and cause future reinvestment activities. Thus, the pure price adjustment is not equivalent to a full prediction of future financing needs of the existing infrastructure network. The results of PIM models reflect the depreciation of historical expenses rather than physical assets.

4.288.1/Road infrastructure cost and revenue in Europe – IMPACT D2 April 2008 16
The advantage of the PIM approach is that it is compatible with the common accounting philosophies of public budgets. In compliance with the doctrine of the system of national accounts it expresses the economic costs which past investment decisions and the existence of the infrastructure networks cause in the accounting period. It is thus more a statistical convention than a basis for predicting future maintenance costs and reinvestment needs.
2.2.3 The Synthetic Method
The UNITE accounts revealed that the data requirements of the PIM approach can only be met by a limited number of countries. In particular, the Southern and Eastern EU Member States do not possess long time series of road expenditures with a sufficient level of detail. Enquiries made for this study at the national statistical offices of the 29 countries in February 2008 confirmed this finding. An alternative approach is provided by the Synthetic Method of calculating infrastructure costs, which starts from a complete inventory of assets in the accounting period. It thus reacts to two weaknesses of the Perpetual Inventory Method (PIM) as it explicitly refers to physically existing assets and abstracts from historical records of road expenditures. For each type of asset, a replacement cost value is estimated, reflecting its dimensioning, load, location and the latest technical standards and specifications. The historical investment expenditures do not matter. However, the Synthetic Method does require minimum information concerning the age of each asset and - if available - its physical condition. The data contained in such an inventory may well exceed the data requirements of the PIM approach, but it can be easily generated by each country through observation or should be readily available in infrastructure managers’ asset management systems. Considering the age and - depending on the type of depreciation model used - past and projected traffic loads and the physical condition of the asset, depreciation and interest costs are calculated similar to the PIM approach. Contemporary studies applying the Synthetic Method (ProgTrans/IW, 2007; Herry et al., 2002) use statistical life expectancies. The relation to physical objects makes it possible to apply much more detailed and advanced depreciation models. Table 5 presents average depreciation periods and section 2.2.6 discusses some selected models applied in the literature. Running expenses are usually taken from national accounts and thus do not differ from the PIM approach. The same holds for cost allocation procedures, which appear to be the same for both accounting methods. The structure of the Synthetic Method is shown in Figure 2.

4.288.1/Road infrastructure cost and revenue in Europe – IMPACT D2 April 2008
17
Figure 2 Structure of the Synthetic Method for infrastructure accounting
Highway cost calculation scheme
Inventory of assets by network part and category of construction elements 2000
Estimation of standard reinvestment costs by network part and construction
element 2000
Gross assetvalue 2000
Asset assessment and estimation of current values by network part and
construction element 2000
Net asset value 2000
Forecast of asset inventory and values by network part and
construction element 2000 - 2010
Depreciation and interests 2003, 2005
and 2010
Estimation and forecast ofrunning costs 2003, 2005 and
2010 by network part.
Total costs 2003, 2005 and 2010
Cost allocation to vehicles 2003, 20005 and 2010 by roads, construc-
tion elements andcost categories
Charges 2003, 2005 and 2010 for HGVs above 12t GVW by
road category, axle configuration and emission
standard
2.2.4 Comparing the PIM approach to the Synthetic Method
The Synthetic Method is much more of a decision support tool than the PIM approach as it indicates the sum of money to be raised in order to maintain the quality of the network at a certain level. Outputs of cost accounting are thus influenced by the discretionary choice of quality. Prognos/IWW (2002) and Herry et al. (2002) have thus shortened depreciation periods in order to reflect observed investment backlogs. The targeted quality standard can be adjusted by changing the length of depreciation periods in the accounting system; long periods indicate that reinvestment measures will be postponed and accordingly worsening infrastructure conditions will have to be accepted with ageing assets. The Synthetic Method can in principle be applied within traffic models and thus can react dynamically to different future scenarios of traffic demand development. Both models comply with the provisions in the Eurovignette Directive and its amendment of 2006. But only the PIM approach complies with the System of National Accounts (SNA) and common public accounting considerations. With regard to data requirement both methods are demanding. While the Synthetic Method requires excessive information on physical assets and their current condition, the collection of expenditure data assigned to the transport networks to be assessed and their allocation to cost categories for the PIM

4.288.1/Road infrastructure cost and revenue in Europe – IMPACT D2 April 2008 18
approach may demand excessive and resource-consuming surveys of public budget records. For a number of countries the latter information is not available at all. In these cases, the application of the PIM method will not lead to reliable results. Data gaps in the Synthetic Method can be bridged more easily by using standard values than is the case for the PIM approach, which makes the Synthetic Method applicable to more cases and gives it more flexibility towards different budgets for infrastructure cost estimation surveys. In the end, the decision whether to apply the PIM approach or the Synthetic Method depends on the objective of the cost accounting scheme. If the objective is to account for the present value of historical activities, e.g. the expenses of tax payers, then the PIM approach should be applied. This objective is more for documentation purposes, e.g. for an intermodal comparison of public expenses, than decision support. In a private sector dominated environment, the revenues from an infrastructure pricing scheme should suffice to maintain the infrastructure at a particular quality standard. In this case, past (sunk) expenses are irrelevant. Further, the long and broadly distributed lifetimes of transport infrastructure assets call for the application of open (flexible) depreciation procedures. It can thus be concluded that a private operator will apply the Synthetic Method rather than the PIM approach. Table 3 compares some features of the accounting approaches.
Table 3 Features of the PIM and the Synthetic Method
Criterion Perpetual Inventory Method Synthetic Method Data requirements
Long investment expenditure time series by category of assets
Detailed inventory of assets with information on dimensioning, age, physical condition, location and traffic load
Regional differentiation
Generally difficult, depending on how expenses are recorded in public budgets
Inherent, depending on structure of asset inventory
Accounting objectives
1 Record of capital bound by historical investment decisions (according to System of National Accounts)
2 Replacement costs: possible but difficult as no relation to actual existing assets
1 Replacement costs: natural application due to direct relation to the physical network
2 Account of capital bound: possible but not conform with SNA
Maintenance strategies
Rather artificial as no link between varying replacement intervals and reinvestment needs is provided by the PIM structure
Easily possible due to the local and asset-related structure of the method
Open depreciation schemes
Not applicable, requires tracking of asset quality standards over time
Applicable due to availability of physical asset inventory
Level of costs
Reflects the actual expenditure practice of infrastructure managers/owners, no relation to investment needs
Reflects the theoretically required investment level; desired network standard to be adjusted by life expectancy function per type of asset
4.288.1/Road infrastructure cost and revenue in Europe – IMPACT D2 April 2008
19
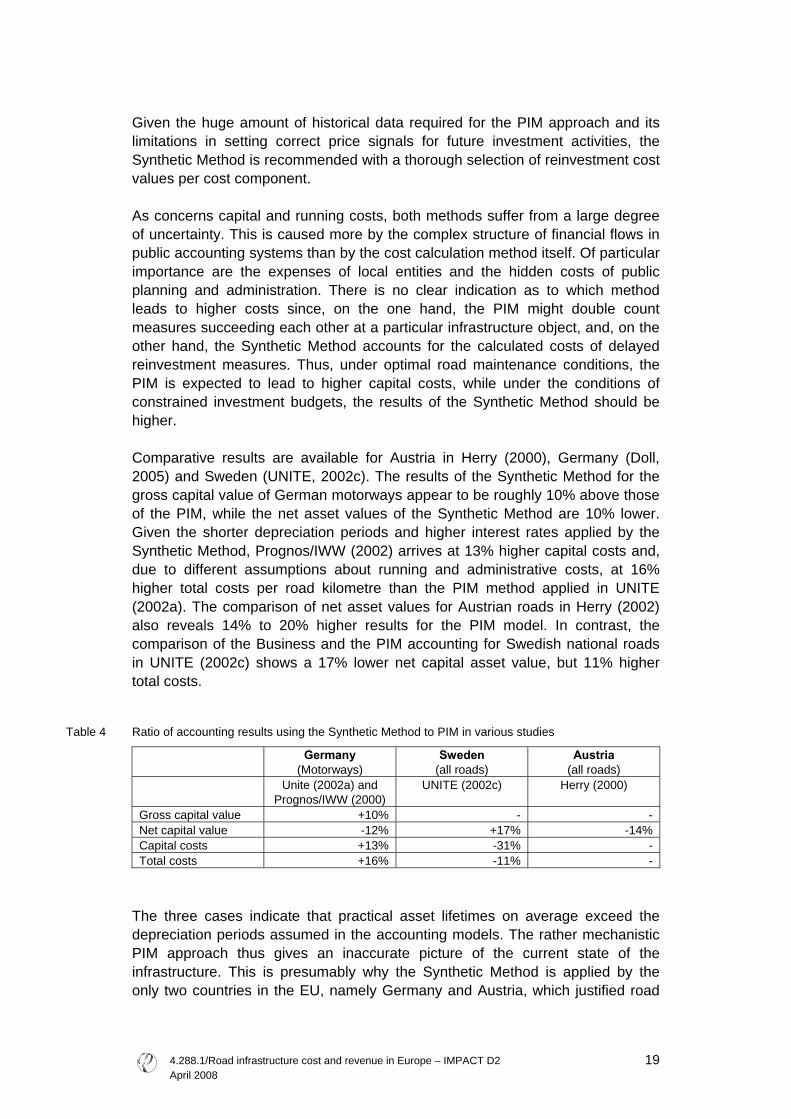
Given the huge amount of historical data required for the PIM approach and its limitations in setting correct price signals for future investment activities, the Synthetic Method is recommended with a thorough selection of reinvestment cost values per cost component. As concerns capital and running costs, both methods suffer from a large degree of uncertainty. This is caused more by the complex structure of financial flows in public accounting systems than by the cost calculation method itself. Of particular importance are the expenses of local entities and the hidden costs of public planning and administration. There is no clear indication as to which method leads to higher costs since, on the one hand, the PIM might double count measures succeeding each other at a particular infrastructure object, and, on the other hand, the Synthetic Method accounts for the calculated costs of delayed reinvestment measures. Thus, under optimal road maintenance conditions, the PIM is expected to lead to higher capital costs, while under the conditions of constrained investment budgets, the results of the Synthetic Method should be higher. Comparative results are available for Austria in Herry (2000), Germany (Doll, 2005) and Sweden (UNITE, 2002c). The results of the Synthetic Method for the gross capital value of German motorways appear to be roughly 10% above those of the PIM, while the net asset values of the Synthetic Method are 10% lower. Given the shorter depreciation periods and higher interest rates applied by the Synthetic Method, Prognos/IWW (2002) arrives at 13% higher capital costs and, due to different assumptions about running and administrative costs, at 16% higher total costs per road kilometre than the PIM method applied in UNITE (2002a). The comparison of net asset values for Austrian roads in Herry (2002) also reveals 14% to 20% higher results for the PIM model. In contrast, the comparison of the Business and the PIM accounting for Swedish national roads in UNITE (2002c) shows a 17% lower net capital asset value, but 11% higher total costs.
Table 4 Ratio of accounting results using the Synthetic Method to PIM in various studies
Germany (Motorways)
Sweden (all roads)
Austria (all roads)
Unite (2002a) and Prognos/IWW (2000)
UNITE (2002c) Herry (2000)
Gross capital value +10% - - Net capital value -12% +17% -14% Capital costs +13% -31% - Total costs +16% -11% -
The three cases indicate that practical asset lifetimes on average exceed the depreciation periods assumed in the accounting models. The rather mechanistic PIM approach thus gives an inaccurate picture of the current state of the infrastructure. This is presumably why the Synthetic Method is applied by the only two countries in the EU, namely Germany and Austria, which justified road

4.288.1/Road infrastructure cost and revenue in Europe – IMPACT D2 April 2008 20
user charges by economic cost accounts. The huge number of country studies computed with the PIM approach dates back to computations of the German Institute for Economic Research (DIW) in the UNITE project. Real national approaches are only available for Germany and Switzerland. Recalling the chain of arguments above, the PIM method is more closely related to the philosophy of public accounting, but may face difficult data situations and lacks the flexibility to depict the current state of infrastructure networks. We thus recommend the Synthetic Method as the first best approach for setting road user charges. However, care must be taken to accurately define replacement values and net asset values based on asset quality indicators.
2.2.5 Cost categories
Depending on data availability, studies distinguish between different cost categories. A systematic comparison of studies concerning the impact of specific categories on total costs is difficult because the results are usually presented in aggregated form. However, there are some exceptions which include a detailed presentation of total costs by category. These are the German accounts (Prognos/IWW, 2002 and ProgTrans/IWW, 2007), the Austrian Infrastructure cost study (Herry et al., 2002) for ASFINAG and the US Highway Cost Allocation Study 1997 (FHWA, 1997). A common structure of cost categories is: Investment expenditures: 1 Planning and surveying. 2 Land purchase/right of way. 3 Earthworks (ground preparation, drains, etc.). 4 Substructures (base and frost protection course). 5 Superstructures (binder and surface courses). 6 Engineering works (bridges, tunnels, etc.). 7 Equipment (traffic signs, etc.). 8 Park and rest facilities. Running costs 1 Repair measures. 2 Operation (winter maintenance, green cutting, etc.). 3 Traffic police. 4 Administration. 5 Toll collection. The scope of cost categories differs slightly between the studies: While Prognos/IWW, 2002 explicitly excludes park and rest facilities, other studies (including the succeeding study by ProgTrans/IWW, 2007) take this (minor) cost category into consideration. Alternatively, cost categories could be grouped by function, e.g. into capacity enlargement, maintenance investments, routine maintenance, operation and management (see section 2.5.1).

4.288.1/Road infrastructure cost and revenue in Europe – IMPACT D2 April 2008
21
Table 5 Average depreciation periods by construction element reported by selected studies (in years)
Asset category Germany Austria
FGSV (1997) Prognos/IWW (2002)
UNITE (2000) Herry et al. (2002)
Substructures of free lanes 90 116 65 - Land purchase/right of way - Earthworks 100 - Draining 75 Superstructures of free lanes 35 - Main course 50 50 23 - Surface course 15 - Asphalt surface - Binder course 25 25 4 - Asphalt surface layer 12.5 12.5 4 - Concrete surface layer 25 25 4 Equipment of free lanes 18 18 - Equipment 10 14 - 23 5 - Noise protection 25 18 Engineering works of free lanes and intersections 68
- Bridges 50 65 73 - Tunnels 50 90 95 - Other engineering works 50 50 73 Nodal points (intersections) - Earthworks 90 - Road surfacing ca. 20 3 - Equipment 50 Operating facilities 18 18 - Real estate 10 68 - Machinery 25 11 1 Reinvestment as concrete surface. 2 Not relevant as next reinvestment wave starts from 2050 on. 3 Average composition of surface types according to free lane. 4 Valid for average traffic loads 1997; respective shortening with increasing volumes. 5 Including equipment for bridges (23 years) and tunnels (16 years). Among the running costs, two items are of specific interest: the costs of planning, public administration and toll collection. Administrative costs are particularly difficult to estimate as they are commonly hidden in various titles of state accounts and cannot be easily attributed to particular modes, road categories or activities. While high estimates of public administration costs range above 50% of gross capital costs (Wirtschaftsrat, 2007), more conservative estimates by ProgTrans/IWW, 2007 assume a value of 15% of total infrastructure costs based on the experiences of German federal states and of the DEGES (German Unity Motorway Planning and Construction Company). The costs of the toll collection system depend on the technology applied. While the Austrian, French, Italian, Spanish and Portuguese systems ‘cost’ roughly 5% of infrastructure costs, the satellite based German system eats up 20% of toll income.

4.288.1/Road infrastructure cost and revenue in Europe – IMPACT D2 April 2008 22
2.2.6 Interest rates and depreciation models
Investment related cost components have a particular life expectancy, which may vary between 10 to 15 years for equipment, 90 to 100 years for earthworks or tunnels up to infinity for land purchases. Within this depreciation period the assets lose a certain share of their original (gross) investment value, which may be linear or depend on traffic loads. Contemporary cost models assume that depreciation periods are not constant, but are distributed according to statistical probability functions (UNITE, 2003; Prognos/IWW, 2002; Herry et al., 2002; ProgTrans/IWW, 2007). Prognos/IWW, 2002 suggest that ‘open’ depreciation models should be applied due to the long and uncertain life expectancies of transport infrastructure assets. These would determine the actual depreciation by comparing the asset's condition at the beginning and at the end of the accounting period. This would make statistical distributions of lifetimes obsolete, but would require regular account and quality measurements to be made separately for single assets. The statistically remaining value of the asset in the year of accounting reflects the capital commitment which needs to be financed on the capital market. The assessment of assets (historical or reinvestment costs) and the depreciation model applied determine whether interest rates are expressed in real terms (with inflation correction) or nominal terms. If price effects are already considered in the assessment and depreciation then the interest costs must be computed with real rates (compare Table 6).
Table 6 Depreciation models and interest rates
Depreciation model Interest rates Application cases Regular depreciation of historical costs
Nominal BFS, 2003
Regular depreciation of replacement costs
Real UNITE, 2002; Herry, 2000
Open depreciation of replacement costs
Nominal Prognos/IWW, 2002; ProgTrans/IWW, 2007
Across all the cost assets in an infrastructure network, the capital costs are thus determined not so much by questions of asset valuation and depreciation models, but more by the level of the real interest rate. Real interest rates are determined by the enterprise fiction behind the accounting framework. If the infrastructure is operated by a public authority, real interest rates between 2% and 3% have been applied by past studies, referring to the long-term public loans in Western Europe. However, social interest rates might well be higher in high interest periods or outside the EU. Real interest rates are also higher if private capital is involved as the interest costs contain elements of risk beyond public sector guarantees and profit margins.

4.288.1/Road infrastructure cost and revenue in Europe – IMPACT D2 April 2008
23
2.2.7 Cost allocation procedures
In order to calculate weighted average cost charges or revenue cost ratios from full cost accounts, total costs need to be attributed to single vehicle classes or user groups. Transport infrastructure consists of a high share of fixed costs, which do not or only partly vary with traffic demand. It renders this allocation process difficult and somewhat arbitrary. To find fair and objective solutions, three different types of cost allocation have been developed and applied in recent cost allocation studies: 1 The equivalency factor method defines certain proportionality factors for
each vehicle class and cost category which express the responsibility or the causation of the vehicles for the level of total costs. Very significant equivalency factors for instance are Equivalent Standard Axle Loads (ESAL), which derive from the results of the AASHTO road test in the US and increase with the 4th power of axle loadings. These are applied to damage sensitive surface layers. Capacity related costs are distributed by Passenger Car Equivalents and fixed cost blocks are assumed to be linear to pure vehicle movements. Major problems arise from the inter-dependency of asset dimensions, from weak empirical data and from high levels of data aggregation. Accordingly, the results of different equivalency factor applications may diverge widely. The method is the most frequently applied approach to allocate total costs in road infrastructure accounts; it is applied in UNITE, 2002; BFS, 2007 or ProgTrans/IWW, 2007. The equivalency factor method is compatible with common planning tools which determine the width and thickness of roads and the design of curves, gradients and junctions depending on projected traffic loads, their composition and the general function of the road.
2 The econometric approach is solely applied by the Austrian infrastructure cost study (Herry et al., 2002). It relates cost data to traffic flow information across links and over time. The regression coefficients then provide cost shares for the different vehicle types. The method, in principle, is more objective than the equivalency factor method, but in practice, the significance of results is low due to high co-linearities of flow data among different vehicle classes. The results range around the upper limit of applied equivalency factor methods.
3 Doll, 2005 proposed a game theory application to link the engineering knowledge of equivalency factor methods with a scientifically sound and objective allocation scheme. The approach uses the design and construction principles of roads to construct a ‘characteristic cost function’, which is then applied to a continuum of players (road users). The result of the co-operative game is that all users negotiate a fair share of total costs for themselves. The procedure was not applied to complete road networks, but example calculations support a rather cautious approach by allocating lower costs to heavy traffic as applied by ProgTrans/IWW, 2007. Some elements of the approach were also applied in the US Federal Highway Cost Allocation Study 1997 (FHWA, 1997).

4.288.1/Road infrastructure cost and revenue in Europe – IMPACT D2 April 2008 24
Although cost allocation procedures do not affect total costs, they have a huge impact on the unit costs for single vehicle categories, e. g. road user tariffs. In this study, not the methodologies, but the results of the above cost allocation procedures are used to assign total costs to types of vehicles. By treating the different elements of total costs separately according to their specific characteristics in cost development, the basic concept of the game theory approach is linked to techniques of standard equivalency factor allocation. Eventually, the objective of this study is to apply a commonly acceptable and simple method of cost accounting and cost allocation rather than to promote completely new methods.
2.3 Studies and results
Economic accounts of transport infrastructure have been done by a number of countries and by the EC funded research project UNITE (2000 to 2003). National studies are available for: 1 Germany (ProgTrans/IWW, 2007; Prognos/IWW, 2002 on behalf of BMVBS). 2 Switzerland (Bundesamt fuer Statistik, 2007). 3 Austria (Herry et al., 2002 on behalf of ASFINAG). 4 The Netherlands (CE, 2004). 5 The United Kingdom (ITS et al., 2001). UNITE has carried out national accounts with varying scopes and levels of detail for Germany, Switzerland, Austria, Denmark, Spain, France, the Netherlands, the UK, Belgium, Finland, Greece, Hungary, Italy, Luxemburg, Portugal and Sweden. The results of selected studies are presented in Table 7. These were made comparable by relating total costs in 2005 Euro to network lengths. The resulting unit cost values diverge greatly between studies; the only general trend is that motorways appear to be far more costly than other roads. The data does not show any relation between the geographical structure of a country and the infrastructure costs, but does seem to suggest that road construction in arctic regions with harsh winters is more demanding than in mountainous topographies. The different levels of aggregation for the various road classes in the studies, however, makes a clear analysis difficult. UNITE and BFS, 2003 use the PIM approach for total cost allocation, while Herry, 2002 and ProgTrans, 2007 apply the Synthetic Method. A comparison of the results in TC, 2005 and Doll, 2005 shows that the Synthetic Method leads to 16% higher capital costs when applied to roughly the same networks in Germany but with slightly different assumptions on interest rates and depreciation periods, while Herry (2000) found that the Synthetic Method generated lower capital costs under the same conditions. Most studies (UNITE, 2002; ProgTrans, 2007; BFS, 2003) apply the equivalency factor method for cost allocation while only Herry, 2002 develops and uses the econometric approach. The latter is, however, also used in GRACE, 2006 for estimating marginal costs per vehicle class.
4.288.1/Road infrastructure cost and revenue in Europe – IMPACT D2 April 2008
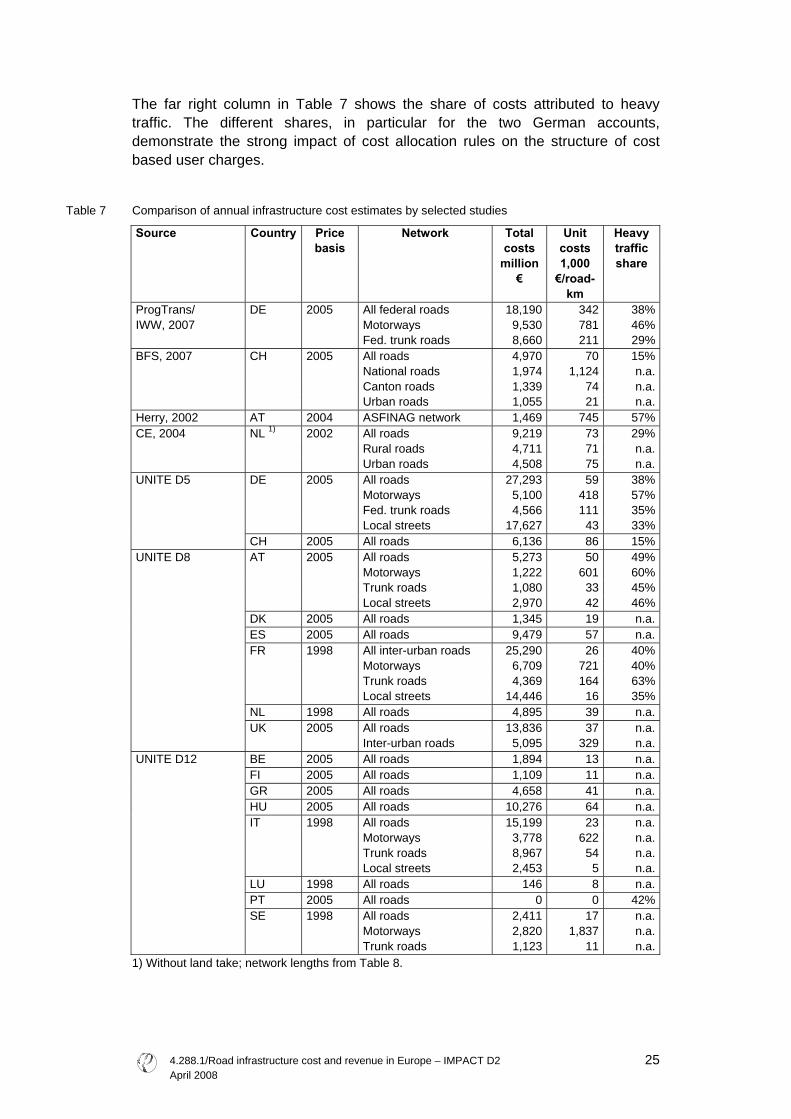
25
The far right column in Table 7 shows the share of costs attributed to heavy traffic. The different shares, in particular for the two German accounts, demonstrate the strong impact of cost allocation rules on the structure of cost based user charges.
Table 7 Comparison of annual infrastructure cost estimates by selected studies
Source Country Price basis
Network Total costs
Unit costs
Heavy traffic
million €
1,000 €/road-
km
share
DE 2005 All federal roads 18,190 342 38% Motorways 9,530 781 46%
ProgTrans/ IWW, 2007
Fed. trunk roads 8,660 211 29%CH 2005 All roads 4,970 70 15% National roads 1,974 1,124 n.a. Canton roads 1,339 74 n.a.
BFS, 2007 Urban roads 1,055 21 n.a.Herry, 2002 AT 2004 ASFINAG network 1,469 745 57%CE, 2004 NL 1) 2002 All roads 9,219 73 29% Rural roads 4,711 71 n.a. Urban roads 4,508 75 n.a.
DE 2005 All roads 27,293 59 38% Motorways 5,100 418 57% Fed. trunk roads 4,566 111 35% Local streets 17,627 43 33%
UNITE D5
CH 2005 All roads 6,136 86 15%AT 2005 All roads 5,273 50 49% Motorways 1,222 601 60% Trunk roads 1,080 33 45% Local streets 2,970 42 46%DK 2005 All roads 1,345 19 n.a.ES 2005 All roads 9,479 57 n.a.FR 1998 All inter-urban roads 25,290 26 40% Motorways 6,709 721 40% Trunk roads 4,369 164 63% Local streets 14,446 16 35%NL 1998 All roads 4,895 39 n.a.UK 2005 All roads 13,836 37 n.a.
UNITE D8
Inter-urban roads 5,095 329 n.a.BE 2005 All roads 1,894 13 n.a.FI 2005 All roads 1,109 11 n.a.GR 2005 All roads 4,658 41 n.a.HU 2005 All roads 10,276 64 n.a.IT 1998 All roads 15,199 23 n.a. Motorways 3,778 622 n.a. Trunk roads 8,967 54 n.a. Local streets 2,453 5 n.a.LU 1998 All roads 146 8 n.a.PT 2005 All roads 0 0 42%SE 1998 All roads 2,411 17 n.a. Motorways 2,820 1,837 n.a.
UNITE D12
Trunk roads 1,123 11 n.a.1) Without land take; network lengths from Table 8.

4.288.1/Road infrastructure cost and revenue in Europe – IMPACT D2 April 2008 26
2.4 Accounting framework for European cost estimates
2.4.1 Road network classification
The road networks of the 29 countries are classified into three basic types of infrastructure: 1 Motorways. 2 Other trunk roads. 3 Local and urban roads. All three types have been further differentiated into tolled and non-tolled networks. Road network lengths for the latest available year per country (2002 to 2005) are taken from EU, 2006. Adjustments to 2005 were made by extrapolation using national growth rates for motorways, while trunk roads and urban roads were assumed to remain constant. Average motorway growth rates reported in EU (2006) are slightly below 2% p.a. for EU-15 countries and roughly 4% for the 12 new Member States. 2004 data was available for most countries. The common denominator is required to compare infrastructure costs to revenues (Chapter 4). Besides total road lengths, the length of toll roads was determined using statistical data from the ASECAP, 2007. The case of urban toll roads only applies in Norway (Oslo, Trondheim and Bergen), the UK (London) and Switzerland (HGV toll on all roads including local streets). The Stockholm congestion charge was not considered as it officially started only in 2007. For the UK, data from TFL, 2006 was used to compute the length of the toll network in London. For Norway, a share of 9% of tolled urban roads was assumed. The data used is presented in Table 8.

4.288.1/Road infrastructure cost and revenue in Europe – IMPACT D2 April 2008
27
Table 8 Length of road network per country (in km)
Country Motorways Other trunk roads Local/urban roads Total Tolled Total Tolled Total Tolled
Austria AT 2,035 2,035 33,008 71,059 Belgium BE 1,747 1 13,880 134,940 Bulgaria BG 331 6,981 11,976 Switzerland CH 1,341 1,341 18,492 18,492 51,446 51,446 Cyprus CY 268 5,021 3,577 Czech Rep. CZ 546 546 54,946 426 72,300 Germany DE 12,174 12,174 219,267 413,000 Denmark DK 1,027 38 10,331 60,894 Estonia EE 96 16,442 36,441 Spain ES 10,747 2,842 85,782 68,623 Finland FI 653 78,197 25,000 France FR 10,383 8,295 386,269 604,308 Greece GR 742 742 37,414 175 75,600 Hungary HU 575 575 84,285 75,930 Ireland IE 192 83 16,862 78,773 Italy IT 6,532 5,638 165,340 496,894 Lithuania LT 417 78,914 50,602 Luxemburg LU 147 2,747 14,470 Latvia LV 52,096 7,338 Malta MT 1,439 647 Netherlands NL 2,342 18 64,150 59,400 Norway NO 194 25 27,058 763 65,259 Poland PL 814 197 175,297 201,992 Portugal PT 2,100 1,401 15,064 62,528 Romania RO 0 44,994 27,817 Sweden SE 1,650 4 98,256 40,000 Slovenia SI 483 453 19,628 40,222 Slovakia SK 316 7,064 10,396 Un. Kingdom UK 3,638 42 47,928 364,689
TOTAL EUR-29 60,864 61,490 36,450 1,867,152 19,856 3,226,121 Source: EC, 2006; UNITE, 2002; ProgTrans/IWW, 2007; BFS, 2003; Herry, 2002.
2.4.2 Vehicle types
Taxes and charges distinguish between vehicle size and in some cases environmental aspects and road infrastructure costs vary considerably by vehicle weight. Nine different vehicles were distinguished, including three types of passenger cars and three types of goods vehicles. The parameters and values for each vehicle class are presented in Table 9. The selection of vehicle characteristics is exemplary rather than providing a statistical average across the entire vehicle fleet in the respective segment; the aim is to illustrate the relation between specific taxes, charges and infrastructure costs.

4.288.1/Road infrastructure cost and revenue in Europe – IMPACT D2 April 2008 28
Table 9 Vehicle types for infrastructure cost and charge estimation
Parameter
Unit
Small car
Bigcar
Motorcycle
Bus/ Coach
LDV/ Van
HGV5.5t
HGV 12t
HGV 24t
HGV40t
Technical description Fuel type Petrol Petrol Petrol Diesel Diesel Diesel Diesel Diesel DieselFuel consumption l/100km 8 12 5,5 20 12 20 24 28 33Emission standard Euro E4 E2 E3 E2 E2 E2 E2 E3 E3CO2 emission g/km 186 280 128 528 317 528 634 739 871Weight t 1 1.7 0.3 18 2 5.5 12 24 40Axles 2 2 2 2 2 2 3 5 5Max. axle load t 0.5 0.5 0.15 11.5 1.2 3 7 11.5 11.5Length m 3 4 1.5 12 5 6 8 13 18CC l 1.6 1.6 1.6 1.2 2.1 2.0 5.0 9.0 12.0Engine power HP 55 100 100 300 1,156,463 150 200 300 400Engine power KW 40 74 74 221 85 110 147 221 294Fiscal HP 5.5 10.0 10.0 30.0 11.56 15.0 20.0 30.0 40.0Age a 4 6 4 6 8 7 6 5 4Sales price T€ 12 25 18 35 20 20 30 40 50Insurance premium €/a PCE 1 1 0,5 2 1,5 2 2,5 3 3,5ESAL 0.13 2.14 0.001 19275 2.48 120 2479 17872 27799Driving parameters Performance Tkm/a 12 16 5 20 20 30 50 80 120Period of use a 15 15 10 15 15 15 15 10 8
PCE = passenger car equivalents. ESAL = equivalent standard axle loadings.
2.4.3 Vehicle kilometres
To properly estimate average and marginal infrastructure costs and revenues, a complete database of vehicle kilometres was established using the following parameters: 1 29 countries. 2 9 vehicle types. 3 + 3 (non-tolled and tolled) network categories.

4.288.1/Road infrastructure cost and revenue in Europe – IMPACT D2 April 2008
29
The database for the year 2005 was established using the following sources: − Vehicle kilometres and occupancy rates for all networks from Infras/IWW,
2004: Besides passenger cars, for which data on urban and non-urban roads was given, the database delivered vehicle kilometres for the entire networks for the year 2000 only.
− Development of transport demand from 2000 to 2005 for all 29 countries and broad vehicle classes from Mantzos and Capros, 2006. The data allowed to factor up the Infras/IWW vehicle kilometres to 2005 and to estimate vehicle kilometres for all other countries based on average occupancy rates.
− The distribution of vehicle kilometres to road classes was done on the basis of average assumptions about vehicle densities on each road type, based on German statistics and data provided by the UNITE accounts (UNITE, 2003).
− Traffic data on toll motorways and trunk roads was provided by ASECAP, 2006. A specific traffic density was assumed for other tolled and non-tolled roads.
Detailed tables of the cost and revenue database are given in the annex to this report.
2.4.4 Socio-economic data
Data on price indices to factor up infrastructure unit costs to the year 2005 and purchasing power parities (PPP) to transfer costs across countries were taken from Eurostat, 2008. Prognos/IWW (2002) recommends using construction price indices to adjust infrastructure costs across years. But as Eurostat does not provide specific construction price indicators common consumption indicators on price inflation have been applied. In contrast, PPP values in Euro 2005 are available for construction services. Eurostat (2007) provides price levels for construction works differentiated by private housing, public building and other civil engineering for 33 European countries in 2005. These values correlate rather well with the structure of the Purchasing Power Parities provided by Eurostat (2008) for construction services (Figure 3).

4.288.1/Road infrastructure cost and revenue in Europe – IMPACT D2 April 2008 30
Figure 3 Eurostat values on price levels and PPPs in the construction sector 2005
Price Level Indicator for Construction Works 2005
0
20
40
60
80
100
120
140
160
180
200
SE UK CH NO DK AT ES NL LU FI BE FR IE HU MT DE LV GR LT EE CY PT CZ IT PL SI SK RO BG
Inde
x: E
U27
= 1
00
Civil engineering works PPP (Euro) for construction services
Data source: Eurostat (2007), Table 2, Eurostat (2008): Purchasing Power Parities in Euro for Construction Services
2.5 Procedure for cost extrapolation
The estimation of infrastructure costs for all network categories and countries is carried out on the macro level. Data on infrastructure costs and cost drivers from existing studies is compiled in a database. Any gaps are then closed by considering similarities between countries and by regression analysis. In its practical application this approach holds a number of caveats and pitfalls: 1 Existing studies are rare and usually outdated. 2 They use different methodologies and scope. 3 They apply different systems of presenting results. The worst problem was that many countries had no or only incomplete road infrastructure cost estimates. The following multi-stage approach was applied to make the best use of the existing information to arrive at a half-way realistic picture of total and average infrastructure costs across Europe. 1 Selection of data structures and methods for total costs. 2 Application of existing studies to the data structure. 3 Normalisation of basic data. 4 Regression of total infrastructure costs for all countries and road types 2005. 5 Structure of total costs according to cost categories for all countries. 6 Analysis, selection and application of cost allocation approaches. In this way, figures on total and average costs by vehicle type and road class are obtained. These cost items are then compared to the fixed and variable taxes and charges in order to derive ratios of infrastructure cost coverage. An alternative approach would be to conduct infrastructure cost calculations for current investment projects. Related information on project costs and construction parameters should be available for many countries in their national

4.288.1/Road infrastructure cost and revenue in Europe – IMPACT D2 April 2008
31
infrastructure investment programmes. However, the level of infrastructure costs across entire networks is, among other factors, determined by the quality and age structure of the assets. Further, the resources of this study do not allow for an intensive search for piecewise construction information across Europe.
2.5.1 Data structures and methods for total cost estimation
Total infrastructure costs can be estimated using a range of methods. 1 Accounting based on expenses. 2 Accounting and capitalising historical investment and current running costs
(PIM method). 3 Valuing the existing network using current reinvestment unit cost values plus
current running costs (Synthetic Method). ‘Expenses’ and ‘costs’ denote two different values of a particular asset: While expenses only express the money paid in a particular period, costs denote the annual depreciation of the investment plus the hypothetical interest which an investor would have to pay if the investment were financed by a loan. In the case of private investors, the interest contains profit margins and a risk premium. Expenses are thus much higher than costs in the year of investment, but costs extend over the entire depreciation period of the asset. Their development over time depends on the depreciation method and the development of interest rates. Costs can also be determined by depreciating the real historical expenses or by depreciating today’s hypothetical investment costs of a comparable asset of a contemporary technical standard. A counter argument to a full economic accounting system often refers to the uselessness of fixed investment costs (sunk costs) for pricing purposes if the policy objective is to maximise the efficient use of infrastructures, e. g. by marginal social cost pricing. The history of existing assets is also irrelevant for decisions on future investments. Another argument frequently made against pricing infrastructure capital costs is that the tax payer has already financed the existing infrastructure . However, in the long run, virtually all cost elements are variable. Due to long-term reinvestment cycles, capital costs are relevant for the strategic decisions of infrastructure managers and need to be financed either by user charges or by taxpayers' money. An illustrative example for the variability of ‘sunk costs’ in the current political discussion in Germany is the removal of underutilized railway tracks for cost efficiency purposes by DB-Netz AG. Corresponding examples for roads are the gradually emerging discussions about narrowing or even removing some of the fairly new road links in Eastern Germany as population density there continues to decline and economic growth lags far behind expectations, particularly in the border regions with Poland. Thus, within a sustainable transport policy, decision support systems also need to consider these ‘sunk’ elements when adapting the quality and capacity to long-term demand developments.

4.288.1/Road infrastructure cost and revenue in Europe – IMPACT D2 April 2008 32
The Governmental Commission on Transport Infrastructure Financing (Paellmann, 2000) in Germany has proposed replacing the tax funding of infrastructure with user payments. The revenues of such a system should provide the money needed by the infrastructure manager to maintain the infrastructure network at a desired quality standard. It is thus not the historical, but the expected future costs of a network which should be covered by user charges. But, as advocated by Paellmann (2000), the introduction of financially motivated pricing systems should be accompanied by a reduction in existing tax burdens in order to avoid double pricing. Simple accounts of expenses are not considered in this study because the contribution of public bodies and opportunity costs are neglected here. With regard to the PIM and the Synthetic Method, valuation of the existing infrastructure, e. g. the Synthetic Method, is preferable as this reflects the physically existing stock of assets and their true condition. Moreover, we see the Synthetic Method of infrastructure cost accounting as being much more in line with the philosophy of expected future costs than the Perpetual Inventory Method, which is based on historical expenses. Directive 2006/38/EC, however, tends to prefer the historical accounting approach due to its higher level of juristic liability (Directive 2006/38/EC, Annex II), but the directive does not preclude the ‘Synthetic Method’. This method is applied by the German government and by the Austrian ASFINAG and implicitly it forms the accounting basis for all private road concessionaires. Germany (UNITE, 2002; Prognos/IWW, 2002 and ProgTrans/IWW, 2007) and Austria (Herry, 2000) are the only cases where both approaches have been applied to the same network. Section 2.2.4 finds no impact of the methodology itself on the level of total capital costs based on the comparisons in Doll (2005) and Herry (2000) . But PIM applications tend to neglect investment backlogs, which need to be considered when estimating future network financing needs. Comparing Prognos/IWW (2002) and UNITE (2002) for Germany shows a respective downwards bias of 10%. This factor is applied to all historical accounting results, although we acknowledge that this might not be correct for countries with newly constructed or privately operated road networks. The difference in specific costs is thus caused by the inventory of assets and by the unit costs per type of asset. Cost data were split into eight cost categories: 1 Capital costs due to the provision of new capacity. 2 Fixed capital costs due to maintenance. 3 Capital costs of maintenance activities varying with projected traffic volumes. 4 Capital costs of maintenance activities varying with projected axle loads. 5 Running repair and maintenance expenses. 6 Running costs of police and signalling. 7 Running costs of administration. 8 Running costs for charge collection.
4.288.1/Road infrastructure cost and revenue in Europe – IMPACT D2 April 2008
33
2.5.2 Application of existing studies
Estimates of accounting costs were taken from the following sources where available: 1 Prognos/IWW, 2002 and 2007 delivered the synthetic accounts for German
motorways and federal trunk roads. 2 UNITE, 2003 has historical accounts for 16 countries, where some data were
available for the total network and some for different road classes. 3 Sansom et al., 2001 presents structural capital costs and maintenance data
for the UK. 4 CE, 2004 provided network wide data for the Netherlands based on historical
accounts. 5 Additional information about expenses and maintenance costs by road class
was provided for Hungary. 6 The ASECAP provided total revenues from road charging as a basis for toll
road cost estimates. 7 The project partner delivered current road expenditures for CEE countries
(Poland and Hungary) to improve the cost model for these countries. The original data were then normalised to the year 2005 by applying inflation rates for consumption and allocated to countries without available data using purchasing power parities for construction services. The accounting method was corrected by adding 10% to all but the Prognos/IWW data. The total cost figures were then normalised to €/road-km by dividing them by the length of the respective road network.
2.5.3 Regression analysis on unit infrastructure costs
The source data on infrastructure costs contains a lot of gaps. For a number of countries, in particular the new Member States besides Hungary, no road cost estimates were available at all and, for most other countries, data on trunk roads or local/urban streets was missing. Thus, a number of assumptions and regressions had to be applied in order to generate the complete database required by the scenario analyses in subsequent work packages of this study. Data situation, regression results and recommended transfer rules are described in turn for each road category. Motorways: Capital cost estimates for motorways are available for Switzerland (BFS 2007), Germany (ProgTrans/IWW, 2007), Austria (Herry et al., 2002), Italy, France and Portugal (UNITE, 2002b, 2002c). The figures, which were normalised per road kilometre and updated to the year 2005, are more or less the same apart from the results for Portugal. The Portuguese road accounts from UNITE (2002c) only consider capital costs for all the road classes together; the motorway costs in Figure 4 reflect running costs only and are thus not considered further. The unit figures per road kilometre range between € 0.52 billion for France and.€ 1.1 billion for Switzerland. The differences seem to be motivated by construction price levels and accounting philosophies, but might also be driven
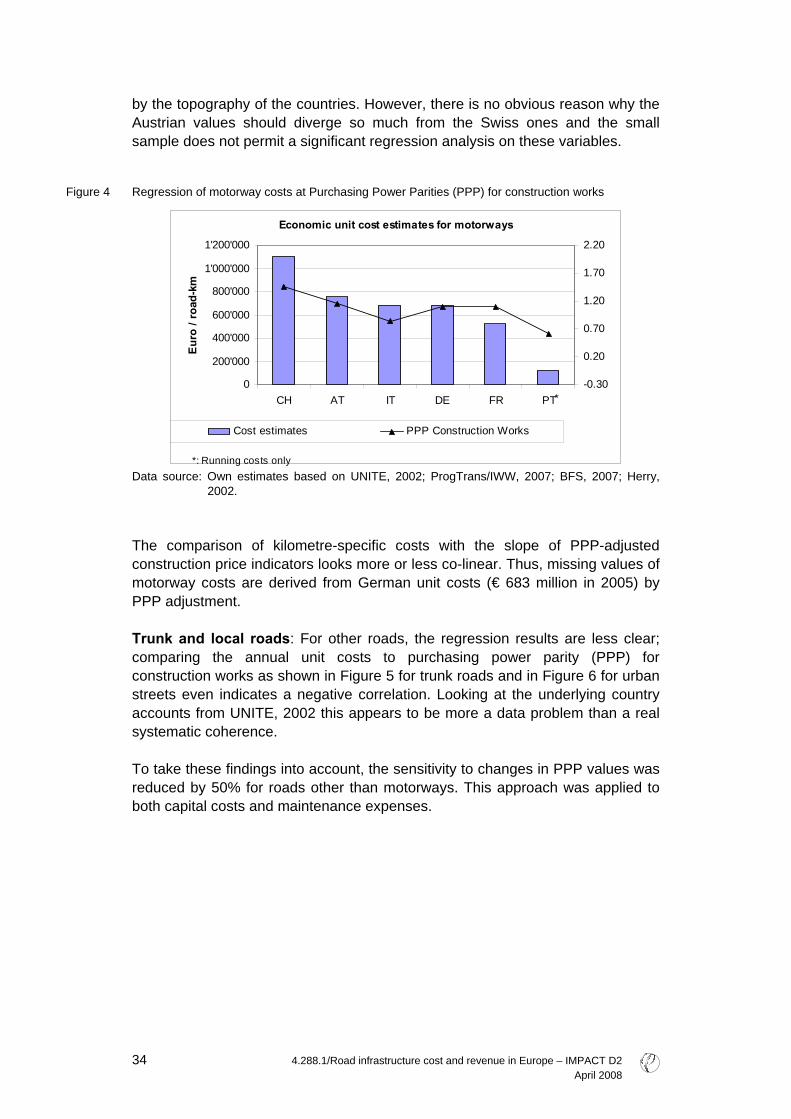
4.288.1/Road infrastructure cost and revenue in Europe – IMPACT D2 April 2008 34
by the topography of the countries. However, there is no obvious reason why the Austrian values should diverge so much from the Swiss ones and the small sample does not permit a significant regression analysis on these variables.
Figure 4 Regression of motorway costs at Purchasing Power Parities (PPP) for construction works
Economic unit cost estimates for motorways
0
200'000
400'000
600'000
800'000
1'000'000
1'200'000
CH AT IT DE FR PT
Euro
/ ro
ad-k
m
-0.30
0.20
0.70
1.20
1.70
2.20
Cost estimates PPP Construction Works
*: Running costs only
*
Data source: Own estimates based on UNITE, 2002; ProgTrans/IWW, 2007; BFS, 2007; Herry,
2002. The comparison of kilometre-specific costs with the slope of PPP-adjusted construction price indicators looks more or less co-linear. Thus, missing values of motorway costs are derived from German unit costs (€ 683 million in 2005) by PPP adjustment. Trunk and local roads: For other roads, the regression results are less clear; comparing the annual unit costs to purchasing power parity (PPP) for construction works as shown in Figure 5 for trunk roads and in Figure 6 for urban streets even indicates a negative correlation. Looking at the underlying country accounts from UNITE, 2002 this appears to be more a data problem than a real systematic coherence. To take these findings into account, the sensitivity to changes in PPP values was reduced by 50% for roads other than motorways. This approach was applied to both capital costs and maintenance expenses.

4.288.1/Road infrastructure cost and revenue in Europe – IMPACT D2 April 2008
35
Figure 5 Regression of trunk road costs at Purchasing Power Parities (PPP) for construction works
Unit construction costs of trunk roads and construction prices 2005
010'00020'00030'00040'00050'00060'00070'00080'00090'000
100'000
CH IT DE AT PT DK SE FR
Eur
o / r
oad-
km
0.000.200.400.600.801.001.201.401.601.80
PPP
for c
onst
ruct
ion
wor
ks (E
U25=
1)
€/road-km PPP
Data source: Own estimates based on UNITE (2002), ProgTrans/IWW (2007), BFS (2003), Herry
(2002). On communal roads there is no apparent co-linearity between unit costs and the PPP indicator for construction services. Remarkably, the unit costs for Swiss communal roads ranges at the lower end of the scale. This indicates that the Swiss methodology shifts a higher proportion of common costs to higher road levels than other methodologies do (Figure 6).
Figure 6 Regression of local and urban road costs at Purchasing Power Parities (PPP) for construction works
Unit construction costs of trunk roads and construction prices 2005
010'00020'00030'00040'00050'00060'00070'00080'00090'000
100'000
CH IT DE AT PT DK SE FR
Eur
o / r
oad-
km
0.000.200.400.600.801.001.201.401.601.80
PPP
for
cons
truct
ion
wor
ks (E
U25=
1)
€/road-km PPP
Data source: Own estimates based on UNITE, 2002; ProgTrans/IWW, 2007; BFS, 2003; Herry, 2002.

4.288.1/Road infrastructure cost and revenue in Europe – IMPACT D2 April 2008 36
The extrapolated unit costs were applied to those countries without their own cost accounts. National values were transformed into 2005 prices, but were otherwise left unchanged.
2.5.4 Cost allocation and average costs
The allocation of infrastructure costs to vehicle categories considers the specific characteristics of different cost elements. Two basic categories of total infrastructure costs are capital costs, i.e. depreciation and interest on investments lasting longer than one year, and running costs. Total costs broken down into capital and running costs are available for 14 of the 29 countries. The studies reviewed suggest a 61% share of capital costs in total costs; this figure varies slightly between road classes (Table 10).
Table 10 Share of capital costs by road class according to existing studies
Country Share of capital costs Name Code All roads Motorways Trunk roads Urban roads Denmark DK 52% 52% 52% 52%Italy IT 53% 53% 53% 53%France FR 53% 53% 62% 59%Netherlands NL 56% Portugal PT 60% 60% 60% 60%Austria AT 82% 85% 70% 57%Switzerland CH 65% 88% 56% 45%Germany DE 75% 75% 77% 71%Spain ES 78% Greece GR 85% Hungary HU 94% Finland FI 100% Ireland IE 100% Sweden SE 33% 33% 32%Selected default 61% 64% 63% 62%
Source: Own estimates based on UNITE, 2002; ProgTrans/IWW, 2007; BFS, 2003; Herry, 2002. Detailed cost categories for capital and maintenance costs were only available for a few countries. The variability and the causation of capital and running costs are shown in Table 11 and Table 12. Total costs were allocated to fixed and variable costs and to vehicle categories using either simple vehicle kilometres (VKM), passenger car equivalents (PCE), weighted or equivalent standard axle loadings (ESAL) and weighted vehicle kilometres. − Unweighted vehicle kilometres are used to allocate common costs for which
no specific causation or responsibility relationship can be identified. − PCE denote the road space capacity demanded by different vehicle types in
dense traffic relative to a passenger car. They take into account the vehicle's size, its usual and maximum travel speed and ability to accelerate. PCE weighted vehicle kilometres thus represent the road space foreseen for the respective vehicle class.

4.288.1/Road infrastructure cost and revenue in Europe – IMPACT D2 April 2008
37
− The ESAL indicator describes the degree of road damages caused by different vehicle types following the 4th power rule. On the basis of extensive tests by the US AASHTO3, this rule states that road damages are proportional to the 3rd to 4th power of the vehicles’ axle load (FHWA, 1997; Doll, 2005). ESAL weighted vehicle kilometres thus describe the share of road damages expected from the respective vehicle class.
The PCE and ESAL equivalency factors used are shown in Table 9 for the nine indicative vehicle classes considered in this study. Four different types of investment measures were distinguished for allocating capital costs to vehicle classes: − Investment in new road space: The cost driver for this measure is capacity
demand, which is expressed by PCE weighted projected vehicle kilometres. − Fixed maintenance operations: Replacement of assets because of their age,
climate impacts, etc. There is no traffic impact and thus the rules of new investments are applied.
− Traffic load dependent routine maintenance: One example of this type of measure is the reestablishment of road surface quality. This affects all vehicles and thus costs are allocated by simple vehicle kilometres.
− Large repair measures: ESAL weighted vehicle kilometres are applied if the motivation behind replacement or major maintenance measures is to repair damages due to heavy traffic.
Table 10 shows the share of capital costs allocated to these four activity types by various studies and derives default values for studies providing no allocation rules.
Table 11 Structure of capital cost elements
Category New capacity Replacement and large-scale renewal Cost variability Fixed Fixed Variable Variable Causation/responsibility PCE PCE VKM ESAL Switzerland All roads 90% 5% 5%Germany Motorways 50% 23% 13% 14% Trunk roads 50% 26% 10% 14%Selected default values 50% 40% 5% 5%
3 AASHTO = American Association of State Highway and Transportation Officials.

4.288.1/Road infrastructure cost and revenue in Europe – IMPACT D2 April 2008 38
Running costs denote all costs which are not capitalised, e. g. which extend no more than two years into the future. These include short term maintenance and repair measures as well as the costs for operating the road network. Four activity types are also identified for running costs: − Repair and maintenance: Similar to the repair measure of capital costs, short
term repair activities are fully allocated by SEAL-weighted vehicle kilometres. − Traffic police and signalling costs depend on traffic volumes but not
necessarily on the type of vehicle. Unweighted VKMs are thus applied to allocate costs to vehicle categories.
− Administration costs are also independent of vehicle types and are thus treated as above.
− Finally, the costs of the charging system are allocated to the affected vehicles. These are HGVs for Germany. As an approximation, ESAL weighted vehicle kilometres are used since these shift virtually all costs to HGVs.
Table 12 shows the differentiation of running costs as reported by several studies. The values suggest that 42% of running costs are due to repair and maintenance measures, 16% to police and traffic signalling and another 42% to public administration. Apart from Germany, the charge collection systems of toll motorways are contained in the administrative costs; for Germany, the system costs of Toll Collect were added separately to the running costs because of their high cost share.
Table 12 Structure of running cost elements
Category Repair/ Police/ Administration Charging maintenance signalling system Cost variability Variable Fixed Fixed Fixed Causation/responsibility ESAL VKM VKM ESAL All roads Switzerland 42% 58% Hungary 86% 15% Netherlands 51% 49% Motorways Germany 24% 24% 24% 28% Portugal 49% 5% 46% Trunk roads Germany 34% 33% 33% Portugal 40% 5% 55% Urban roads Portugal 40% 1% 59% Selected default values 42% 16% 42% 0%
The above rules finally allowed total infrastructure costs, e.g. the costs of construction, operation, maintenance and development of the concerned infrastructure network to be allocated into fixed and variable elements. Fixed costs contain the capital costs of capacity-related construction works and all operating costs besides repair and maintenance. Variable costs (in the short- to medium term) comprise some replacement and repair investments and all small-scale repair and maintenance measures.
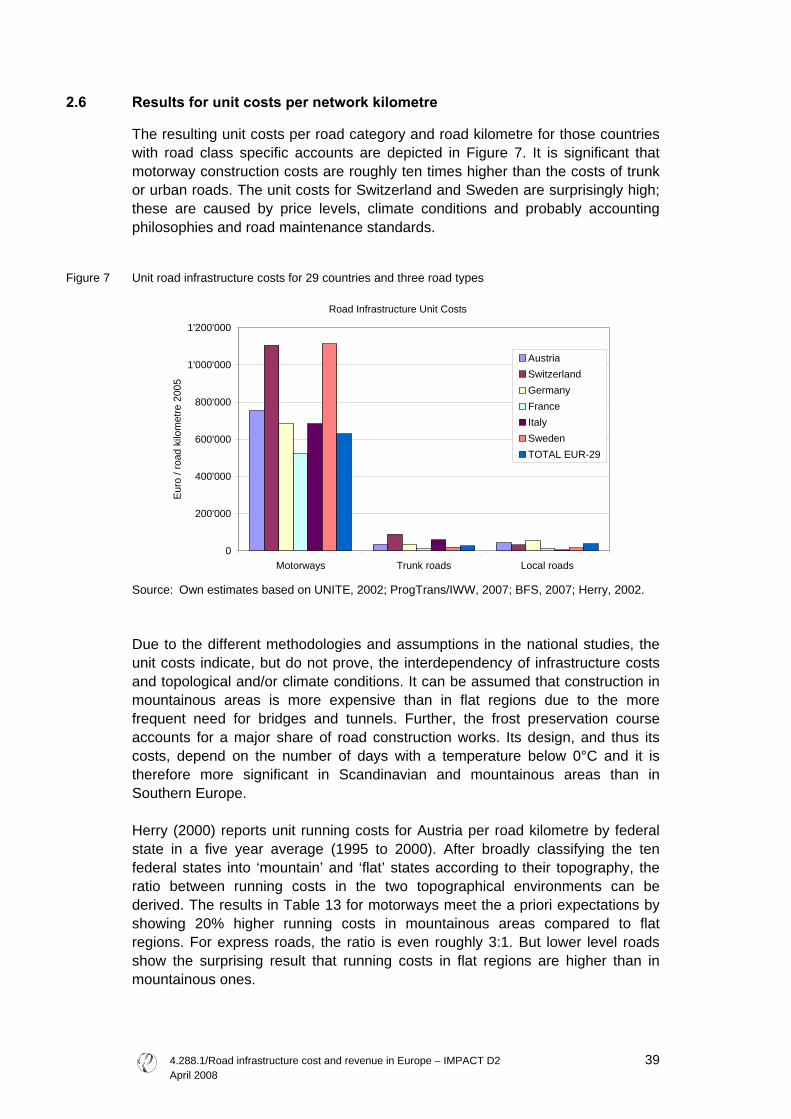
4.288.1/Road infrastructure cost and revenue in Europe – IMPACT D2 April 2008
39
2.6 Results for unit costs per network kilometre
The resulting unit costs per road category and road kilometre for those countries with road class specific accounts are depicted in Figure 7. It is significant that motorway construction costs are roughly ten times higher than the costs of trunk or urban roads. The unit costs for Switzerland and Sweden are surprisingly high; these are caused by price levels, climate conditions and probably accounting philosophies and road maintenance standards.
Figure 7 Unit road infrastructure costs for 29 countries and three road types
Road Infrastructure Unit Costs
0
200'000
400'000
600'000
800'000
1'000'000
1'200'000
Motorways Trunk roads Local roads
Eur
o / r
oad
kilo
met
re 2
005
AustriaSwitzerlandGermanyFrance ItalySwedenTOTAL EUR-29
Source: Own estimates based on UNITE, 2002; ProgTrans/IWW, 2007; BFS, 2007; Herry, 2002. Due to the different methodologies and assumptions in the national studies, the unit costs indicate, but do not prove, the interdependency of infrastructure costs and topological and/or climate conditions. It can be assumed that construction in mountainous areas is more expensive than in flat regions due to the more frequent need for bridges and tunnels. Further, the frost preservation course accounts for a major share of road construction works. Its design, and thus its costs, depend on the number of days with a temperature below 0°C and it is therefore more significant in Scandinavian and mountainous areas than in Southern Europe. Herry (2000) reports unit running costs for Austria per road kilometre by federal state in a five year average (1995 to 2000). After broadly classifying the ten federal states into ‘mountain’ and ‘flat’ states according to their topography, the ratio between running costs in the two topographical environments can be derived. The results in Table 13 for motorways meet the a priori expectations by showing 20% higher running costs in mountainous areas compared to flat regions. For express roads, the ratio is even roughly 3:1. But lower level roads show the surprising result that running costs in flat regions are higher than in mountainous ones.

4.288.1/Road infrastructure cost and revenue in Europe – IMPACT D2 April 2008 40
Table 13 Running costs by federal state in Austria 2000
Motorways Express roads
Federal roads
State & community roads
Million ATS 2000 Mountain states Oberösterreich 3,348 373 153 Salzburg 2,381 426 156 Steiermark 2,267 1,310 312 138 Kärnten 1,776 336 130 Tirol 2,472 4,870 400 156 Vorarlberg 1,478 3,286 406 203 Average mountain 2,552 2,978 366 152 Flat states Wien 3,538 1,164 480 Niederösterreich 1,892 952 358 209 Burgenland 1,379 904 395 196 Average flat 2,128 931 491 253 TOTAL Average all states 2,304 1,688 380 177 Mountain/all states 111% 176% 96% 86% Mountain/flat states 120% 320% 75% 60%
Source: Herry (2000). A respective evaluation of maintenance cost data for Swiss motorways in 2001 arrives at similar ratios. The figures for mountainous areas are found to be 50% above the Swiss average by GRACE (2006) (Table 14).
Table 14 Maintenance costs per motorway kilometre by Canton in Switzerland, 2001
Canton Maintenance costs
in 1,000 CHF
Length in km
Costs per km in 1,000 CHF/km
Mountain cantons Wallis 31,428 101,8 309,00 Glarus 2,203 16,6 133,00 Graubünden 44,745 128,5 348,00 Nidwalden 17,686 23,8 743,00 Obwalden 4,308 32,1 134,00 Uri 81,227 67,5 1,203,00 Total mountain 181,597 370,0 490,80 Relatively flat cantons Argau 19,000 99,3 191,00 Basel-Land 18,804 30,2 599,00 Zürich 60,516 121,6 498,00 Thurgau 2,854 38,5 74,00 Total flat 100,454 290,0 347,00 TOTAL Swiss average mountain/Swiss average 537,728 1,638,0 3,281,49 Mountain/relatively flat 1,41 Mountain/Swiss average 1,49
Source: GRACE (2006).
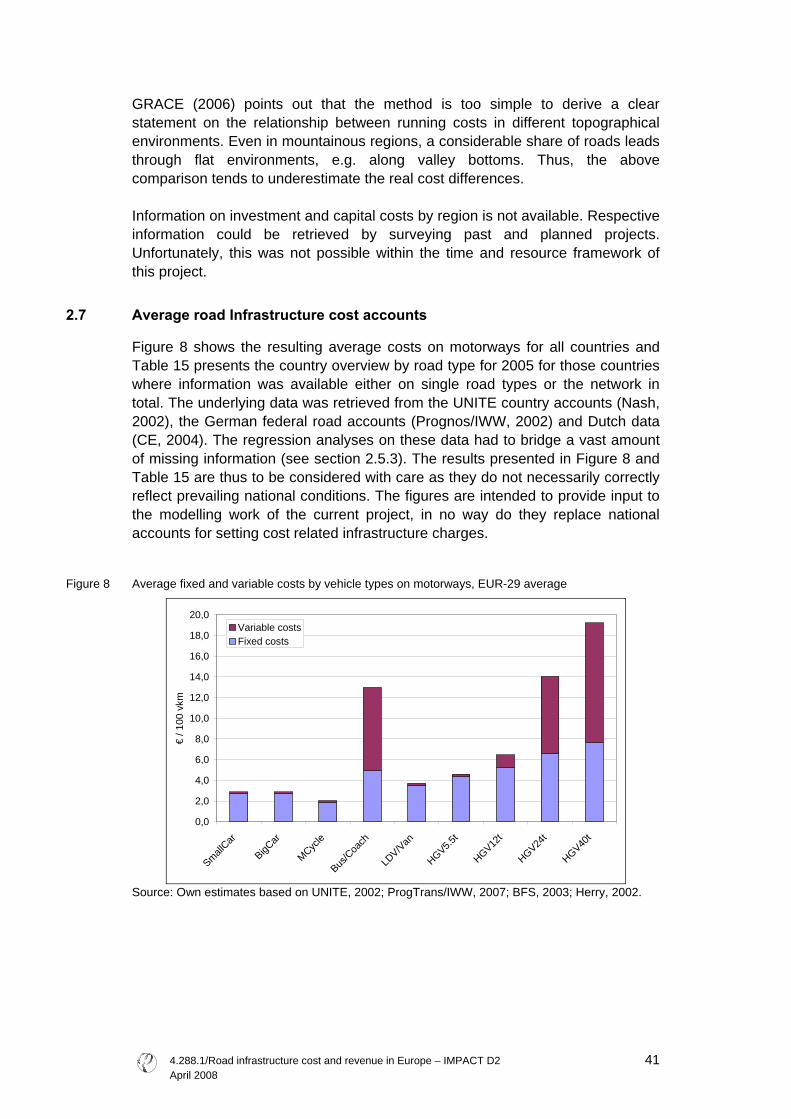
4.288.1/Road infrastructure cost and revenue in Europe – IMPACT D2 April 2008
41
GRACE (2006) points out that the method is too simple to derive a clear statement on the relationship between running costs in different topographical environments. Even in mountainous regions, a considerable share of roads leads through flat environments, e.g. along valley bottoms. Thus, the above comparison tends to underestimate the real cost differences. Information on investment and capital costs by region is not available. Respective information could be retrieved by surveying past and planned projects. Unfortunately, this was not possible within the time and resource framework of this project.
2.7 Average road Infrastructure cost accounts
Figure 8 shows the resulting average costs on motorways for all countries and Table 15 presents the country overview by road type for 2005 for those countries where information was available either on single road types or the network in total. The underlying data was retrieved from the UNITE country accounts (Nash, 2002), the German federal road accounts (Prognos/IWW, 2002) and Dutch data (CE, 2004). The regression analyses on these data had to bridge a vast amount of missing information (see section 2.5.3). The results presented in Figure 8 and Table 15 are thus to be considered with care as they do not necessarily correctly reflect prevailing national conditions. The figures are intended to provide input to the modelling work of the current project, in no way do they replace national accounts for setting cost related infrastructure charges.
Figure 8 Average fixed and variable costs by vehicle types on motorways, EUR-29 average
0,0
2,0
4,0
6,0
8,0
10,0
12,0
14,0
16,0
18,0
20,0
SmallCar
BigCar
MCycle
Bus/C
oach
LDV/Van
HGV5.5t
HGV12t
HGV24t
HGV40t
€ / 1
00 v
km
Variable costsFixed costs
Source: Own estimates based on UNITE, 2002; ProgTrans/IWW, 2007; BFS, 2003; Herry, 2002.
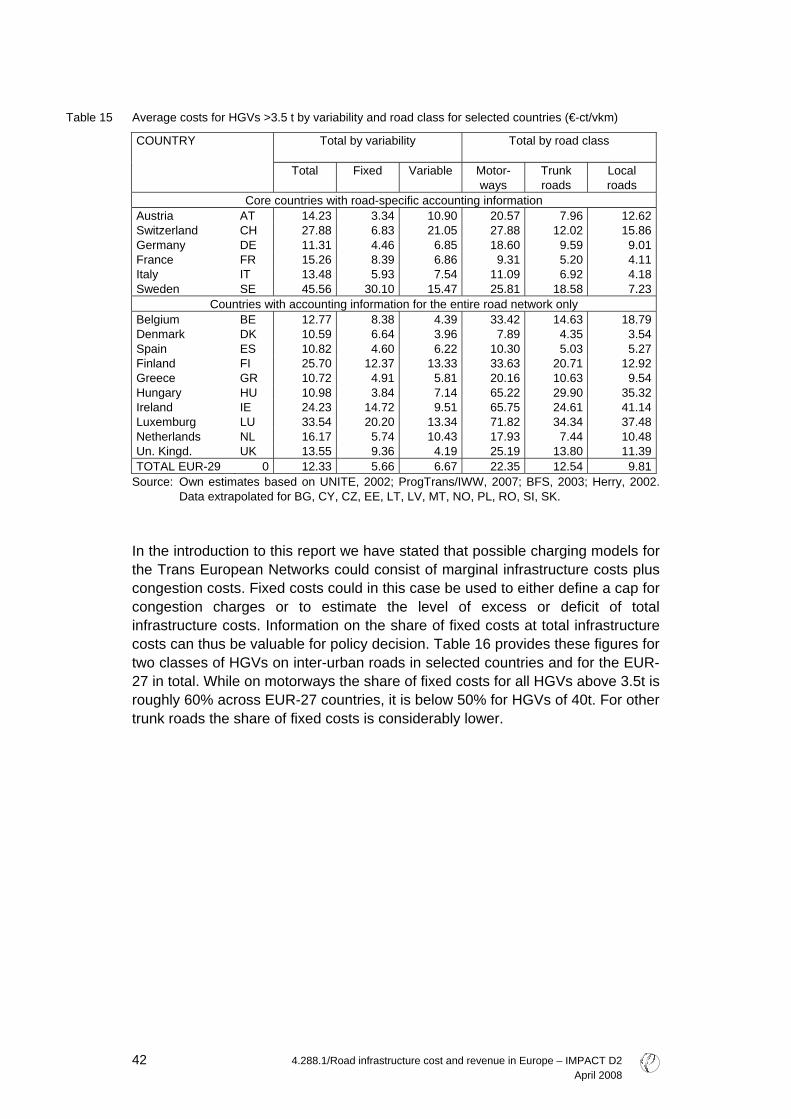
4.288.1/Road infrastructure cost and revenue in Europe – IMPACT D2 April 2008 42
Table 15 Average costs for HGVs >3.5 t by variability and road class for selected countries (€-ct/vkm)
COUNTRY Total by variability
Total by road class
Total Fixed Variable Motor-ways
Trunk roads
Local roads
Core countries with road-specific accounting information Austria AT 14.23 3.34 10.90 20.57 7.96 12.62 Switzerland CH 27.88 6.83 21.05 27.88 12.02 15.86 Germany DE 11.31 4.46 6.85 18.60 9.59 9.01 France FR 15.26 8.39 6.86 9.31 5.20 4.11 Italy IT 13.48 5.93 7.54 11.09 6.92 4.18 Sweden SE 45.56 30.10 15.47 25.81 18.58 7.23
Countries with accounting information for the entire road network only Belgium BE 12.77 8.38 4.39 33.42 14.63 18.79 Denmark DK 10.59 6.64 3.96 7.89 4.35 3.54 Spain ES 10.82 4.60 6.22 10.30 5.03 5.27 Finland FI 25.70 12.37 13.33 33.63 20.71 12.92 Greece GR 10.72 4.91 5.81 20.16 10.63 9.54 Hungary HU 10.98 3.84 7.14 65.22 29.90 35.32 Ireland IE 24.23 14.72 9.51 65.75 24.61 41.14 Luxemburg LU 33.54 20.20 13.34 71.82 34.34 37.48 Netherlands NL 16.17 5.74 10.43 17.93 7.44 10.48 Un. Kingd. UK 13.55 9.36 4.19 25.19 13.80 11.39 TOTAL EUR-29 0 12.33 5.66 6.67 22.35 12.54 9.81
Source: Own estimates based on UNITE, 2002; ProgTrans/IWW, 2007; BFS, 2003; Herry, 2002. Data extrapolated for BG, CY, CZ, EE, LT, LV, MT, NO, PL, RO, SI, SK.
In the introduction to this report we have stated that possible charging models for the Trans European Networks could consist of marginal infrastructure costs plus congestion costs. Fixed costs could in this case be used to either define a cap for congestion charges or to estimate the level of excess or deficit of total infrastructure costs. Information on the share of fixed costs at total infrastructure costs can thus be valuable for policy decision. Table 16 provides these figures for two classes of HGVs on inter-urban roads in selected countries and for the EUR-27 in total. While on motorways the share of fixed costs for all HGVs above 3.5t is roughly 60% across EUR-27 countries, it is below 50% for HGVs of 40t. For other trunk roads the share of fixed costs is considerably lower.

4.288.1/Road infrastructure cost and revenue in Europe – IMPACT D2 April 2008
43
Table 16 Share of fixed infrastructure costs at average infrastructure costs for HGVs on motorways and trunk roads in selected countries
COUNTRY Motorways Other trunk roads HGV >3.5t HGV 40t HGV >3.5t HGV 40t Austria AT 79.9% 69.7% 65.4% 51,1%Switzerland CH 79.0% 68.4% 50.0% 35,0%Germany DE 64.0% 54.6% 47.1% 33,0%France FR 50.6% 35.4% 38.0% 24,9%Italy IT 61.4% 46.0% 20.2% 11,9%Sweden SE 39.5% 25.0% 24.1% 14,0%Belgium BE 39.6% 26.2% 20.6% 12,3%Denmark DK 42.9% 28.5% 25.9% 15,7%Spain ES 62.7% 47.9% 44.0% 29,8%Finland FI 57.3% 42.2% 40.0% 26,5%Greece GR 59.6% 44.6% 40.0% 26,5%Hungary HU 69.7% 55.9% 51.7% 36,7%Ireland IE 44.7% 30.4% 25.1% 15,3%Luxemburg LU 45.2% 30.9% 26.1% 16,0%Netherlands NL 69.3% 55.4% 54.8% 39,7%Portugal PT 59.9% 44.9% 47.6% 32,8%Un. Kingd. UK 35.9% 23.2% 19.2% 11,3%TOTAL EUR-29 59,1% 45.3% 40.1% 26.6%
Detailed estimates for all vehicle types and extrapolations for all 29 countries are presented in the annex to this report.

4.288.1/Road infrastructure cost and revenue in Europe – IMPACT D2 April 2008 44

4.288.1/Road infrastructure cost and revenue in Europe – IMPACT D2 April 2008
45
3 Marginal road infrastructure costs for Europe
This chapter provides information on the marginal social costs of infrastructure use by road type and vehicle category. This information goes directly into the IMPACT scenarios to be presented and assessed in Deliverable 3 of this study. The term ‘marginal costs’ in this report refers to the additional costs to the infrastructure manager caused by an additional vehicle kilometre on the network. The term should not be confused with the marginal costs of capacity extension. Inputs for the elaborations are the detailed estimates of total costs by country, road class and vehicle type presented in Chapter 2 Further, the structure of single cost elements elaborated in the preceding chapter provides valuable inputs for estimating marginal costs. The scope of marginal social infrastructure costs is the entire life span of the assets in question. Long term marginal costs are considered, which reflect the implications of road use at multiple decision levels from road construction to quality standards, maintenance and repair activities.
3.1 Methodological issues and options
In the following, selected aspects of transport user pricing are presented and discussed in depth. The objective is to look at the various definitions of marginal costs discussed in economic literature. Different approaches are expected to impact the way marginal infrastructure cost based road user charges need to be estimated.
3.1.1 Scope and rationale of marginal infrastructure cost estimation excluding congestion
The general principles of the welfare theory suggest that pricing should be done according to marginal costs. However, when road users are to be charged for the marginal costs of infrastructure use, full cost recovery is not assured: Deficits or surpluses may arise, possibly leading to cross funding between regions. Hence, welfare theory suggests ‘second best’ pricing options, which describe deviations from marginal costs that lead to cost coverage while minimising the negative welfare effects. An example are Ramsey prices. It is clear from the above that such price schemes require information on marginal infrastructure use cost levels as well as on total costs. According to Lindberg, 2006 and other publications, there is a close link between the marginal costs for constructing, maintaining, repairing, operating, servicing and administrating the infrastructure (briefly: marginal infrastructure costs) on the one hand and the costs of traffic congestion, scarcity and degrading quality (briefly: user costs) on the other hand.
4.288.1/Road infrastructure cost and revenue in Europe – IMPACT D2 April 2008 46
The causality works in two directions: 1 Increasing user costs indicate the need for infrastructure investments or
operational activities (e. g. traffic demand management). 2 Construction and maintenance activities may cause congestion around
construction sites and omitted maintenance activities may force users to drive more slowly or cause safety problems.
In the following we will focus on construction-related marginal infrastructure use costs and their dependence on traffic demand, construction standards, geographical and environmental conditions. Congestion and scarcity effects are quantified in Deliverable 1 of this study, while Deliverable 3 integrates the two cost categories by elaborating on market-based traffic demand management strategies and policy options.
3.1.2 Short and long term marginal infrastructure construction costs
Increasing traffic levels cause maintenance and repair activities to grow under ceteris paribus conditions. In the long run, traffic levels even affect construction standards and infrastructure dimensions because stronger road layers usually require less frequent maintenance activities. And here the definition of which parts of road infrastructure construction and maintenance costs are ‘marginal’, i.e. are directly influenced by traffic volumes, starts to get tricky. Road planning manuals contain well defined functions describing the thickness of layers and other dimension parameters of roads according to projected traffic volumes over the infrastructure lifetime. This implies that it is not only the short to medium term repair measures and replacement and service measures that need to be taken into account, but in principle the entire lifecycle cost of the asset and its variation with traffic demand. Consequently, there is a trade off between higher fixed costs up front which thus do not end up as marginal use costs, and maintenance costs throughout the life-cycle which are determined by the wear-and-tear of traffic and are thus part of marginal use costs. To capture these marginal effects of traffic on long term infrastructure costs, two types of models have been applied in recent studies: econometric models and the duration approach.
3.1.3 Option 1: Econometric models
In the econometric model, time or cross section data on total annual road costs or expenditures are analysed against data on traffic volumes accommodated by these road sections. There are variations in the coverage of activities (renewal, maintenance or operation), the definition of the explanatory variable (AADT, HGV movements or passenger car movements), the size of the network analysed (single links, maintenance delivery units) and the consideration of geographic and environmental variables. The GRACE case studies for Sweden, Germany and Poland use a double log function to first explain the elasticity of total costs (C) with traffic volumes (Q).

4.288.1/Road infrastructure cost and revenue in Europe – IMPACT D2 April 2008
47
Marginal costs are then computed by the product of the elasticity and average costs. The practical realisation of the econometric approach causes some problems as explanatory variables, e. g. traffic volumes of different vehicle classes, show a very high co-linearity and can thus not deliver significant detailed results by vehicle type.
3.1.4 Option 2: The duration or engineering approach
An alternative to the econometric approach is to make use of engineering cost functions and maintenance models. To capture total lifecycle costs within a complete maintenance interval, the length of maintenance periods is estimated using data on traffic and infrastructure characteristics. Total cost elasticity or marginal costs then result from the impact of traffic volumes on the length of maintenance intervals and thus on the net present value of future maintenance costs.
3.2 Available studies and results
At a European level, two studies are available on the marginal costs of road infrastructure: 1 The GRACE project (Lindberg, 2006) applies the econometric approach to
case studies in Sweden, Germany and Poland. Additionally the duration approach is applied to Swedish roads. The focus of the case studies is to explain the elasticity of total costs with varying traffic volumes, which is the ratio between average and marginal infrastructure costs. The case studies distinguish between renewal, renewal and maintenance, and maintenance/ operation costs.
2 The UNITE project (UNITE, 2002d) focussed on the direct measurement of marginal infrastructure costs in four case studies on Swedish, German, Swiss and Austrian roads. Although the methodology is in line with the econometric approach of the GRACE case studies, the UNITE cases focussed on some specific elements of road infrastructure costs, namely the resurfacing of pavements.
Further work has been carried out by Newberry, 1988a, 1990 and Ozbay et al., 2000 for the UK and Winston, 1988 and Small et al., 1989 for the US.
3.2.1 Results on total cost elasticities
Total cost elasticities describe the share of marginal costs in average infrastructure use costs. According to the GRACE case studies (Lindberg, 2006), they appear remarkably constant with respect to traffic densities. The results are presented in Table 17.

4.288.1/Road infrastructure cost and revenue in Europe – IMPACT D2 April 2008 48
Table 17 Infrastructure cost elasticities according to the GRACE case studies
β1 β11* lnQ
β2* lnX
Mean Q
Elasticity Output (Q)
Interaction
term X Renewal
Germany R 0.15 0.38 -0.26 5002 0.87 HGV Pass. carsC)
Poland R 0.57 8,592 (1,403)A) 0.57 AADT No Sweden R paved
4.95 -0.38 87,594 (158)B) 0.72 HGVkm in region
No
Sweden R gravel
0.68 718 (5)B) 0.68 HGVkm in region
No
Sweden duration model
0.039DE HGV No
Renewal and maintenance Sweden R+M 3.3 -0.24 88.313 (125) B) 0.58 HGVkm
in region No
Poland R+M 0.48 8,592 (1,403)A) 0.48 AADT No Maintenance/operation
Poland M 0.12 8,592 (1,403)A) 0.12 AADT No Sweden O 0.147 -0.007 869,962
(1,232)B) (0.05) vkm in
region No
Sweden O winter
0.21 -0.0152 869,962 (1,232)B)
(0.007) vkm in region
No
Sweden O paved
0.495 -0.034 859,463 (1,554)B)
(0.03) vkm in region
No
Sweden O gravel
1.11 -0.136 10,498 (69)B) (-0.09) vkm in region
No
Note: DE = Deterioration elasticity. R = renewal; M = (short term) maintenance; O = Operation; Q = traffic volume; HGV = heavy goods vehicle; AADT = average annual daily traffic; X = statistical error term.
A) Average HGV traffic. B) Output measure expressed per km road. C) Mean volume 26632. (In parenthesis)= non significant estimates. Source: Lindberg (2006). Along with several other model parameters, Table 17 presents the average elasticities of marginal infrastructure use costs related to the respective average costs of the same category (maintenance, renewal (investments) and operation). These elasticities at average traffic volumes were taken from a series of case studies performed in the GRACE project (Lindberg 2006), which aimed to deliver marginal cost and elasticity functions with respect to traffic volumes, the age of infrastructures and external impacts (climate). Figure 9 presents a number of empirically derived graphs from Lindberg (2006), UNITE (2002d) and other studies based on econometric analyses. Link (2007) also refers to two engineering-based studies for Sweden. While UNITE (2002d) arrives at an increasing marginal cost function, Lindberg (2006) finds the MC function to decrease with traffic volume when the age of the infrastructure and climate impacts are taken into consideration.

4.288.1/Road infrastructure cost and revenue in Europe – IMPACT D2 April 2008
49
Figure 9 Marginal infrastructure use cost functions from various econometric studies g
D – renewals (Link 2006)
0.00
0.01
0.02
0.03
0.04
0.05
0.06
0.07
0.08
0.09
0 5 10 15 20 25mil.Vehicle
€/km
Cars
Trucks
Mean
Marginal costs of constructional maintenance Marginal costs of maintenance and renewal
0,0012
0,0013
0,0014
0,0015
0,0016
0,0017
0,0018
1 6 11 16 21 26 31 36 41
€/km
Marginal Costs - Roads
00,010,020,030,040,050,06
0.03
0.07
0.11
0.16
0.2 0.24
0.28
0.32
0.37
0.41
ratio AADT trucks and AADT passenger cars
Euro
D – renewals (Link 2002)
CH – constr. maint. AT –maint.+renewal
D – renewals (Link 2006)
0.00
0.01
0.02
0.03
0.04
0.05
0.06
0.07
0.08
0.09
0 5 10 15 20 25mil.Vehicle
€/km
Cars
Trucks
Mean
Marginal costs of constructional maintenance Marginal costs of maintenance and renewal
0,0012
0,0013
0,0014
0,0015
0,0016
0,0017
0,0018
1 6 11 16 21 26 31 36 41
€/km
Marginal Costs - Roads
00,010,020,030,040,050,06
0.03
0.07
0.11
0.16
0.2 0.24
0.28
0.32
0.37
0.41
ratio AADT trucks and AADT passenger cars
Euro
D – renewals (Link 2002)
CH – constr. maint. AT –maint.+renewal
gS – operation (Haraldsson 2006) S – maint. (Haraldsson 2006)
PL – renewals (Bak et al. 06) PL – renewals + maint. (Bak et al. 0
S – operation (Haraldsson 2006) S – maint. (Haraldsson 2006)
PL – renewals (Bak et al. 06) PL – renewals + maint. (Bak et al. 0
Source: Link (2007).

4.288.1/Road infrastructure cost and revenue in Europe – IMPACT D2 April 2008 50
The results of Lindberg (2006) and Link (2007) lead to the following conclusions: 1 Renewal costs show the highest elasticity values, followed by the
combination of renewal and maintenance expenditures. 2 Operation costs in Sweden show no significant relation to traffic volumes; the
marginal costs are thus (close to) zero. 3 Given the strong co-linearity of traffic variables there is no significant
difference between vehicle classes, but elasticities are more or less constant with regard to differences in traffic loads.
4 Most case studies show a decreasing slope with traffic density. However, the degree of nonlinearity is weak in all case studies which gives rise to the conclusion that marginal use costs (MC) = average variable costs (VC).
5 The marginal infrastructure use cost curves show diverging results: While most case studies find decreasing marginal costs with traffic density, increasing curves have been found for Germany, Austria and Sweden.
6 The German case study suggests that there are significant economies of scale concerning the size of the maintenance delivery unit tendered.
3.2.2 Average and marginal costs
A comparison with studies from North America and Australia confirms the result of the GRACE case studies that the share of marginal costs in average costs is higher for rehabilitation (renewal) activities than for routine maintenance. The studies further show that marginal costs depend strongly on the construction standard (width and layer thickness) of roads. Other international experience confirms the GRACE observation that marginal costs decrease with traffic density. Table 18 shows the share of road infrastructure expenses which is directly attributable to traffic loads according to different US studies. The values range between 50% and 80%; flexible pavements seem to be much more resistant to the influences of heavy axles than rigid surfaces. According to Lindberg, 2006 these shares can be benchmarked against the elasticities found in the GRACE project.
Table 18 Share of traffic-dependent infrastructure costs in US studies
Study Year Flexible JCP CRC Composite Rehabilitation Li et al. (2001) 1995-1997 0.28 0.78 0.38 Indiana HCAS 1984 0.42 0.78 0.38 ARRB Study (AU) 0.88 0.88 0.88 Federal HCAS 1997 0.84-0.89 0.78-0.86 0.84-0.89 Routine maintenance Li et al. (2002) 1995-1997 0.257 0.357 0.632 0.28 Indiana HSC 1984 0.21 0.54 1.00 0.29 Ontario study 1990 0.25-0.33
Note: HCAS = Highway Cost Allocation Study; JCP=joint concrete pavement, CRC=continuously reinforced concrete and Composite; AU = Australia.
Source: Lindberg, 2006.

4.288.1/Road infrastructure cost and revenue in Europe – IMPACT D2 April 2008
51
The results of UNITE, GRACE and selected international studies on marginal and - as far as available - average costs are presented in Table 19.
Table 19 Average and marginal cost estimates of different studies
Study Area Vehicle type
Average costs
(€/vkm)
Marginal costs (€/vkm) *
Germany R HGV 1.580 1.390 Poland R All vehicles 0.210 0.120 Sweden R paved HGV 0.036 0.032 Sweden R gravel HGV 0.415 0.236 Sweden R duration model HGV - 0.0013 Sweden R+M HGV 0.059 0.040 Poland R+M All vehicles 0.270 0.130 Sweden O All vehicles 0.024 (0.002) Sweden O winter All vehicles 0.015 (0.001) Sweden O paved All vehicles 0.003 (0.001)
GRACE (Lindberg 2006)
Sweden O gravel All vehicles 0.066 (0.010) Austria M+R HGV 0.0217 Sweden resurfacing All vehicles 0.0077-0.0186 Germany, R HGV 0.0005-0.0270
UNITE (Link 2002)
Switzerland, M+R+U HGV 0.0362-0.0517 Hajek et al. (1993)
Ontario (R) Urban Freeway Major Arterial Minor Arterial Collector Local
HGV (CA$) 0.002 0.007 0.012 0.031 0.461
Newbery (1988a)
Tunisia, resurfacing ESAL (US$)
0.13-2.58
Newbery (1990)
Northern Yersey, resurfacing ESAL (GBP)
0.00035
Ozbay et al. (2000)
Northern Yersey, resurfacing All vehicles (US$/mile)
0.062
Small and Winston (1988)
US Highways, Resurfacing ESAL (US$/mile)
0.022-0.023
Small et al. (1989)
US rural/urban freeways, resurfacing
ESAL (US$/mile)
0.0148-0.0432
Symbols: R = Renewal, M = Maintenance, U = Upgrade, O = Operation. Source: Data from Lindberg, 2006. * Unit of GRACE values not clear; a query was sent to the project team. Due to missing data in the source studies, it was not possible to express the marginal costs in more comparable units, e.g. per ton, ESAL or PCE weighted vehicle kilometres. Related tests with more detailed vehicle classes in Lindberg (2006) showed little significance of the regression results as the vehicle related variables then have a high degree of co-linearity.

4.288.1/Road infrastructure cost and revenue in Europe – IMPACT D2 April 2008 52
3.3 Value transfer procedure
The absolute values of marginal infrastructure costs presented in Table 19 are difficult to compare as the units differ and the type of costs included is unclear in some cases. The ratios between marginal and average costs derived by the GRACE case studies (see Table 20) appear more helpful when transferring marginal infrastructure use costs to different countries. However, given the small sample size, the degree of uncertainty still remains high.
Table 20 Ratio between marginal and average costs: Results of GRACE case studies
Country Vehicle type Renewal Maintenance + renewal
Maintenance Operation
Germany HGV 89% Sweden HGV 88% 68% All <1% Poland All 57% 48% 12%
Table 10 to Table 12 set the structure of total (or average) costs with respect to activities (investment, maintenance, operation) and variability against changing traffic volumes for a default road section. This categorisation allows the marginal infrastructure cost elasticities from Table 20 to be applied in order to gain an impression of the share of marginal costs in total and average costs. It also allows a comparison of the structure and level of marginal costs to variable average costs. This comparison, however, has a number of shortcomings. First, the elasticities are considered to be constant across varying levels of traffic density. This is in real life most probably not the case, but the GRACE results do not give a clear indication of whether they will increase or fall. Second, the regressions in the GRACE case studies are not always done with all vehicles; a number of case studies consider HGVs only. But as the computation of weighted average costs already consider basic vehicle characteristics and their expected impact on renewal and maintenance costs, the error should be acceptable. Table 21 presents the structure of average costs and derives several figures for marginal costs of infrastructure use for a default motorway segment. In this case the share of variable average costs in total (= fixed plus variable) average costs is 22%. Applying the range of 57% to 87% to renewal costs and 48% to 58% to renewal plus maintenance costs leads to a range of 18% to 27%. Relating marginal costs to maintenance activities only leads to a cost share of 2%. Finally, due to non-significant values, we have disregarded the variant relating marginal costs to operation activities. The marginal cost model based on maintenance and renewal costs shows a good match with the cost structure for determining variable average costs. The resulting share of variable average costs is very close to the lower bound (23% of

4.288.1/Road infrastructure cost and revenue in Europe – IMPACT D2 April 2008
53
total costs) of the range of cost shares spanned by GRACE case studies for Sweden and Poland (Lindberg 2006, Table 17 and Table 20).
Table 21 Share of average costs for different MC elasticities
Average costs Marginal costs Total Variable Renewal
Renewal +
maintenance Maintenance Cost component
87% 57% 58% 48% 12%Capital costs 63% - Capacity 31% - Renewal fixed 25% 22% 14% 15% 12% - Renewal vkm 3% 3% 3% 2% 2% 2% - Renewal ESAL 3% 3% 3% 2% 2% 2% Running costs 37% - Maintenance fixed 16% 16% 9% 7% 2% - Pol.+Sign. 6% - Admin.+Oper. 16% Total costs 100% 22% 27% 18% 27% 23% 2%
Source: Own estimates based on Lindberg (2006) results. Based on these observations we follow Link (2007) and recommend variable average infrastructure costs as a proxy for the medium-term marginal costs of infrastructure use. These are - across all vehicle categories and for motorways only - 22% of average infrastructure costs. This ratio might be different for individual vehicle types and other roads. Across all 29 countries considered and for all road classes, the share of variable costs to total infrastructure costs is 26%. The progression of average fixed and variable, i.e. marginal, costs with vehicle types is depicted in Figure 8. Table 22 shows a collection of marginal costs values for the six countries providing specific road class data, for motorways and trunk roads and for the four types of heavy goods vehicles. Here very high values appear for Sweden, where high price-level and climate-driven construction costs in combination with low traffic densities lead to extremely high average costs per vehicle kilometre. In contrast, classical transit countries like Germany and Austria with high traffic volumes show rather low average costs, and thus also low marginal costs per lorry kilometre.

4.288.1/Road infrastructure cost and revenue in Europe – IMPACT D2 April 2008 54
Table 22 Indicative marginal cost values for HGVs on motorways in selected countries
HGV on motorways HGV on other trunk roads 5.5t 12t 24t 40t 5.5t 12t 24t 40t
Country
€/100 vkm €/100 vkm AT 0.28 0.73 3.67 5.57 0.18 0.83 5.06 7.79 CH 0.51 1.44 7.53 11.45 0.30 2.29 15.27 23.64 DE 0.40 1.00 4.91 7.44 0.41 1.86 11.28 17.36 FR 0.20 1.41 9.30 14.40 0.09 0.91 6.26 9.71 IT 0.20 1.05 6.57 10.13 0.41 5.99 42.43 65.92 SE 0.46 4.84 33.38 51.79 0.22 3.14 22.23 34.53 EUR-27 0.24 1.04 6.26 9.63 0.24 2.02 13.62 21.10
Source: Own estimation. Comparing vehicle classes shows a very sharp progression of average variable (marginal) costs with vehicle weight. The cost level of a 40t HGV is roughly 20 times the marginal infrastructure costs of a 5.5t lorry. Marginal costs on trunk roads are in most cases higher than marginal costs on motorways due to the lower traffic volumes on secondary roads. However, this does not hold for France, where traffic densities on national routes are high compared with motorway traffic. These medium-term marginal costs consider all costs, including major replacement measures, except for the initial investment in a facility. In the long run, however, these costs are essential to maintain performance of the total system, which comprises the physical network and user quality. The current maintenance related marginal cost values are applied by infrastructure managers who aim to maintain the quality of the physical system but ignore user time costs. In this case, user effects and budget considerations will be addressed by some type of congestion or average cost pricing. Indicative figures on the marginal costs of road infrastructure use for all 29 countries, three road classes and nine vehicle types are given in the annex to this report. These values have been given to the TRANS-TOOLS and TREMOVE traffic models for computing the IMPACT internalisation scenarios to be presented in Deliverable 3 of this study. For individual countries, the values in the annex may deviate from the figures presented in the main text; the tables were deliberately not updated in order to document data exchange within the study. To conclude: the GRACE project has taken an important step forward in seeking explanations for the variations in the marginal costs of road infrastructure use. But the transfer of marginal cost estimates between regions still remains difficult and vague for several reasons: the complexity of the matter, the low statistical significance between the causes for infrastructure design and maintenance activities and the different assumptions behind the GRACE case studies. Thus, further research is needed on the generalisation of cost figures.

4.288.1/Road infrastructure cost and revenue in Europe – IMPACT D2 April 2008
55
4 Road revenue accounts
The objective of this section is to give an overview of all taxes and charges which are related to the ownership and the use of road vehicles and the use of road infrastructures. These range from taxes on the purchase of vehicles, through registration and insurance taxes to infrastructure user charges. The values are derived for all 29 countries using appropriate statistics based on unit values. Total tax revenues are generated with the help of vehicle stock and performance statistics. Therefore, total cost figures might diverge from national statistics. However, capturing the structure of the various national tax systems with regard to vehicle characteristics was considered to be more important than total revenue figures. Purely consumption related taxes, such as value added tax (VAT), were excluded. For fuel tax, different alternatives of earmarking revenue for the transport sector were analysed as, in principle, taxes are defined as making a general contribution to public budgets without receiving a guaranteed service in return. Therefore, a variant of considering only 50% of fuel taxes was contrasted with the main scenario of balancing total infrastructure costs with 100% of fuel taxes. This holds for the revenue side as well as for infrastructure costs. The following figures reflect the taxation and charging situation of the year 2005. More recent changes, e.g. the introduction of the Czech motorway toll and the Stockholm congestion charge, were not considered.
4.1 Earmarked tax revenues
A specific issue when talking about taxes is to what extent they are earmarked for transport infrastructure. In the first instance, taxes are raised to finance the expenditures of the public sector in general. From the perspective of efficient taxation, specific product taxes may be justified if the price elasticity of such products is relatively low and the distortion of the tax is relatively modest compared to similar levies on more price-sensitive products. These taxes are not necessarily intended to be reinvested in the sector where they have been raised. Another purpose of non-earmarked taxes is to cover external costs. Some of the IMPACT scenarios assume a level of 7 to 10 cents per litre for the internalisation of climate change costs. This share of fuel tax revenues is not used to finance transport infrastructure and is thus part of the non-earmarked tax share. Examples of earmarked taxes from Germany are the increases in the fuel tax to help finance German reunification and the first Gulf War and the increases in tobacco taxes used to finance anti-terrorist measures. No doubt there are similar examples from other countries. On the other hand, some countries have legally

4.288.1/Road infrastructure cost and revenue in Europe – IMPACT D2 April 2008 56
determined a share of mineral oil taxes to be spent on road transport. In Switzerland this is 50%, while Germany earmarks between 25% and 45%. The discussion about earmarking transport revenues is important for equity issues. Non-earmarked parts of revenues should not be included when comparing revenues with costs because these should contribute to the overall funding of the state just like other sectors, too. This is particularly valid if transport costs do not consider the associated costs of the public administration. Estimates of administrative costs for Germany range from 15% of total infrastructure costs (ProgTrans/IWW, 2007) to 56% of investment expenditures (Wirtschaftsrat, 2007). These administrative costs were considered in the database on European road infrastructure costs (Chapter 2) to a moderate extent (15%) according to ProgTrans/IWW (2007). Therefore, only a maximum of 50% of fuel taxes should be used to derive cost coverage figures. The share increases according to the level of administrative costs considered as the empirical evidence for assuming 50% of fuel taxes are spent on general purposes ignores the high share of public administration involved in operating road networks (Wirtschaftsrat 2007). The same holds for insurance and annual registration taxes. All other revenue categories are more directly linked to transport costs and may thus be considered to be 100%. In order to express the uncertainty in the discussion on the cost coverage figures, we present two scenarios: 50% and 100% consideration of fuel, insurance and annual vehicle circulation taxes. The level of earmarking to the transport sector does not play a role in efficiency considerations related to internalisation which are in the foreground of the IMPACT analysis and the related scenario development. Here, the use of revenues is not considered as only the level of charges influencing user behaviour is important. It is precisely because of the incentives to avoid the external costs that the revenues of these internalising charges should not be earmarked for reimbursing those responsible for the externality nor for compensating those affected. Such compensation may be justified from an equity perspective however. The internalisation purpose does not determine whether revenues should go into the general government budget or be used to finance transport infrastructure. To conclude: balancing public infrastructure investment taxes on the one hand and taxes and charges on infrastructure on the other can be construed in three equally valid ways: 1 The perspective of the government budget: Is the transport sector a net
contributor to the public sector (complication whether VAT should be included or not) in the same way as all the other private sectors?
2 The user pays principle: do transport consumers as a group pay for their use of transport infrastructure?
3 Efficiency: Are changes in the external costs caused by road users reflected in changes in taxes and charges?

4.288.1/Road infrastructure cost and revenue in Europe – IMPACT D2 April 2008
57
Arguably, the first and third balances include all taxes and charges on transport uses, whereas the second only covers those earmarked for transport infrastructure. The problems, of course, are the extent of the overlap between the group of general tax payers and that of infrastructure users, the high share of hidden administrative costs, and the extent that non-earmarked revenues of transport infrastructure taxes and charges are routinely used to finance infrastructure.
4.2 The revenue accounting framework
4.2.1 Revenue categories
Taxes and charges were divided into five categories: 1 Vehicle acquisition taxes. They constitute a certain share of the vehicle sales
price and are thus invariant to the number of vehicle kilometres travelled. 2 Vehicle registration, circulation or ownership tax: This is usually a fixed
amount to be paid each year by the vehicle holder and is also fixed with respect to the distance travelled.
3 Insurance tax: This is usually a fixed amount on an insurance premium. 4 Fuel tax is a classical, variable tax collected by levying a fixed surcharge on
each litre of petrol or diesel. 5 Vignettes are annually paid road user charges and thus are also considered
to be fixed. They vary by road class and vehicle type. Where different payment periods are possible, annual vignette charges were selected.
6 Tolls constitute variable fees which depend on road class and vehicle type. In contrast to (vignette) charges, they are levied on the basis of the distance driven.
Information on current taxes and charges is required in order to make sound statements on the degree of internalisation of infrastructure and external costs. By definition, taxes are a means to fund the general state budget (principle: all revenues cover all state expenses). The specific contribution of road users to cover road infrastructure costs thus only equals that part of road user revenues directly devoted (earmarked) to funding road infrastructure costs by law. The degree of earmarking varies considerably by revenue category and country. The budget of the current study did not allow the - partly very complex - legal arrangements in each of the 29 countries considered to be checked. Thus, following Infras/IWW, 2004b, constant shares of earmarking were considered across all 29 countries. The assumptions made are presented in Table 23.

4.288.1/Road infrastructure cost and revenue in Europe – IMPACT D2 April 2008 58
Table 23 Assumptions on variability and earmarking by revenue category
Tax/charge Unit Variability Degree of earmarking Tax on acquisition €/veh. Fixed 50%Circulation tax €/veh.,a Fixed 50%Insurance tax €/veh.,a Fixed 100%Fuel excise duty €/l Variable 50%Vignettes €/veh.,a Fixed 100%Kilometre tolls €/km Variable 100%
The term ‘fixed’ with respect to pricing revenues refers to short-term changes in traffic volumes. In this sense, only revenues from fuel taxes and distance or trip based road user charges react directly to demand fluctuations. Depending on their structure, these forms of pricing are, in principle, appropriate for internalising marginal social external costs. In contrast, annual charges (vignettes, vehicle taxes, insurance premiums, etc.) can only react in the medium to long term and are thus less suitable for external cost internalisation. For the compilation of taxes and charges, the same categories of vehicle, road types and countries were applied as for the estimation of infrastructure costs. For reasons of transparency, total revenues do not distinguish between earmarked and non-earmarked shares. Cost coverage ratios, however, are presented for total and earmarked revenues. For calculating internalisation charges, it is recommended to take the earmarked share of user revenues into account.
4.2.2 Data sources
Purchase, acquisition, insurance and fuel tax rates were taken from ACEA, 2006 and crosschecked with information provided by DG TAXUD’s Excise Duty Tables (EC, 2007b). Purchase prices, cylinder capacities, horse powers, etc. per vehicle were retrieved from Internet surveys. Road user charges for passenger cars in the EU were also taken from Internet sources (KFZ-Auskunft, 2007). HGV charges were available from BGL, 2007. The most recent data were taken wherever possible. This was 2005 for tax information, but historical records were not available for some taxes and charges for specific countries for this year. 2006/2007 data were then derived from the above mentioned sources. Insofar there is a small discrepancy between infrastructure cost estimates and information on the respective charges.
4.3 Average road transport-related revenues for Europe
Answering the question on the extent to which current infrastructure costs are external calls for information on current user payments. Here, the consideration of average costs is sufficient. As the vehicle classes used in this study are indicative and the resulting total cost extrapolation might differ from official national statistical values, the presentation of total tax and charge revenues is omitted here. The annex to this report, however, does provide respective indicative information.
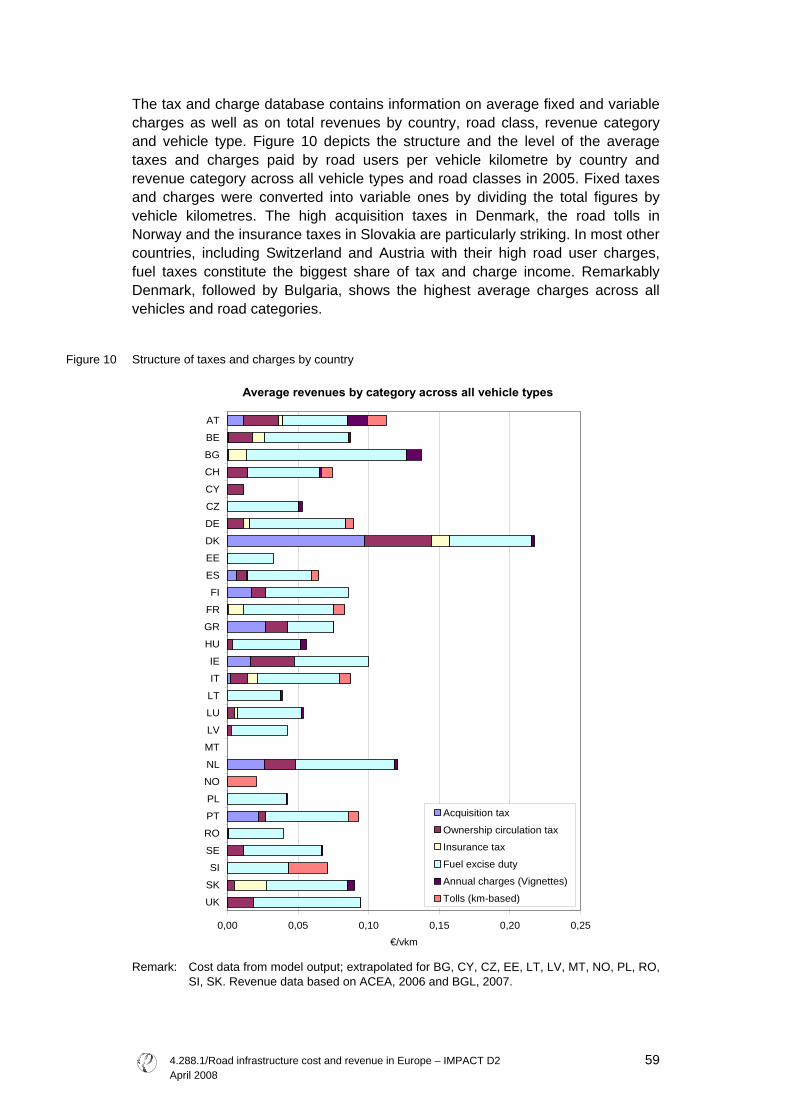
4.288.1/Road infrastructure cost and revenue in Europe – IMPACT D2 April 2008
59
The tax and charge database contains information on average fixed and variable charges as well as on total revenues by country, road class, revenue category and vehicle type. Figure 10 depicts the structure and the level of the average taxes and charges paid by road users per vehicle kilometre by country and revenue category across all vehicle types and road classes in 2005. Fixed taxes and charges were converted into variable ones by dividing the total figures by vehicle kilometres. The high acquisition taxes in Denmark, the road tolls in Norway and the insurance taxes in Slovakia are particularly striking. In most other countries, including Switzerland and Austria with their high road user charges, fuel taxes constitute the biggest share of tax and charge income. Remarkably Denmark, followed by Bulgaria, shows the highest average charges across all vehicles and road categories.
Figure 10 Structure of taxes and charges by country
Average revenues by category across all vehicle types
0,00 0,05 0,10 0,15 0,20 0,25
AT
BE
BG
CH
CY
CZ
DE
DK
EE
ES
FI
FR
GR
HU
IE
IT
LT
LU
LV
MT
NL
NO
PL
PT
RO
SE
SI
SK
UK
€/vkm
Acquisition tax
Ownership circulation tax
Insurance tax
Fuel excise duty
Annual charges (Vignettes)
Tolls (km-based)
Remark: Cost data from model output; extrapolated for BG, CY, CZ, EE, LT, LV, MT, NO, PL, RO,
SI, SK. Revenue data based on ACEA, 2006 and BGL, 2007.
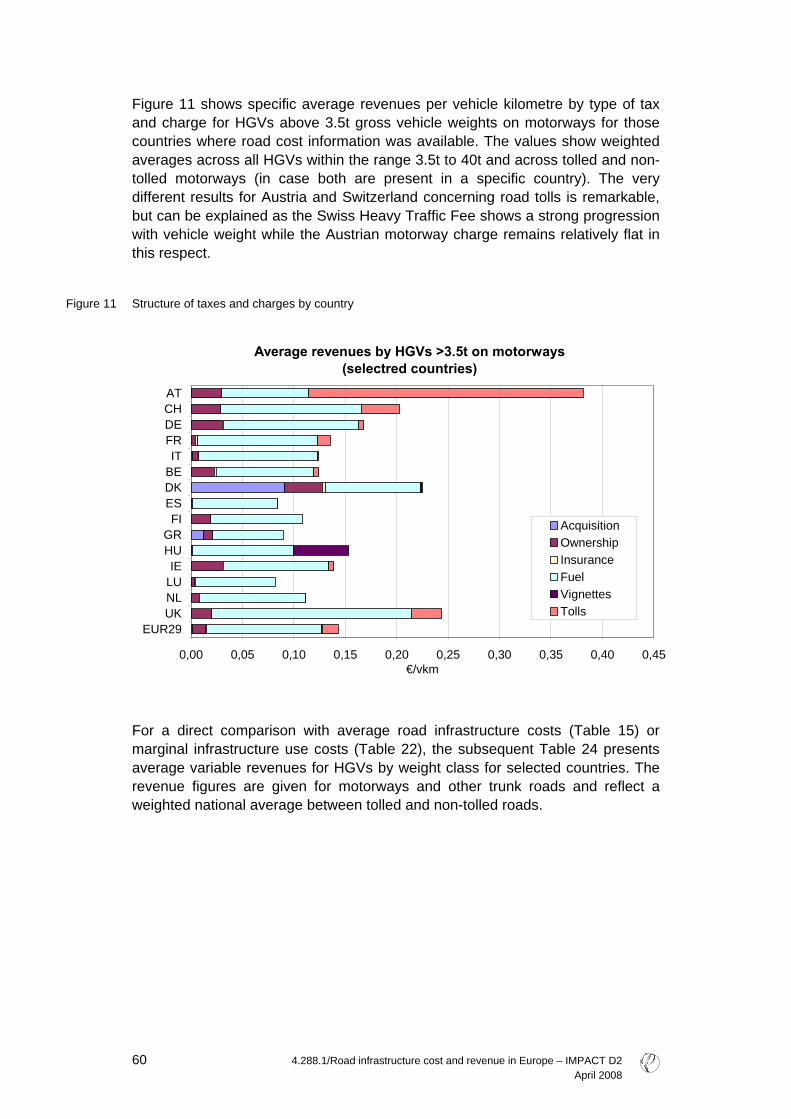
4.288.1/Road infrastructure cost and revenue in Europe – IMPACT D2 April 2008 60
Figure 11 shows specific average revenues per vehicle kilometre by type of tax and charge for HGVs above 3.5t gross vehicle weights on motorways for those countries where road cost information was available. The values show weighted averages across all HGVs within the range 3.5t to 40t and across tolled and non-tolled motorways (in case both are present in a specific country). The very different results for Austria and Switzerland concerning road tolls is remarkable, but can be explained as the Swiss Heavy Traffic Fee shows a strong progression with vehicle weight while the Austrian motorway charge remains relatively flat in this respect.
Figure 11 Structure of taxes and charges by country
Average revenues by HGVs >3.5t on motorways
(selectred countries)
0,00 0,05 0,10 0,15 0,20 0,25 0,30 0,35 0,40 0,45
ATCHDEFRIT
BEDKESFI
GRHUIE
LUNLUK
EUR29
€/vkm
AcquisitionOwnershipInsuranceFuelVignettesTolls
For a direct comparison with average road infrastructure costs (Table 15) or marginal infrastructure use costs (Table 22), the subsequent Table 24 presents average variable revenues for HGVs by weight class for selected countries. The revenue figures are given for motorways and other trunk roads and reflect a weighted national average between tolled and non-tolled roads.

4.288.1/Road infrastructure cost and revenue in Europe – IMPACT D2 April 2008
61
Table 24 Variable taxes and charges of HGVs on motorways in selected countries 2005
Country Motorways Other trunk roads 5.5t 12t 24t 40t 5.5t 12t 24t 40t €-ct/vkm €-ct/vkm Countries with detailed accounts by road class AT 21.26 28.51 40.45 41.96 6.04 7.25 8.46 9.97CH 16.84 27.17 44.60 67.68 11.24 13.69 14.94 17.38DE 17.41 23.29 26.17 28.52 9.41 11.29 13.17 15.52FR 21.49 23.16 29.21 31.30 8.34 10.01 11.67 13.76IT 12.73 16.56 21.99 24.05 8.26 9.91 11.56 13.63SE 7.74 9.29 10.83 12.77 7.74 9.29 10.83 12.77 Countries with single accounts for all road classes only BE 7.91 9.27 10.63 12.33 6.80 8.16 9.52 11.22DK 8.10 10.85 13.84 15.50 6.65 7.98 9.31 10.97ES 7.30 8.48 9.98 11.45 7.05 8.23 9.70FI 6.39 7.67 8.94 10.54 6.39 7.67 8.94 10.54GR 5.40 6.38 7.49 8.72 4.90 5.88 6.86 8.09HU 7.04 8.44 9.85 11.61 7.04 8.44 9.85 11.61IE 7.46 8.93 10.43 12.27 7.36 8.83 10.30 12.14LU 5.58 6.70 7.81 9.21 5.58 6.70 7.81 9.21NL 7.41 8.93 10.56 12.41 7.40 8.88 10.36 12.21UK 14.14 16.91 19.69 23.15 13.86 16.63 19.40 22.87EUR-29 7.91 9.27 10.63 12.33 6.80 8.16 9.52 11.22
Source: Own compilation.
4.4 Revenue to cost ratios
The analysis of revenues to costs adheres to the three perspectives of cost coverage introduced in section 4.1: 1 Net transport sector contribution to the total state budget = total (non-
earmarked and earmarked fixed and variable) revenues to total (fixed and variable) costs.
2 User pays principle: Total (variable and fixed) earmarked revenues to total costs.
3 Efficiency: variable (earmarked and non-earmarked) revenues to variable costs.
The revenue to cost ratios presented in this section are limited to those countries with detailed, i.e. comprehensive road-class specific infrastructure cost accounting information (Germany, Austria, Switzerland, France, Italy and Sweden) plus those countries with general accounting information for the road network in total. Figure 12 presents the three indicators for heavy goods vehicles (weighted by size classes) on motorways.

4.288.1/Road infrastructure cost and revenue in Europe – IMPACT D2 April 2008 62
Figure 12 Cost coverage of total and fixed costs, all vehicles and network categories
Revenue to cost ratios for HGVs on motorways
0%
50%
100%
150%
200%
250%
300%
350%
AT CH DE FR IT SE BE DK ES FI GR HU IE LU NL UK
Detailed infrastructure costinformation
General infrastructure cost information AVERAGEEUR-29
Sector balance: total revenues toaverage costsUser pays principle: total earmarkedrevenues to average costsEfficiency: variable revenues to marginalcosts
Remark: Based on cost data from model output (extrapolated for BG, CY, CZ, EE, LT, LV, MT, NO, PL, RO, SI, SK) and revenue data based on ACEA, 2006 and BGL, 2007).
The values in Figure 12 lead to the following conclusions: 1 For those countries with excellent cost accounting data (Austria, Germany,
Switzerland, France, Italy and Sweden), the three revenue to cost ratios appear rather high, all are close to or above the level of the EU-29 average apart from Switzerland and Sweden.
2 The high cost coverage ratios involving fixed infrastructure costs for Denmark and Hungary are explained by the high Danish vehicle acquisition tax and the costly vignette system on parts of the Hungarian motorway system.
3 The very low values for the Scandinavian countries (Sweden and Finland) and Switzerland are due to very low traffic volumes compared to the network length. High average infrastructure use costs are combined here with low tax revenues.
4 In contrast, the low cost coverage rates for Luxembourg are due to the extremely low fuel tax and the absence of road user charges.
These observations show that revenue to cost ratios are determined by three equally important factors: (1) the level of road construction and maintenance costs, (2) traffic density on the network and (3) taxation and charging policy. For the three objectives, we can conclude for HGV traffic on motorways: 1 Total transport related taxes (excluding VAT) range around 100% of total
infrastructure costs (EUR-29 average: 97%). Thus, from the state perspective, motorway infrastructure costs attributed to HGVs are not subsidised. But this also implies that, across Europe, the transport sector does not contribute to public budgets in the same way as is expected of other commercial or industrial sectors. Moreover, the balance does not consider external cost elements, which would lead to a considerable subsidisation of road haulage on motorways in the European average.

4.288.1/Road infrastructure cost and revenue in Europe – IMPACT D2 April 2008
63
2 A different picture emerges when referring to the user pays principle, which takes into account the contribution made to financing public services by the transport user in his function as a common tax payer. When subtracting 50% of fuel and vehicle purchase and circulation taxes, cost coverage rates drop by some 40% (earmarked revenue to total cost rate across EUR-29 countries: 59%). From the user perspective, haulage on motorways is thus heavily subsidised, even when excluding external costs.
3 For pricing purposes, the efficiency perspective, which compares variable taxes and charges with marginal infrastructure use costs, is most interesting. In line with expectations, those countries with distance-based motorway tolls in operation show the highest revenue to cost ratios. One exception is Switzerland, which shows only 89% coverage even though heavy lorries there are subject to the highest charges in Europe.
With regard to efficiency issues, the development of charges to costs is more important than the level of average charges to average costs. Figure 13 presents the variable revenue to variable infrastructure cost ratios for the four HGV types and the six countries with reliable infrastructure cost information. The smaller the differences in revenue to cost ratios between the vehicle classes, the more efficient the structure of charges is with respect to road provision, maintenance and operation costs.
Figure 13 Revenue to infrastructure cost ratios by HGV weight class on motorways for selected countries
Variable revenues to variable costs for HGVs on motorways 2005
0%
500%
1000%
1500%
2000%
2500%
3000%
3500%
4000%
4500%
5000%
AT CH DE FR IT SE
HGV 3.5-7.5 t
HGV 7.5-18t
HGV 18-32t
HGV >32t
All HGV >5.5t

4.288.1/Road infrastructure cost and revenue in Europe – IMPACT D2 April 2008 64
The graph gives rise to the following conclusions: 1 In all national schemes, lighter HGVs are overpriced with respect to heavy
truck and trailer combinations (40t). This indicates that in none of the charging systems do tariffs rise sufficiently with vehicle weight to reflect the damages and construction requirements caused by high axle weights.
2 Remarkably, lorries or combinations with a gross weight between 18t and 32t show lower revenue to cost ratios than the next smaller class. The explanation for this phenomenon is the slope of the fuel consumption function with respect to vehicle weight.
3 The lowest distortion, and thus the highest degree of efficiency, of road user charges is observed for Switzerland. Here charges vary directly with the weight of the vehicle.
4 The highest distortion of efficiency principles can be observed for those countries with no or flat tolling systems with respect to vehicle weight (Italy, France and Sweden).
In terms of the efficient use of motorway infrastructures by heavy trucks it can thus be concluded that (1) the level of variable revenues is sufficient to internalise infrastructure costs, but that (2) a (further) spread of charges according to vehicle weight classes should be fostered on European motorway (or TEN-T) networks. Table 25 presents the coverage of total road infrastructure costs across Europe by vehicle types and network categories. Here it becomes very clear that the infrastructure cost coverage of passenger cars is - due to their much lower causation of and responsibility for infrastructure costs - more favourable than that of HGVs. In particular, the coverage of the variable road infrastructure costs of heavy trucks is much lower than that of lighter vehicles. Motorways have the best figures of the different road classes, which is not surprising due to the frequency of charging tolls and vignettes on that road class.
Table 25 Coverage of total infrastructure costs by road and vehicle class
Cost/revenue basis
Total revenues by total infrastructure costs
Earmarked revenues by total infrastructure costs
Variable revenues by variable infrastructure
costs Road class Motorways All roads Motorways All roads Motorways All roads Small car 2.68 1.64 1.55 0.92 28.20 22.17Big car 3.38 2.17 1.88 1.16 39.69 32.50Motor cycle 5.32 1.91 3.56 1.12 18.84 7.21Bus/Coach 1.31 0.53 0.80 0.28 1.67 0.59LDV/Van 2.24 0.94 1.51 0.51 38.98 21.81HGV5.5t 3.18 1.59 2.20 0.94 55.32 31.38HGV12t 2.74 1.23 1.95 0.74 15.65 5.63HGV24t 1.70 0.67 1.20 0.40 3.14 1.01HGV40t 1.36 0.54 0.94 0.32 2.27 0.75
Remark: Based on cost data from model output; extrapolated for BG, CY, CZ, EE, LT, LV, MT, NO, PL, RO, SI, SK and revenue data based on ACEA, 2006 and BGL, 2007.

4.288.1/Road infrastructure cost and revenue in Europe – IMPACT D2 April 2008
65
The values in the table lead to the conclusions: 1 Passenger cars and light duty vehicles contribute more to covering total as
well as variable costs than heavy traffic across all road classes. For motorways this is remarkable since some countries only charge heavy vehicles. Consequently it can be concluded that further promoting HGV charging schemes is favourable for equity reasons.
2 Motorway traffic covers its costs to a higher degree than the network as a whole. This leads to the suggestion to extend charging systems to the entire network. The Swiss toll system could serve as a reference here.

4.288.1/Road infrastructure cost and revenue in Europe – IMPACT D2 April 2008 66

4.288.1/Road infrastructure cost and revenue in Europe – IMPACT D2 April 2008
67
5 Core findings and conclusions
5.1 Full cost accounting methods
Estimating the economic costs of transport infrastructure including depreciation, interest on capital and running costs can either be done using the Perpetual Inventory Method (PIM) or the Synthetic Method. The PIM emerges from the tradition of keeping national accounts by depreciating expenses (by activity or type of asset) over time and adding interest costs to the calculated remaining net capital stock. The Synthetic Method, in contrast, compiles and values an inventory of currently existing assets using their actual replacement values by taking into account age, physical condition and past and projected traffic loads. Current applications of both methods apply stochastic, i.e. statistically distributed depreciation functions and value assets by their replacement value. Where both methods have been applied to the same networks for Germany, Austria and Sweden, the results show no clear differences at the level of asset value or capital costs. The driving factor seems to be whether maintenance and replacement activities are carried out according to the depreciation assumptions in the model or whether delayed activities cause an investment backlog. In the first case, the PIM should lead to higher results while, in the second case, the Synthetic Method should do so. Each of the accounting philosophies has strengths and weaknesses. After a thorough check of their pros and cons we recommend the Synthetic Method for infrastructure accounting purposes if there is no tradition of calculating infrastructure costs using the PIM approach for several reasons. (1) The UNITE case studies have shown that the retrieval of detailed historical data from public accounts is difficult or even impossible. (2) The Synthetic Method better reflects the current state and the desired quality standard of a traffic network. (3) A direct application within traffic models and the assessment of investment and maintenance scenarios is easier to do with the Synthetic Method. (4) The relation of costs to real physical objects allows variable infrastructure costs to be differentiated by location and thus approaches the objective of marginal social cost pricing within the accounting framework.
5.2 Cost allocation procedures
There are three main cost allocation principles from which others have been derived: the equivalency factor method, the econometric approach and the game theory approach. The equivalency factor method is the most commonly applied, easy to implement, transparent and can consider specific engineering knowledge. Possible weights for allocating costs among defined vehicle classes may be simple vehicle kilometres, PCE or ESAL weighted vehicle kilometres, or binary variables for each vehicle group.
4.288.1/Road infrastructure cost and revenue in Europe – IMPACT D2 April 2008 68
The econometric method is only applied in the Austrian road accounts. It derives cost responsibilities by regressions of maintenance and investment expenses for a sample of road sections considering the traffic volume and traffic mix for each section. This method suffers from considerable co-linearities between regression variables such that the results appear less reliable. The game theory approach was partly applied in the US Highway Cost Allocation Studies, but has never been fully applied to a real transport network. It allocates costs by total costs occurring with different traffic compositions (Shapley value) based on detailed engineering inputs on road planning and cost progression. It requires considerable computing power and the allocation results cannot be easily verified. We thus recommend the equivalency factor method using statistically proven results for cost drivers to the greatest extent possible and a sufficiently detailed system of asset types and characteristics.
5.3 Total road infrastructure cost results for Europe
Total costs were derived by analysing the results of recent studies. The most important studies were the UNITE country accounts and the national studies for Germany, Switzerland, Austria and the Netherlands. Unit costs per road kilometre by road class were derived from these sources including depreciation, interest on capital and running costs. Depending on data availability, the 29 European countries were classified into three groups: Six countries with road cost accounts by road class (Germany, Switzerland, Austria, France, Italy and Sweden), ten countries with total network accounts (Belgium, Denmark, Spain, Finland, Greece, Hungary, Ireland, Luxembourg, Netherlands and the UK) and the remaining thirteen countries with only partial (Portugal) or no accounting information. For setting infrastructure cost related prices, however, road class specific accounts are essential. The analysis of the country accounts of unit costs per road kilometre revealed similarities in the cost levels and cost structures between the big Western European countries. For these parts of the EU, the cost database created in this study should be reasonable, but of course cannot replace specific country accounts. For these countries, we obtained values between € 600,000 (Austria, Germany, Italy, Spain) and € 800,000 (France) per motorway kilometre. Less reliable are the results presented for other road types and for the new Member States. The main findings of the country comparison of unit costs per road kilometre were that the unit costs for motorways are roughly ten times higher than those for trunk or urban roads. Only motorways showed some, but very limited, co-linearity with the price index for construction services across countries. For those countries with no accounting information, the German values were adopted using purchasing power parities (PPP) for construction services.
4.288.1/Road infrastructure cost and revenue in Europe – IMPACT D2 April 2008
69
Regional results for Austria and Switzerland reveal that the running costs of the road network are 20% to 50% higher in mountainous areas than in relatively flat regions. Results for capital costs are not available, but it stands to reason that the need for more bridge and tunnel constructions in mountainous areas will push up construction costs considerably. The data sources are insufficient, in particular for infrastructure costs. To improve the knowledge on the resources consumed in road transport it would be necessary to start a European initiative to develop a unique road cost accounting tool and to fill this with real data. UNITE provides a good starting point but needs to be improved in terms of data availability.
5.4 Average costs by vehicle category
Average costs are derived through dividing total costs by the traffic volume (in vehicle kilometres). The level of average costs is thus not only driven by construction prices, running costs and accounting methodologies, but to a large extent by traffic density. Accordingly, the remote countries (Sweden, Finland, Ireland) show much higher values than the central transit countries. Average costs were derived separately for each of the nine vehicle types. For HGVs on motorways they were found to vary considerably with vehicle weight from 4 €-ct/vkm for a 5.5t lorry to 19 €-ct/t for a 40t truck and trailer combination.
5.5 Marginal costs of infrastructure use
The GRACE case studies indicate that variable average costs may be a good proxy for the marginal costs of infrastructure use. For motorways in the six countries with detailed accounting data, the share of variable costs across all vehicle categories is 22%. For all other countries and road classes, the share of variable (= marginal) infrastructure use is 26%. Pure marginal infrastructure cost pricing would thus result in a deficit of 74% to 78% of total infrastructure costs if no other cost components are considered. These additional cost categories could be congestion costs. For the six countries with detailed accounting information, the marginal costs for light lorries (3.5t to 7.5t) range between 0.20 €ct/vkm (France and Italy) and 51 €ct/vkm (Switzerland). For HGVs above 32t, the range is from 5.57 €ct/vkm for Austria to 52 €/100 vkm for Sweden. These extreme ranges make it questionable whether the proxy of average variable costs for marginal infrastructure use remains valid under such different traffic densities. Marginal costs appear to be much higher on secondary roads than on motorways in countries with dense motorway traffic. The ratio between trunk roads and motorways is found to be above six for Italy and 0.7 for Sweden. In the EUR-29, the average marginal costs on trunk roads are roughly double the costs on motorways for 40t HGVs.
4.288.1/Road infrastructure cost and revenue in Europe – IMPACT D2 April 2008 70
The GRACE project has made an important step forward in quantifying driving factors for marginal cost levels. But the presentation of its results makes it difficult to transfer the elasticities to real costs per kilometre across all countries. Further research is also needed here on the generalisation of cost figures.
5.6 Revenue to cost ratios
The study reviewed several sources on national tax schemes to estimate total and average taxes. For the infrastructure costs, taxes and charges were classified into fixed (vehicle purchase and registration taxes, insurance taxes, vignettes) and variable taxes (fuel tax and road tolls). Taxes were further classified into earmarked taxes, which are allocated for use in the transport sector, and non-earmarked taxes. Three indicators were defined for the comparison of revenues to taxes. Total transport related taxes (excluding VAT) range around 100% of total infrastructure costs. Thus, from the state perspective, motorway infrastructure costs attributed to HGVs are not subsidised. But this also implies that, across Europe, the transport sector does not contribute to financing public budgets in the same way as is expected of other commercial or industrial sectors. A different picture emerges when referring to the user pays principle, which takes into account the contribution made to financing public services by the transport user in his function as a common tax payer. Taking earmarked taxes only, cost coverage rates drop by some 40%. From the user perspective, haulage on motorways is thus heavily subsidised, even when excluding external costs. For pricing purposes, the efficiency perspective, which compares variable taxes and charges with marginal infrastructure use costs, is most interesting. In line with expectations, those countries with distance based motorway tolls in operation show the highest revenue to cost ratios. Even more important in this context is the variable revenue to variable cost comparison by vehicle type. For HGVs on motorways it is found that light trucks are heavily overpriced, distortions are the lowest for those countries with motorway toll systems, and among those, Switzerland shows the highest degree of efficiency as charges here vary directly with vehicle weight.
5.7 The policy perspective
One of the most important observations from the work carried out for this study is that the data needed to roughly estimate average infrastructure costs in compliance with Directive 2006/38/EC is not readily available across the EU. The thorough computation of average cost based charge levels involves either the recording of long time series of investment and running expenditures (PIM approach) or the provision of a full and detailed inventory of assets, quality and age records and reinvestment costs for the entire road network (Synthetic Method). In particular the PIM approach is expensive and can only be done by extensive country studies.

4.288.1/Road infrastructure cost and revenue in Europe – IMPACT D2 April 2008
71
Marginal infrastructure cost pricing excluding congestion results in considerable deficits for the infrastructure manager. The pricing of average costs, systems of mark-ups on marginal costs (Ramsey pricing, multi part tariffs, etc.) or a system of marginal infrastructure costs plus congestion costs would ensure full cost coverage. Of these to some extent complex and costly options, a system of differentiated average costs will probably cause the lowest implementation costs while guaranteeing financial stability. Due to their very different rationale and objectives, it is not recommended to use revenues for system external costs (accidents, air pollution, noise or climate change) to cover deficits in infrastructure financing. Deliverable 1 of the IMPACT study states that each cost category requires its own specific internalisation measure in order to provide a clear incentive to the transport user. Also for fiscal clarity, transparency and acceptability, transport sector internal and external costs should be strictly separated in terms of internalisation and revenue use.
5.8 Need for further research
There were limited resources for developing the road infrastructure cost and revenue database within the IMPACT study. For this reason, a number of items on the research agenda remained unresolved. These include: 1 Infrastructure cost levels for secondary roads and the new Member States.
More country specific studies with local partners should be carried out to provide access to national data. Using the Synthetic Method to do so would help to avoid the considerable data problems faced by the UNITE country accounts.
2 Cost driving factors: Within the framework of this study, the attempt was made to obtain more information on the dependency of infrastructure costs on geographical, geological or meteorological conditions. More information is needed, in particular, practitioners' experience beyond statistical averages. It is proposed to analyse national investment programmes by looking at project design, projected or real costs and the geographical location of the projects.
3 Marginal infrastructure costs: Here more case studies in the style of those carried out within the GRACE project would be needed. But care should be taken concerning a unified design and reporting framework in order to ensure their comparability despite their different environments.
4 Congestion costs: Investigations into the state of European infrastructure and the level of congestion costs and revenues could enhance the discussion on covering SMC driven financing deficits in the infrastructure sector with congestion toll revenues.

4.288.1/Road infrastructure cost and revenue in Europe – IMPACT D2 April 2008 72
4.288.1/Road infrastructure cost and revenue in Europe – IMPACT D2 April 2008
73
References
ACEA, 2006 Association of European Car Manufacturers European Tax Guide 2006 Brussels : ACEA, 2006 ASECAP, 2007 Association Européenne des Concessionnaires d’Autoroutes et d’Ouvrages à Péages Statistical Bulletin 2006 Paris : ASECAP, 2007 ASFINAG 2007 Autobahnen und Schnellstraßen-Finanzierungs-Aktiengesellschaft (ASFINAG) Gut unterwegs - Geschäftsbericht des ASFINAG Konzerns 2006 Motorways and Express Roads Financing Society (ASFINAG), Vienna, 2006 BFS 2003 Schweizerische Strassenrechnung «Revision 2000», Schlussbericht, Version 2 Swiss Federal Offfice for Statistics (BFS) BFS 2007 Bundesamt für Statistik (BFS) Strassenrechnung der Schweiz – Provisorische Resultate 2005. Swiss Federal Office for Statistics, Section 11: Transport and Telecommunications. Neuchatêl, April 2007 BGL, 2007 Bundesverband Güterkraftverkehr, Entsorgung und Logistik e. V. Kosteninformations-System (KIS) Regularly updated folder of leaflets Frankfurt : BGL, 2007 BMVBS 2006 Bundesministerium für Verkehr, Bau und Stadtentwicklung (BMVBS) Straßenbaubericht 2006 Berlin : Federal Ministry for Transport, Construction and Urban Development, 2006 CAFÉ, 2005 AEA Technology: Damages per tonne of PM21.5, NH3, SO2, NOx and VOCs of EU25 Member State (excluding Cyprus) and surrounding seas March 2005

4.288.1/Road infrastructure cost and revenue in Europe – IMPACT D2 April 2008 74
CAPRI, 2001 Nash, C., T. Sansom, B. Matthews Concerted Action on Transport Pricing Research Integration (CAPRI), Final report for publication Brussels : European Commission, 2001 CAPRI, 1999 K. Rennings, A. Ricci, C. Sessa Concerted Action on Transport Pricing Research Integration (CAPRI), Deliverable D3 Valuation of transport externalities Brussels : European Commission, 1999 CE, 2002 Return on roads; Optimising road investments and use with the ‘user pays principle’ CE Delft/4Cast/Free University of Amsterdam, 2002 CE, 2003 External and Infrastructure Costs of Road and Rail Traffic – analysing European studies Delft : CE Delft; Rotterdam: ECORYS, July 2004 CE, 2004a Marginal Costs of Infrastructure use Delft : CE Delft, 2003 CE, 2004b J.P.L. (Joost) Vermeulen, B.H. (Bart) Boon, H.P. (Huib) van Essen, L.C. (Eelco) den Boer, J.M.W. (Jos) Dings, F.R. (Frank) Bruinsma, M.J. (Mark) Koetse The Price of Transport Delft : CE Delft; Amsterdam: Free University of Amsterdam, December 2004 COMPETE, 2006 W. Schade, C. Doll, M. Maibach, et al. Analysis of the contribution of transport policies to the competitiveness of the EU economy and comparison with the United States (COMPETE). Study carried out for the European Commission. Project co-ordinator: Fraunhofer-ISI Karlsruhe : 2006 Doll, 2005 Allokation gemeinsamer Kosten der Straßeninfrastruktur. Anwendbarkeit der Konzepte kooperativer Spiele in der Wegekostenrechnung. Dissertation, University of Karlsruhe (TH) Nomos Versagsgesellschaft, Baden-Baden, July 2005

4.288.1/Road infrastructure cost and revenue in Europe – IMPACT D2 April 2008
75
EC, 2006 European Commission, Directorate General for Energy and Transport Energy and Transport in Figures 2006 Brussels : European Commission in co-operation with Eurostat, 2006 EC, 2007 Actions - Benefits and Cost of Climate Change Policies and Measures, ENV.C.2/2004/0088. http://europa.eu.int/comm/environment/climat/pdf/final_report2.pdf EC, 2007b Excise Duty Tables. Part II: Energy Products and Electricity. European Commission, Directorate General Taxation and Customs Union Tax Policy. Ref. 1.024, rev. 2, January 2007 ECMT, 1998 European Conference of Ministers of Transport, Efficient transport in Europe, Policies for internalisation of external costs Paris : ECMT, 1998 ECMT, 1998 European Conference of Ministers of Transport, User charges for railway infrastructure, Round table 107 Paris: OECD, 1998 ECORYS, CE Delft, 2005 Infrastructure Expenditures and Costs Practical Guidelines to Calculate Infrastructure Costs for Five Modes of Transport. Final Report. Client: European Commission – DG TREN Rotterdam: ECORYS Transport; Delft: CE Delft (NL), Rotterdam, 30. November 2008 Eurostat 2007 Carlos Diaz-Muriel Comparative Price Levels for Construction in 33 European Countries for 2005. Statistics in focus, Economy and Finance 108/2007 European Commission : 2007 Eurostat, 2008 Eurostat homepage http://epp.eurostat.ec.europa.eu/portal/page?_pageid=1090,30070682,1090_33076576&_dad=portal&_schema=PORTAL Brussels : Eurostat, April 2007

4.288.1/Road infrastructure cost and revenue in Europe – IMPACT D2 April 2008 76
ExternE, 2004 New Elements for the Assessment of External Costs from Energy Technologies (NewExt).’ Final Report to the European Commission, DG Research, Technological Development and Demonstration (RTD), http://www.ier.uni-stuttgart.de/public/de/organisation/abt/tfu/projekte/newext/ newext_final.pdf. ExternE, 2005 P. Bickel, R. Friedrich Externalities of Energy, Methodology 2005 update Luxembourg : European Commission, 2005 FHWA, 1997 Federal Highway Administration Federal Highway Cost Allocation Study 1997. Report to the US Congress. Washington DC, 1997 GRACE 2006 ECOPLAN Environmental Costs in Sensitive Areas. GRACE (Generalisation of research on accounts and cost estimation), Task 1.7, Background Report. Project commissioned by the European Commission. Berne, August 2006 GRACE, 2007 (Generalisation of research on accounts and cost estimation). Ongoing. Project coordinator: ITS Leeds : Grace, 2007 HEATCO, 2005 P. Bickel Developing Harmonised European Approaches for Transport Costing and Project Assessment, Deliverable 2: State-of-the-art in project assessment, EU-funded project (contract no. FP6-2002-SSP-1/502481) Germany : HEATCO, 2005 HEATCO, 2006 P. Bickel Developing Harmonised European Approaches for Transport Costing and Project Assessment, Deliverable 5: Proposal for Harmonised Guidelines, EU-funded project (contract no. FP6-2002-SSP-1/502481 Germany : HEATCO, 2006

4.288.1/Road infrastructure cost and revenue in Europe – IMPACT D2 April 2008
77
Herry et al. 2002 Herry, M., Rothengatter, W., Sedlacek, N., Doll, C., Visser, H., Quispel, M., Snizek, S. and Klausegger, P.: 2002. Tarifrechnung fahrleistungsabhängige Maut Österreich. Report to the Autobahnen- und Schnellstraßen-Finanzierungs-AG (ASFINAG) Vienna/Karlsruhe/Rijswijk, 2002 High Level Group, 1999 Calculating transport environmental costs, final report of the expert advisors to the High Level Group on infrastructure charging (working group 2), 1999 INFRAS/IWW, 2004a External costs of transport - update study, INFRAS/IWW on behalf of the International Union of Railways (UIC) Zurich/Karlsruhe: INFRAS/IWW, 2004 Infras/IWW, 2004b Infras, Zurch, IWW, University of Karlsruhe FACORA – Facts on Competition in the European Transport Sector Final Report to the International Union of Railways (UIC, Paris) Zurich/Karlsruhe : INFRAS/IWW, 2004 ITS, 2001 T. Sansom Surface Transport Cost and Charges, Great Britain 1998, Final Report for the Department for the Environment, Transport and the Regions Leeds : ITS University of Leeds, 2001 Kennisinstituut voor Mobiliteitsbeleid J.A. Annema, E. Bakker, R. Haaijer Stimuleren van verkoop van zuinige auto’s; De effecten van drie prijsmaatregelen op de CO2-uitstoot van personenauto’s (Stimulating the sale of fuel efficiënt cars; Impacts of three pricing measures on the CO2 emissions of passenger cars) Den Haag : KiM, 2001 KFZ-Auskunft, 2007 Motor Vehicle Advisors, Internet Homepage http://www.kfz-auskunft.de/info/autobahngebuehr.html#Autobahngebuehr_Frankreich Accessed : April 2007 Lakshmanan, 2001 Lakshmanan, T.R. and P. Nijkamp, P. Rietveld, E.T. Verhoef Benefits and costs of transport; Classification, methodologies and policies, Papers Reg. Sci. 80, 139-164, 2001
4.288.1/Road infrastructure cost and revenue in Europe – IMPACT D2 April 2008 78
Lindberg, 2006 Marginal cost case studies for road and rail transport - Deliverable D3, Lindberg, G. (VTI) with contribution from partners, GRACE (Generalisation of Research on Accounts and Cost Estimation), funded by sixth Framework Programme Leeds : ITS, University of Leeds, 2006 Link et al., 2002 Heike Link, Louise Helen Stewart (DIW), Claus Doll (IWW), Peter Bickel, Stephan Schmid, Rainer Friedrich (IER), Stefan Suter, Heini Sommer, Michael Marti (Ecoplan), Markus Maibach, Christoph Schreyer, Martin Peter (INFRAS) UNITE (UNIfication of accounts and marginal costs for Transport Efficiency) Deliverable 5: Pilot Accounts – Results for Germany and Switzerland. Working Funded by 5th Framework RTD Programme. Leeds : ITS, University of Leeds, May 2002. Link (2007) Heike Link The Development and Use of Transport Accounts. Presentation at the GRACE final Conference, Brussels, 5.-6. December 2007 Lindsey and Verhoef, 2001 C.R. Lindsey, E.T. Verhoef Traffic congestion and congestion pricing In : D.A. Hensher and K.J. Button (eds.) (2001) Handbook of Transport Systems and Traffic Control, Handbooks in Transport 3 Mantzos and Capros, 2006 L. Mantzos, P. Capros European Energy and Transport Trends to 2030 – update 2005 Final report to the European Commission Brussels : European Commission, May 2006 Mayeres and Proost, 2001 Marginal tax reform, externalities and income distribution, Journal of public economics, 79, 343-363 MC-ICAM, 2004 Marginal Cost pricing in transport; Integrated Conceptual and Applied Model Analysis; 8 deliverables http://www.its.leeds.ac.uk/projects/mcicam/index.html (consulted January 4th, 2007) Methodex Harmonising and sharing of methods and data in environmental and health externalities evaluation; extraction of operational estimates from existing studies (excluding energy and transport). http://www.methodex.org/index.htm

4.288.1/Road infrastructure cost and revenue in Europe – IMPACT D2 April 2008
79
Milne, 2000 Milne, D., E. Niskanen and E.T. Verhoef Operationalisation of marginal cost pricing within urban transport, Project AFFORD, VATT research report no. 63, Helsinki, 2000 NEEDS, 2005a W. Ott, M. Baur, Y. Kaufmann New energy externalities development for sustainability, Deliverable D4.1 - RS 1b: Assessment of Biodiversity Losses Zurich : NEEDS, 2005 NEEDS, 2005b New energy externalities development for sustainability, Deliverable D4.1 - RS Integration Zurich : NEEDS, 2005 NewExt, 2004 Friedrich, R. New Elements for the Assessment of External Costs from Energy Technologies NewExt, Final Report to the European Commission DG Research Stuttgart : NewExt, 2004 NRC, 2002 National Resource Council, Committee on the Effectiveness and Impact of Corporate Average Fuel Economy (CAFE) Standards, 2002 OSD, 2002 Unfallkosten im Strassen- und Schienenverkehr der Schweiz 1998, Ecoplan im Auftrag des Bundesamtes für Raumentwicklung (Office for Spatial Development, OSD) Bern : OSD, 2002 OSD, 2003 Externe Kosten des Verkehrs im Bereich Natur und Landschaft, Econcept und Nateco im Auftrag des Bundesamtes für Raumentwicklung (Office for Spatial Development, OSD) Bern : OSD, 2003 OSD, 2004a Externe Gesundheitskosten durch verkehrsbedingte Luftverschmutzung - Aktualisierung für das Jahr 2000, Ecoplan, INFRAS, ISPM im Auftrag des Bundesamtes für Raumentwicklung (Office for Spatial Development, OSD), des Bundesamtes für Umwelt, Wald und Landschaft, des Bundesamtes für Energie sowie des Bundesamtes für Gesundheit Bern : OSD, 2004

4.288.1/Road infrastructure cost and revenue in Europe – IMPACT D2 April 2008 80
OSD, 2006 Externe Kosten des Strassen- und Schienenverkehrs 2000 – Klima und bisher nicht erfasste Umweltbereiche, städtische Räume sowie vor- und nachgelagerte Prozesse, INFRAS im Auftrag des Bundesamts für Raumentwicklung (Office for Spatial Development, OSD) Bern : OSD, 2006 Paellmann 2000 Regierungskommission Verkehrsinfrastrukturfinanzierung (Pällmann-Kommis-sion). Final Report to the German Government. Berlin, September 2000. Peter, 2003 B. Peter Rail infrastructure charging in the European Union Berlin : TU, 2003 Prognos/IWW, 2002 Prognos AG, Basle, IWW, University of Karlsruhe (TH) Wegekostenrechnung für das Bundesfernstraßennetz unter Berücksichtigung der Einführung einer streckenbezogenen Straßenbenutzungsgebühr für schwere Nutzfahrzeuge. Final report to the Federal Ministry for Transport, Building and Housing. Basle/Karlsruhe, March 2002 ProgTrans/IWW, 2007 Aktualisierung der Wegekostenrechnung für die Bundesfernstraßen in Deutschland. ProgTrans AG (Basle), IWW (University of Karlsruhe). Final report to the German Federal Ministry for Transport, Building and Urban Development (BMVBS). Basle, 2007 Proost, 1999 S. Proost, K. van Dender TRENEN II STRAN - Final Report for Publication, Project funded by the EC, Contract no: ST.96.SC.116 Brussels, 1999 RECORDIT, 2001 S.A. Schmid Real Cost Reduction of Door-to-Door Intermodal Transport, Deliverable 4: External cost calculation for selected corridors IER/University of Stuttgart, November, 2001

4.288.1/Road infrastructure cost and revenue in Europe – IMPACT D2 April 2008
81
REMEDE Resource Equivalency Methods for Assessing Environmental Damage in the EU ongoing 6th Framework project, http://www.envliability.eu/ REVENUE Deliverable 6, 2006, Deliverable 6; Synthesis and policy conclusions, Version 1.2, 30 May 2006 Rothengatter, 2003 How good is first best? Marginal cost and other pricing principles for user charging in transport, Transport policy 10, p121-130 ITS/NERA Sansom, T., Nash, C., Mackie, P., Shires, J. and Watkiss, P. Surface Transportation Costs and Charges. Great Britain 1998. Study commissioned by the Department of the Environment, Transport and the Regions. Leeds : ITS, University of Leeds Stern, 2006 The Economics of Climate Change, The Stern Review, Nicholas Stern, Cabinet Office - HM Treasury, 2006 At : http://www.hmtreaury.gov.uk/independent_reviews/stern_review_economics_ climate_change/sternreview_index.cfm TC, 2005 Franziska Borer-Blindenbacher Study of Methods of Road Capital Cost Estimation and Allocation by Class of User in Austria, Germany and Switzerland. Final Report. Ottawa : Transport Canada, Economic Analysis Directorate, March 2005 TFL, 2006 Transport for London Central London Congestion Charging impact monitoring. Fourth annual report London : TFL, June 2006 TREMOVE 2 KU Leuven: Final Report Part 2: Description of the baseline, 5.12.06 TU Dresden, 2007 http://vplno1.vkw.tu-dresden.de/psycho/projekte/afford/download/AFFORDdel1.pdf (consulted January 4th, 2007) UBA, 2006a Ökonomische Bewertung von Umweltschäden Methodenkonvention zur Schätzung externer Umweltkosten Dessau : Umweltbundesamt, 2006
4.288.1/Road infrastructure cost and revenue in Europe – IMPACT D2 April 2008 82
UBA, 2006b Praktische Anwendung der Methodenkonvention: Möglichkeiten der Berücksichtigung externer Umweltkosten bei Wirtschaftlichkeitsrechnungen von öffentlichen Investitionen, Markus Maibach, Niklas Sieber, Roman Bertenrath, Dieter Ewringmann, Lars Koch, Michael Thöne, Endbericht Zürich/Köln : UBA, 2006 UNITE, 2000 Unification of accounts and marginal costs for transport efficiency, Deliverable 2: The Accounts Approach. Heike Link, Louise H. Stewart (DIW), Markus Maibach (INFRAS), Tom Sansom, John Nellthorp (ITS) with contribution from partners Leeds : ITS, 2000 UNITE, 2001 J. Nellthorp et al. Unification of accounts and marginal costs for transport efficiency, Valuation Conventions Leeds : 2001. UNITE, 2002a Link H., Stewart L.H.,et al. Unification of accounts and marginal costs for transport efficiency, Deliverable 5: Pilot Accounts for Germany and Switzerland. Project funded by the 5th RTD framework program of the European Commission Leeds : UNITE, 2002 UNITE, 2002b Link H., Stewart L.H., et al. Unification of accounts and marginal costs for transport efficiency, Deliverable 8: Pilot Accounts- Results for Austria, Denmark, Spain, France, Ireland, Netherlands and UK. Project funded by the 5th RTD framework program of the European Commission. Leeds, September 2002 UNITE, 2002c Link H., Stewart L.H., et al. Unification of accounts and marginal costs for transport efficiency, Deliverable 12: Pilot Accounts- Results for Belgium, Finland, Greece, Hungary, Italy, Luxembourg, Portugal, Sweden. Project funded by the 5th RTD framework program of the European Commission. Leeds, August 2002 UNITE, 2002d Link H. et al. Unification of accounts and marginal costs for transport efficiency, Deliverable 10: Case Studies on Marginal Infrastructure Costs. Project funded by the 5th RTD framework program of the European Commission. Leeds, August 2002

4.288.1/Road infrastructure cost and revenue in Europe – IMPACT D2 April 2008
83
UNITE, 2003 Unification of accounts and marginal costs for transport efficiency, Final report for publication, C. Nash with contribution from partners Leeds : UNITE, 2003 US FHA, 2006 Congestion pricing; a primer, US Department of Transportation, Federal Highway Administration, December 2006, FHWA-HOP-07-074 Verhoef, 2002 Marginal cost based pricing in transport: Key implementation issues from the economic perspective, paper prepared for imprint http://www.imprint-eu.org/public/Ev_v2.pdf Verhoef, 2003 De economie van verkeerscongestie en andere stedelijke externaliteiten Amsterdam : Vrije Universiteit Amsterdam, December, 2003 Verhoef, 2004 Vormgeving en effecten van prijsbeleid op de weg; Effectiviteit, Efficiëntie en Acceptatie vanuit een Multidisciplinair Perspectief Vrije Universiteit Amsterdam, SEO, RUG, TU Delft, September 2004 Verhoef, 2007 Personal communication Watkiss, 2005a The Impacts and Costs of Climate Change. Final Report September 2005. P. Watkiss et al., Commissioned by European Commission DG Environment, prepared as task 1 of the project ‘Modelling support for Future Actions - Benefits and Cost of Climate Change Policies and Measures’ ENV.C.2/2004/0088. http://europa.eu.int/comm/environment/climat/pdf/final_report2.pdf Watkiss, 2005b P. Watkiss et al. The Social Cost of Carbon (SCC) Review – Methodological Approaches for Using SCC Estimates in Policy Assessment : Final Report November 2005, Research on behalf of UK Defra Wirtschaftsrat, 2007 CDU Economic Council for Germany Transparenz, Effizienz, Wettbewerb: Ein Zwei-Säulen-Konzept zur Modernisierung der Verkehrsinfrastruktur. Berlin

4.288.1/Road infrastructure cost and revenue in Europe – IMPACT D2 April 2008 84

4.288.1/Road infrastructure cost and revenue in Europe – IMPACT D2 April 2008
85
Road infrastructure cost and revenue in Europe
Produced within the study Internalisation Measures and Policies
for all external cost of Transport (IMPACT) – Deliverable 2
Version 1.0
Report Karlsruhe/Delft, April 2008 Authors: Claus Doll (Fraunhofer-ISI) Huib van Essen (CE Delft)
CE Delft Solutions for environment, economy and
technology
Oude Delft 180
2611 HH Delft
The Netherlands
tel: +31 15 2150 150
fax: +31 15 2150 151
e-mail: [email protected]
website: www.ce.nl
KvK 27251086
CE DelftSolutions for
environment,
economy and
technology
Oude Delft 180
2611 HH Delft
The Netherlands
tel: +31 15 2 150 150
fax: +31 15 2 150 151
e-mail: [email protected]
website: www.ce.nl
KvK 27251086

4.288.1/Road infrastructure cost and revenue in Europe – IMPACT D2 April 2008 86

4.288.1/Road infrastructure cost and revenue in Europe – IMPACT D2 April 2008
87
A Selected output tables of the cost and revenue database

4.288.1/Road infrastructure cost and revenue in Europe – IMPACT D2 April 2008 88

4.288.1/Road infrastructure cost and revenue in Europe – IMPACT D2 April 2008
89
Table 26 Indicative average fixed infrastructure costs - Motorways
Motorways - Euro per vehicle kilometer Country SmallCar BigCar MCycle Bus/Coach LDV/Van HGV5.5t HGV12t HGV24t HGV40t Austria AT 0.032211 0.032211 0.020976 0.054682 0.043447 0.054682 0.065918 0.077153 0.088389 Belgium BE 0.018158 0.018158 0.012329 0.029817 0.023988 0.029817 0.035646 0.041475 0.047305 Bulgaria BG 0.007911 0.007911 0.005594 0.012544 0.010228 0.012544 0.014861 0.017178 0.019494 Switzerland CH 0.044212 0.044212 0.030398 0.071842 0.058027 0.071842 0.085656 0.099471 0.113286 Cyprus CY 0.07889 0.07889 0.055491 0.125687 0.102288 0.125687 0.149085 0.172484 0.195883 Czech Rep. CZ 0.021293 0.021293 0.015159 0.033562 0.027428 0.033562 0.039697 0.045831 0.051966 Germany DE 0.020432 0.020434 0.012515 0.05679 0.028351 0.036392 0.046821 0.071129 0.089616 Denmark DK 0.018496 0.018496 0.013089 0.029311 0.023903 0.029311 0.034718 0.040126 0.045533 Estonia EE 0.142079 0.142079 0.097852 0.230532 0.186306 0.230532 0.274759 0.318986 0.363213 Spain ES 0.027619 0.027619 0.019686 0.043484 0.035551 0.043484 0.051417 0.059349 0.067282 Finland FI 0.056911 0.056911 0.039525 0.091683 0.074297 0.091683 0.109069 0.126455 0.14384 France FR 0.05358 0.05358 0.043924 0.072892 0.063236 0.072892 0.082548 0.092204 0.10186 Greece GR 0.025031 0.025031 0.01748 0.040134 0.032582 0.040134 0.047685 0.055237 0.062788 Hungary HU 0.054598 0.054598 0.038675 0.086442 0.07052 0.086442 0.102365 0.118287 0.13421 Ireland IE 0.039565 0.039565 0.026979 0.064738 0.052152 0.064738 0.077324 0.08991 0.102497 Italy IT 0.027919 0.027919 0.019542 0.044673 0.036296 0.044673 0.05305 0.061426 0.069803 Lithuania LT 0.112911 0.112911 0.081829 0.175074 0.143992 0.175074 0.206155 0.237237 0.268318 Luxemburg LU 0.055518 0.055518 0.037858 0.090839 0.073179 0.090839 0.1085 0.12616 0.14382 Latvia LV 0 0 0 0 0 0 0 0 0 Malta MT 0 0 0 0 0 0 0 0 0 Netherlands NL 0.046635 0.046635 0.033393 0.073118 0.059877 0.073118 0.08636 0.099601 0.112843 Norway NO 0.037846 0.037846 0.025464 0.06261 0.050228 0.06261 0.074992 0.087374 0.099756 Poland PL 0.02248 0.02248 0.015936 0.035569 0.029025 0.035569 0.042113 0.048658 0.055202 Portugal PT 0.005893 0.005893 0.003991 0.009695 0.007794 0.009695 0.011596 0.013498 0.015399 Romania RO 0 0 0 0 0 0 0 0 0 Sweden SE 0.15801 0.15801 0.140462 0.193105 0.175558 0.193105 0.210653 0.2282 0.245748 Slovenia SI 0.06802 0.06802 0.047858 0.108345 0.088182 0.108345 0.128507 0.148669 0.168832 Slovakia SK 0.009453 0.009453 0.006875 0.014608 0.012031 0.014608 0.017186 0.019764 0.022341 Un. Kingdom UK 0.017256 0.017256 0.011685 0.028397 0.022827 0.028397 0.033968 0.039539 0.04511 AVERAGE EUR-29 0.029461 0.029462 0.021298 0.05132 0.037625 0.045822 0.054663 0.067244 0.078257 Source: Own estimates based on UNITE, 2002; ProgTrans/IWW, 2007; BFS, 2003; Herry (2002). Data extrapolated for BG, CY, CZ, EE, LT, LV, MT, NO, PL, RO, SI, SK.
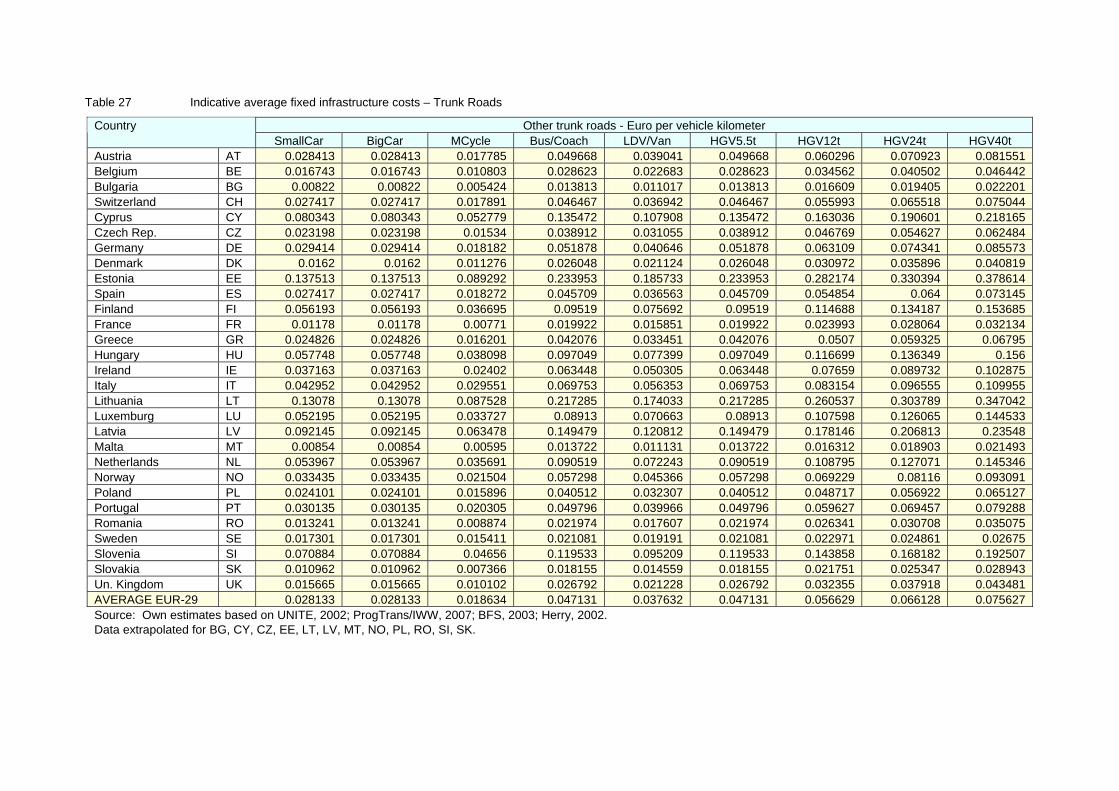
4.288.1/Road infrastructure cost and revenue in Europe – IMPACT D2 April 2008 90
Table 27 Indicative average fixed infrastructure costs – Trunk Roads
Other trunk roads - Euro per vehicle kilometer Country SmallCar BigCar MCycle Bus/Coach LDV/Van HGV5.5t HGV12t HGV24t HGV40t Austria AT 0.028413 0.028413 0.017785 0.049668 0.039041 0.049668 0.060296 0.070923 0.081551 Belgium BE 0.016743 0.016743 0.010803 0.028623 0.022683 0.028623 0.034562 0.040502 0.046442 Bulgaria BG 0.00822 0.00822 0.005424 0.013813 0.011017 0.013813 0.016609 0.019405 0.022201 Switzerland CH 0.027417 0.027417 0.017891 0.046467 0.036942 0.046467 0.055993 0.065518 0.075044 Cyprus CY 0.080343 0.080343 0.052779 0.135472 0.107908 0.135472 0.163036 0.190601 0.218165 Czech Rep. CZ 0.023198 0.023198 0.01534 0.038912 0.031055 0.038912 0.046769 0.054627 0.062484 Germany DE 0.029414 0.029414 0.018182 0.051878 0.040646 0.051878 0.063109 0.074341 0.085573 Denmark DK 0.0162 0.0162 0.011276 0.026048 0.021124 0.026048 0.030972 0.035896 0.040819 Estonia EE 0.137513 0.137513 0.089292 0.233953 0.185733 0.233953 0.282174 0.330394 0.378614 Spain ES 0.027417 0.027417 0.018272 0.045709 0.036563 0.045709 0.054854 0.064 0.073145 Finland FI 0.056193 0.056193 0.036695 0.09519 0.075692 0.09519 0.114688 0.134187 0.153685 France FR 0.01178 0.01178 0.00771 0.019922 0.015851 0.019922 0.023993 0.028064 0.032134 Greece GR 0.024826 0.024826 0.016201 0.042076 0.033451 0.042076 0.0507 0.059325 0.06795 Hungary HU 0.057748 0.057748 0.038098 0.097049 0.077399 0.097049 0.116699 0.136349 0.156 Ireland IE 0.037163 0.037163 0.02402 0.063448 0.050305 0.063448 0.07659 0.089732 0.102875 Italy IT 0.042952 0.042952 0.029551 0.069753 0.056353 0.069753 0.083154 0.096555 0.109955 Lithuania LT 0.13078 0.13078 0.087528 0.217285 0.174033 0.217285 0.260537 0.303789 0.347042 Luxemburg LU 0.052195 0.052195 0.033727 0.08913 0.070663 0.08913 0.107598 0.126065 0.144533 Latvia LV 0.092145 0.092145 0.063478 0.149479 0.120812 0.149479 0.178146 0.206813 0.23548 Malta MT 0.00854 0.00854 0.00595 0.013722 0.011131 0.013722 0.016312 0.018903 0.021493 Netherlands NL 0.053967 0.053967 0.035691 0.090519 0.072243 0.090519 0.108795 0.127071 0.145346 Norway NO 0.033435 0.033435 0.021504 0.057298 0.045366 0.057298 0.069229 0.08116 0.093091 Poland PL 0.024101 0.024101 0.015896 0.040512 0.032307 0.040512 0.048717 0.056922 0.065127 Portugal PT 0.030135 0.030135 0.020305 0.049796 0.039966 0.049796 0.059627 0.069457 0.079288 Romania RO 0.013241 0.013241 0.008874 0.021974 0.017607 0.021974 0.026341 0.030708 0.035075 Sweden SE 0.017301 0.017301 0.015411 0.021081 0.019191 0.021081 0.022971 0.024861 0.02675 Slovenia SI 0.070884 0.070884 0.04656 0.119533 0.095209 0.119533 0.143858 0.168182 0.192507 Slovakia SK 0.010962 0.010962 0.007366 0.018155 0.014559 0.018155 0.021751 0.025347 0.028943 Un. Kingdom UK 0.015665 0.015665 0.010102 0.026792 0.021228 0.026792 0.032355 0.037918 0.043481 AVERAGE EUR-29 0.028133 0.028133 0.018634 0.047131 0.037632 0.047131 0.056629 0.066128 0.075627 Source: Own estimates based on UNITE, 2002; ProgTrans/IWW, 2007; BFS, 2003; Herry, 2002. Data extrapolated for BG, CY, CZ, EE, LT, LV, MT, NO, PL, RO, SI, SK.
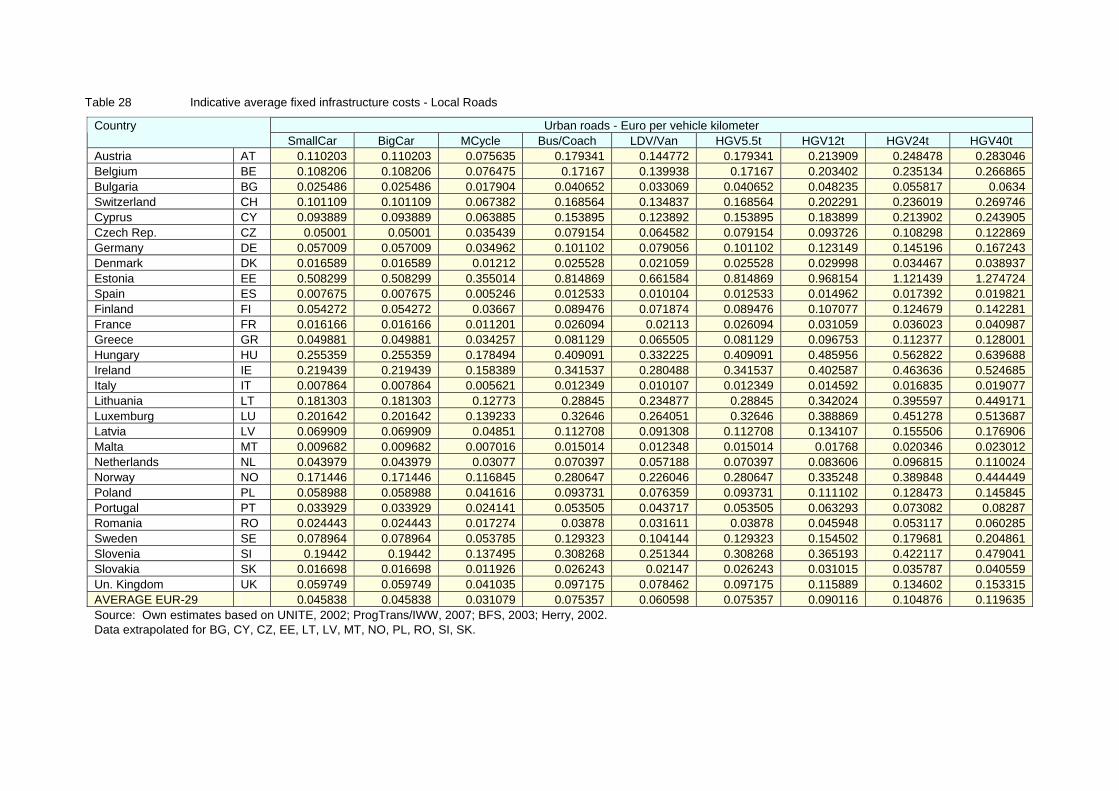
4.288.1/Road infrastructure cost and revenue in Europe – IMPACT D2 April 2008
91
Table 28 Indicative average fixed infrastructure costs - Local Roads
Urban roads - Euro per vehicle kilometer Country SmallCar BigCar MCycle Bus/Coach LDV/Van HGV5.5t HGV12t HGV24t HGV40t Austria AT 0.110203 0.110203 0.075635 0.179341 0.144772 0.179341 0.213909 0.248478 0.283046 Belgium BE 0.108206 0.108206 0.076475 0.17167 0.139938 0.17167 0.203402 0.235134 0.266865 Bulgaria BG 0.025486 0.025486 0.017904 0.040652 0.033069 0.040652 0.048235 0.055817 0.0634 Switzerland CH 0.101109 0.101109 0.067382 0.168564 0.134837 0.168564 0.202291 0.236019 0.269746 Cyprus CY 0.093889 0.093889 0.063885 0.153895 0.123892 0.153895 0.183899 0.213902 0.243905 Czech Rep. CZ 0.05001 0.05001 0.035439 0.079154 0.064582 0.079154 0.093726 0.108298 0.122869 Germany DE 0.057009 0.057009 0.034962 0.101102 0.079056 0.101102 0.123149 0.145196 0.167243 Denmark DK 0.016589 0.016589 0.01212 0.025528 0.021059 0.025528 0.029998 0.034467 0.038937 Estonia EE 0.508299 0.508299 0.355014 0.814869 0.661584 0.814869 0.968154 1.121439 1.274724 Spain ES 0.007675 0.007675 0.005246 0.012533 0.010104 0.012533 0.014962 0.017392 0.019821 Finland FI 0.054272 0.054272 0.03667 0.089476 0.071874 0.089476 0.107077 0.124679 0.142281 France FR 0.016166 0.016166 0.011201 0.026094 0.02113 0.026094 0.031059 0.036023 0.040987 Greece GR 0.049881 0.049881 0.034257 0.081129 0.065505 0.081129 0.096753 0.112377 0.128001 Hungary HU 0.255359 0.255359 0.178494 0.409091 0.332225 0.409091 0.485956 0.562822 0.639688 Ireland IE 0.219439 0.219439 0.158389 0.341537 0.280488 0.341537 0.402587 0.463636 0.524685 Italy IT 0.007864 0.007864 0.005621 0.012349 0.010107 0.012349 0.014592 0.016835 0.019077 Lithuania LT 0.181303 0.181303 0.12773 0.28845 0.234877 0.28845 0.342024 0.395597 0.449171 Luxemburg LU 0.201642 0.201642 0.139233 0.32646 0.264051 0.32646 0.388869 0.451278 0.513687 Latvia LV 0.069909 0.069909 0.04851 0.112708 0.091308 0.112708 0.134107 0.155506 0.176906 Malta MT 0.009682 0.009682 0.007016 0.015014 0.012348 0.015014 0.01768 0.020346 0.023012 Netherlands NL 0.043979 0.043979 0.03077 0.070397 0.057188 0.070397 0.083606 0.096815 0.110024 Norway NO 0.171446 0.171446 0.116845 0.280647 0.226046 0.280647 0.335248 0.389848 0.444449 Poland PL 0.058988 0.058988 0.041616 0.093731 0.076359 0.093731 0.111102 0.128473 0.145845 Portugal PT 0.033929 0.033929 0.024141 0.053505 0.043717 0.053505 0.063293 0.073082 0.08287 Romania RO 0.024443 0.024443 0.017274 0.03878 0.031611 0.03878 0.045948 0.053117 0.060285 Sweden SE 0.078964 0.078964 0.053785 0.129323 0.104144 0.129323 0.154502 0.179681 0.204861 Slovenia SI 0.19442 0.19442 0.137495 0.308268 0.251344 0.308268 0.365193 0.422117 0.479041 Slovakia SK 0.016698 0.016698 0.011926 0.026243 0.02147 0.026243 0.031015 0.035787 0.040559 Un. Kingdom UK 0.059749 0.059749 0.041035 0.097175 0.078462 0.097175 0.115889 0.134602 0.153315 AVERAGE EUR-29 0.045838 0.045838 0.031079 0.075357 0.060598 0.075357 0.090116 0.104876 0.119635 Source: Own estimates based on UNITE, 2002; ProgTrans/IWW, 2007; BFS, 2003; Herry, 2002. Data extrapolated for BG, CY, CZ, EE, LT, LV, MT, NO, PL, RO, SI, SK.

4.288.1/Road infrastructure cost and revenue in Europe – IMPACT D2 April 2008 92
Table 29 Indicative average fixed infrastructure costs - SUMMARY
SUMMARY by vehicle type (€/vkm) SUMMARY by network Revenues Country SmallCar BigCar MCycle Bus/Coach LDV/Van HGV5.5t HGV12t HGV24t HGV40t Motorways Trunk Urban All mill. € Austria AT 0.050718 0.050718 0.054774 0.082923 0.067091 0.0662 0.079402 0.092604 0.105807 0.039804 0.032926 0.12449 0.05694 4040.21 Belgium BE 0.038135 0.038135 0.081255 0.18378 0.149451 0.154567 0.183647 0.212726 0.241805 0.019524 0.017301 0.142786 0.068339 7169.926 Bulgaria BG 0.015303 0.015303 0.018653 0.042349 0.034878 0.031854 0.037914 0.043973 0.050033 0.009846 0.009349 0.032937 0.023542 520.1357 Switzerland CH 0.058681 0.058681 0.049196 0.092608 0.102968 0.064662 0.077454 0.090247 0.103039 0.049812 0.02976 0.107401 0.062056 3826.243 Cyprus CY 0.09126 0.09126 0.082688 0.191285 0.154398 0.11779 0.140903 0.164015 0.187128 0.0964 0.089699 0.108127 0.106339 325.9258 Czech Rep. CZ 0.038656 0.038656 0.041518 0.095462 0.079651 0.086917 0.103374 0.119831 0.136288 0.027108 0.026621 0.066592 0.059821 4452.955 Germany DE 0.043573 0.043573 0.037276 0.098322 0.074464 0.050033 0.061446 0.07578 0.088889 0.027988 0.033126 0.062891 0.04806 33791.79 Denmark DK 0.017399 0.017399 0.021717 0.04702 0.038395 0.038073 0.045011 0.051949 0.058886 0.020532 0.016978 0.020449 0.023562 1142.055 Estonia EE 0.320764 0.320764 0.386978 0.910914 0.752996 0.873791 1.041658 1.209525 1.377392 0.161079 0.146113 0.64377 0.4745 1974.787 Spain ES 0.019811 0.019811 0.017077 0.037219 0.028804 0.017578 0.020987 0.024396 0.027806 0.035304 0.032466 0.008988 0.022797 7556.059 Finland FI 0.068281 0.068281 0.052481 0.126094 0.104067 0.107163 0.128199 0.149236 0.170272 0.0665 0.061175 0.060852 0.075923 4360.1 France FR 0.033658 0.033658 0.023251 0.048904 0.039057 0.040992 0.048228 0.055464 0.0627 0.05931 0.012945 0.019904 0.036658 25138.56 Greece GR 0.045217 0.045217 0.043781 0.105429 0.086227 0.093227 0.111521 0.129816 0.148111 0.029822 0.02695 0.059463 0.061772 5266.252 Hungary HU 0.146868 0.146868 0.157966 0.365606 0.310261 0.333969 0.397485 0.461001 0.524517 0.068345 0.065627 0.324321 0.213781 10036.63 Ireland IE 0.089251 0.089251 0.168582 0.373639 0.309013 0.359428 0.425334 0.49124 0.557147 0.043233 0.038697 0.310638 0.172956 5276.744 Italy IT 0.027431 0.027431 0.032186 0.073986 0.060184 0.062879 0.074845 0.086811 0.098778 0.030808 0.044563 0.009322 0.036682 18044.19 Lithuania LT 0.18104 0.18104 0.160369 0.367844 0.310581 0.337517 0.401227 0.464937 0.528647 0.152436 0.15751 0.236652 0.252556 4259.951 Luxemburg LU 0.130663 0.130663 0.1587 0.376997 0.305759 0.328728 0.3927 0.456671 0.520642 0.060669 0.054286 0.245166 0.172682 860.9769 Latvia LV 0.059945 0.059945 0.028293 0.06624 0.063009 0.063097 0.075145 0.087194 0.099243 0.123837 0.086516 0.065176 576.1949 Malta MT 0.006741 0.006741 0.00673 0.014914 0.013483 0.014451 0.017094 0.019738 0.022381 0.011951 0.013884 0.012522 42.40628 Netherlands NL 0.052744 0.052744 0.052069 0.120065 0.097998 0.086404 0.103085 0.119765 0.136446 0.060532 0.061953 0.056041 0.066299 5991.578 Norway NO 0.082311 0.082311 0.120827 0.294277 0.241662 0.280994 0.336323 0.391651 0.446979 0.039294 0.034054 0.198639 0.107002 4788.851 Poland PL 0.04422 0.04422 0.046201 0.107142 0.089923 0.102725 0.122235 0.141744 0.161254 0.028209 0.027361 0.077372 0.066371 11536.31 Portugal PT 0.016761 0.016761 0.037424 0.084071 0.068309 0.058658 0.069802 0.080946 0.092089 0.007502 0.03357 0.046177 0.039919 2631.954 Romania RO 0.013939 0.013939 0.01562 0.036294 0.031977 0.035345 0.042056 0.048767 0.055478 0.016034 0.032249 0.023302 1358.905 Sweden SE 0.11691 0.11691 0.099337 0.158536 0.133017 0.123845 0.139694 0.155542 0.171391 0.168367 0.017817 0.091288 0.121277 9827.073 Slovenia SI 0.128889 0.128889 0.156487 0.358899 0.296375 0.309735 0.368499 0.427262 0.486026 0.083191 0.079101 0.257123 0.206742 2140.246 Slovakia SK 0.013703 0.013703 0.015483 0.034426 0.028374 0.025555 0.030345 0.035134 0.039923 0.012909 0.013412 0.022831 0.022249 718.6233 Un. Kingdom UK 0.038898 0.038898 0.047771 0.114493 0.092416 0.099867 0.119425 0.138983 0.15854 0.018366 0.016145 0.071235 0.051826 24291.1 AVERAGE EUR-29 0.039176 0.039176 0.041524 0.089478 0.076135 0.074199 0.088853 0.104157 0.119188 0.034835 0.030934 0.055582 0.050979 197891 Source: Own estimates based on UNITE, 2002; ProgTrans/IWW, 2007; BFS, 2003; Herry, 2002. Data extrapolated for BG, CY, CZ, EE, LT, LV, MT, NO, PL, RO, SI, SK.

4.288.1/Road infrastructure cost and revenue in Europe – IMPACT D2 April 2008
93
Table 30 Indicative average variable infrastructure costs - Motorways
Motorways - Euro per vehicle kilometer Country SmallCar BigCar MCycle Bus/Coach LDV/Van HGV5.5t HGV12t HGV24t HGV40t
Austria AT 0.00167 0.001676 0.00167 0.050211 0.001676 0.001973 0.007913 0.046676 0,071676 Belgium BE 0.000724 0.000736 0.000724 0.112821 0.000738 0.001422 0.015141 0.104658 0,162391 Bulgaria BG 0.000365 0.000367 0.000365 0.016039 0.000367 0.000463 0.002381 0.014898 0,022971 Switzerland CH 0.001847 0.001858 0.001846 0.111263 0.00186 0.002528 0.015919 0.103295 0,159648 Cyprus CY 0.003574 0.003592 0.003573 0.179544 0.003595 0.004669 0.026206 0.16673 0,257359 Czech Rep. CZ 0.001005 0.001009 0.001005 0.040125 0.00101 0.001248 0.006036 0.037277 0,057425 Germany DE 0.003699 0.003704 0.003698 0.052704 0.003705 0.004003 0.010001 0.049135 0,074374 Denmark DK 0.000714 0.000723 0.000714 0.079291 0.000724 0.001203 0.01082 0.073569 0,114038 Estonia EE 0.005973 0.006026 0.00597 0.512949 0.006035 0.009128 0.071176 0.476031 0,737137 Spain ES 0.001309 0.001315 0.001308 0.061525 0.001316 0.001683 0.009053 0.05714 0,088153 Finland FI 0.002466 0.002483 0.002465 0.165886 0.002486 0.003482 0.023483 0.153986 0,238151 France FR 0.001393 0.001417 0.001391 0.231314 0.001421 0.002823 0.030963 0.214571 0,332986 Greece GR 0.001106 0.001112 0.001105 0.065755 0.001114 0.001508 0.00942 0.061047 0,094343 Hungary HU 0.002534 0.002545 0.002533 0.108321 0.002547 0.003192 0.016139 0.100618 0,155102 Ireland IE 0.001604 0.001624 0.001602 0.198073 0.001628 0.002826 0.026872 0.183767 0,284954 Italy IT 0.001092 0.001105 0.001091 0.125692 0.001107 0.001867 0.017117 0.116619 0,180791 Lithuania LT 0.00565 0.005668 0.005649 0.169951 0.005671 0.006673 0.026782 0.157987 0,242606 Luxemburg LU 0.00225 0.002278 0.002248 0.271808 0.002283 0.003927 0.036919 0.252179 0,391009 Latvia LV 0 0 0 0 0 0 0 0 0 Malta MT 0 0 0 0 0 0 0 0 0 Netherlands NL 0.002244 0.002252 0.002243 0.076354 0.002253 0.002705 0.011775 0.070957 0,109126 Norway NO 0.001459 0.001508 0.001456 0.464906 0.001516 0.004343 0.061064 0.431158 0,669845 Poland PL 0.001046 0.00105 0.001045 0.044792 0.001051 0.001318 0.006672 0.041606 0,064136 Portugal PT 0.000301 0.000302 0.000301 0.01322 0.000302 0.000381 0.001962 0.012279 0,018933 Romania RO 0 0 0 0 0 0 0 0 0 Sweden SE 0.00253 0.00261 0.002525 0.765856 0.002623 0.00728 0.100703 0.710271 1,103403 Slovenia SI 0.003084 0.0031 0.003083 0.153878 0.003103 0.004022 0.022478 0.142898 0,220561 Slovakia SK 0.000479 0.00048 0.000478 0.013758 0.00048 0.000561 0.002186 0.012791 0,01963 Un. Kingdom UK 0.000681 0.000695 0.000681 0.126126 0.000697 0.001462 0.016815 0.116991 0,181599 AVERAGE EUR-29 0,001786 0.001796 0.001785 0.097868 0.001798 0.002384 0.014143 0.090872 0.140357 Source: Own estimates based on UNITE, 2002; ProgTrans/IWW, 2007; BFS, 2003; Herry ,2002. Data extrapolated for BG, CY, CZ, EE, LT, LV, MT, NO, PL, RO, SI, SK.

4.288.1/Road infrastructure cost and revenue in Europe – IMPACT D2 April 2008 94
Table 31 Indicative average variable infrastructure costs - Trunk Roads
Other trunk roads - Euro per vehicle kilometer Country SmallCar BigCar MCycle Bus/Coach LDV/Van HGV5.5t HGV12t HGV24t HGV40t Austria AT 0.001432 0.001437 0.001432 0.054472 0.001438 0.001762 0.008253 0.050609 0.077926 Belgium BE 0.000692 0.000716 0.000691 0.230363 0.000721 0.002122 0.030231 0.213639 0.331925 Bulgaria BG 0.000374 0.000376 0.000373 0.02671 0.000377 0.000537 0.003761 0.024792 0.038356 Switzerland CH 0.001189 0.001197 0.001189 0.07988 0.001199 0.001679 0.01131 0.07415 0.114678 Cyprus CY 0.003585 0.003618 0.003582 0.324853 0.003624 0.005584 0.044904 0.301459 0.46692 Czech Rep. CZ 0.001064 0.001072 0.001063 0.08026 0.001073 0.001557 0.011249 0.074493 0.115281 Germany DE 0.003399 0.003411 0.003398 0.121433 0.003413 0.004133 0.01858 0.112838 0.173629 Denmark DK 0.000591 0.000607 0.00059 0.152165 0.00061 0.001535 0.020086 0.141128 0.219192 Estonia EE 0.005842 0.005948 0.005836 1.016037 0.005966 0.012128 0.135766 0.942476 1.462752 Spain ES 0.001297 0.00131 0.001297 0.120096 0.001312 0.002037 0.016576 0.111445 0.172629 Finland FI 0.002445 0.002476 0.002443 0.296105 0.002481 0.004272 0.040213 0.274721 0.425963 France FR 0.000517 0.000524 0.000517 0.067469 0.000526 0.000934 0.009128 0.062594 0.097076 Greece GR 0.001077 0.001091 0.001076 0.131263 0.001093 0.001887 0.017821 0.121783 0.188833 Hungary HU 0.002622 0.002642 0.002621 0.194199 0.002646 0.003814 0.027261 0.180249 0.278916 Ireland IE 0.001548 0.001589 0.001546 0.395097 0.001596 0.003997 0.052163 0.366439 0.569127 Italy IT 0.001581 0.001629 0.001578 0.457955 0.001637 0.004421 0.060277 0.424722 0.659766 Lithuania LT 0.006293 0.006328 0.006291 0.338723 0.006334 0.008361 0.049047 0.314515 0.485725 Luxemburg LU 0.002172 0.002226 0.002168 0.526723 0.002236 0.005436 0.069635 0.488525 0.758683 Latvia LV 0.004947 0.004962 0.004946 0.15043 0.004965 0.005852 0.023658 0.139836 0.214763 Malta MT 0.000477 0.000479 0.000477 0.012844 0.000479 0.000554 0.002068 0.011943 0.018312 Netherlands NL 0.002475 0.002491 0.002474 0.154133 0.002494 0.003419 0.02198 0.143089 0.221197 Norway NO 0.001365 0.001451 0.00136 0.821692 0.001466 0.00647 0.106869 0.761957 1.184446 Poland PL 0.001093 0.001102 0.001093 0.087732 0.001104 0.001632 0.012236 0.081423 0.126044 Portugal PT 0.001284 0.001295 0.001283 0.112818 0.001297 0.001978 0.015629 0.104696 0.16214 Romania RO 0.000641 0.000644 0.00064 0.032819 0.000645 0.000841 0.004779 0.030476 0.047049 Sweden SE 0.00024 0.00026 0.000239 0.188904 0.000263 0.001414 0.024504 0.175166 0.272333 Slovenia SI 0.003161 0.003192 0.003159 0.30152 0.003198 0.005018 0.041534 0.279793 0.433456 Slovakia SK 0.000536 0.000539 0.000536 0.026503 0.000539 0.000697 0.003876 0.024612 0.037986 Un. Kingdom UK 0.000646 0.000671 0.000645 0.236337 0.000675 0.002113 0.030959 0.219175 0.340562 AVERAGE EUR-29 0.001492 0.001507 0.001491 0.142263 0.00151 0.002368 0.019597 0.132013 0.204513 Source: Own estimates based on UNITE, 2002; ProgTrans/IWW, 2007; BFS, 2003; Herry, 2002. Data extrapolated for BG, CY, CZ, EE, LT, LV, MT, NO, PL, RO, SI, SK.

4.288.1/Road infrastructure cost and revenue in Europe – IMPACT D2 April 2008
95
Table 32 Indicative average variable infrastructure costs - Local Roads
Urban roads - Euro per vehicle kilometer Country SmallCar BigCar MCycle Bus/Coach LDV/Van HGV5.5t HGV12t HGV24t HGV40t Austria AT 0.004636 0.004665 0.004635 0.274647 0.004669 0.006317 0.039363 0.254985 0.394047 Belgium BE 0.005448 0.005467 0.005447 0.19093 0.005471 0.006602 0.029303 0.177424 0.272952 Bulgaria BG 0.001257 0.001261 0.001256 0.044854 0.001262 0.001528 0.006864 0.041679 0.064133 Switzerland CH 0.004099 0.004137 0.004097 0.360968 0.004143 0.00632 0.049997 0.334981 0.518777 Cyprus CY 0.004127 0.00416 0.004125 0.327019 0.004166 0.006136 0.045655 0.303506 0.469804 Czech Rep. CZ 0.002541 0.00255 0.00254 0.089818 0.002552 0.003084 0.013766 0.083463 0.128413 Germany DE 0.002778 0.002801 0.002776 0.222323 0.002805 0.004144 0.031014 0.206336 0.319407 Denmark DK 0.000711 0.000715 0.000711 0.035123 0.000715 0.000925 0.005137 0.032617 0.05034 Estonia EE 0.024564 0.024672 0.024558 1.053785 0.02469 0.030969 0.156935 0.978838 1.508913 Spain ES 0.000343 0.000348 0.000343 0.042867 0.000348 0.000608 0.005812 0.039771 0.061672 Finland FI 0.002323 0.002347 0.002321 0.232046 0.002351 0.003752 0.031868 0.215318 0.333632 France FR 0.00076 0.000764 0.000759 0.047579 0.000765 0.001051 0.006781 0.04417 0.068283 Greece GR 0.002269 0.002284 0.002268 0.139261 0.002286 0.003122 0.019888 0.129285 0.199839 Hungary HU 0.012375 0.012425 0.012372 0.495377 0.012434 0.01538 0.074495 0.460206 0.708964 Ireland IE 0.011852 0.011881 0.01185 0.28849 0.011885 0.013573 0.047431 0.268345 0.410821 Italy IT 0.00033 0.000332 0.00033 0.018711 0.000333 0.000445 0.002694 0.017373 0.02684 Lithuania LT 0.00903 0.009066 0.009028 0.353198 0.009072 0.011171 0.053294 0.328136 0.505392 Luxemburg LU 0.009355 0.009399 0.009352 0.433774 0.009407 0.011996 0.063941 0.402868 0.621455 Latvia LV 0.003301 0.003319 0.0033 0.170016 0.003322 0.004339 0.024743 0.157876 0.243739 Malta MT 0.00053 0.000531 0.00053 0.014365 0.000531 0.000616 0.002309 0.013357 0.020483 Netherlands NL 0.002138 0.002146 0.002138 0.073393 0.002147 0.002582 0.011302 0.068204 0.104902 Norway NO 0.007581 0.007643 0.007577 0.594728 0.007653 0.011235 0.083095 0.551972 0.854367 Poland PL 0.002952 0.002963 0.002951 0.108353 0.002965 0.003608 0.016508 0.100677 0.154961 Portugal PT 0.001768 0.001773 0.001768 0.046902 0.001774 0.002049 0.007573 0.043615 0.066861 Romania RO 0.00123 0.001235 0.00123 0.044862 0.001236 0.001502 0.006842 0.041685 0.064156 Sweden SE 0.003484 0.003512 0.003482 0.274258 0.003517 0.005169 0.038309 0.25454 0.393996 Slovenia SI 0.009811 0.009846 0.009808 0.351978 0.009853 0.01194 0.053817 0.327061 0.503286 Slovakia SK 0.000871 0.000874 0.000871 0.028004 0.000874 0.00104 0.004361 0.026028 0.040002 Un. Kingdom UK 0.002719 0.002736 0.002717 0.171115 0.002739 0.003766 0.024376 0.158853 0.245581 AVERAGE EUR-29 0.002182 0.002194 0.002181 0.118136 0.002196 0.002904 0.017095 0.109692 0.169411 Source: Own estimates based on UNITE, 2002; ProgTrans/IWW, 2007; BFS, 2003; Herry, 2002. Data extrapolated for BG, CY, CZ, EE, LT, LV, MT, NO, PL, RO, SI, SK.
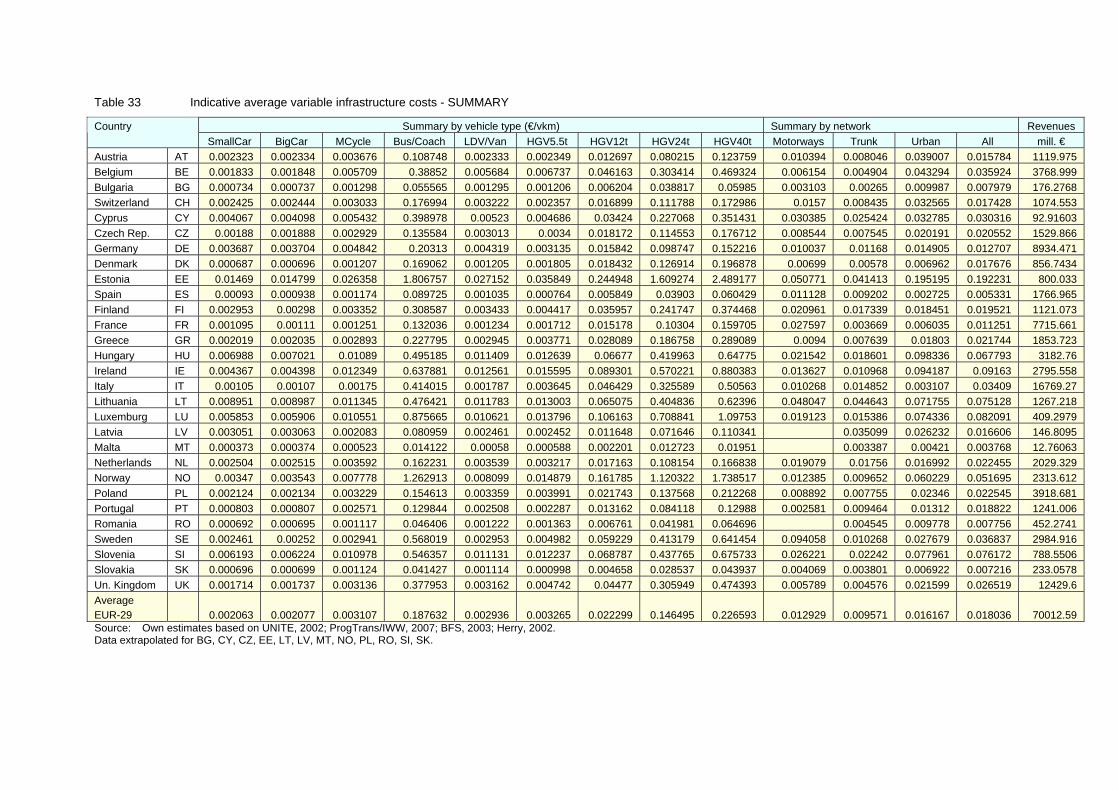
4.288.1/Road infrastructure cost and revenue in Europe – IMPACT D2 April 2008 96
Table 33 Indicative average variable infrastructure costs - SUMMARY
Summary by vehicle type (€/vkm) Summary by network Revenues Country SmallCar BigCar MCycle Bus/Coach LDV/Van HGV5.5t HGV12t HGV24t HGV40t Motorways Trunk Urban All mill. € Austria AT 0.002323 0.002334 0.003676 0.108748 0.002333 0.002349 0.012697 0.080215 0.123759 0.010394 0.008046 0.039007 0.015784 1119.975 Belgium BE 0.001833 0.001848 0.005709 0.38852 0.005684 0.006737 0.046163 0.303414 0.469324 0.006154 0.004904 0.043294 0.035924 3768.999 Bulgaria BG 0.000734 0.000737 0.001298 0.055565 0.001295 0.001206 0.006204 0.038817 0.05985 0.003103 0.00265 0.009987 0.007979 176.2768 Switzerland CH 0.002425 0.002444 0.003033 0.176994 0.003222 0.002357 0.016899 0.111788 0.172986 0.0157 0.008435 0.032565 0.017428 1074.553 Cyprus CY 0.004067 0.004098 0.005432 0.398978 0.00523 0.004686 0.03424 0.227068 0.351431 0.030385 0.025424 0.032785 0.030316 92.91603 Czech Rep. CZ 0.00188 0.001888 0.002929 0.135584 0.003013 0.0034 0.018172 0.114553 0.176712 0.008544 0.007545 0.020191 0.020552 1529.866 Germany DE 0.003687 0.003704 0.004842 0.20313 0.004319 0.003135 0.015842 0.098747 0.152216 0.010037 0.01168 0.014905 0.012707 8934.471 Denmark DK 0.000687 0.000696 0.001207 0.169062 0.001205 0.001805 0.018432 0.126914 0.196878 0.00699 0.00578 0.006962 0.017676 856.7434 Estonia EE 0.01469 0.014799 0.026358 1.806757 0.027152 0.035849 0.244948 1.609274 2.489177 0.050771 0.041413 0.195195 0.192231 800.033 Spain ES 0.00093 0.000938 0.001174 0.089725 0.001035 0.000764 0.005849 0.03903 0.060429 0.011128 0.009202 0.002725 0.005331 1766.965 Finland FI 0.002953 0.00298 0.003352 0.308587 0.003433 0.004417 0.035957 0.241747 0.374468 0.020961 0.017339 0.018451 0.019521 1121.073 France FR 0.001095 0.00111 0.001251 0.132036 0.001234 0.001712 0.015178 0.10304 0.159705 0.027597 0.003669 0.006035 0.011251 7715.661 Greece GR 0.002019 0.002035 0.002893 0.227795 0.002945 0.003771 0.028089 0.186758 0.289089 0.0094 0.007639 0.01803 0.021744 1853.723 Hungary HU 0.006988 0.007021 0.01089 0.495185 0.011409 0.012639 0.06677 0.419963 0.64775 0.021542 0.018601 0.098336 0.067793 3182.76 Ireland IE 0.004367 0.004398 0.012349 0.637881 0.012561 0.015595 0.089301 0.570221 0.880383 0.013627 0.010968 0.094187 0.09163 2795.558 Italy IT 0.00105 0.00107 0.00175 0.414015 0.001787 0.003645 0.046429 0.325589 0.50563 0.010268 0.014852 0.003107 0.03409 16769.27 Lithuania LT 0.008951 0.008987 0.011345 0.476421 0.011783 0.013003 0.065075 0.404836 0.62396 0.048047 0.044643 0.071755 0.075128 1267.218 Luxemburg LU 0.005853 0.005906 0.010551 0.875665 0.010621 0.013796 0.106163 0.708841 1.09753 0.019123 0.015386 0.074336 0.082091 409.2979 Latvia LV 0.003051 0.003063 0.002083 0.080959 0.002461 0.002452 0.011648 0.071646 0.110341 0.035099 0.026232 0.016606 146.8095 Malta MT 0.000373 0.000374 0.000523 0.014122 0.00058 0.000588 0.002201 0.012723 0.01951 0.003387 0.00421 0.003768 12.76063 Netherlands NL 0.002504 0.002515 0.003592 0.162231 0.003539 0.003217 0.017163 0.108154 0.166838 0.019079 0.01756 0.016992 0.022455 2029.329 Norway NO 0.00347 0.003543 0.007778 1.262913 0.008099 0.014879 0.161785 1.120322 1.738517 0.012385 0.009652 0.060229 0.051695 2313.612 Poland PL 0.002124 0.002134 0.003229 0.154613 0.003359 0.003991 0.021743 0.137568 0.212268 0.008892 0.007755 0.02346 0.022545 3918.681 Portugal PT 0.000803 0.000807 0.002571 0.129844 0.002508 0.002287 0.013162 0.084118 0.12988 0.002581 0.009464 0.01312 0.018822 1241.006 Romania RO 0.000692 0.000695 0.001117 0.046406 0.001222 0.001363 0.006761 0.041981 0.064696 0.004545 0.009778 0.007756 452.2741 Sweden SE 0.002461 0.00252 0.002941 0.568019 0.002953 0.004982 0.059229 0.413179 0.641454 0.094058 0.010268 0.027679 0.036837 2984.916 Slovenia SI 0.006193 0.006224 0.010978 0.546357 0.011131 0.012237 0.068787 0.437765 0.675733 0.026221 0.02242 0.077961 0.076172 788.5506 Slovakia SK 0.000696 0.000699 0.001124 0.041427 0.001114 0.000998 0.004658 0.028537 0.043937 0.004069 0.003801 0.006922 0.007216 233.0578 Un. Kingdom UK 0.001714 0.001737 0.003136 0.377953 0.003162 0.004742 0.04477 0.305949 0.474393 0.005789 0.004576 0.021599 0.026519 12429.6 Average EUR-29 0.002063 0.002077 0.003107 0.187632 0.002936 0.003265 0.022299 0.146495 0.226593 0.012929 0.009571 0.016167 0.018036 70012.59 Source: Own estimates based on UNITE, 2002; ProgTrans/IWW, 2007; BFS, 2003; Herry, 2002. Data extrapolated for BG, CY, CZ, EE, LT, LV, MT, NO, PL, RO, SI, SK.

4.288.1/Road infrastructure cost and revenue in Europe – IMPACT D2 April 2008
97
Table 34 Indicative total road infrastructure costs
Total costs (mill. Euro) Total costs (mill. Euro) Unit costs (€/road-km) Country Total Fixed Variable Motorways Trunk roads Local roads Motorways Trunk roads Local roads Austria AT 5160.185 4040.21 1119.975 1223.159 1119.73 3148.96 601061 33922.99 44314.73 Belgium BE 10938.92 7169.926 3768.999 1111.754 461.1875 7601.611 636379 33226.76 56333.27 Bulgaria BG 696.4124 520.1357 176.2768 68.07895 74.96778 454.477 205676.6 10738.83 37948.99 Switzerland CH 4900.796 3826.243 1074.553 1221.54 879.4981 2797.305 910917.1 47561 54373.61 Cyprus CY 418.8418 325.9258 92.91603 113.7926 111.3119 169.1691 424599.3 22169.27 47293.58 Czech Rep. CZ 5982.82 4452.955 1529.866 203.0091 1066.672 3256.418 371811.5 19413.1 45040.36 Germany DE 42726.26 33791.79 8934.471 8319.502 7823.651 24094.25 683382.8 35680.93 58339.6 Denmark DK 1998.799 1142.055 856.7434 430.4135 212.0264 644.5601 419097.9 20523.31 10584.95 Estonia EE 2774.82 1974.787 800.033 40.36309 360.9441 1716.969 420448.9 21952.57 47116.42 Spain ES 9323.025 7556.059 1766.965 6248.669 2604.166 1573.951 581433.8 30357.95 22936.21 Finland FI 5481.173 4360.1 1121.073 431.9004 2700.428 1435.042 661409.4 34533.66 57401.68 France FR 32854.22 25138.56 7715.661 9323.799 3875.355 8954.505 897987 145777.7 9628.5 Greece GR 7119.975 5266.252 1853.723 336.0001 884.5896 3960.809 452830.3 23643.28 52391.65 Hungary HU 13219.39 10036.63 3182.76 245.5359 1899.001 9159.252 431521.8 22530.71 120627.6 Ireland IE 8072.301 5276.744 2795.558 162.1252 743.4138 5136.994 844402.2 44088.12 65212.62 Italy IT 34813.46 18044.19 16769.27 4467.92 9864.256 2698.665 684004.9 59660.43 5431.069 Lithuania LT 5527.169 4259.951 1267.218 170.9767 1689.379 2361.661 410016 21407.85 46671.1 Luxemburg LU 1270.275 860.9769 409.2979 92.34262 90.09812 810.079 628181.1 32798.73 55983.35 Latvia LV 723.0044 576.1949 146.8095 0 949.2621 323.3572 348987.3 18221.4 44066.12 Malta MT 55.16691 42.40628 12.76063 0 27.40526 28.94623 364754.8 19044.66 44739.14 Netherlands NL 8020.907 5991.578 2029.329 1864.585 2666.638 2440.356 796150.7 41568.8 41083.44 Norway NO 7102.463 4788.851 2313.612 154.9137 1128.122 4127.915 798524.1 41692.72 63254.34 Poland PL 15454.99 11536.31 3918.681 176.41 2925.033 8647.485 319583.3 16686.15 42811.03 Portugal PT 3872.96 2631.954 1241.006 266.4942 455.4891 1714.782 126902 30236.93 27424.23 Romania RO 1811.179 1358.905 452.2741 0 643.4864 1136.648 273913 14301.6 40861.62 Sweden SE 12811.99 9827.073 2984.916 3339.056 1236.751 2887.436 2023670 12587.03 72185.89 Slovenia SI 2928.796 2140.246 788.5506 168.5427 357.6112 1772.363 348949.7 18219.44 44064.52 Slovakia SK 951.6812 718.6233 233.0578 127.1229 148.3746 481.7632 402287.5 21004.33 46341.21 Un. Kingdom UK 36720.7 24291.1 12429.6 2934.179 2018.299 23192.88 806536.3 42111.05 63596.33 Total EUR-29 267903.6 197891 70012.59 0 0 0 706317.7 54334.74 38310 Source: Own estimates based on UNITE, 2002; ProgTrans/IWW, 2007; BFS, 2003; Herry, 2002. Data extrapolated for BG, CY, CZ, EE, LT, LV, MT, NO, PL, RO, SI, SK.

4.288.1/Road infrastructure cost and revenue in Europe – IMPACT D2 April 2008 98
Table 35 Summary indicative average costs by variability and road class
Total by variability €/vkm) Total by road class Country Total Fixed Variable Motorways Trunk roads Local roads
Austria AT 0.072724 0.05694 0.015784 0.050197 0.040972 0,163497 Belgium BE 0.104263 0.068339 0.035924 0.025678 0.022204 0,18608 Bulgaria BG 0.031521 0.023542 0.007979 0.012949 0.011998 0,042923 Switzerland CH 0.079484 0.062056 0.017428 0.065512 0.038195 0,139966 Cyprus CY 0.136655 0.106339 0.030316 0.126784 0.115122 0,140911 Czech Rep. CZ 0.080374 0.059821 0.020552 0.035652 0.034167 0,086783 Germany DE 0.060767 0.04806 0.012707 0.038025 0.044805 0,077797 Denmark DK 0.041237 0.023562 0.017676 0.027522 0.022758 0,027411 Estonia EE 0.666731 0.4745 0.192231 0.21185 0.187526 0,838965 Spain ES 0.028129 0.022797 0.005331 0.046432 0.041669 0,011714 Finland FI 0.095444 0.075923 0.019521 0.087461 0.078515 0,079303 France FR 0.047909 0.036658 0.011251 0.086906 0.016614 0,025939 Greece GR 0.083516 0.061772 0.021744 0.039222 0.034589 0,077493 Hungary HU 0.281575 0.213781 0.067793 0.089888 0.084228 0,422657 Ireland IE 0.264586 0.172956 0.09163 0.05686 0.049666 0,404825 Italy IT 0.070772 0.036682 0.03409 0.041076 0.059416 0,012429 Lithuania LT 0.327684 0.252556 0.075128 0.200483 0.202153 0,308407 Luxemburg LU 0.254773 0.172682 0.082091 0.079792 0.069672 0,319502 Latvia LV 0.081783 0.065176 0.016606 0.158936 0,112749 Malta MT 0.01629 0.012522 0.003768 0.015338 0,018094 Netherlands NL 0.088754 0.066299 0.022455 0.079611 0.079513 0,073033 Norway NO 0.158697 0.107002 0.051695 0.05168 0.043706 0,258868 Poland PL 0.088917 0.066371 0.022545 0.037101 0.035115 0,100831 Portugal PT 0.058741 0.039919 0.018822 0.010083 0.043034 0,059297 Romania RO 0.031058 0.023302 0.007756 0.020578 0,042027 Sweden SE 0.158114 0.121277 0.036837 0.262424 0.028085 0,118967 Slovenia SI 0.282913 0.206742 0.076172 0.109413 0.101521 0,335084 Slovakia SK 0.029465 0.022249 0.007216 0.016978 0.017214 0,029753 Un. Kingd. UK 0.078344 0.051826 0.026519 0.024155 0.020721 0,092835 Total EUR-29 0,069016 0.050979 0.018036 0.181957 0.013997 0.009869 Source: Own estimates based on UNITE, 2002; ProgTrans/IWW, 2007; BFS, 2003; Herry, 2002. Data extrapolated for BG, CY, CZ, EE, LT, LV, MT, NO, PL, RO, SI, SK.

4.288.1/Road infrastructure cost and revenue in Europe – IMPACT D2 April 2008
99
Table 36 I ndicative average infrastructure costs by variability, road type and vehicle
Motorways - Euro per vehicle kilometer Cost type SmallCar BigCar MCycle Bus/Coach LDV/Van HGV5.5t HGV12t HGV24t HGV40t All costs Motorways 0.031247 0.031258 0.023083 0.149188937 0.039423 0.048206 0.068806 0.158116 0.218614 All roads 0.053041 0.053052 0.058449 0.19167081 0.069424 0.068549 0.092099 0.172819 0.229566 Variable costs Motorways 0.001786 0.001796 0.001785 0.097868442 0.001798 0.002384 0.014143 0.090872 0.140357 All roads 0.002063 0.002077 0.003107 0.187632061 0.002936 0.003265 0.022299 0.146495 0.226593 Fixed costs Motorways 0.029461 0.029462 0.021298 0.051320495 0.037625 0.045822 0.054663 0.067244 0.078257 All roads 0.050978 0.050975 0.055343 0.00403875 0.066488 0.065284 0.0698 0.026324 0.002973 Source: Own estimates based on UNITE, 2002; ProgTrans/IWW, 2007; BFS, 2003; Herry, 2002. Data extrapolated for BG, CY, CZ, EE, LT, LV, MT, NO, PL, RO, SI, SK.

4.288.1/Road infrastructure cost and revenue in Europe – IMPACT D2 April 2008 100
Table 37 Indicative average fixed taxes and charges - Motorways
Motorways - Euro per vehicle kilometer Country SmallCar BigCar MCycle Bus/Coach LDV/Van HGV5.5t HGV12t HGV24t HGV40t Austria AT 0.0413 0.032183 0.117215 0.01529525 0.024791 0.028871 0.005554 0.019152 0.012786 Belgium BE 0.020019 0.015014 0.048516 0.007941667 0.008891 0.063592 0.081323 0.083418 0.055615 Bulgaria BG 0.026602 0.020143 0.153178 0.160759152 0.02795 0.0347 0.036038 0.022834 0.015223 Switzerland CH 0.014232 0.010674 0.051695 0.001282216 0.012642 0.018699 0.005129 0.016428 0.016295 Cyprus CY 0.00406 0.003045 0.009744 0.000652514 0.007765 0.040021 0.010005 0.015008 0.016675 Czech Rep. CZ 0.036925 0.027693 0.465548 0 0.071257 0.097888 0.058733 0 0 Germany DE 0.009931 0.007753 0.024896 0.038741167 0.007123 0.005922 0.009895 0.020533 0.020262 Denmark DK 0.086733 0.087156 0.331913 0.085701813 0.051864 0.087419 0.103266 0.128601 0.118055 Estonia EE 0 0 0 0 0 0.003728 0 0.002317 0.001401 Spain ES 0.010093 0.01082 0.03641 0.0086465 0.002938 0.003042 0.001175 0.000226 0.000156 Finland FI 0.012851 0.017221 0.058675 0.01525 0.003194 0.003346 0.0057 0.0126 0.012167 France FR 0.013301 0.009976 0.032003 0.0079807 0.007981 0.00532 0.005936 0.004287 0.003521 Greece GR 0.015611 0.018479 0.0628 0.02355 0.017967 0.009194 0.009233 0.012056 0.010894 Hungary HU 0.060997 0.045748 0.599047 0.126357237 0.0923 0.159095 0.143911 0.122393 0.081595 Ireland IE 0.024625 0.02524 0.0841 0.0194 0.021658 0.005444 0.009807 0.024738 0.016502 Italy IT 0.012288 0.012499 0.040264 0.021803167 0.011307 0.019733 0.002202 0.001677 0.001349 Lithuania LT 0 0 0 1.135211164 0 0.09784 0.058704 0.065227 0.043485 Luxemburg LU 0.005048 0.003786 0.012212 0.002872667 0.004135 0.002386 0.096877 0.10097 0.06838 Latvia LV 0.000746 0.001119 0.00045 0.0055975 0.00168 0.002537 0.001522 0.001866 0.002177 Malta MT 0 0 0 0 0 0 0 0 0 Netherlands NL 0.023558 0.03441 0.09221 0.044211667 0.009562 0.004374 0.048135 0.048965 0.033441 Norway NO 0 0 0 0 0 0 0 0 0 Poland PL 0 0 0 1.114092549 0 0.104351 0.06261 0.182623 0.121748 Portugal PT 0.015941 0.011956 0.059968 0.012695333 0.003255 0.00178 0.001717 0.001993 0.002247 Romania RO 0.000333 0.00025 0.0008 0.005 0.00025 0.003333 0.0006 0.00125 0.000833 Sweden SE 0.003972 0.007205 0.007601 0.06702122 0.007213 0.005868 0.053032 0.068168 0.036827 Slovenia SI 0 0 0 0 0 0 0 0 0 Slovakia SK 0.048587 0.03644 0.207764 0.573354606 0.039804 0.063037 0.037822 0.043856 0.029238 Un. Kingdom UK 0.010161 0.007621 0.009246 0.018304908 0.006096 0.008073 0.004844 0.016886 0.009137 AVERAGE EUR-29 0.013196 0.011726 0.044451 0.029233741 0.00782 0.014088 0.013286 0.017128 0.012925 Sources: ACEA, 2006; EC, 2007b.

4.288.1/Road infrastructure cost and revenue in Europe – IMPACT D2 April 2008
101
Table 38 Indicative average fixed taxes and charges - Trunk Roads
Other trunk roads - Euro per vehicle kilometer Country SmallCar BigCar MCycle Bus/Coach LDV/Van HGV5.5t HGV12t HGV24t HGV40t Austria AT 0.038299 0.029933 0.081359 0.01529525 0.020656 0.028871 0.005554 0.019152 0.012786 Belgium BE 0.020019 0.015014 0.048516 0.007941667 0.008891 0.063592 0.005744 0.00469 0.00313 Bulgaria BG 0.02407 0.018244 0.078108 0.081588541 0.02174 0.066327 0.072092 0.045367 0.030245 Switzerland CH 0.00748 0.00561 0.017951 0.001282216 0.005449 0.018699 0.005129 0.016428 0.016295 Cyprus CY 0.00406 0.003045 0.009744 0.000652514 0.007765 0.040021 0.010005 0.015008 0.016675 Czech Rep. CZ 0 0 0 0 0 0 0 0 0 Germany DE 0.009931 0.007753 0.024896 0.038741167 0.007123 0.005922 0.009895 0.020533 0.020262 Denmark DK 0.086733 0.087156 0.331913 0.085701813 0.051864 0.087419 0.040443 0.063161 0.074428 Estonia EE 0 0 0 0 0 0.003728 0 0.002317 0.001401 Spain ES 0.010093 0.01082 0.03641 0.0086465 0.002938 0.003042 0.001175 0.000226 0.000156 Finland FI 0.012851 0.017221 0.058675 0.01525 0.003194 0.003346 0.0057 0.0126 0.012167 France FR 0.013301 0.009976 0.032003 0.0079807 0.007981 0.00532 0.005936 0.004287 0.003521 Greece GR 0.015611 0.018479 0.0628 0.02355 0.017967 0.009194 0.009233 0.012056 0.010894 Hungary HU 0.001303 0.000977 0.001407 0.021110242 0.002346 0.001042 0.001564 0.000489 0.000326 Ireland IE 0.024625 0.02524 0.0841 0.0194 0.021658 0.005444 0.009807 0.024738 0.016502 Italy IT 0.012288 0.012499 0.040264 0.021803167 0.011307 0.019733 0.002202 0.001677 0.001349 Lithuania LT 0 0 0 0 0 0 0 0 0 Luxemburg LU 0.005048 0.003786 0.012212 0.002872667 0.004135 0.002386 0.001822 0.001954 0.002369 Latvia LV 0.000746 0.001119 0.00045 0.0055975 0.00168 0.002537 0.001522 0.001866 0.002177 Malta MT 0 0 0 0 0 0 0 0 0 Netherlands NL 0.023558 0.03441 0.09221 0.044211667 0.009562 0.004374 0.004983 0.004014 0.003473 Norway NO 0 0 0 0 0 0 0 0 0 Poland PL 0 0 0 0 0 0 0 0 0 Portugal PT 0.015941 0.011956 0.059968 0.012695333 0.003255 0.00178 0.001717 0.001993 0.002247 Romania RO 0.000333 0.00025 0.0008 0.005 0.00025 0.003333 0.0006 0.00125 0.000833 Sweden SE 0.003972 0.007205 0.007601 0.06702122 0.007213 0.005868 0 0.012927 0 Slovenia SI 0 0 0 0 0 0 0 0 0 Slovakia SK 0.036203 0.027153 0.086888 0.020059068 0.020658 0.012841 0.007704 0.004815 0.00321 Un. Kingdom UK 0.010161 0.007621 0.009246 0.018304908 0.006096 0.008073 0.004844 0.016886 0.009137 Average EUR-29 0.012439 0.011159 0.037632 0.019057515 0.006834 0.010356 0.005461 0.008547 0.007204 Sources: ACEA, 2006; EC, 2007b.

4.288.1/Road infrastructure cost and revenue in Europe – IMPACT D2 April 2008 102
Table 39 Indicative average fixed taxes and charges - Local Roads Urban roads - Euro per vehicle kilometer Country
SmallCar BigCar MCycle Bus/Coach LDV/Van HGV5.5t HGV12t HGV24t HGV40t Austria AT 0.04508 0.035018 0.07796 0.01529525 0.026467 0.028871 0.005554 0.019152 0.012786 Belgium BE 0.020019 0.015014 0.048516 0.007941667 0.008891 0.063592 0.005744 0.00469 0.00313 Bulgaria BG 0.02382 0.018057 0.049872 0.027541565 0.012368 0.022224 0.021815 0.013944 0.009296 Switzerland CH 0.00748 0.00561 0.017951 0.001282216 0.005449 0.018699 0.005129 0.016428 0.016295 Cyprus CY 0.00406 0.003045 0.009744 0.000652514 0.007765 0.040021 0.010005 0.015008 0.016675 Czech Rep. CZ 0 0 0 0 0 0 0 0 0 Germany DE 0.009931 0.007753 0.024896 0.038741167 0.007123 0.005922 0.009895 0.020533 0.020262 Denmark DK 0.086733 0.087156 0.331913 0.085701813 0.051864 0.087419 0.040443 0.063161 0.074428 Estonia EE 0 0 0 0 0 0.003728 0 0.002317 0.001401 Spain ES 0.010093 0.01082 0.03641 0.0086465 0.002938 0.003042 0.001175 0.000226 0.000156 Finland FI 0.012851 0.017221 0.058675 0.01525 0.003194 0.003346 0.0057 0.0126 0.012167 France FR 0.013301 0.009976 0.032003 0.0079807 0.007981 0.00532 0.005936 0.004287 0.003521 Greece GR 0.015611 0.018479 0.0628 0.02355 0.017967 0.009194 0.009233 0.012056 0.010894 Hungary HU 0.001303 0.000977 0.001407 0.021110242 0.002346 0.001042 0.001564 0.000489 0.000326 Ireland IE 0.024625 0.02524 0.0841 0.0194 0.021658 0.005444 0.009807 0.024738 0.016502 Italy IT 0.012288 0.012499 0.040264 0.021803167 0.011307 0.019733 0.002202 0.001677 0.001349 Lithuania LT 0 0 0 0 0 0 0 0 0 Luxemburg LU 0.005048 0.003786 0.012212 0.002872667 0.004135 0.002386 0.001822 0.001954 0.002369 Latvia LV 0.000746 0.001119 0.00045 0.0055975 0.00168 0.002537 0.001522 0.001866 0.002177 Malta MT 0 0 0 0 0 0 0 0 0 Netherlands NL 0.023558 0.03441 0.09221 0.044211667 0.009562 0.004374 0.004983 0.004014 0.003473 Norway NO 0 0 0 0 0 0 0 0 0 Poland PL 0 0 0 0 0 0 0 0 0 Portugal PT 0.015941 0.011956 0.059968 0.012695333 0.003255 0.00178 0.001717 0.001993 0.002247 Romania RO 0.000333 0.00025 0.0008 0.005 0.00025 0.003333 0.0006 0.00125 0.000833 Sweden SE 0.003972 0.007205 0.007601 0.06702122 0.007213 0.005868 0 0.012927 0 Slovenia SI 0 0 0 0 0 0 0 0 0 Slovakia SK 0.036203 0.027153 0.086888 0.020059068 0.020658 0.012841 0.007704 0.004815 0.00321 Un. Kingdom UK 0.010161 0.007621 0.009246 0.018304908 0.006096 0.008073 0.004844 0.016886 0.009137 Average EUR-29 0.012416 0.011142 0.037277 0.018318697 0.006761 0.01009 0.005158 0.008358 0.007078 Sources: ACEA, 2006; EC, 2007b.

4.288.1/Road infrastructure cost and revenue in Europe – IMPACT D2 April 2008
103
Table 40 Indicative average fixed taxes and charges - SUMMARY
Summary by vehicle type (€/vkm) Summary by network Revenues Country SmallCar BigCar MCycle Bus/Coach LDV/Van HGV5.5t HGV12t HGV24t HGV40t Motorways Trunk Urban All mill. € Austria AT 0.041149 0.03207 0.08375 0.01529525 0.023387 0.028871 0.005554 0.019152 0.012786 0.033956 0.033338 0.038975 0.03508 2489.154 Belgium BE 0.020019 0.015014 0.048516 0.007941667 0.008891 0.063592 0.020744 0.020315 0.013547 0.021201 0.018201 0.016123 0.01863 1954.575 Bulgaria BG 0.024666 0.018691 0.061346 0.048504436 0.015241 0.032336 0.033343 0.021149 0.0141 0.027267 0.026416 0.019952 0.02352 519.6526 Switzerland CH 0.00949 0.007118 0.022777 0.001282216 0.006656 0.018699 0.005129 0.016428 0.016295 0.012982 0.007276 0.007205 0.008978 553.5947 Cyprus CY 0.00406 0.003045 0.009744 0.000652514 0.007765 0.040021 0.010005 0.015008 0.016675 0.006624 0.005229 0.005831 0.005873 18.00046 Czech Rep. CZ 0.003192 0.002394 0.00766 0 0.001915 0.009931 0.005958 0 0 0.036853 0 0 0.002819 209.8476 Germany DE 0.009931 0.007753 0.024896 0.038741167 0.007123 0.005922 0.009895 0.020533 0.020262 0.01044 0.010173 0.010247 0.010289 7234.124 Denmark DK 0.086733 0.087156 0.331913 0.085701813 0.051864 0.087419 0.055443 0.078786 0.084845 0.089229 0.086644 0.08498 0.086671 4200.983 Estonia EE 0 0 0 0 0 0.003728 0 0.002317 0.001401 0.000177 6.66E-05 0.000312 0.000192 0.800775 Spain ES 0.010093 0.01082 0.03641 0.0086465 0.002938 0.003042 0.001175 0.000226 0.000156 0.007125 0.00827 0.008059 0.00772 2558.606 Finland FI 0.012851 0.017221 0.058675 0.01525 0.003194 0.003346 0.0057 0.0126 0.012167 0.013369 0.013805 0.013394 0.013638 783.2009 France FR 0.013301 0.009976 0.032003 0.0079807 0.007981 0.00532 0.005936 0.004287 0.003521 0.010956 0.011665 0.010652 0.011044 7573.69 Greece GR 0.015611 0.018479 0.0628 0.02355 0.017967 0.009194 0.009233 0.012056 0.010894 0.016951 0.019229 0.02316 0.021357 1820.716 Hungary HU 0.00497 0.003727 0.010207 0.023310242 0.004546 0.015458 0.014547 0.011607 0.007738 0.074911 0.001543 0.002028 0.006036 283.3718 Ireland IE 0.024625 0.02524 0.0841 0.0194 0.021658 0.005444 0.009807 0.024738 0.016502 0.024168 0.024637 0.022391 0.023659 721.8077 Italy IT 0.012288 0.012499 0.040264 0.021803167 0.011307 0.019733 0.002202 0.001677 0.001349 0.012022 0.012957 0.015717 0.013968 6871.201 Lithuania LT 0 0 0 0.023145 0 0.008679 0.005208 0.005786 0.003858 0.021823 0 0 0.001103 18.61076 Luxemburg LU 0.005048 0.003786 0.012212 0.002872667 0.004135 0.002386 0.016822 0.017579 0.012786 0.00959 0.004587 0.004367 0.005637 28.10359 Latvia LV 0.000746 0.001119 0.00045 0.0055975 0.00168 0.002537 0.001522 0.001866 0.002177 #DEEL/0! 0.00137 0.00124 0.001328 11.73802 Malta MT 0 0 0 0 0 0 0 0 0 #DEEL/0! 0 0 0 0 Netherlands NL 0.023558 0.03441 0.09221 0.044211667 0.009562 0.004374 0.019983 0.019639 0.01389 0.029964 0.025754 0.024404 0.026346 2380.939 Norway NO 0 0 0 0 0 0 0 0 0 0 0 0 0 0 Poland PL 0 0 0 0.0092395 0 0.00396 0.002376 0.00693 0.00462 0.029471 0 0 0.000806 140.1291 Portugal PT 0.015941 0.011956 0.059968 0.012695333 0.003255 0.00178 0.001717 0.001993 0.002247 0.012181 0.014679 0.014474 0.013588 895.8912 Romania RO 0.000333 0.00025 0.0008 0.005 0.00025 0.003333 0.0006 0.00125 0.000833 #DEEL/0! 0.000475 0.00058 0.000524 30.53756 Sweden SE 0.003972 0.007205 0.007601 0.06702122 0.007213 0.005868 0.015 0.028552 0.010417 0.010735 0.00574 0.006348 0.006707 543.4433 Slovenia SI 0 0 0 0 0 0 0 0 0 0 0 0 0 0 Slovakia SK 0.039458 0.029594 0.0947 0.069766068 0.022611 0.028818 0.017291 0.017242 0.011495 0.046711 0.02846 0.023872 0.030391 981.5931 Un. Kingdom UK 0.010161 0.007621 0.009246 0.018304908 0.006096 0.008073 0.004844 0.016886 0.009137 0.009325 0.009302 0.009075 0.009187 4306.055 Average EUR-29 0.012621 0.011296 0.03777 0.019968298 0.006901 0.011278 0.007532 0.010895 0.008769 0.01296 0.011947 0.011855 0.012141 47130.37 Sources: ACEA, 2006; EC, 2007b.

4.288.1/Road infrastructure cost and revenue in Europe – IMPACT D2 April 2008 104
Table 41 Indicative average variable taxes and charges per vehicle category - Motorways
Motorways - Euro per vehicle kilometer Country SmallCar BigCar MCycle Bus/Coach LDV/Van HGV5.5t HGV12t HGV24t HGV40t Austria AT 0.00834 0.01251 0.004153 0.02085 0.01251 0.138446 0.190489 0.280484 0.284259 Belgium BE 0.011951 0.017691 0.005146 0.032925913 0.017691 0.030527 0.033927 0.037327 0.041577 Bulgaria BG 0.01902 0.028531 0.010405 0.047551 0.028531 0.037836 0.045403 0.05297 0.062429 Switzerland CH 0.00936 0.01404 0.0067 0.0234005 0.01404 0.024594 0.029544 0.034308 0.040398 Cyprus CY 0 0 0 0 0 0 0 0 0 Czech Rep. CZ 0.008221 0.012332 0.00475 0.0205525 0.012332 0.017272 0.020726 0.02418 0.028498 Germany DE 0.01308 0.01962 0.006468 0.0327 0.01962 0.179337 0.196026 0.20073 0.158667 Denmark DK 0.010914 0.01637 0.004572 0.027284 0.026203 0.034249 0.054912 0.078413 0.08257 Estonia EE 0.00576 0.00864 0.003369 0.0144 0.00864 0.01225 0.0147 0.01715 0.020213 Spain ES 0.023355 0.027312 0.019481 0.037120262 0.027312 0.032029 0.034967 0.041907 0.04558 Finland FI 0.011752 0.017628 0.004392 0.02938 0.017628 0.01597 0.019164 0.022358 0.026351 France FR 0.048394 0.054286 0.093597 0.189505895 0.10554 0.180891 0.18506 0.242578 0.247789 Greece GR 0.009351 0.012311 0.006799 0.01736657 0.012311 0.019719 0.022169 0.026646 0.029709 Hungary HU 0.00821 0.012314 0.004838 0.020524 0.012314 0.017592 0.02111 0.024629 0.029027 Ireland IE 0.008854 0.013281 0.00506 0.022135 0.01366 0.019576 0.023256 0.027267 0.031867 Italy IT 0.042775 0.048415 0.037173 0.132401437 0.048415 0.118599 0.170662 0.257528 0.26269 Lithuania LT 0.0062 0.0093 0.003575 0.0155 0.0093 0.013 0.0156 0.0182 0.02145 Luxemburg LU 0.00884 0.01326 0.003836 0.0221 0.01326 0.01395 0.01674 0.01953 0.023018 Latvia LV 0.0062 0.0093 0.003575 0.0155 0.0093 0.013 0.0156 0.0182 0.02145 Malta MT 0 0 0 0 0 0 0 0 0 Netherlands NL 0.013468 0.020168 0.005156 0.033528528 0.02031 0.018587 0.022768 0.028297 0.032922 Norway NO 0 0 0 0 0 0.203542 0.203542 0.203542 0.203542 Poland PL 0.00712 0.01068 0.003988 0.0178 0.01068 0.0145 0.0174 0.0203 0.023925 Portugal PT 0.033298 0.038628 0.026956 0.031989145 0.038628 0.03587 0.03901 0.044523 0.048448 Romania RO 0.006376 0.009564 0.003565 0.01593975 0.009564 0.012965 0.015558 0.018151 0.021392 Sweden SE 0.010536 0.015805 0.00532 0.026341 0.015805 0.019347 0.023216 0.027085 0.031922 Slovenia SI 0.189356 0.192956 0.186322 0.197134649 0.192956 0.347829 0.350859 0.507433 0.51122 Slovakia SK 0.008248 0.012372 0.005305 0.0206205 0.012372 0.01929 0.023148 0.027006 0.031829 Un. Kingdom UK 0.014966 0.021786 0.010855 0.037540997 0.021786 0.038091 0.045021 0.051951 0.060613 Average EUR-29 0.022451 0.028021 0.023331 0.041128911 0.038442 0.099605 0.112334 0.133419 0.125275 Sources: ACEA, 2006; EC, 2007b.

4.288.1/Road infrastructure cost and revenue in Europe – IMPACT D2 April 2008
105
Table 42 Indicative average variable taxes and charges per vehicle category - Trunk Roads
Other trunk roads - Euro per vehicle kilometer Country SmallCar BigCar MCycle Bus/Coach LDV/Van HGV5.5t HGV12t HGV24t HGV40t Austria AT 0.00834 0.01251 0.004153 0.02085 0.01251 0.0151 0.01812 0.02114 0.024915 Belgium BE 0.01148 0.01722 0.004675 0.0287 0.01722 0.017 0.0204 0.0238 0.02805 Bulgaria BG 0.01902 0.028531 0.010405 0.047551 0.028531 0.037836 0.045403 0.05297 0.062429 Switzerland CH 0.00936 0.01404 0.0067 0.0234005 0.01404 0.027992 0.034075 0.037253 0.043344 Cyprus CY 0 0 0 0 0 0 0 0 0 Czech Rep. CZ 0.008221 0.012332 0.00475 0.0205525 0.012332 0.017272 0.020726 0.02418 0.028498 Germany DE 0.01308 0.01962 0.006468 0.0327 0.01962 0.02352 0.028224 0.032928 0.038808 Denmark DK 0.010914 0.01637 0.004572 0.027284 0.01637 0.016625 0.01995 0.023275 0.027431 Estonia EE 0.00576 0.00864 0.003369 0.0144 0.00864 0.01225 0.0147 0.01715 0.020213 Spain ES 0.007914 0.011871 0.004041 0.0197845 0.011871 0.014693 0.017632 0.02057 0.024243 Finland FI 0.011752 0.017628 0.004392 0.02938 0.017628 0.01597 0.019164 0.022358 0.026351 France FR 0.011784 0.017676 0.005732 0.02946 0.017676 0.020845 0.025014 0.029183 0.034394 Greece GR 0.00592 0.00888 0.003369 0.0148 0.00888 0.01225 0.0147 0.01715 0.020213 Hungary HU 0.00821 0.012314 0.004838 0.020524 0.012314 0.017592 0.02111 0.024629 0.029027 Ireland IE 0.008854 0.013281 0.00506 0.022135 0.013281 0.0184 0.02208 0.02576 0.03036 Italy IT 0.01128 0.01692 0.005679 0.0282 0.01692 0.02065 0.02478 0.02891 0.034073 Lithuania LT 0.0062 0.0093 0.003575 0.0155 0.0093 0.013 0.0156 0.0182 0.02145 Luxemburg LU 0.00884 0.01326 0.003836 0.0221 0.01326 0.01395 0.01674 0.01953 0.023018 Latvia LV 0.0062 0.0093 0.003575 0.0155 0.0093 0.013 0.0156 0.0182 0.02145 Malta MT 0 0 0 0 0 0 0 0 0 Netherlands NL 0.0134 0.0201 0.005088 0.0335 0.0201 0.0185 0.0222 0.0259 0.030525 Norway NO 0 0 0 0 0 4.408176 4.408176 4.408176 4.408176 Poland PL 0.00712 0.01068 0.003988 0.0178 0.01068 0.0145 0.0174 0.0203 0.023925 Portugal PT 0.01066 0.01599 0.004318 0.02665 0.01599 0.0157 0.01884 0.02198 0.025905 Romania RO 0.006376 0.009564 0.003565 0.01593975 0.009564 0.012965 0.015558 0.018151 0.021392 Sweden SE 0.010536 0.015805 0.00532 0.026341 0.015805 0.019347 0.023216 0.027085 0.031922 Slovenia SI 0.0072 0.0108 0.004166 0.018 0.0108 0.01515 0.01818 0.02121 0.024998 Slovakia SK 0.008248 0.012372 0.005305 0.0206205 0.012372 0.01929 0.023148 0.027006 0.031829 Un. Kingdom UK 0.01364 0.02046 0.009529 0.0341 0.02046 0.03465 0.04158 0.04851 0.057173 Average EUR-29 0.011139 0.016708 0.005397 0.02659173 0.015369 0.035181 0.039221 0.043221 0.04825 Sources: ACEA, 2006; EC, 2007b.

4.288.1/Road infrastructure cost and revenue in Europe – IMPACT D2 April 2008 106
Table 43 Indicative average variable taxes and charges per vehicle category - Local Roads
Urban roads - Euro per vehicle kilometer Country SmallCar BigCar MCycle Bus/Coach LDV/Van HGV5.5t HGV12t HGV24t HGV40t Austria AT 0.00834 0.01251 0.004153 0.02085 0.01251 0.0151 0.01812 0.02114 0.024915 Belgium BE 0.01148 0.01722 0.004675 0.0287 0.01722 0.017 0.0204 0.0238 0.02805 Bulgaria BG 0.01902 0.028531 0.010405 0.047551 0.028531 0.037836 0.045403 0.05297 0.062429 Switzerland CH 0.00936 0.01404 0.0067 0.0234005 0.01404 0.038043 0.047476 0.045964 0.052054 Cyprus CY 0 0 0 0 0 0 0 0 0 Czech Rep. CZ 0.008221 0.012332 0.00475 0.0205525 0.012332 0.017272 0.020726 0.02418 0.028498 Germany DE 0.01308 0.01962 0.006468 0.0327 0.01962 0.02352 0.028224 0.032928 0.038808 Denmark DK 0.010914 0.01637 0.004572 0.027284 0.01637 0.016625 0.01995 0.023275 0.027431 Estonia EE 0.00576 0.00864 0.003369 0.0144 0.00864 0.01225 0.0147 0.01715 0.020213 Spain ES 0.007914 0.011871 0.004041 0.0197845 0.011871 0.014693 0.017632 0.02057 0.024243 Finland FI 0.011752 0.017628 0.004392 0.02938 0.017628 0.01597 0.019164 0.022358 0.026351 France FR 0.011784 0.017676 0.005732 0.02946 0.017676 0.020845 0.025014 0.029183 0.034394 Greece GR 0.00592 0.00888 0.003369 0.0148 0.00888 0.01225 0.0147 0.01715 0.020213 Hungary HU 0.00821 0.012314 0.004838 0.020524 0.012314 0.017592 0.02111 0.024629 0.029027 Ireland IE 0.008854 0.013281 0.00506 0.022135 0.013281 0.0184 0.02208 0.02576 0.03036 Italy IT 0.01128 0.01692 0.005679 0.0282 0.01692 0.02065 0.02478 0.02891 0.034073 Lithuania LT 0.0062 0.0093 0.003575 0.0155 0.0093 0.013 0.0156 0.0182 0.02145 Luxemburg LU 0.00884 0.01326 0.003836 0.0221 0.01326 0.01395 0.01674 0.01953 0.023018 Latvia LV 0.0062 0.0093 0.003575 0.0155 0.0093 0.013 0.0156 0.0182 0.02145 Malta MT 0 0 0 0 0 0 0 0 0 Netherlands NL 0.0134 0.0201 0.005088 0.0335 0.0201 0.0185 0.0222 0.0259 0.030525 Norway NO 0 0 0 0 0 0 0 0 0 Poland PL 0.00712 0.01068 0.003988 0.0178 0.01068 0.0145 0.0174 0.0203 0.023925 Portugal PT 0.01066 0.01599 0.004318 0.02665 0.01599 0.0157 0.01884 0.02198 0.025905 Romania RO 0.006376 0.009564 0.003565 0.01593975 0.009564 0.012965 0.015558 0.018151 0.021392 Sweden SE 0.010536 0.015805 0.00532 0.026341 0.015805 0.019347 0.023216 0.027085 0.031922 Slovenia SI 0.0072 0.0108 0.004166 0.018 0.0108 0.01515 0.01818 0.02121 0.024998 Slovakia SK 0.008248 0.012372 0.005305 0.0206205 0.012372 0.01929 0.023148 0.027006 0.031829 Un. Kingdom UK 0.01364 0.02046 0.009529 0.0341 0.02046 0.03465 0.04158 0.04851 0.057173 Average EUR-29 0.011139 0.016708 0.005397 0.02659173 0.015369 0.020149 0.024183 0.028191 0.03322 Sources: ACEA, 2006; EC (2007b.
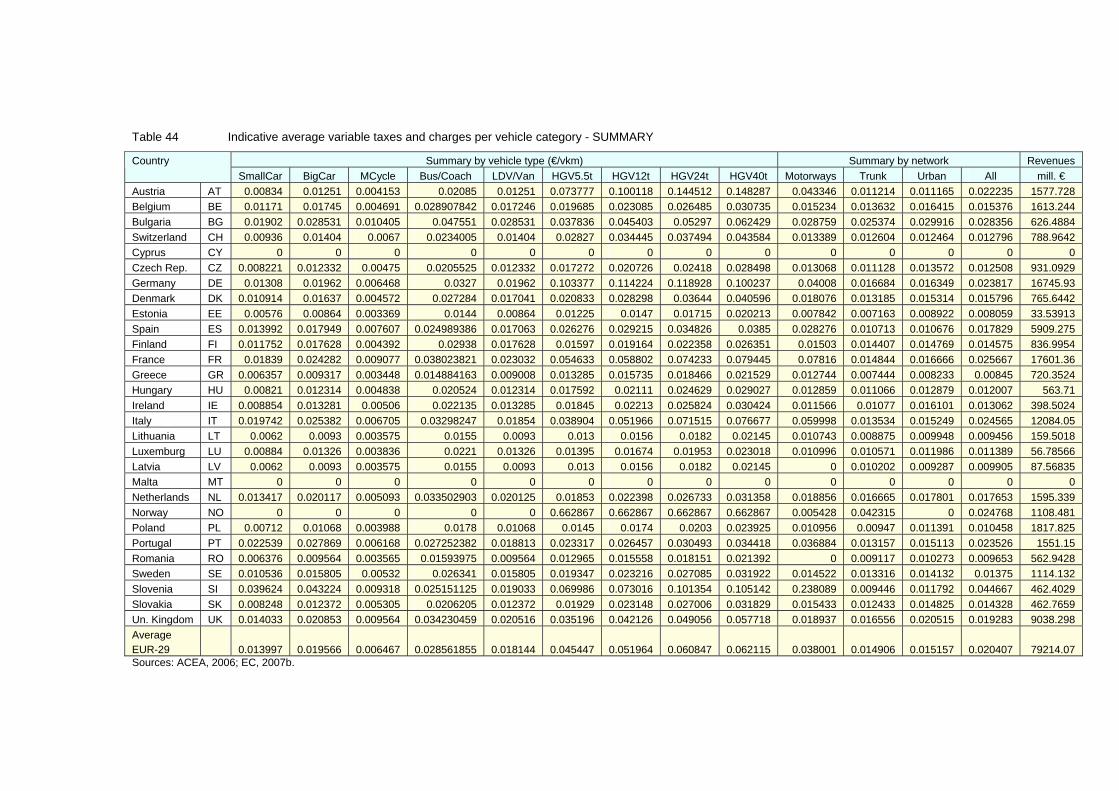
4.288.1/Road infrastructure cost and revenue in Europe – IMPACT D2 April 2008
107
Table 44 Indicative average variable taxes and charges per vehicle category - SUMMARY
Summary by vehicle type (€/vkm) Summary by network Revenues Country SmallCar BigCar MCycle Bus/Coach LDV/Van HGV5.5t HGV12t HGV24t HGV40t Motorways Trunk Urban All mill. € Austria AT 0.00834 0.01251 0.004153 0.02085 0.01251 0.073777 0.100118 0.144512 0.148287 0.043346 0.011214 0.011165 0.022235 1577.728 Belgium BE 0.01171 0.01745 0.004691 0.028907842 0.017246 0.019685 0.023085 0.026485 0.030735 0.015234 0.013632 0.016415 0.015376 1613.244 Bulgaria BG 0.01902 0.028531 0.010405 0.047551 0.028531 0.037836 0.045403 0.05297 0.062429 0.028759 0.025374 0.029916 0.028356 626.4884 Switzerland CH 0.00936 0.01404 0.0067 0.0234005 0.01404 0.02827 0.034445 0.037494 0.043584 0.013389 0.012604 0.012464 0.012796 788.9642 Cyprus CY 0 0 0 0 0 0 0 0 0 0 0 0 0 0 Czech Rep. CZ 0.008221 0.012332 0.00475 0.0205525 0.012332 0.017272 0.020726 0.02418 0.028498 0.013068 0.011128 0.013572 0.012508 931.0929 Germany DE 0.01308 0.01962 0.006468 0.0327 0.01962 0.103377 0.114224 0.118928 0.100237 0.04008 0.016684 0.016349 0.023817 16745.93 Denmark DK 0.010914 0.01637 0.004572 0.027284 0.017041 0.020833 0.028298 0.03644 0.040596 0.018076 0.013185 0.015314 0.015796 765.6442 Estonia EE 0.00576 0.00864 0.003369 0.0144 0.00864 0.01225 0.0147 0.01715 0.020213 0.007842 0.007163 0.008922 0.008059 33.53913 Spain ES 0.013992 0.017949 0.007607 0.024989386 0.017063 0.026276 0.029215 0.034826 0.0385 0.028276 0.010713 0.010676 0.017829 5909.275 Finland FI 0.011752 0.017628 0.004392 0.02938 0.017628 0.01597 0.019164 0.022358 0.026351 0.01503 0.014407 0.014769 0.014575 836.9954 France FR 0.01839 0.024282 0.009077 0.038023821 0.023032 0.054633 0.058802 0.074233 0.079445 0.07816 0.014844 0.016666 0.025667 17601.36 Greece GR 0.006357 0.009317 0.003448 0.014884163 0.009008 0.013285 0.015735 0.018466 0.021529 0.012744 0.007444 0.008233 0.00845 720.3524 Hungary HU 0.00821 0.012314 0.004838 0.020524 0.012314 0.017592 0.02111 0.024629 0.029027 0.012859 0.011066 0.012879 0.012007 563.71 Ireland IE 0.008854 0.013281 0.00506 0.022135 0.013285 0.01845 0.02213 0.025824 0.030424 0.011566 0.01077 0.016101 0.013062 398.5024 Italy IT 0.019742 0.025382 0.006705 0.03298247 0.01854 0.038904 0.051966 0.071515 0.076677 0.059998 0.013534 0.015249 0.024565 12084.05 Lithuania LT 0.0062 0.0093 0.003575 0.0155 0.0093 0.013 0.0156 0.0182 0.02145 0.010743 0.008875 0.009948 0.009456 159.5018 Luxemburg LU 0.00884 0.01326 0.003836 0.0221 0.01326 0.01395 0.01674 0.01953 0.023018 0.010996 0.010571 0.011986 0.011389 56.78566 Latvia LV 0.0062 0.0093 0.003575 0.0155 0.0093 0.013 0.0156 0.0182 0.02145 0 0.010202 0.009287 0.009905 87.56835 Malta MT 0 0 0 0 0 0 0 0 0 0 0 0 0 0 Netherlands NL 0.013417 0.020117 0.005093 0.033502903 0.020125 0.01853 0.022398 0.026733 0.031358 0.018856 0.016665 0.017801 0.017653 1595.339 Norway NO 0 0 0 0 0 0.662867 0.662867 0.662867 0.662867 0.005428 0.042315 0 0.024768 1108.481 Poland PL 0.00712 0.01068 0.003988 0.0178 0.01068 0.0145 0.0174 0.0203 0.023925 0.010956 0.00947 0.011391 0.010458 1817.825 Portugal PT 0.022539 0.027869 0.006168 0.027252382 0.018813 0.023317 0.026457 0.030493 0.034418 0.036884 0.013157 0.015113 0.023526 1551.15 Romania RO 0.006376 0.009564 0.003565 0.01593975 0.009564 0.012965 0.015558 0.018151 0.021392 0 0.009117 0.010273 0.009653 562.9428 Sweden SE 0.010536 0.015805 0.00532 0.026341 0.015805 0.019347 0.023216 0.027085 0.031922 0.014522 0.013316 0.014132 0.01375 1114.132 Slovenia SI 0.039624 0.043224 0.009318 0.025151125 0.019033 0.069986 0.073016 0.101354 0.105142 0.238089 0.009446 0.011792 0.044667 462.4029 Slovakia SK 0.008248 0.012372 0.005305 0.0206205 0.012372 0.01929 0.023148 0.027006 0.031829 0.015433 0.012433 0.014825 0.014328 462.7659 Un. Kingdom UK 0.014033 0.020853 0.009564 0.034230459 0.020516 0.035196 0.042126 0.049056 0.057718 0.018937 0.016556 0.020515 0.019283 9038.298 Average EUR-29 0.013997 0.019566 0.006467 0.028561855 0.018144 0.045447 0.051964 0.060847 0.062115 0.038001 0.014906 0.015157 0.020407 79214.07 Sources: ACEA, 2006; EC, 2007b.

4.288.1/Road infrastructure cost and revenue in Europe – IMPACT D2 April 2008 108
Table 45 Indicative average revenues per vehicle category (tolled and non-tolled road network)
Average by revenue category €/vkm) Country Acquisition Ownership Insurance Fuel Vignettes Tolls Fixed Variable Total Austria AT 0.0111 0.0251 0.0030 0.0229 0.0139 0.0108 0.0532 0.0337 0.0869 Belgium BE 0.0006 0.0171 0.0085 0.0297 0.0013 0.0005 0.0275 0.0302 0.0577 Bulgaria BG 0.0000 0.0008 0.0126 0.0567 0.0106 0.0000 0.0239 0.0567 0.0806 Switzerland CH 0.0000 0.0145 0.0000 0.0252 0.0017 0.0002 0.0162 0.0254 0.0416 Cyprus CY 0.0000 0.0117 0.0000 0.0000 0.0000 0.0000 0.0117 0.0000 0.0117 Czech Rep. CZ 0.0000 0.0000 0.0000 0.0250 0.0028 0.0000 0.0028 0.0250 0.0278 Germany DE 0.0001 0.0111 0.0047 0.0339 0.0000 0.0069 0.0159 0.0408 0.0567 Denmark DK 0.0971 0.0472 0.0131 0.0288 0.0014 0.0014 0.1588 0.0302 0.1891 Estonia EE 0.0000 0.0004 0.0000 0.0161 0.0000 0.0000 0.0004 0.0161 0.0165 Spain ES 0.0067 0.0068 0.0010 0.0224 0.0000 0.0066 0.0145 0.0290 0.0435 Finland FI 0.0171 0.0102 0.0000 0.0291 0.0000 0.0000 0.0273 0.0291 0.0564 France FR 0.0001 0.0004 0.0108 0.0319 0.0000 0.0097 0.0113 0.0416 0.0529 Greece GR 0.0269 0.0158 0.0000 0.0160 0.0000 0.0004 0.0427 0.0165 0.0592 Hungary HU 0.0000 0.0035 0.0000 0.0240 0.0043 0.0000 0.0078 0.0240 0.0318 Ireland IE 0.0165 0.0308 0.0000 0.0261 0.0000 0.0000 0.0473 0.0261 0.0734 Italy IT 0.0020 0.0121 0.0069 0.0290 0.0000 0.0101 0.0210 0.0391 0.0601 Lithuania LT 0.0000 0.0000 0.0000 0.0189 0.0011 0.0000 0.0011 0.0189 0.0200 Luxemburg LU 0.0001 0.0049 0.0019 0.0228 0.0012 0.0000 0.0082 0.0228 0.0309 Latvia LV 0.0000 0.0027 0.0000 0.0198 0.0000 0.0000 0.0027 0.0198 0.0225 Malta MT 0.0000 0.0000 0.0000 0.0000 0.0000 0.0000 0.0000 0.0000 0.0000 Netherlands NL 0.0259 0.0223 0.0000 0.0350 0.0022 0.0001 0.0505 0.0352 0.0856 Norway NO 0.0000 0.0000 0.0000 0.0000 0.0000 0.0248 0.0000 0.0248 0.0248 Poland PL 0.0000 0.0000 0.0000 0.0209 0.0008 0.0000 0.0008 0.0209 0.0217 Portugal PT 0.0218 0.0054 0.0000 0.0291 0.0000 0.0090 0.0272 0.0381 0.0652 Romania RO 0.0000 0.0010 0.0000 0.0193 0.0000 0.0000 0.0010 0.0193 0.0204 Sweden SE 0.0000 0.0117 0.0000 0.0275 0.0008 0.0000 0.0126 0.0275 0.0401 Slovenia SI 0.0000 0.0000 0.0000 0.0217 0.0000 0.0338 0.0000 0.0555 0.0555 Slovakia SK 0.0000 0.0049 0.0226 0.0287 0.0054 0.0000 0.0328 0.0287 0.0615 Un. Kingdom UK 0.0002 0.0181 0.0000 0.0378 0.0000 0.0004 0.0184 0.0382 0.0566 Total EUR-29 0.0043 0.0098 0.0044 0.0296 0.0007 0.0056 0.0192 0.0352 0.0544 Sources: ACEA, 2006; EC, 2007b.

4.288.1/Road infrastructure cost and revenue in Europe – IMPACT D2 April 2008
109
Table 46 Indicative total revenues per vehicle category (tolled and non-tolled road network)
Total by revenue category €/vkm) Country Acquisition Ownership Insurance Fuel Vignettes Tolls Fixed Variable Total Austria AT 784.8 1784.3 215.4 1628.1 989.2 763.7 3773.7 2391.8 6165.5 Belgium BE 64.2 1792.0 887.6 3120.6 138.9 52.9 2882.7 3173.5 6056.2 Bulgaria BG 0.0 16.8 277.7 1253.0 233.5 0.0 528.1 1253.0 1781.0 Switzerland CH 0.0 892.4 0.0 1555.8 107.4 11.1 999.8 1566.9 2566.7 Cyprus CY 0.0 36.0 0.0 0.0 0.0 0.0 36.0 0.0 36.0 Czech Rep. CZ 0.0 0.0 0.0 1862.2 209.8 0.0 209.8 1862.2 2072.0 Germany DE 90.3 7827.0 3275.5 23844.1 0.0 4823.9 11192.8 28668.0 39860.8 Denmark DK 4707.7 2289.3 635.9 1396.5 66.5 67.4 7699.5 1463.9 9163.4 Estonia EE 0.0 1.6 0.0 67.1 0.0 0.0 1.6 67.1 68.7 Spain ES 2224.3 2241.2 325.9 7429.4 0.0 2194.6 4791.4 9624.0 14415.3 Finland FI 983.2 583.2 0.0 1674.0 0.0 0.0 1566.4 1674.0 3240.4 France FR 77.5 269.7 7400.1 21881.8 0.0 6660.5 7747.3 28542.3 36289.6 Greece GR 2295.8 1345.7 0.0 1368.0 0.0 36.3 3641.4 1404.4 5045.8 Hungary HU 0.0 164.8 0.0 1127.4 201.0 0.0 365.7 1127.4 1493.2 Ireland IE 504.8 938.8 0.0 796.4 0.0 0.3 1443.6 796.7 2240.3 Italy IT 990.7 5941.5 3405.1 14269.5 0.0 4949.3 10337.3 19218.8 29556.1 Lithuania LT 0.0 0.0 0.0 319.0 18.6 0.0 18.6 319.0 337.6 Luxemburg LU 0.7 24.4 9.6 113.6 5.9 0.0 40.7 113.6 154.2 Latvia LV 0.0 23.5 0.0 175.1 0.0 0.0 23.5 175.1 198.6 Malta MT 0.0 0.0 0.0 0.0 0.0 0.0 0.0 0.0 0.0 Netherlands NL 2341.6 2017.9 0.0 3167.1 201.1 11.8 4560.7 3178.9 7739.6 Norway NO 0.0 0.0 0.0 0.0 0.0 1108.5 0.0 1108.5 1108.5 Poland PL 0.0 0.0 0.0 3635.7 140.1 0.0 140.1 3635.7 3775.8 Portugal PT 1437.8 354.0 0.0 1917.9 0.0 592.2 1791.8 2510.1 4301.9 Romania RO 0.0 61.1 0.0 1125.9 0.0 0.0 61.1 1125.9 1187.0 Sweden SE 0.0 950.4 0.0 2228.3 68.2 0.0 1018.7 2228.3 3246.9 Slovenia SI 0.0 0.0 0.0 224.6 0.0 350.1 0.0 574.7 574.7 Slovakia SK 0.0 157.7 729.5 925.5 173.3 0.0 1060.4 925.5 1986.0 Un. Kingdom UK 111.5 8500.6 0.0 17729.6 0.0 173.5 8612.1 17903.1 26515.2 Total EUR-29 16615.0 38214.0 17162.3 114836.1 2553.6 21796.0 74544.9 136632.1 211177.0 Sources: ACEA, 2006; EC, 2007b.