road safety commission wa - rsc data... · · 2017-06-12© tns road safety commission wa speeding...
TRANSCRIPT
© TNS
Road Safety Commission WASpeeding Full Campaign Evaluation 2016 DRAFT REPORT
July 2016
Client Contacts: Alisia Mumby
TNS Contacts: Allison Grainger Wendy Chow

© TNS
Contents
5CampaignDiagnostics: Post-It Notes
20
2Background andMethodology
05
3Attitudes and Behaviour
10
4Overall Campaign Awareness
17
Speeding Full Campaign Evaluation 2016
6Campaign Diagnostics:Enjoy the Ride
33
1Summary 03

© TNS
1Summary
Speeding Full Campaign Evaluation 2016

© TNS
Summary
1Nearly 8 in 10 respondents admit to driving over the speed limit occasionally or often.
Understanding of both the Post-it Notes and Enjoy the Ride campaign is very good, with all of the most frequently recalled messages from the ads consistent with the campaigns’ intended communications. 2
While both Post-it Notes and Enjoy the Ride campaigns by no means performs poorly among those who admit to speeding, it is generally rated lower among this group than among those who claim never to speed.3
Both campaigns show some signs of wear out, with the proportion of those ‘fed up’ with seeing the ads relatively high compared to previous RSC campaigns.4
Nearly 1 in 2 respondents claim to be less likely to speed after being exposed to either one of the campaigns. 5
Speeding Full Campaign Evaluation 2016

© TNS
2Background and Methodology
Speeding Full Campaign Evaluation 2016

© TNS
Background and Methodology
The Road Safety Commission (RSC) is re-launched two speeding campaigns, ‘Post-it Notes’ and ‘Enjoy the Ride’ aimed at reducing the number of people from speeding on Western Australian Roads. The campaigns target Western Australians aged 17 and over, particularly young males aged between 17 and 39 years old. These drivers are more likely to engage in high risk driving behaviours and are more likely to be involved in speed- related road accidents.
The “Post-it Notes’ campaign was first launched in February 2012. The campaign objectives are to: Remind and increase awareness of the consequences of
speeding, Increase awareness of speeding enforcement
The “Enjoy the Ride” campaign was first launched in March 2011. The campaign focuses on the benefits of slowing down when driving, rather than the negative impacts and consequences related to speeding. The ‘Enjoy the Ride’ campaign objectives include: Demonstrate taking a slower approach in life is more
enjoyable and to encourage a cultural and behavioural shift from ‘fast is better’ to being more relaxed and slow down;
Educate the community that there are no advantages to speeding and of the benefits of taking a slower approach in life.
A quantitative study was conducted in June 2016 after the most recent campaign activities took place on television, outdoor and online.
The aim of the research was to measure awareness and effectiveness of the campaign executions and assess their impact on knowledge, attitudes and behaviour of the target audience.
This report delivers the findings from the ‘Enjoy the Ride’ and ‘Post-it Notes’ campaign evaluations conducted in June 2016 and compares selected findings to the speeding campaign evaluations conducted in February / March 2016.
Western Australians aged 17+ years old
Dip Evaluation Full Evaluation
How 15 min online survey 15 min online survey
When February 22 to March 1, 2016
June 15 to June 23, 2016
Where from
ThinkField online panel
ThinkField online panel
Response 301 interviews 437 Interviews
Weighted by
Age by Gender, Location
Age by Gender, Location
Throughout this report, the green rectangles indicates a significantly higher score and the red rectangles indicates a significantly lower score at 95% confidence level within subgroups
Carried out in accordance with ISO 20252
Speeding Full Campaign Evaluation 2016
6

© TNS
Achieved sample was weighted to 2011 location and age by gender census data.
Dimension Census%
Unwtdbase
Wtdbase
Metro Age &Gender
Male 17-29 9.82 24 43
Male 30-39 7.06 24 31
Male 40-49 7.10 25 31
Male 50-59 6.04 20 26
Male 60-69 4.52 18 20
Male 70 + 3.77 15 16
Female 17-19 9.40 24 41
Female 30-39 7.10 19 31
Female 40-49 7.30 24 32
Female 50-59 6.33 22 28
Female 60-69 4.61 18 20
Female 70 + 4.88 18 21
Subtotal 100 251 340
Total
Dimension Census%
UnWtdbase
Wtdbase
Reg / RemoteAge &Gender
Male 17-19 2.51 7 11
Male 30-39 2.15 9 9
Male 40-49 2.33 16 10
Male 50-59 2.10 21 10
Male 60-69 1.46 16 6
Male 70 + 1.06 15 5
Female 17-19 2.16 13 9
Female 30-39 1.94 16 8
Female 40-49 2.05 19 9
Female 50-59 1.86 21 8
Female 60-69 1.28 18 6
Female 70 + 1.15 15 5
100 186 97
437
Speeding Full Campaign Evaluation 2016
7

© TNS
The second wave of the study was conducted in June 2016 after campaign activity took place on TV, out of home, online and radio.
*Note: Radio ad was not tested in the 2016 campaign evaluation. No billboard and bus executions for Enjoy the Ride campaign.
Metro only Metro and Regional Regional only
Speeding Full Campaign Evaluation 2016
The Post-it Notes and Enjoy the Ride campaigns were aired on TV, radio, appeared online and out of home between late-January and July 2016. The strategy behind these timings and media channels was to ensure drivers had the opportunity to see or hear the messaging.
The number of impressions for both campaigns increased during school holidays, at the beginning of school terms, prior to long weekends and weekday mornings. Increased impressions aims to target drivers travelling from Perth to other parts of WA and vice versa; and act as a reminder to slow down at 40km/hr zones when children are back in school.
2015 2016
January February March April May June J
17 24 31 7 14 21 28 6 13 20 27 3 10 17 24 1 8 15 22 29 5 12 19 26 3
Research
School hol
Long wkend
‘Post it notes’ and ‘Enjoy the Ride’ Campaign*
TV
Billboards
Buses
Online
Radio
Term 1 Term 2Summer hol
Aus Day Labour Day Easter ANZAC day WA day
8

© TNS
Media Rational for Post-it Notes and Enjoy the Ride campaigns
Speeding Full Campaign Evaluation 2016
Television Post-it Notes and Enjoy the Ride video ads appeared on metro and regional TV – Network 7, Channel 9,
Channel 10 and SBS, GWN, Goolarri). The video ads were shown on mutually viewed programs such as drama, reality, news and current
affairs programs. The Post-it Notes video ad was aired in high relevancy moments – weekday mornings and start of term,
while the Enjoy the Ride video ad was aired during evenings and weekends in ‘less-stressed reflection’ moments of the week.
Online 30 second pre-roll ads were incorporated on news and weather websites, YouTube and Facebook. Social
media pre-rolls were used as an opportunity to target Males aged between 25 and 54 years old. Video pre-rolls were also incorporated on displays around maps, weather and holiday content to target
holiday drivers.
Outdoor Post-it Notes outdoor ads appeared on metro bus backs and billboards in regional areas. The campaign appeared out of home to reach drivers whilst driving to remind them to not go over the
speed limit. There were no outdoor executions for the Enjoy the Ride campaign.
Radio Post-it Notes campaign was aired on metro and regional commercial radio stations, skewing to weekday
breakfast, drive sessions and Sundays. This strategy was implemented to capture as many listeners as possible and remind drivers to stick to the speed limit.
Post-it Notes radio ad was not tested in the 2016 campaign evaluations. There were no radio executions for the Enjoy the Ride campaign.
9
© TNS
3Attitudes and Behaviour
Speeding Full Campaign Evaluation 2016

© TNS
Nearly 8 in 10 respondents admit to driving over the speed limit occasionally or often. Those aged between 17-24 are slightly less likely to admit to speeding than older respondents.
SOURCE: A4. Which of these statements best describes you as a driver?BASE: Driver Full Evaluation n=430
78 7783 80
65
80 79 80 8076
Total(430)
Metro(247)
Regional(133)
Remote(50)
17-24years(32)
25-34years(71)
35-49years(115)
50+years(212)
Male(209)
Female(221)
% Admit to speeding occasionally/ often
Location Age Gender
Speeding Full Campaign Evaluation 2016
11

© TNS
5
7
11
17
16
29
31
21
53
2
3
2
4
7
10
5
5
32
52
68
53
44
36
37
29
28
4
30
13
15
14
10
6
9
10
3
82
81
68
58
46
42
38
38
7
An accident at 70 kph will be a lot more severe than an accident at 60 kph
I sometimes speed by accident
Speeding is wrong because it is against the law
I’m more likely to avoid an accident if I always stick to the speed limit
One way of slowing down your life would be to drive within the speed limit
Driving can be used as a time to relax – an escape from our hectic lives
In general, its ok to exceed the speed limit by a small amount, if you’re driving safely
I am confident in my driving ability and I am able to handle driving over the speed limit
The penalties for speeding are not worth worrying about
SOURCE: A21 What extent do you agree or disagree with the following statements? BASE: All respondents: Full Evaluation n=434. Statements B, C, E, I asked only Drivers n=428-434
Strongly disagree Disagree Agree Strongly agree* *Ratings of 3 (midpoint)
excluded from chart
Speeding Full Campaign Evaluation 2016
Speeding behaviour %Never (88)
Occas. /Usually (340)
81 83
59 87
77 65
72 54
56 43
38 43
15 45
22 43
9 6
%
Those who admit to speeding occasionally or often are significantly more likely to believe it is ok exceed the speed limit slightly and be confident in their ability to drive safely, even when speeding
12

© TNS
5
7
11
17
16
29
31
21
53
2
3
2
4
7
10
5
5
32
52
68
53
44
36
37
29
28
4
30
13
15
14
10
6
9
10
3
82
81
68
58
46
42
38
38
7
An accident at 70 kph will be a lot more severe than an accident at 60 kph
I sometimes speed by accident
Speeding is wrong because it is against the law
I’m more likely to avoid an accident if I always stick to the speed limit
One way of slowing down your life would be to drive within the speed limit
Driving can be used as a time to relax – an escape from our hectic lives
In general, its ok to exceed the speed limit by a small amount, if you’re driving safely
I am confident in my driving ability and I am able to handle driving over the speed limit
The penalties for speeding are not worth worrying about
SOURCE: A21 What extent do you agree or disagree with the following statements? BASE: All respondents: Full Evaluation n=434. Statements B, C, E, I asked only Drivers n=428-434
Strongly disagree Disagree Agree Strongly agree* *Ratings of 3 (midpoint)
excluded from chart
Speeding Full Campaign Evaluation 2016
Speeding behaviour %Never (88)
Occas. /Usually (340)
81 83
59 87
77 65
72 54
56 43
38 43
15 45
22 43
9 6
%
They are also less likely to believe speeding is wrong “because it is against the law” and to believe in the potential benefits of not speeding.
13

© TNS
The target audience is less likely to agree that speeding is wrong “because it is against the law”, but more likely to think that driving can be used as time to relax
%
Strongly disagree Disagree Agree Strongly agree* *Ratings of 3 (midpoint)
excluded from chart
Speeding Full Campaign Evaluation 2016
Male 17-39%(64)
79
84
48
54
36
60
51
49
9
5
7
11
17
16
29
31
21
53
2
3
2
4
7
10
5
5
32
52
68
53
44
36
37
29
28
4
30
13
15
14
10
6
9
10
3
An accident at 70 kph will be a lot more severe than an accident at 60 kph
I sometimes speed by accident
Speeding is wrong because it is against the law
I’m more likely to avoid an accident if I always stick to the speed limit
One way of slowing down your life would be to drive within the speed limit
Driving can be used as a time to relax – an escape from our hectic lives
In general, its ok to exceed the speed limit by a small amount, if you’re driving safely
I am confident in my driving ability and I am able to handle driving over the speed limit
The penalties for speeding are not worth worrying about
82
81
68
58
46
42
38
38
7
SOURCE: A21 What extent do you agree or disagree with the following statements? BASE: All respondents: Full Evaluation n=434. Statements B, C, E, I asked only Drivers n=428-434
14

© TNS
57
30
26
24
23
20
18
17
17
11
Road signs are the most common ‘trigger’ for drivers to monitor their speed. Drivers who admit to speeding tend to be more cautious about how fast they are travelling when police and speed cameras are present in the area.
SOURCE: A9. What sort of things make you check what speed you are driving?BASE: All respondents: Full Evaluation n=437
*10% mentions or more
%
Road signs / speed limit signs
Police cars / police presence
Speed of other traffic / vehicles travelling at different speeds / other drivers
Speed cameras
Road conditions / weather
Driving in a school zone
Flow of traffic / congestion
Overtaking vehicles / other vehicles passing
Habit to check speedometer / natural response
Road layouts - Intersections / traffic lights / roundabouts / winding roads / lane merges
Speeding Full Campaign Evaluation 2016
Speeding behaviour %Never (86)
Occas. /Usually (307)
61 56
20 32
23 27
14 27
25 22
20 19
19 18
13 18
13 18
13 11
15

© TNS
57
30
26
24
23
20
18
17
17
11
Similar to drivers that admit to speeding, Males 17-39 drivers are more likely to check their speed if they see police and speed cameras while driving.
SOURCE: A9. What sort of things make you check what speed you are driving?BASE: All respondents: Full Evaluation n=437, Males 17-39: Full Evaluation n=64
*3% mentions or more
Speeding Full Campaign Evaluation 2016
Males 17-39 Top 3 Mentions %
Road signs / speed limit signs 56
Police cars / police presence 35
Speed cameras 32
%
Road signs / speed limit signs
Police cars / police presence
Speed of other traffic / vehicles travelling at different speeds / other drivers
Speed cameras
Road conditions / weather
Driving in a school zone
Flow of traffic / congestion
Overtaking vehicles / other vehicles passing
Habit to check speedometer / natural response
Road layouts - Intersections / traffic lights / roundabouts / winding roads / lane merges
16

© TNS
3Overall Campaign Awareness
Speeding Full Campaign Evaluation 2016

© TNS
SOURCE: B1. Have you recently seen or heard any advertising about speeding? B2. Please describe in as much detail as possible the ad(s) you remember seeing or hearingBASE: All respondents: n=437, Full Evaluation n=437, Dip Evaluation n=301
49
17
1
64
19
3
Recently seen or heardadvertising
Current campaigns
Other RSC campaigns
% Yes
Speeding Full Campaign Evaluation 2016
Full Evaluation Dip Evaluation
825 3
'Post-itNotes'
'Enjoy theRide'
Current campaigns‘Enjoy the Ride’ – Two male drivers. One travelling faster than the other. Together they meet at the traffic light
8%
"Slow down and enjoy the ride" 3%
Enjoy the ride / the driving experience / the trip 3%
Speed and you will get caught / Stick to the speed limit 2%'Post-it Notes' – People writing on post it notes remind themselves not to speed
2%
Policeman holding a radar gun / reminder to stick to the speed limit
2%
Other RSC campaigns
OK is not OK – Drink Driving 1%
49% of respondents indicated that they had recently seen or heard advertising about speeding, with around 1 in 5 respondents able to specifically describe Post-it Notes / Enjoy the Ride campaigns.
18

© TNS
8577
72
87
77 75
Either ‘Post-it Notes’ and ‘Enjoy the Ride’
‘Post-it Notes’ ‘Enjoy the Ride’
19
SOURCE: B3a. Have you seen this ad on any billboards or signs along the road before today?, B4a. Have you seen this television ad before today?, B5a. Have you seen this online ad before today?, B9a. Have you seen this ad on any buses before today?, B4b. Have you seen this television ad before today?, B5b. Have you seen this online ad before today?BASE: All respondents: Full Evaluation n=437, Dip Evaluation n=301; Males 17-39: Full Evaluation n= 64, Dip Evaluation n=38
% Recognition
Post-it Notes
Enjoy the Ride
Speeding Full Campaign Evaluation 2016
Full Evaluation Dip Evaluation
85% of respondents recognise at least one of the campaigns when prompted. Recognition levels among the target audience are no different than among the full sample.
Males 17-39 86 85 81 73 66 80

© TNS
4Campaign Diagnostics:Post-it notes
Speeding Full Campaign Evaluation 2016

© TNS
SOURCE: B3a. Have you seen this ad on any billboards or signs along the road before today?, B4a. Have you seen this television ad before today?, B5a. Have you seen this online ad before today?, B9a. Have you seen this ad on any buses before today?BASE: All respondents: Full Evaluation n=,437 Dip Evaluation n=301
77
68
2824
18
77
68
2014 14
Totalcampaign
TV Outdoor Buses Online
% Recognition
TV
Outdoor
Buses
Online
Speeding Full Campaign Evaluation 2016
Full Evaluation Dip Evaluation
More than three-quarters of respondents recognise the Post-it Note campaign when prompted, showing no change in awareness since the dip evaluation. While TV remains the most recognised of the campaign executions, there has been an uplift in recognition of all of the BTL media.
21

© TNS
SOURCE: B3a. Have you seen this ad on any billboards or signs along the road before today?, B4a. Have you seen this television ad before today?, B5a. Have you seen this online ad before today?, B9a. Have you seen this ad on any buses before today?BASE: All respondents: Full Evaluation n=,437 Dip Evaluation n=301
77
68
2824
18
77
68
2014 14
Totalcampaign
TV Outdoor Buses Online
% Recognition
TV
Outdoor
Buses
Online
Speeding Full Campaign Evaluation 2016
Full Evaluation Dip Evaluation
The fact that the latter improvement has not impacted on overall awareness suggests these media are not reaching a new audience, but will be reinforcing the campaign message across different touchpoints for those who are already aware.
22

© TNS
SOURCE: B3a. Have you seen this ad on any billboards or signs along the road before today?, B4a. Have you seen this television ad before today?, B5a. Have you seen this online ad before today?, B9a. Have you seen this ad on any buses before today?BASE: All respondents: Full Evaluation n=437, Dip Evaluation n=301
77 7874
63
79 78 76 7579
74 7178 77 7977 76
88
74
88
72
85
7379 76
7281
74
86
Total(437/301)
Metro(251/200)
Regional(136/51)
Remote(50/50)
17-24years(32/16)
25-34years(71/54)
35-49years(117/78)
50+years(217/153)
Male(210/144)
Female(227/157)
Never(88/76)
Occas. /Often(307/221)
1-4 kph(186/117)
5-9 kph(148/100)
% Recognition
Location Age Gender Speedingbehaviour
Avg. speeding level
Full Evaluation Dip Evaluation
Speeding Full Campaign Evaluation 2016
Prompted awareness is marginally higher amongst the 17-24 and 35-49 age brackets, those who reside in regional areas and those who admit to speeding more than 5kph above the speed limit.
23

© TNS
53
29
18
16
14
6
5
5
4
4
The campaign is clearly well-understood by respondents, with all of the most frequently-recalled messages from the ads consistent with the communication goals of the campaign.
SOURCE: B6a. What are the main messages these ads are trying to tell you?BASE: All respondents: Full Evaluation n=437
*3% mentions or more
% Message takeout
Slow down / do not speed
Speed and you will get caught
Slow down to avoid fines and demerit point deductions
Stick to the speed limit
Remind yourself not to speed / remind others to slow down
The consequences of speeding / you will face the consequences
Speed cameras / more speed cameras
Think of your family / your loved ones / friends
Slow down to avoid road accidents /save your life / others lives
Take some responsibility - drive responsibly
Speeding Full Campaign Evaluation 2016
24

© TNS
53
29
18
16
14
6
5
5
4
4
Message takeout among Males 17-39 is fairly consistent with the general community, with the top two messages as ‘slow down and do not speed’ and ‘you’ll get caught for speeding’.
SOURCE: B6a. What are the main messages these ads are trying to tell you?BASE: All respondents: Full Evaluation n=437, Males 17-39: Full Evaluation n=64
*4% mentions or more
Males 17-39 Top 3 Mentions %
Slow down / do not speed 60
Speed and you will get caught 28
Stick to the speed limit 18
% Message takeout
Slow down / do not speed
Speed and you will get caught
Slow down to avoid fines and demerit point deductions
Stick to the speed limit
Remind yourself not to speed / remind others to slow down
The consequences of speeding / you will face the consequences
Speed cameras / more speed cameras
Think of your family / your loved ones / friends
Slow down to avoid road accidents /save your life / others lives
Take some responsibility - drive responsibly
Speeding Full Campaign Evaluation 2016
25

© TNS
Compared with the dip evaluation, the top two mentions remained consistent with the full evaluation.
SOURCE: B6a. What are the main messages these ads are trying to tell you?BASE: All respondents: Full Evaluation n=437, Dip Evaluation n=301
*4% mentions or more
Dip Eval. Top 3 Mentions %
Slow down / do not speed 63
Speed and you will get caught 26
Stick to the speed limit 18
Speeding Full Campaign Evaluation 2016
53
29
18
16
14
6
5
5
4
4
% Message takeout
Slow down / do not speed
Speed and you will get caught
Slow down to avoid fines and demerit point deductions
Stick to the speed limit
Remind yourself not to speed / remind others to slow down
The consequences of speeding / you will face the consequences
Speed cameras / more speed cameras
Think of your family / your loved ones / friends
Slow down to avoid road accidents /save your life / others lives
Take some responsibility - drive responsibly
26

© TNS
1
6
9
12
11
20
19
20
15
24
19
24
35
47
2
4
2
4
5
5
1
5
4
5
7
8
9
78
68
56
52
50
45
37
38
34
30
31
16
12
12
17
10
5
6
7
5
6
4
4
5
4
2
4
3
%
95
78
61
58
57
50
43
43
38
36
34
18
16
15
SOURCE: B7a. What extent do you agree or disagree with the following statements? BASE: All respondents: Full Evaluation n=437
Strongly disagree Disagree Agree Strongly agree* *Ratings of 3 (midpoint)
excluded from chart
Speeding Full Campaign Evaluation 2016
Speeding behaviour %Never (88)
Occas. /Usually (341)
97 94
87 75
56 62
68 55
58 56
43 51
44 43
52 40
43 36
47 32
41 33
30 15
15 16
24 11
Easy to understand
Believable
Relatable
Made me think I should always stick to the speed limit
Made me think I should slow down when I’m driving
Relevant
Grabbed attention
Just like other road safety ads
Original
Memorable
Unique
Enjoyable
Getting fed up of seeing the ads
Told me something new
While the campaign is highly understandable and believable, it is not particularly enjoyable or novel. Those who do not speed tend to rate the ad higher than those who do.
27

© TNS
%
Strongly disagree Disagree Agree Strongly agree* *Ratings of 3 (midpoint)
excluded from chart
Speeding Full Campaign Evaluation 2016
Males 17-39 %(64)
99
74
50
54
53
55
36
50
39
23
36
18
23
17
1
6
9
12
11
20
19
20
15
24
19
24
35
47
2
4
2
4
5
5
1
5
4
5
7
8
9
78
68
56
52
50
45
37
38
34
30
31
16
12
12
17
10
5
6
7
5
6
4
4
5
4
2
4
3
61
58
57
50
43
43
38
36
34
18
16
15
Easy to understand
Believable
Relatable
Made me think I should always stick to the speed limit
Made me think I should slow down when I’m driving
Relevant
Grabbed attention
Just like other road safety ads
Original
Memorable
Unique
Enjoyable
Getting fed up of seeing the ads
Told me something new
95
78
SOURCE: B7a. What extent do you agree or disagree with the following statements? BASE: All respondents: Full Evaluation n=437
Campaign wear-out is slightly higher among the target audience and they also find the ads less memorable.
28
© TNS
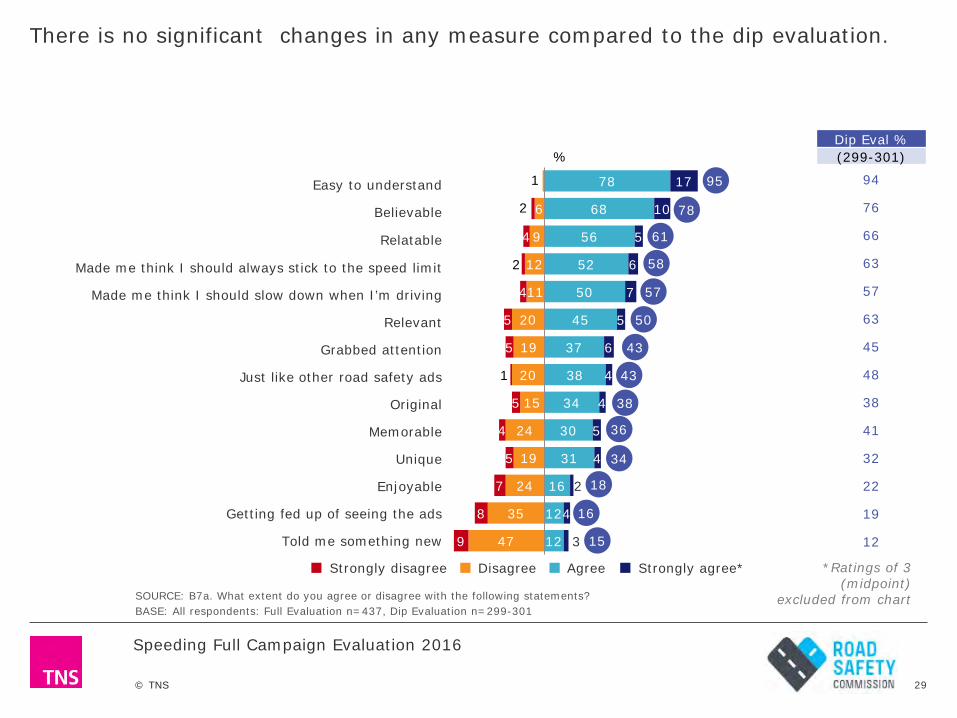
There is no significant changes in any measure compared to the dip evaluation.
%
SOURCE: B7a. What extent do you agree or disagree with the following statements? BASE: All respondents: Full Evaluation n=437, Dip Evaluation n=299-301
Strongly disagree Disagree Agree Strongly agree* *Ratings of 3 (midpoint)
excluded from chart
Speeding Full Campaign Evaluation 2016
Dip Eval %(299-301)
94
76
66
63
57
63
45
48
38
41
32
22
19
12
1
6
9
12
11
20
19
20
15
24
19
24
35
47
2
4
2
4
5
5
1
5
4
5
7
8
9
78
68
56
52
50
45
37
38
34
30
31
16
12
12
17
10
5
6
7
5
6
4
4
5
4
2
4
3
Easy to understand
Believable
Relatable
Made me think I should always stick to the speed limit
Made me think I should slow down when I’m driving
Relevant
Grabbed attention
Just like other road safety ads
Original
Memorable
Unique
Enjoyable
Getting fed up of seeing the ads
Told me something new
95
78
61
58
57
50
43
43
38
36
34
18
16
15
29
© TNS
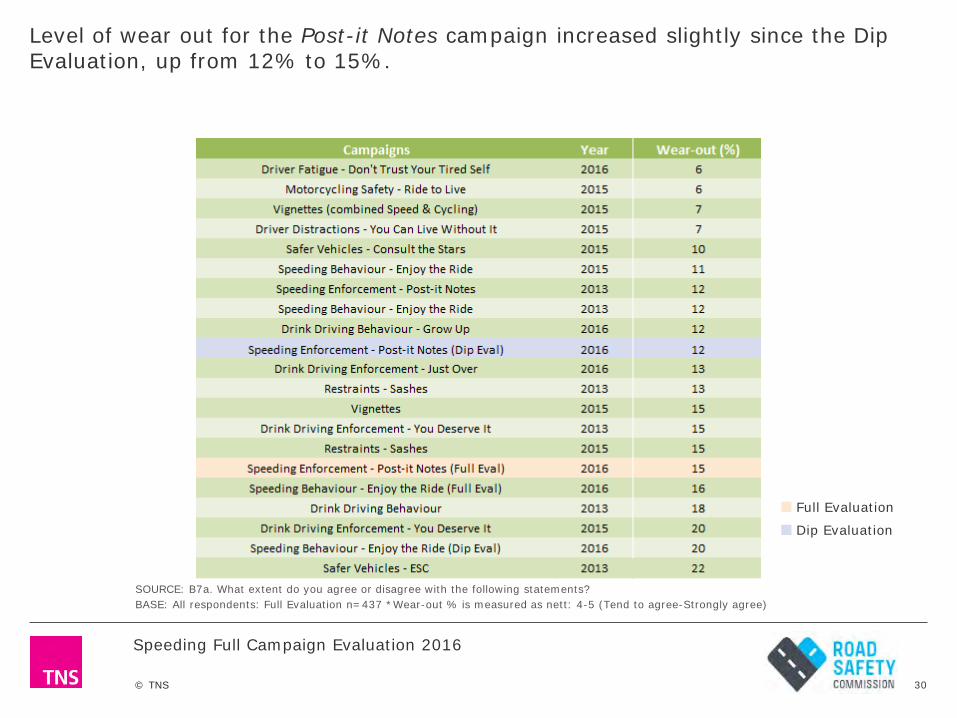
Level of wear out for the Post-it Notes campaign increased slightly since the Dip Evaluation, up from 12% to 15%.
SOURCE: B7a. What extent do you agree or disagree with the following statements? BASE: All respondents: Full Evaluation n=437 *Wear-out % is measured as nett: 4-5 (Tend to agree-Strongly agree)
Speeding Full Campaign Evaluation 2016
Full Evaluation
Dip Evaluation
30
© TNS
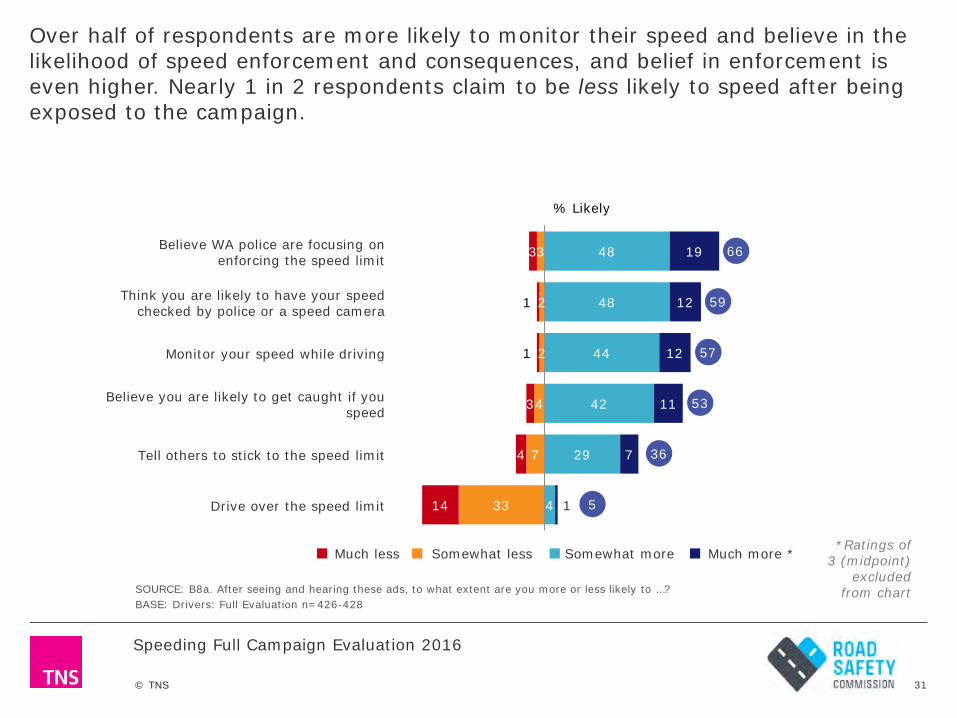
SOURCE: B8a. After seeing and hearing these ads, to what extent are you more or less likely to …?BASE: Drivers: Full Evaluation n=426-428
Believe WA police are focusing on enforcing the speed limit
Think you are likely to have your speed checked by police or a speed camera
Monitor your speed while driving
Believe you are likely to get caught if you speed
Tell others to stick to the speed limit
Drive over the speed limit
3
2
2
4
7
33
3
1
1
3
4
14
48
48
44
42
29
4
19
12
12
11
7
1
% Likely
66
59
57
53
36
5
Speeding Full Campaign Evaluation 2016
Much less Somewhat less Somewhat more Much more **Ratings of
3 (midpoint) excluded
from chart
Over half of respondents are more likely to monitor their speed and believe in the likelihood of speed enforcement and consequences, and belief in enforcement is even higher. Nearly 1 in 2 respondents claim to be less likely to speed after being exposed to the campaign.
31

© TNS
Notably, those who admit to driving over the speed limit are less likely to tell others to stick to the speed limit – a finding in line with the Deep Dives research.
SOURCE: B8a. After seeing and hearing these ads, to what extent are you more or less likely to …?BASE: Drivers: Full Evaluation n=437
% Likely
Speeding Full Campaign Evaluation 2016
Much less Somewhat less Somewhat more Much more **Ratings of
3 (midpoint) excluded
from chart
Believe WA police are focusing on enforcing the speed limit
Think you are likely to have your speed checked by police or a speed camera
Monitor your speed while driving
Believe you are likely to get caught if you speed
Tell others to stick to the speed limit
Drive over the speed limit
3
2
2
4
7
33
3
1
1
3
4
14
48
48
44
42
29
4
19
12
12
11
7
1
66
59
57
53
36
5
Speeding behaviour %
Never (88)
Occas. /Usually (340)
72 65
66 57
62 55
61 51
53 31
6 5
32

© TNS
SOURCE: B8a. After seeing and hearing these ads, to what extent are you more or less likely to …?BASE: Drivers: Full Evaluation n=437
% Likely
Speeding Full Campaign Evaluation 2016
Males 17-39 %
(64)
56
58
49
46
26
7
Much less Somewhat less Somewhat more Much more **Ratings of
3 (midpoint) excluded
from chart
Believe WA police are focusing on enforcing the speed limit
Think you are likely to have your speed checked by police or a speed camera
Monitor your speed while driving
Believe you are likely to get caught if you speed
Tell others to stick to the speed limit
Drive over the speed limit
3
2
2
4
7
33
3
1
1
3
4
14
48
48
44
42
29
4
19
12
12
11
7
1
66
59
57
53
36
5
There is little real difference in the intentions and beliefs around speeding among the target audience, compared the overall sample.
33

© TNS
Once again there has been no significant change in any of the measures compared to the dip evaluation
SOURCE: B8a. After seeing and hearing these ads, to what extent are you more or less likely to …?BASE: Drivers: Full Evaluation n=437, Dip Evaluation n=296-297
% Likely
Much less Somewhat less Somewhat more Much more **Ratings of
3 (midpoint) excluded
from chart
Speeding Full Campaign Evaluation 2016
Believe WA police are focusing on enforcing the speed limit
Think you are likely to have your speed checked by police or a speed camera
Monitor your speed while driving
Believe you are likely to get caught if you speed
Tell others to stick to the speed limit
Drive over the speed limit
3
2
2
4
7
33
3
1
1
3
4
14
48
48
44
42
29
4
19
12
12
11
7
1
66
59
57
53
36
5
Dip Eval %
(296)
68
58
54
50
39
5
34

© TNS
5Campaign Diagnostics: Enjoy the Ride
Speeding Full Campaign Evaluation 2016
© TNS
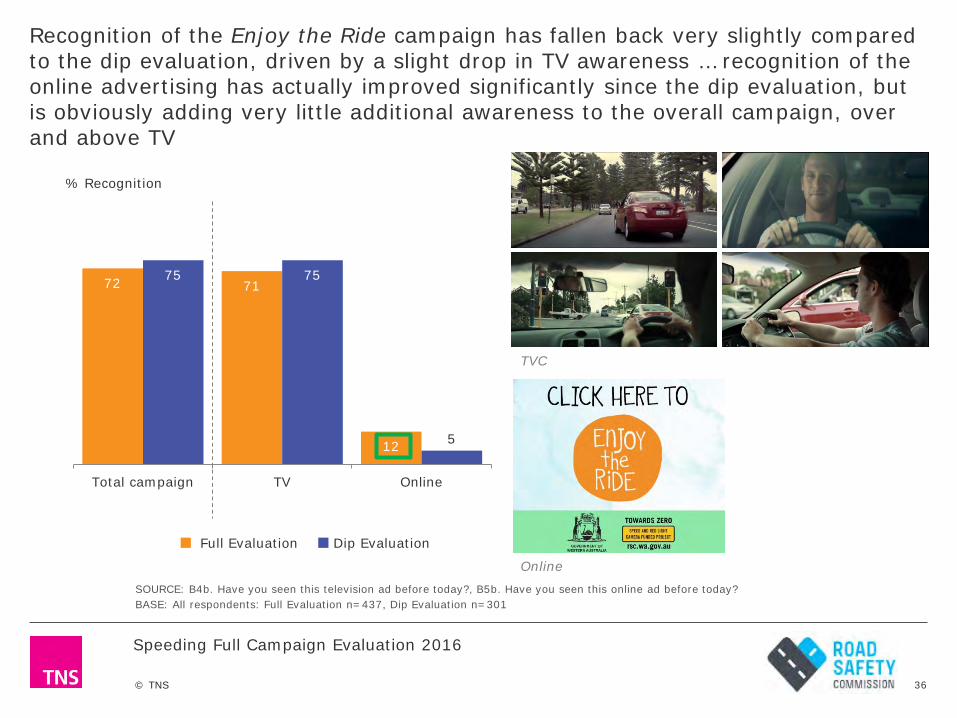
SOURCE: B4b. Have you seen this television ad before today?, B5b. Have you seen this online ad before today?BASE: All respondents: Full Evaluation n=437, Dip Evaluation n=301
72 71
12
75 75
5
Total campaign TV Online
% Recognition
TVC
Online
Full Evaluation Dip Evaluation
Speeding Full Campaign Evaluation 2016
Recognition of the Enjoy the Ride campaign has fallen back very slightly compared to the dip evaluation, driven by a slight drop in TV awareness … recognition of the online advertising has actually improved significantly since the dip evaluation, but is obviously adding very little additional awareness to the overall campaign, over and above TV
36
© TNS
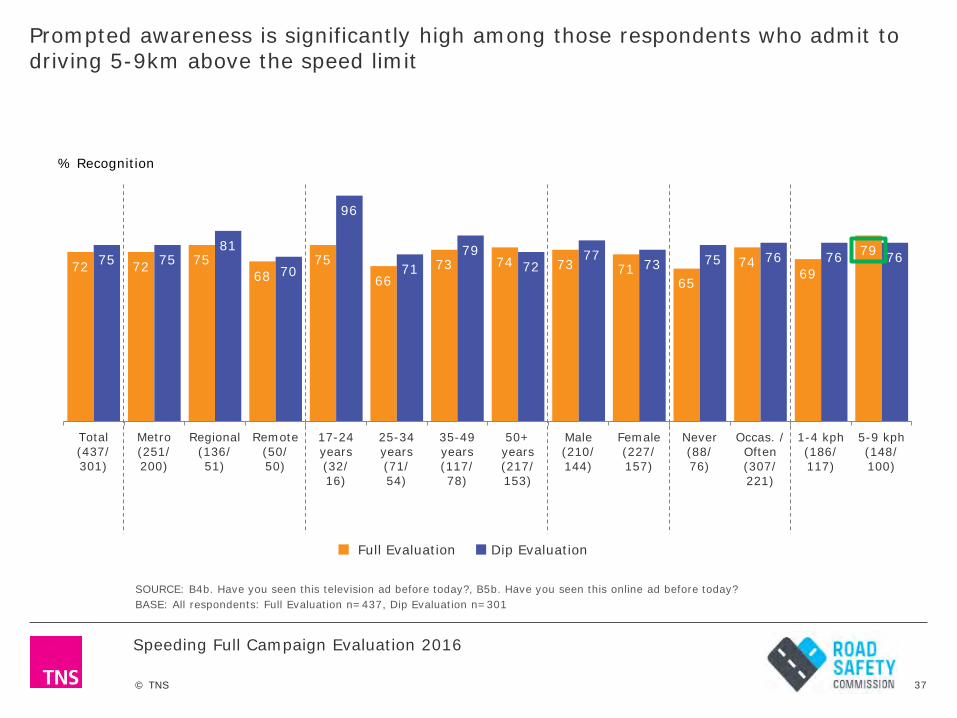
SOURCE: B4b. Have you seen this television ad before today?, B5b. Have you seen this online ad before today?BASE: All respondents: Full Evaluation n=437, Dip Evaluation n=301
% Recognition
Full Evaluation Dip Evaluation
Speeding Full Campaign Evaluation 2016
72 72 7568
7566
73 74 73 7165
7469
7975 75
81
70
96
7179
7277
73 75 76 76 76
Total(437/301)
Metro(251/200)
Regional(136/51)
Remote(50/50)
17-24years(32/16)
25-34years(71/54)
35-49years(117/78)
50+years(217/153)
Male(210/144)
Female(227/157)
Never(88/76)
Occas. /Often(307/221)
1-4 kph(186/117)
5-9 kph(148/100)
Prompted awareness is significantly high among those respondents who admit to driving 5-9km above the speed limit
37

© TNS
49
33
33
22
10
9
9
6
2
The campaign is well-understood by the target audience, with all of the most frequently-recalled messages from the ads consistent with the communication goals of the campaign. Top three mentions among Males 17-39 are consistent with the general community.
SOURCE: B6b. What are the main messages these ads are trying to tell you?BASE: All respondents: Full Evaluation n=437, Males 17-39: Full Evaluation n=64
*2% mentions or more
Males 17-39 Top 3 Mentions %
Slow down / do not speed 51
Enjoy the ride / the driving experience / the trip 33
Driving faster does not guarantee you will arrive earlier / There are no advantages to speeding
32
% Message takeout
Slow down / do not speed
Driving faster does not guarantee you will arrive earlier / There are no advantages to speeding
Enjoy the ride / the driving experience / the trip
Relax / there's no need to rush
Speeding is stressful / Why stress ?
Stick to the speed limit
There is no point to speeding / not worth it
Speeding is unsafe / dangerous
Take some responsibility - drive responsibly
Speeding Full Campaign Evaluation 2016
38

© TNS
There has been no change in the top three mentions in the full evaluation compared to the dip evaluation.
SOURCE: B6b. What are the main messages these ads are trying to tell you?BASE: All respondents: Full Evaluation n=437, Dip Evaluation n=301
*3% mentions or more
Dip Eval. Top 3 Mentions % Driving faster does not guarantee you will arrive earlier
46
Slow down / do not speed 43
Enjoy the ride / the driving experience / the trip 29
Speeding Full Campaign Evaluation 2016
49
33
33
22
10
9
9
6
2
% Message takeout
Slow down / do not speed
Driving faster does not guarantee you will arrive earlier / There are no advantages to speeding
Enjoy the ride / the driving experience / the trip
Relax / there's no need to rush
Speeding is stressful / Why stress ?
Stick to the speed limit
There is no point to speeding / not worth it
Speeding is unsafe / dangerous
Take some responsibility - drive responsibly
39
© TNS
Males 17-39 %(64)
86
74
72
55
51
46
59
56
56
50
54
40
42
16
18
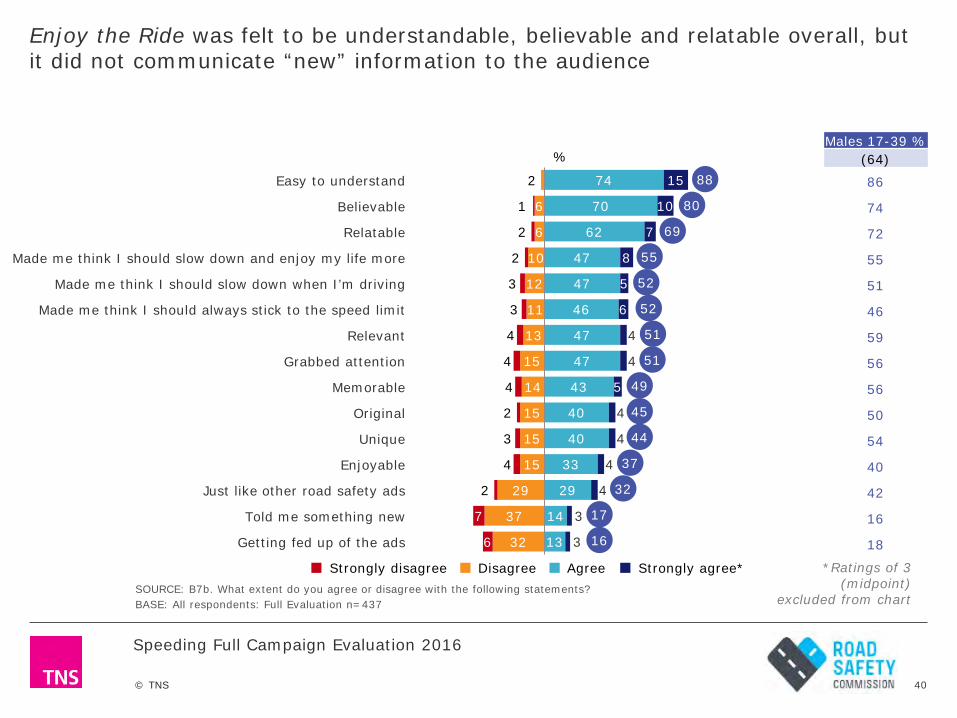
SOURCE: B7b. What extent do you agree or disagree with the following statements? BASE: All respondents: Full Evaluation n=437
%
Easy to understand
Believable
Relatable
Made me think I should slow down and enjoy my life more
Made me think I should slow down when I’m driving
Made me think I should always stick to the speed limit
Relevant
Grabbed attention
Memorable
Original
Unique
Enjoyable
Just like other road safety ads
Told me something new
Getting fed up of the ads
88
80
69
55
52
52
51
51
49
45
44
37
32
17
16
Strongly disagree Disagree Agree Strongly agree* *Ratings of 3 (midpoint)
excluded from chart
Speeding Full Campaign Evaluation 2016
Enjoy the Ride was felt to be understandable, believable and relatable overall, but it did not communicate “new” information to the audience
2
6
6
10
12
11
13
15
14
15
15
15
29
37
32
1
2
2
3
3
4
4
4
2
3
4
2
7
6
74
70
62
47
47
46
47
47
43
40
40
33
29
14
13
15
10
7
8
5
6
4
4
5
4
4
4
4
3
3
40
© TNS
SOURCE: B7b. What extent do you agree or disagree with the following statements? BASE: All respondents: Full Evaluation n=437
%
Strongly disagree Disagree Agree Strongly agree* *Ratings of 3 (midpoint)
excluded from chart
Speeding behaviour %
Never (88) Occas. /Usually (341)
87 88
85 79
76 67
71 50
64 49
70 46
40 54
61 48
55 46
58 41
47 43
52 32
38 30
24 14
12 17
Speeding Full Campaign Evaluation 2016
2
6
6
10
12
11
13
15
14
15
15
15
29
37
32
1
2
2
3
3
4
4
4
2
3
4
2
7
6
74
70
62
47
47
46
47
47
43
40
40
33
29
14
13
15
10
7
8
5
6
4
4
5
4
4
4
4
3
3
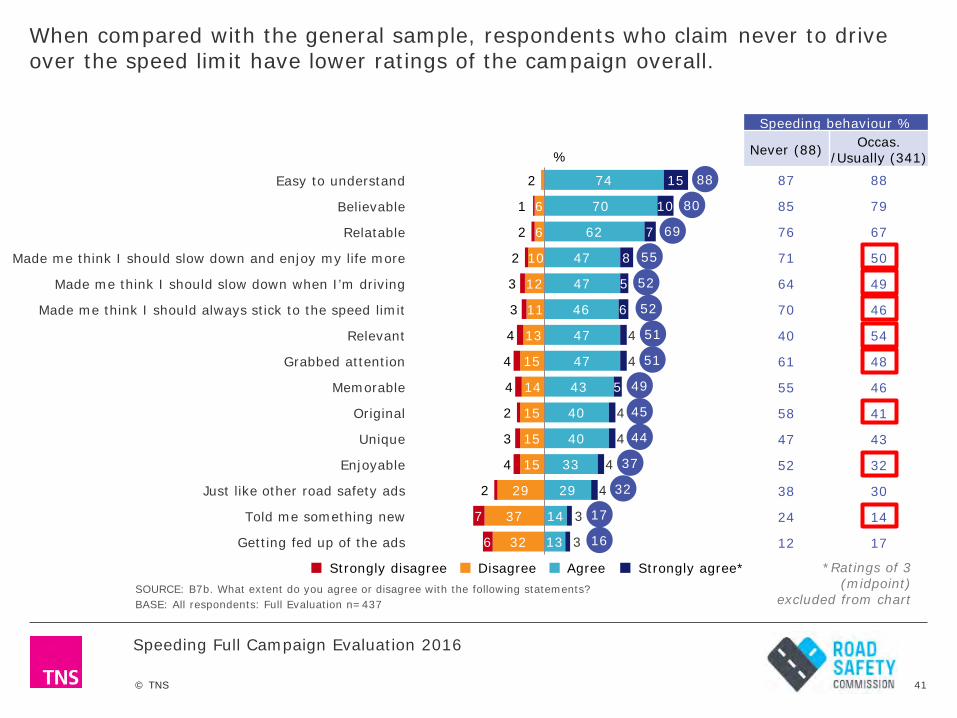
Easy to understand
Believable
Relatable
Made me think I should slow down and enjoy my life more
Made me think I should slow down when I’m driving
Made me think I should always stick to the speed limit
Relevant
Grabbed attention
Memorable
Original
Unique
Enjoyable
Just like other road safety ads
Told me something new
Getting fed up of the ads
When compared with the general sample, respondents who claim never to drive over the speed limit have lower ratings of the campaign overall.
88
80
69
55
52
52
51
51
49
45
44
37
32
17
16
41

© TNS
There is no significant changes in any measure compared to the dip evaluation.
SOURCE: B7b. What extent do you agree or disagree with the following statements? BASE: All respondents: Full Evaluation n=437, Dip Evaluation n=299-301
%
Strongly disagree Disagree Agree Strongly agree* *Ratings of 3 (midpoint)
excluded from chart
Speeding Full Campaign Evaluation 2016
Dip Eval %(299-301)
90
80
72
62
56
55
56
48
47
46
42
39
28
14
20
Easy to understand
Believable
Relatable
Made me think I should slow down and enjoy my life more
Made me think I should slow down when I’m driving
Made me think I should always stick to the speed limit
Relevant
Grabbed attention
Memorable
Original
Unique
Enjoyable
Just like other road safety ads
Told me something new
Getting fed up of the ads
88
80
69
55
52
52
51
51
49
45
44
37
32
17
16
2
6
6
10
12
11
13
15
14
15
15
15
29
37
32
1
2
2
3
3
4
4
4
2
3
4
2
7
6
74
70
62
47
47
46
47
47
43
40
40
33
29
14
13
15
10
7
8
5
6
4
4
5
4
4
4
4
3
3
42

© TNS
Level of wear has not increased since the Dip Evaluation. However, compared with other RSC campaigns launched between 2013 and 2016, wear out of the Enjoy the Ride campaign is relatively high.
Speeding Full Campaign Evaluation 2016
SOURCE: B7b. What extent do you agree or disagree with the following statements? BASE: All respondents: Full Evaluation n=437 *Wear-out % is measured as nett: 4-5 (Tend to agree-Strongly agree)
Full Evaluation
Dip Evaluation
43

© TNS
Speeding Full Campaign Evaluation 2016
Males 17-39 %
(62)
30
5
SOURCE: B8b. After seeing and hearing these ads, to what extent are you more or less likely to…?BASE: All respondents: Full Evaluation n=437
% Likely
Much less Somewhat less Somewhat more Much more **Ratings of
3 (midpoint) excluded
from chart
Tell others to always stick to the speed limit
Drive over the speed limit
5
30
4
14
27
5
7
1
34
7
One-third of respondents are more likely to remind other to stick to the speed limit, and nearly half are less likely to speed as a result of being exposed to the campaign.
44
© TNS
Speeding Full Campaign Evaluation 2016
SOURCE: B8b. After seeing and hearing these ads, to what extent are you more or less likely to…?BASE: All respondents: Full Evaluation n=437
% Likely
Much less Somewhat less Somewhat more Much more **Ratings of
3 (midpoint) excluded
from chart
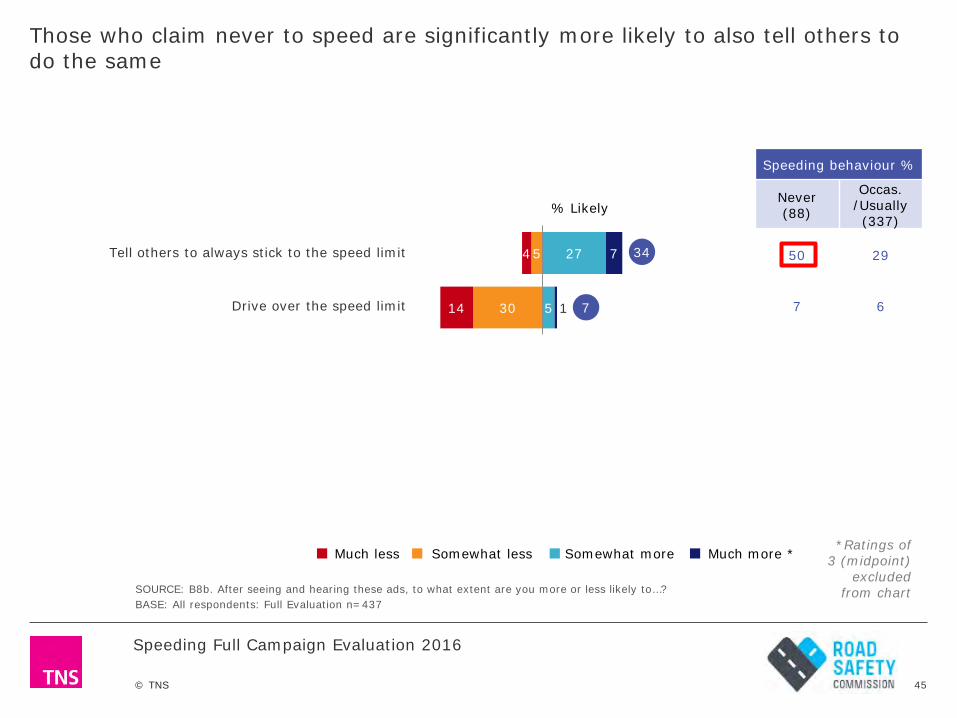
Speeding behaviour %
Never (88)
Occas. /Usually (337)
50 29
7 6
Tell others to always stick to the speed limit
Drive over the speed limit
5
30
4
14
27
5
7
1
34
7
Those who claim never to speed are significantly more likely to also tell others to do the same
45

© TNS 46
TNS Perth | Ground Floor, 24 Railway Road, Subiaco 6008 Western Australia | www.tnsglobal.com
Allison [email protected]+61 8 9489 4215
Wendy Chow [email protected]+61 8 9489 4210