road safety country overview-meta data · market value of final goods produced ... helmet wearing:...
TRANSCRIPT
Road Safety Country Overview-META DATA
Project co-financed by the European Commission, Directorate-General for Mobility and Transport 1 / 14
About this document This document provides details about the data used in the country overviews. General notes:
The European average refers to the sum of values for all European countries with data, divided by the number of European countries with data The European reference is only calculated for the latest year where data is available for at least 15 European countries (50%). When no data is available for 15 countries at least, the European reference is given as ‘not available’.
For categorical data where a European reference is given, this is not calculated as the average amount, but as the most frequent occurring situation (mode), taking into account those countries where data was available on that particular subject.
The year 2001 has been chosen as starting year for the time series because the most recent European target of halving the number of fatalities refers to that year.
Structure and Culture
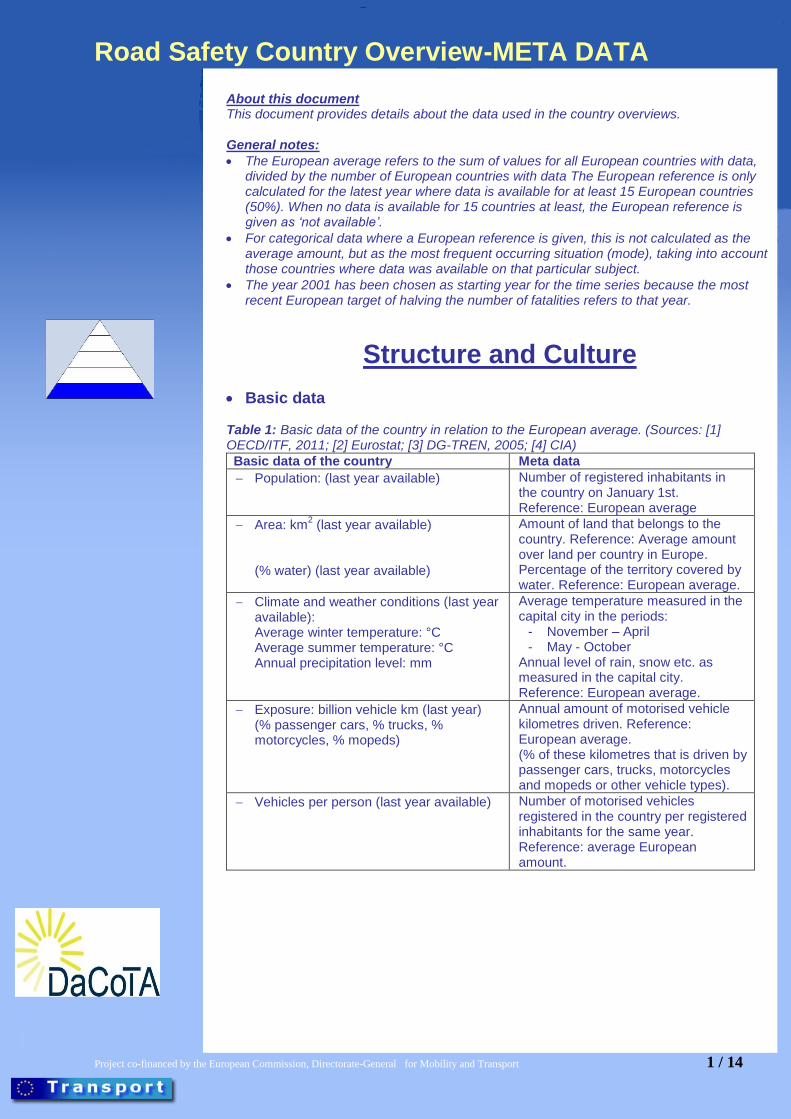
Basic data Table 1: Basic data of the country in relation to the European average. (Sources: [1] OECD/ITF, 2011; [2] Eurostat; [3] DG-TREN, 2005; [4] CIA)
Basic data of the country Meta data
Population: (last year available) Number of registered inhabitants in the country on January 1st. Reference: European average
Area: km2 (last year available)
(% water) (last year available)
Amount of land that belongs to the country. Reference: Average amount over land per country in Europe. Percentage of the territory covered by water. Reference: European average.
Climate and weather conditions (last year available): Average winter temperature: °C Average summer temperature: °C Annual precipitation level: mm
Average temperature measured in the capital city in the periods:
- November – April - May - October
Annual level of rain, snow etc. as measured in the capital city. Reference: European average.
Exposure: billion vehicle km (last year) (% passenger cars, % trucks, % motorcycles, % mopeds)
Annual amount of motorised vehicle kilometres driven. Reference: European average. (% of these kilometres that is driven by passenger cars, trucks, motorcycles and mopeds or other vehicle types).
Vehicles per person (last year available) Number of motorised vehicles registered in the country per registered inhabitants for the same year. Reference: average European amount.
Road Safety Country Overview-META DATA
Project co-financed by the European Commission, Directorate-General for Mobility and Transport 2 / 14
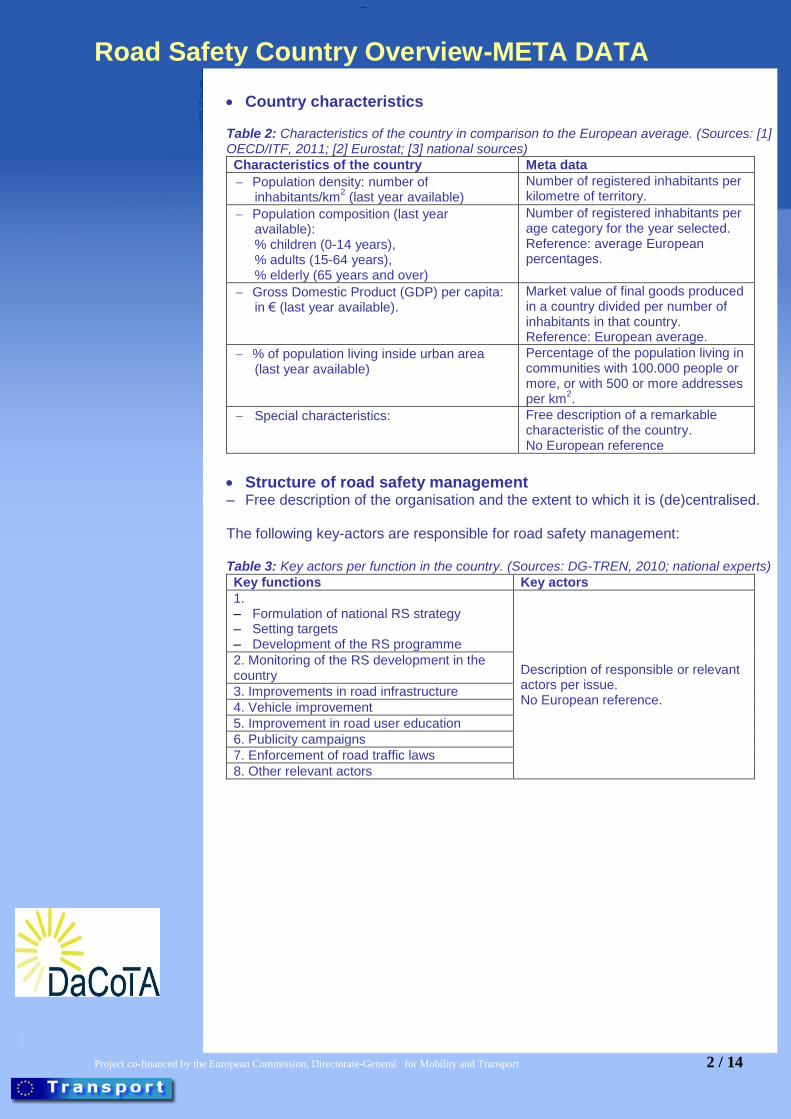
Country characteristics Table 2: Characteristics of the country in comparison to the European average. (Sources: [1] OECD/ITF, 2011; [2] Eurostat; [3] national sources)
Characteristics of the country Meta data
Population density: number of inhabitants/km
2 (last year available)
Number of registered inhabitants per kilometre of territory.
Population composition (last year available): % children (0-14 years), % adults (15-64 years), % elderly (65 years and over)
Number of registered inhabitants per age category for the year selected. Reference: average European percentages.
Gross Domestic Product (GDP) per capita: in € (last year available).
Market value of final goods produced in a country divided per number of inhabitants in that country. Reference: European average.
% of population living inside urban area (last year available)
Percentage of the population living in communities with 100.000 people or more, or with 500 or more addresses per km
2.
Special characteristics: Free description of a remarkable characteristic of the country. No European reference
Structure of road safety management – Free description of the organisation and the extent to which it is (de)centralised. The following key-actors are responsible for road safety management: Table 3: Key actors per function in the country. (Sources: DG-TREN, 2010; national experts) Key functions Key actors
1. – Formulation of national RS strategy – Setting targets – Development of the RS programme
Description of responsible or relevant actors per issue. No European reference.
2. Monitoring of the RS development in the country
3. Improvements in road infrastructure
4. Vehicle improvement
5. Improvement in road user education
6. Publicity campaigns
7. Enforcement of road traffic laws
8. Other relevant actors

Road Safety Country Overview-META DATA
Project co-financed by the European Commission, Directorate-General for Mobility and Transport 3 / 14
Attitudes towards risk taking Summary of attitudes or self-reported behaviour as expressed by the country
inhabitants (SARTRE survey). Reference: average attitudes expressed in other countries that joined the SARTRE survey.
Table 4: Road safety attitudes and behaviour of drivers (Source: SARTRE, 2004)
Country SARTRE average
Self-reported driving behaviour % of drivers that show behaviour often or more
Too close following
% of respondents that indicate to show this attitude/behavior ‘often’ or more.
Average attitude or behaviour score (often or more) of countries that joined the SARTRE survey
Inappropriate overtaking
Exceeding speed limit on motorways
Exceeding speed limit on main inter-urban roads
Exceeding speed limit on country roads
Exceeding speed limit in built-up areas
Support of stricter legislation
Higher penalties for speeding offences
Higher penalties for drink-driving offences
Lower BAC limits
Perceived probability of being checked for
Speeding
Alcohol use
Legend (comparison of country attitude in relation to average attitude of other SARTRE countries):
2-9% better
10-19% better
≥ 20% better
2-9% worse
10-19% worse
≥ 20% worse

Road Safety Country Overview-META DATA
Project co-financed by the European Commission, Directorate-General for Mobility and Transport 4 / 14
Programs and measures
National strategic plans and targets – Information about the status of the program (actually launched or in preparation). – Targets (with year of reference): Table 5: Road safety targets for the country.
Year Fatalities Other indicator(s) such as serious injuries
2020 or other target year
% decrease (see reference year) or number (of fatalities…). No European reference.
idem
Priority topics: o List of priority items in the RS plan. No European reference (Source: national sources) • Road infrastructure Table 6: Description of the road categories and their characteristics in the country (Source: TiS.PT, 2003).
Road type Speed limit (km/h)
Urban roads Speed limit on each road type. No European reference.
Rural roads
Motorways
Special rules for: o List of vehicle types and special rules that apply to them. No European
reference.
Availability of guidelines and strategic plans for infrastructure in the country. Table 7: Obligatory parts of infrastructure management in the country and other European countries. (Sources: DG-TREN, 2010; national sources)
Obligatory parts in the country: Meta data
Safety impact assessment: yes/no Is this type of action obligatory (yes) or not? Reference: most frequent situation in Europe (mode).
Road safety audits: yes/no
Road safety inspections: yes/no
Black spot treatment: yes/no
– Recent actions concerning infrastructure have been addressing: o List of actions

Road Safety Country Overview-META DATA
Project co-financed by the European Commission, Directorate-General for Mobility and Transport 5 / 14
Traffic laws and regulations Table 8: Description of the regulations in the country in relation to the most common regulations in other European countries. (Sources: [1] DG-TREN, 2005; [2] national sources; [3] ETSC; [4] DG-TREN, 2008; [5] DG-TREN, 2010)
Regulations in the country Meta data
Allowed BAC level: ‰;
Novice drivers: ‰;
Professional drivers in passenger transport: ‰.
Allowed blood alcohol level for each indicated group of road users. Reference: most common BAC-level in Europe (mode).
Phoning:
Hand held:
Hands free:
Whether hand-held and hands-free phoning is allowed while driving (a car). Reference: most common situation in Europe (mode).
Use of restraint systems:
Driver:
Front passenger:
Rear passenger:
Children:
Whether the use of restraint systems in cars is obligatory, recommended, or not regulated. Reference: most common situation in Europe (mode).
Helmet wearing:
Motor riders:
Moped riders:
Cyclists:
Whether the use of helmets is obligatory, recommended, or not regulated for each road-user category. Reference: most common situation in Europe (mode).
– Free regulation issues like DRL and demerit point systems. No European reference.
Enforcement Table 9: Effectiveness of enforcement effort in the country according to an international respondent consensus (scale = 0-10) (Source: DG-TREN, 2010)
Issue Score for the
country Most common in Europe
(% of countries)
Speed legislation enforcement
Score of effectiveness (10-point scale)
Most frequent score among the scored countries (mode)
Seat-belt law enforcement
Child restraint law enforcement
Helmet legislation enforcement
Road Safety Country Overview-META DATA
Project co-financed by the European Commission, Directorate-General for Mobility and Transport 6 / 14
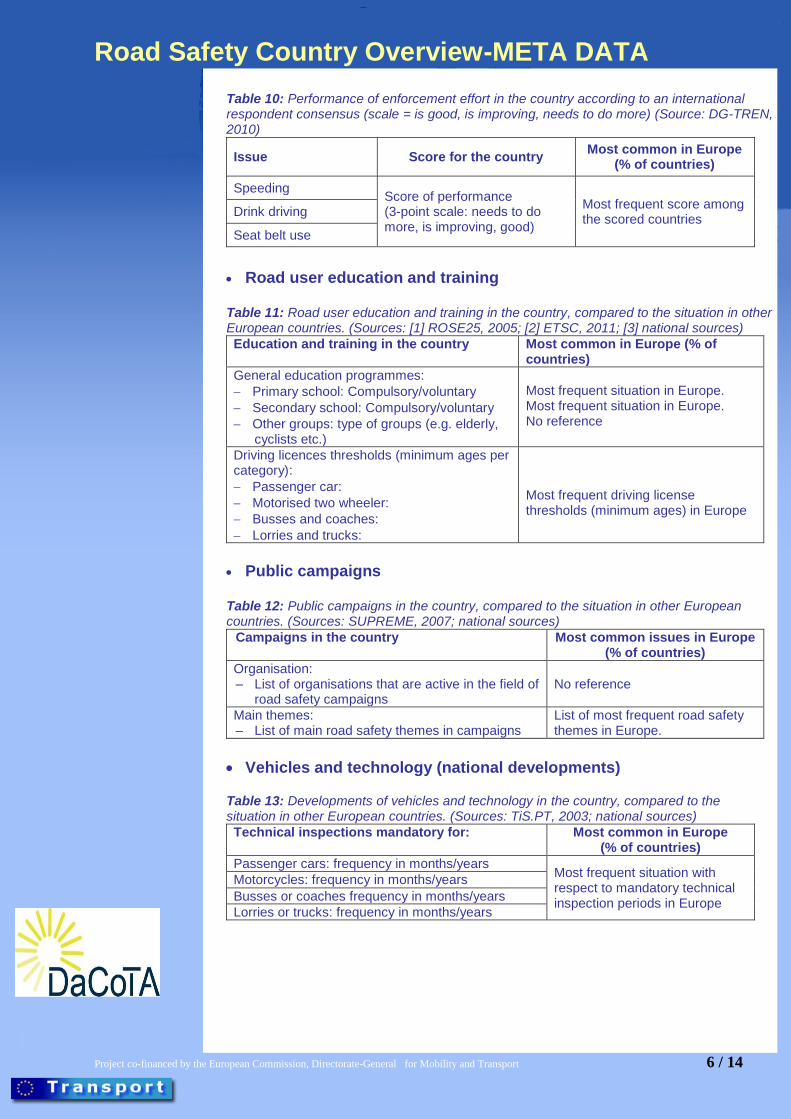
Table 10: Performance of enforcement effort in the country according to an international respondent consensus (scale = is good, is improving, needs to do more) (Source: DG-TREN, 2010)
Issue Score for the country Most common in Europe
(% of countries)
Speeding Score of performance (3-point scale: needs to do more, is improving, good)
Most frequent score among the scored countries
Drink driving
Seat belt use
Road user education and training
Table 11: Road user education and training in the country, compared to the situation in other European countries. (Sources: [1] ROSE25, 2005; [2] ETSC, 2011; [3] national sources)
Education and training in the country Most common in Europe (% of countries)
General education programmes:
Primary school: Compulsory/voluntary
Secondary school: Compulsory/voluntary
Other groups: type of groups (e.g. elderly, cyclists etc.)
Most frequent situation in Europe. Most frequent situation in Europe. No reference
Driving licences thresholds (minimum ages per category):
Passenger car:
Motorised two wheeler:
Busses and coaches:
Lorries and trucks:
Most frequent driving license thresholds (minimum ages) in Europe
Public campaigns Table 12: Public campaigns in the country, compared to the situation in other European countries. (Sources: SUPREME, 2007; national sources)
Campaigns in the country Most common issues in Europe (% of countries)
Organisation: – List of organisations that are active in the field of
road safety campaigns
No reference
Main themes: – List of main road safety themes in campaigns
List of most frequent road safety themes in Europe.
Vehicles and technology (national developments) Table 13: Developments of vehicles and technology in the country, compared to the situation in other European countries. (Sources: TiS.PT, 2003; national sources)
Technical inspections mandatory for: Most common in Europe (% of countries)
Passenger cars: frequency in months/years Most frequent situation with respect to mandatory technical inspection periods in Europe
Motorcycles: frequency in months/years
Busses or coaches frequency in months/years
Lorries or trucks: frequency in months/years
Road Safety Country Overview-META DATA
Project co-financed by the European Commission, Directorate-General for Mobility and Transport 7 / 14
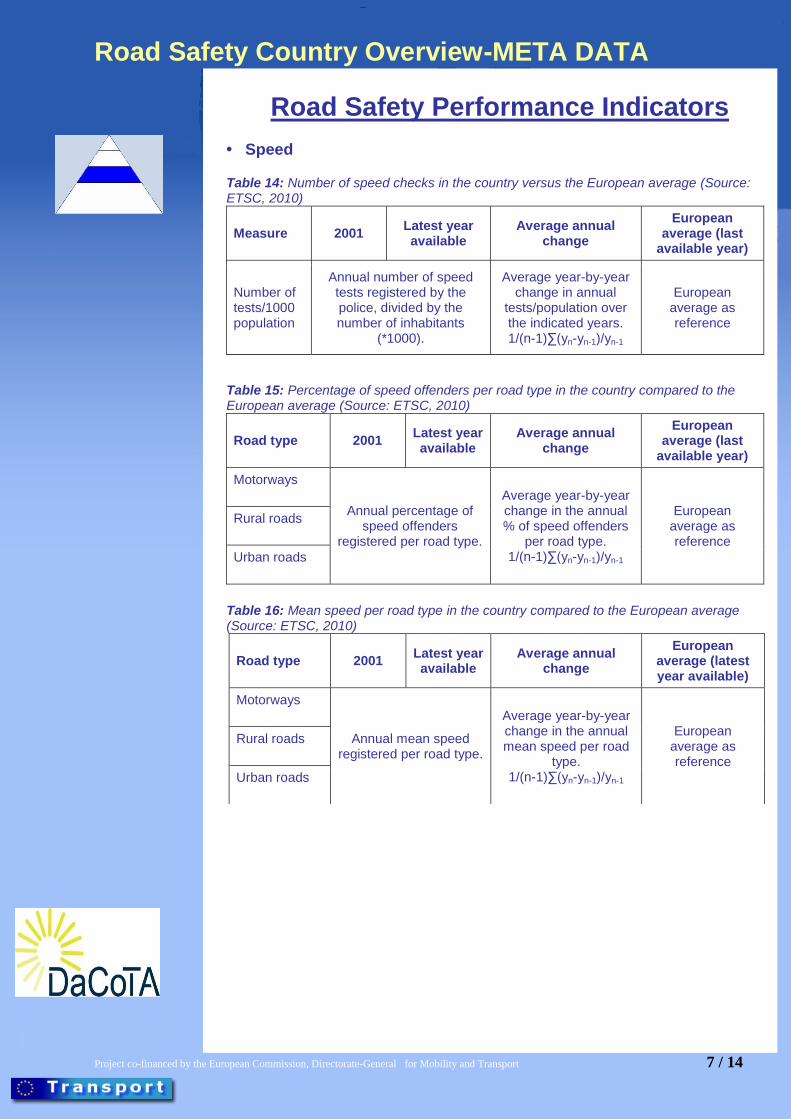
Road Safety Performance Indicators
• Speed Table 14: Number of speed checks in the country versus the European average (Source: ETSC, 2010)
Measure 2001 Latest year available
Average annual change
European average (last
available year)
Number of tests/1000 population
Annual number of speed tests registered by the police, divided by the number of inhabitants
(*1000).
Average year-by-year change in annual
tests/population over the indicated years. 1/(n-1)∑(yn-yn-1)/yn-1
European average as reference
Table 15: Percentage of speed offenders per road type in the country compared to the European average (Source: ETSC, 2010)
Road type 2001 Latest year available
Average annual change
European average (last
available year)
Motorways
Annual percentage of speed offenders
registered per road type.
Average year-by-year change in the annual % of speed offenders
per road type. 1/(n-1)∑(yn-yn-1)/yn-1
European average as reference
Rural roads
Urban roads
Table 16: Mean speed per road type in the country compared to the European average (Source: ETSC, 2010)
Road type 2001 Latest year available
Average annual change
European average (latest year available)
Motorways
Annual mean speed registered per road type.
Average year-by-year change in the annual mean speed per road
type. 1/(n-1)∑(yn-yn-1)/yn-1
European average as reference
Rural roads
Urban roads

Road Safety Country Overview-META DATA
Project co-financed by the European Commission, Directorate-General for Mobility and Transport 8 / 14
• Alcohol Table 17: Road side surveys for drink-driving in the country compared to the European average (Source: ETSC, 2010)
Measure 2001 Last year available
Average annual change
European average
(last year available)
Number of tests/1000 population
Annual number of drink-driving tests registered by the police,
divided by the number of inhabitants (*1000)
Average year-by-year change in
rates. 1/(n-1)*
∑(yn-yn-1)/yn-1
European average of the rates.
% tested over the limit
Annual number of people tested over the BAC limit in
road side surveys.
Vehicles Table 18: State of the vehicle fleet in the country compared to the European average (Source: ETSC, 2009)
Vehicle fleet in the country European average
Cars per age group (last year available):
% ≤ 2 years,
% 2 to 5 years,
% 6 to 10 years,
% > 10 year.
Average European shares of passenger cars per age group.
EuroNCAP occupant protection score of cars (new cars sold in the latest year available):
5 stars: % of new cars with 5 stars
4 stars: % of new cars with 4 stars
3 stars: % of new cars with 3 stars
2 stars: % of new cars with 2 stars
Average European shares of new cars per star-category.
Protective systems Table 19: Protective system use in the country versus the average in Europe (Source: Vis & Eksler, 2008, national sources)
Use of protective systems in the country European average
Daytime seat belt wearing in cars and vans (last year available; daytime wearing rates):
% front,
% driver
% front passenger
% rear,
% child restraint systems
Annual European average of seat belt wearing rates in passenger cars per seat location.
Helmet use (last year available):
% motor riders,
% moped riders,
% cyclists
Annual European average of helmet wearing rates per type of two-wheeler.
Road Safety Country Overview-META DATA
Project co-financed by the European Commission, Directorate-General for Mobility and Transport 9 / 14
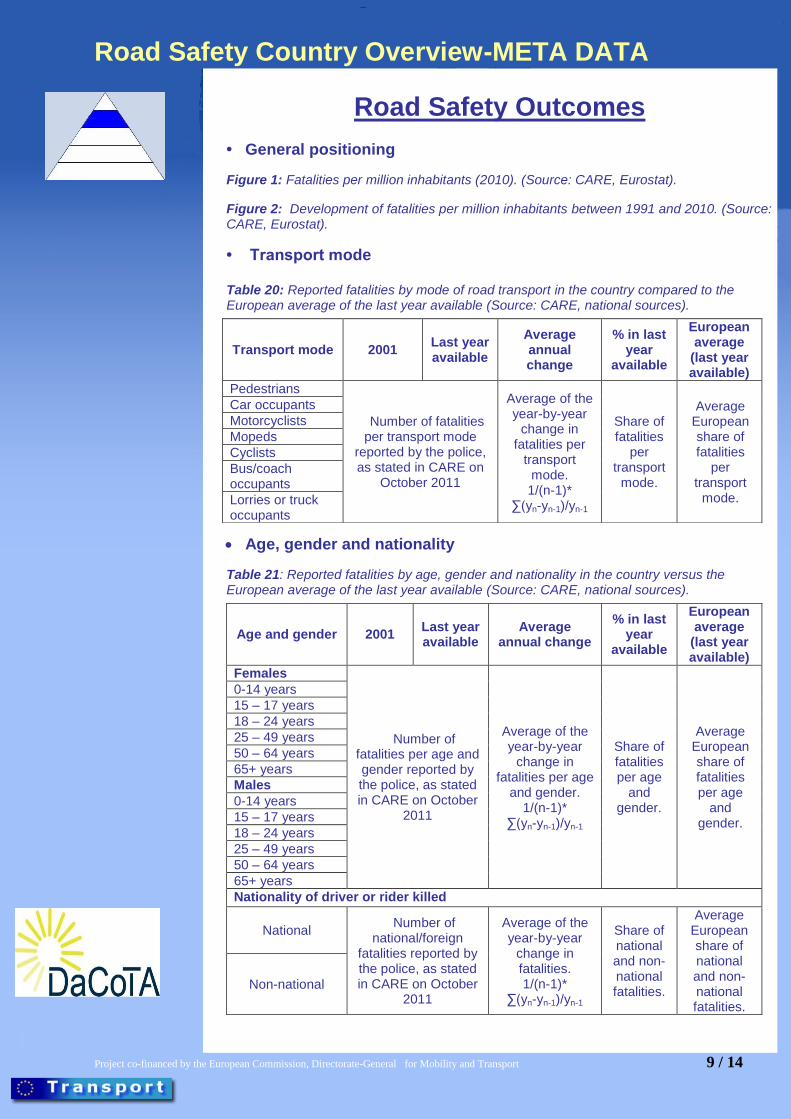
Road Safety Outcomes
• General positioning
Figure 1: Fatalities per million inhabitants (2010). (Source: CARE, Eurostat).
Figure 2: Development of fatalities per million inhabitants between 1991 and 2010. (Source: CARE, Eurostat).
• Transport mode Table 20: Reported fatalities by mode of road transport in the country compared to the European average of the last year available (Source: CARE, national sources).
Age, gender and nationality
Table 21: Reported fatalities by age, gender and nationality in the country versus the European average of the last year available (Source: CARE, national sources).
Transport mode 2001 Last year available
Average annual change
% in last year
available
European average
(last year available)
Pedestrians
Number of fatalities per transport mode
reported by the police, as stated in CARE on
October 2011
Average of the year-by-year
change in fatalities per
transport mode. 1/(n-1)*
∑(yn-yn-1)/yn-1
Share of fatalities
per transport
mode.
Average European share of fatalities
per transport
mode.
Car occupants
Motorcyclists
Mopeds
Cyclists
Bus/coach occupants
Lorries or truck occupants
Age and gender 2001 Last year available
Average annual change
% in last year
available
European average
(last year available)
Females
Number of fatalities per age and gender reported by the police, as stated in CARE on October
2011
Average of the year-by-year
change in fatalities per age
and gender. 1/(n-1)*
∑(yn-yn-1)/yn-1
Share of fatalities per age
and gender.
Average European share of fatalities per age
and gender.
0-14 years
15 – 17 years
18 – 24 years
25 – 49 years
50 – 64 years
65+ years
Males
0-14 years
15 – 17 years
18 – 24 years
25 – 49 years
50 – 64 years
65+ years
Nationality of driver or rider killed
National
Number of national/foreign
fatalities reported by the police, as stated in CARE on October
2011
Average of the year-by-year
change in fatalities. 1/(n-1)*
∑(yn-yn-1)/yn-1
Share of national and non-national fatalities.
Average European share of national and non-national fatalities.
Non-national
Road Safety Country Overview-META DATA
Project co-financed by the European Commission, Directorate-General for Mobility and Transport 10 / 14
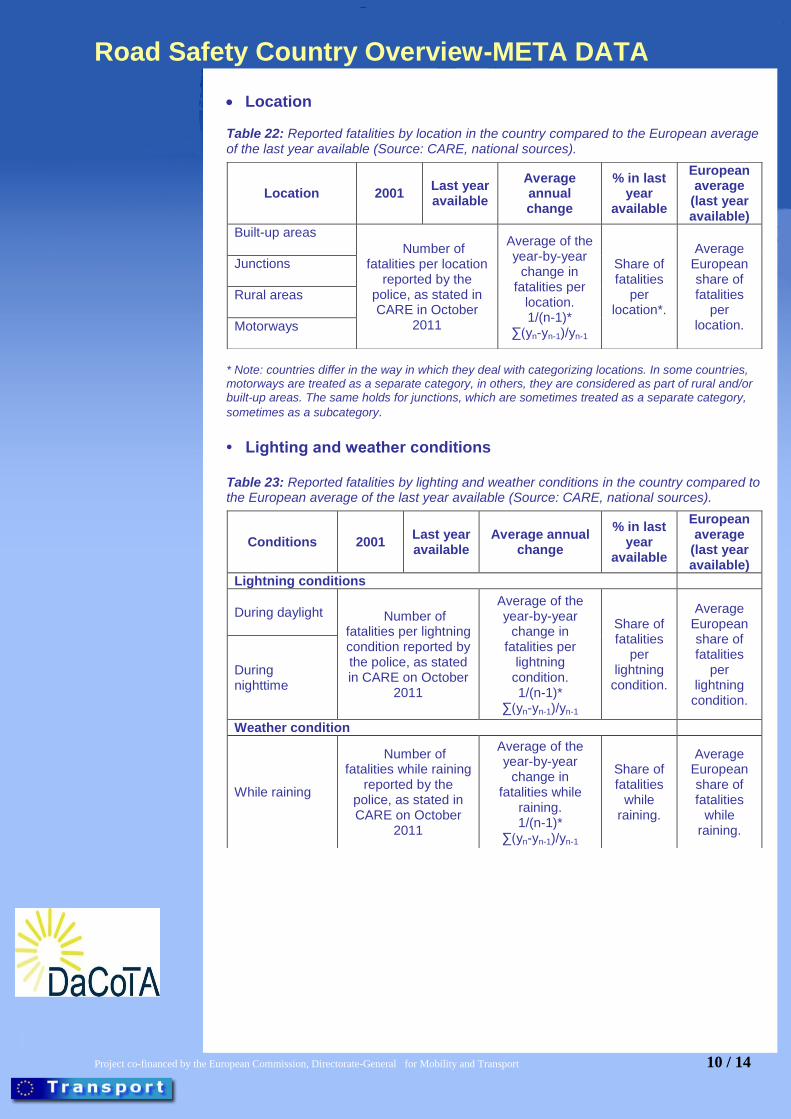
Location Table 22: Reported fatalities by location in the country compared to the European average of the last year available (Source: CARE, national sources).
* Note: countries differ in the way in which they deal with categorizing locations. In some countries, motorways are treated as a separate category, in others, they are considered as part of rural and/or built-up areas. The same holds for junctions, which are sometimes treated as a separate category,
sometimes as a subcategory.
• Lighting and weather conditions Table 23: Reported fatalities by lighting and weather conditions in the country compared to the European average of the last year available (Source: CARE, national sources).
Location 2001 Last year available
Average annual change
% in last year
available
European average
(last year available)
Built-up areas Number of
fatalities per location reported by the
police, as stated in CARE in October
2011
Average of the year-by-year
change in fatalities per
location. 1/(n-1)*
∑(yn-yn-1)/yn-1
Share of fatalities
per location*.
Average European share of fatalities
per location.
Junctions
Rural areas
Motorways
Conditions 2001 Last year available
Average annual change
% in last year
available
European average
(last year available)
Lightning conditions
During daylight
Number of fatalities per lightning condition reported by the police, as stated in CARE on October
2011
Average of the year-by-year
change in fatalities per
lightning condition. 1/(n-1)*
∑(yn-yn-1)/yn-1
Share of fatalities
per lightning
condition.
Average European share of fatalities
per lightning condition.
During nighttime
Weather condition
While raining
Number of fatalities while raining
reported by the police, as stated in CARE on October
2011
Average of the year-by-year
change in fatalities while
raining. 1/(n-1)*
∑(yn-yn-1)/yn-1
Share of fatalities
while raining.
Average European share of fatalities
while raining.
Road Safety Country Overview-META DATA
Project co-financed by the European Commission, Directorate-General for Mobility and Transport 11 / 14
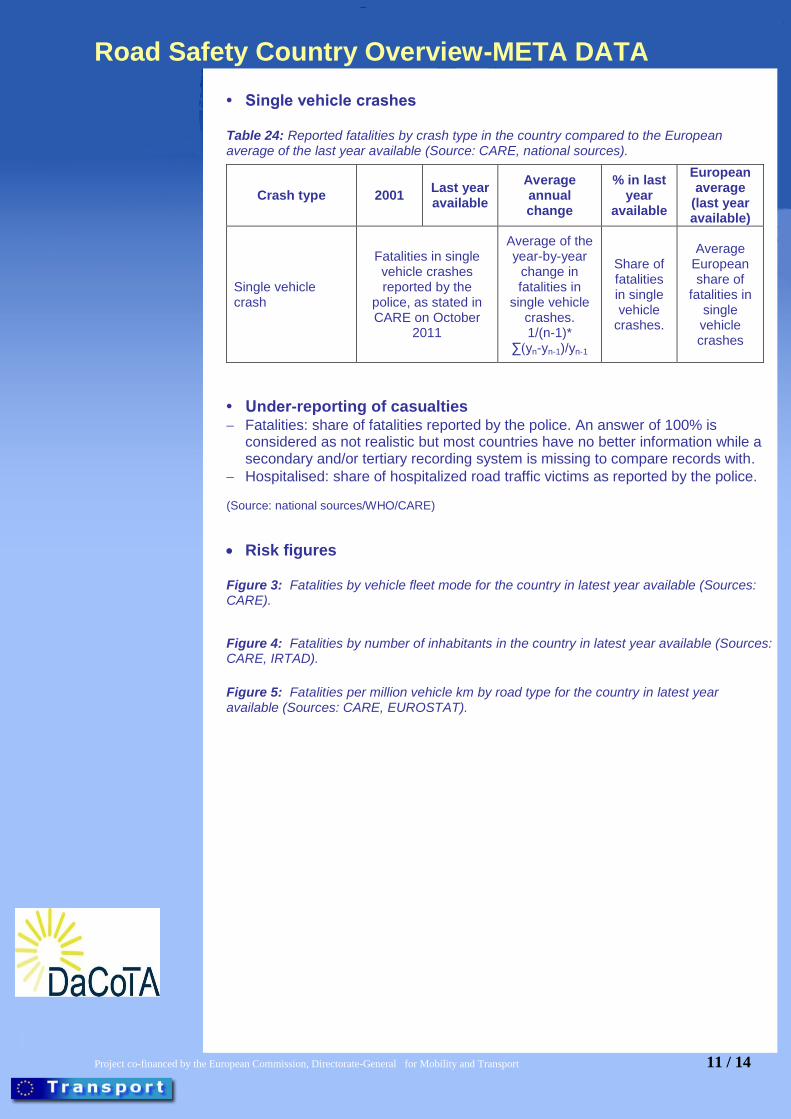
• Single vehicle crashes Table 24: Reported fatalities by crash type in the country compared to the European average of the last year available (Source: CARE, national sources).
• Under-reporting of casualties Fatalities: share of fatalities reported by the police. An answer of 100% is
considered as not realistic but most countries have no better information while a secondary and/or tertiary recording system is missing to compare records with.
Hospitalised: share of hospitalized road traffic victims as reported by the police.
(Source: national sources/WHO/CARE)
Risk figures Figure 3: Fatalities by vehicle fleet mode for the country in latest year available (Sources: CARE).
Figure 4: Fatalities by number of inhabitants in the country in latest year available (Sources: CARE, IRTAD).
Figure 5: Fatalities per million vehicle km by road type for the country in latest year available (Sources: CARE, EUROSTAT).
Crash type 2001 Last year available
Average annual change
% in last year
available
European average
(last year available)
Single vehicle crash
Fatalities in single vehicle crashes reported by the
police, as stated in CARE on October
2011
Average of the year-by-year
change in fatalities in
single vehicle crashes. 1/(n-1)*
∑(yn-yn-1)/yn-1
Share of fatalities in single vehicle
crashes.
Average European share of
fatalities in single vehicle crashes
Road Safety Country Overview-META DATA
Project co-financed by the European Commission, Directorate-General for Mobility and Transport 12 / 14
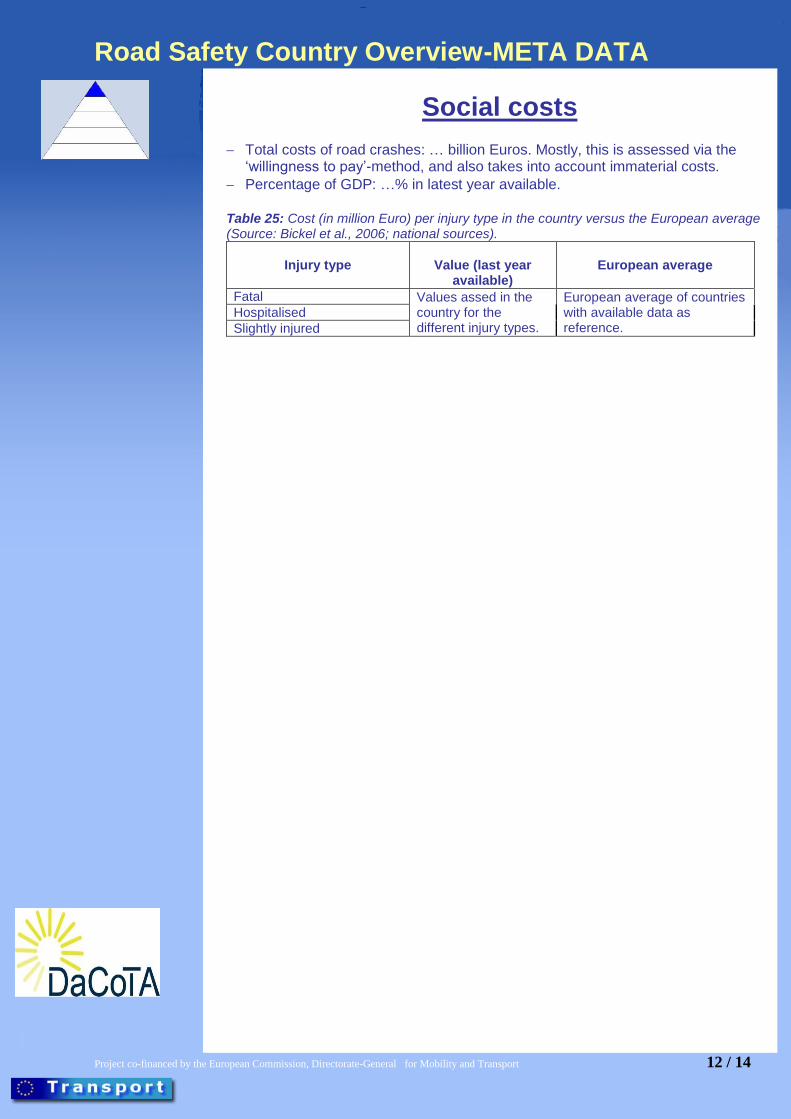
Social costs
Total costs of road crashes: … billion Euros. Mostly, this is assessed via the ‘willingness to pay’-method, and also takes into account immaterial costs.
Percentage of GDP: …% in latest year available.
Table 25: Cost (in million Euro) per injury type in the country versus the European average (Source: Bickel et al., 2006; national sources).
Injury type
Value (last year available)
European average
Fatal Values assed in the country for the different injury types.
European average of countries with available data as reference.
Hospitalised
Slightly injured
Road Safety Country Overview-META DATA
Project co-financed by the European Commission, Directorate-General for Mobility and Transport 13 / 14
Synthesis
Safety position Safety position (fatalities per population) in relation to the other European
countries
Scope of problem List of most remarkable problems (particularly those issues that show to be
worse than the European reference)
Recent progress List of progress issues (particularly those issues that are more positive for road
safety than the average progress in European)
Remarkable road safety policy issues List of measures or program issues in the country that are positive for road
safety (particularly those measures that are good for road safety and in which the country is marching ahead of the European reference).
Road Safety Country Overview-META DATA
Project co-financed by the European Commission, Directorate-General for Mobility and Transport 14 / 14
Literature
Bickel, P. et al (2006) HEATCO deliverable 5. Proposal for harmonised guidelines. EU-project developing harmonised European approaches for transport costing and project assessment (HEATCO). Institut für Energiewissenschaft und Rationelle Energieanwendung, Stuttgart.
CARE database
CIA database
Mogens, W., Ross, A. & Mertner, J. (2008) Review of road safety management capacity in Bulgaria for the World Bank. Report no. 1, issue 2. COWI, Kongens Lyngby, Denmark
DG-TREN (2005) Road safety country profiles (on website http://ec.europa.eu/transport/road_safety/observatory/country_profiles_en.htm)
DG-TREN (2008) Day time running lights (on website http://ec.europa.eu/transport/road_safety/observatory/doc/drl_rules.pdf)
DG-TREN (2010). Technical Assistance in support of the Preparation of the European Road Safety Action Program 2011-2020. Final Report. DG-TREN, Brussels
ETSC (2009). Boost the market for safer cars across Europe. + Background tables PIN Flash no.13. ETSC, Brussels
ETSC (2010). Tackling the three main killers on the road. A priority for the forthcoming EU Road Safety Action Program + Background tables. PIN Flash no.16. ETSC, Brussels
ETSC (2011) www.etsc.eu/faq.php (FAQ on driving licensing has been removed now)
ETSC (2011) Fifth road safety PIN report 2011. PIN report 19. ETSC, Brussels
ETSC (2012). ETSC Memorandum to the Cyprus presidency of EU. July 2012. ETSC, Brussels.
Eurostat database
National sources: via CARE national experts
OECD/ITF (2011). IRTAD Road Safety 2010. Annual Report. OECD/ITF, Brussels
ROSE25 (2005). Inventory and compiling of a European good practice guide on road safety education targeted at young people. Final report. KfV, Vienna
SARTRE (2004). European drivers and road risk. SARTRE 3 results. INRETS, Arcueil Cedex.
SUPREME (2007) Final Report Part F1. Thematic Report: Education and Campaigns. European Commission, Brussels.
TiS.PT (2003). Study on Road Traffic Rules and Corresponding Enforcement Actions in the Member States of the European Union. European Commission Directorate-General Energy and Transport, Brussels.
UNECE database
Vis, M.A. and Eksler, V. (Eds.) (2008) Road Safety Performance Indicators: Updated Country Comparisons. Deliverable D3.11a of the EU FP6 project SafetyNet.
WHO (2009) Global status report on road safety. Time for action. World Health Organisation, Geneve.