road to better work-life balance? lean redesigns and time
TRANSCRIPT

1
Dorothy Hung, Ph.D., Gabriela Mujal, M.H.A., Anqi Jin, Ph.D. Sutter Health, Center for Health Systems ResearchPalo Alto Medical Foundation Research Institute
Agency for Healthcare Research and Quality1 R01 HS2452901
Center for Lean Engagement and Research (CLEAR)Lean Healthcare Research Symposium 2020
Road to Better Work-Life Balance? Lean Redesigns and Time Working Among Primary Care Physicians
BackgroundØ Over half of primary care
physicians (PCPs) reportsymptoms of burnout
Ø 44% PCPs work 60+ hours/week: both administrative and clinical
Ø Growing interest in Lean thinking, redesigns• Standardization, Flow design, Team roles & task engagement
v Can Lean redesigns reduce PCP work hours?
Ø We use time-stamped EHR data (Epic®) to examine immediate and longer-term changes in work patterns
2
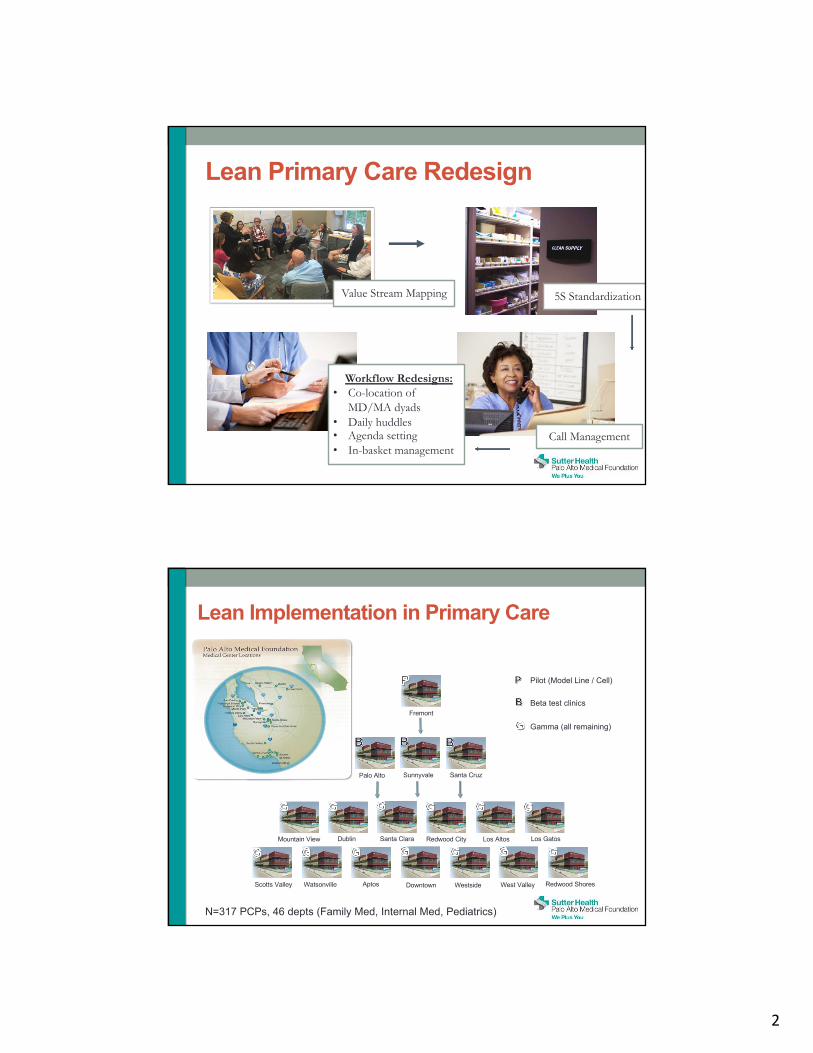
Workflow Redesigns:• Co-location of
MD/MA dyads• Daily huddles• Agenda setting• In-basket management
Value Stream Mapping 5S Standardization
Call Management
Lean Primary Care Redesign
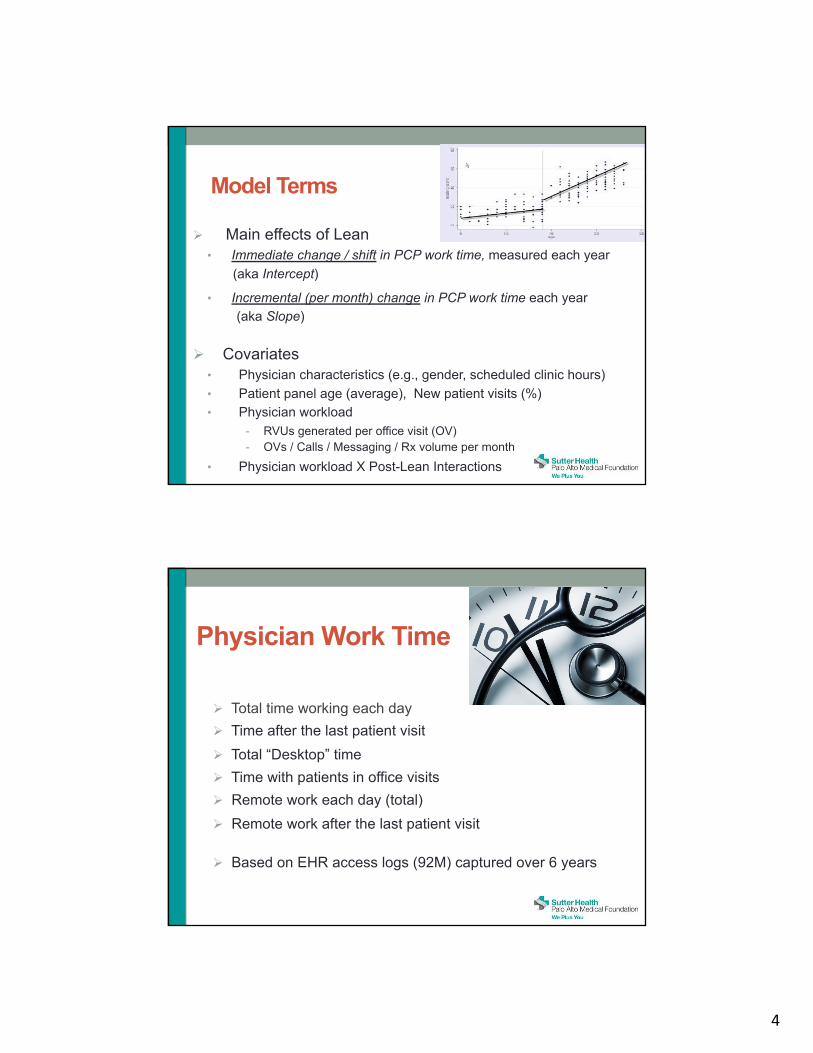
Pilot (Model Line / Cell)
Beta test clinics
Gamma (all remaining)
Fremont
Palo Alto Sunnyvale Santa Cruz
Santa ClaraMountain View Los GatosRedwood City Los AltosDublin
Downtown Westside West Valley Redwood ShoresScotts Valley Watsonville Aptos
Lean Implementation in Primary Care
N=317 PCPs, 46 depts (Family Med, Internal Med, Pediatrics)

3
Stepped-Wedge Study DesignDec. 2016
1st year post-Lean 2nd year post-Lean 3rd year + post-Lean(sustainment)
Interrupted Time Series (ITS)
Ø “Interruption”: Lean PC Redesign
Ø Unit of analysis: Physician-Month
(work time in hours)
Ø Segmented regression, generalized linear mixed models
• Segmentation allows for non-linearity of trends overextended period of observation
• Post-Lean “segments” reflected 3 time periods:
- Year 1 (vs. baseline pre-Lean)- Year 2 (vs. 1st year post = sustainment)- Year 3+ (vs. 1st year post = sustainment)
4
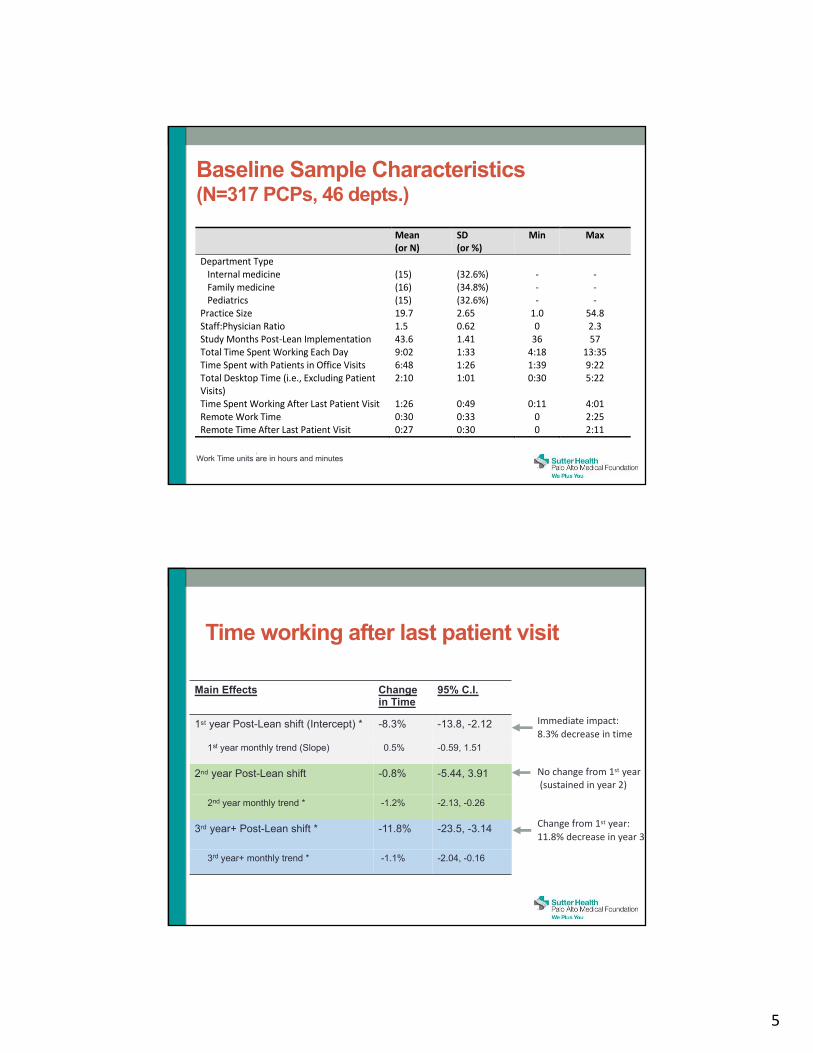
Model Terms
Ø Main effects of Lean• Immediate change / shift in PCP work time, measured each year
(aka Intercept)
• Incremental (per month) change in PCP work time each year(aka Slope)
Ø Covariates• Physician characteristics (e.g., gender, scheduled clinic hours)• Patient panel age (average), New patient visits (%)• Physician workload
- RVUs generated per office visit (OV)- OVs / Calls / Messaging / Rx volume per month
• Physician workload X Post-Lean Interactions
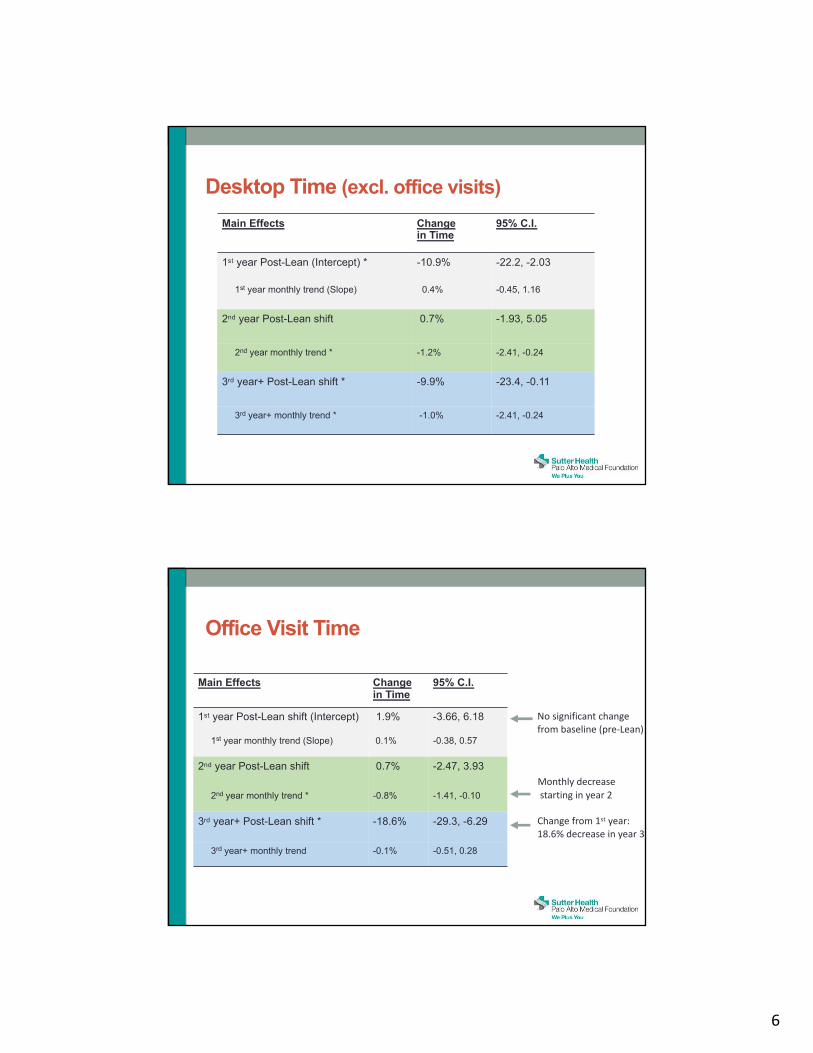
Physician Work Time
Ø Total time working each dayØ Time after the last patient visit Ø Total “Desktop” timeØ Time with patients in office visitsØ Remote work each day (total)Ø Remote work after the last patient visit
Ø Based on EHR access logs (92M) captured over 6 years
5
Baseline Sample Characteristics (N=317 PCPs, 46 depts.)
FTE: Full-time equivalentWork Time units are in hours and minutes
Mean (or N)
SD (or %)
Min Max
Department Type Internal medicine (15) (32.6%) - - Family medicine (16) (34.8%) - - Pediatrics (15) (32.6%) - - Practice Size (FTE) 19.7 2.65 1.0 54.8 Staff:Physician Ratio 1.5 0.62 0 2.3 Study Months Post-Lean Implementation 43.6 1.41 36 57 Total Time Spent Working Each Day 9:02 1:33 4:18 13:35 Time Spent with Patients in Office Visits 6:48 1:26 1:39 9:22 Total Desktop Time (i.e., Excluding Patient Visits)
2:10 1:01 0:30 5:22
Time Spent Working After Last Patient Visit 1:26 0:49 0:11 4:01 Remote Work Time 0:30 0:33 0 2:25 Remote Time After Last Patient Visit 0:27 0:30 0 2:11
Time working after last patient visit
Immediate impact:8.3% decrease in time
Change from 1st year:11.8% decrease in year 3
No change from 1st year(sustained in year 2)
Main Effects Changein Time
95% C.I.
1st year Post-Lean shift (Intercept) * -8.3% -13.8, -2.12
1st year monthly trend (Slope) 0.5% -0.59, 1.51
2nd year Post-Lean shift -0.8% -5.44, 3.91
2nd year monthly trend * -1.2% -2.13, -0.26
3rd year+ Post-Lean shift * -11.8% -23.5, -3.14
3rd year+ monthly trend * -1.1% -2.04, -0.16
6
Desktop Time (excl. office visits)Main Effects Change
in Time95% C.I.
1st year Post-Lean (Intercept) * -10.9% -22.2, -2.03
1st year monthly trend (Slope) 0.4% -0.45, 1.16
2nd year Post-Lean shift 0.7% -1.93, 5.05
2nd year monthly trend * -1.2% -2.41, -0.24
3rd year+ Post-Lean shift * -9.9% -23.4, -0.11
3rd year+ monthly trend * -1.0% -2.41, -0.24
Office Visit Time
No significant changefrom baseline (pre-Lean)
Monthly decreasestarting in year 2
Change from 1st year:18.6% decrease in year 3
Main Effects Changein Time
95% C.I.
1st year Post-Lean shift (Intercept) 1.9% -3.66, 6.18
1st year monthly trend (Slope) 0.1% -0.38, 0.57
2nd year Post-Lean shift 0.7% -2.47, 3.93
2nd year monthly trend * -0.8% -1.41, -0.10
3rd year+ Post-Lean shift * -18.6% -29.3, -6.29
3rd year+ monthly trend -0.1% -0.51, 0.28

7
Time Spent Working Each Day (Total)
Main Effects Changein Time
95% C.I.
1st year Post-Lean shift (Intercept) -1.1% -3.87, 1.71
1st year monthly trend (Slope) 0.2% -0.18, 0.47
2nd year Post-Lean shift 0.9% -1.53, 3.33
2nd year monthly trend * -0.8% -1.23, -0.36
3rd year+ Post-Lean shift * -20.0% -29.2, -9.60
3rd year+ monthly trend -0.2% -0.46, 0.14
Summary
Ø Importance of tracking both immediate and longer-term effects
Ø Findings align with Lean workflows to enhance team engagement and physician efficiency• 5S, MA agenda setting for patient visits, Care team management of in-basket
Ø Early effects on indirect care (desktop activity, after clinic); Larger impacts on direct patient care (OV time), Total Work Hours
Ø Related study shows that these time reductions can occur without detriment to patient experience