road traffic noise modeling: future trends in ontario · noise emission - factors • factors...
TRANSCRIPT
Road Traffic Noise Modeling: Future Trends in Ontario
Kevin Carr, P.Phys.Scott Penton, P.Eng.Marcus Li, B.Eng.
Air Quality | Wind & Climate | Sound & Vibration | Sustainable Water
The Project
• Project sponsored by the Ontario Ministry of Transportation, in consultation with the Ontario Ministry of Environment and Metrolinx
• Evaluate readily available computerised noise prediction models
• Provide recommendations on the best model for future use in Ontario, for highway, transit, and heavy rail
• Software Packages and Algorithms• Qualitative and quantitative review• Focus of this presentation is on results for Roads
– Interim results, focus on technical issues– Other considerations not covered
• Evaluate various Software Packages:– STAMSON v 5.1– STAMINA v 2.0– TNM v 2.5– Cadna/A– SoundPLAN
• Ranked on:– Cost– Market Penetration– Usability– Output– Acoustical Performance
Software Review
Software Review - Ranking
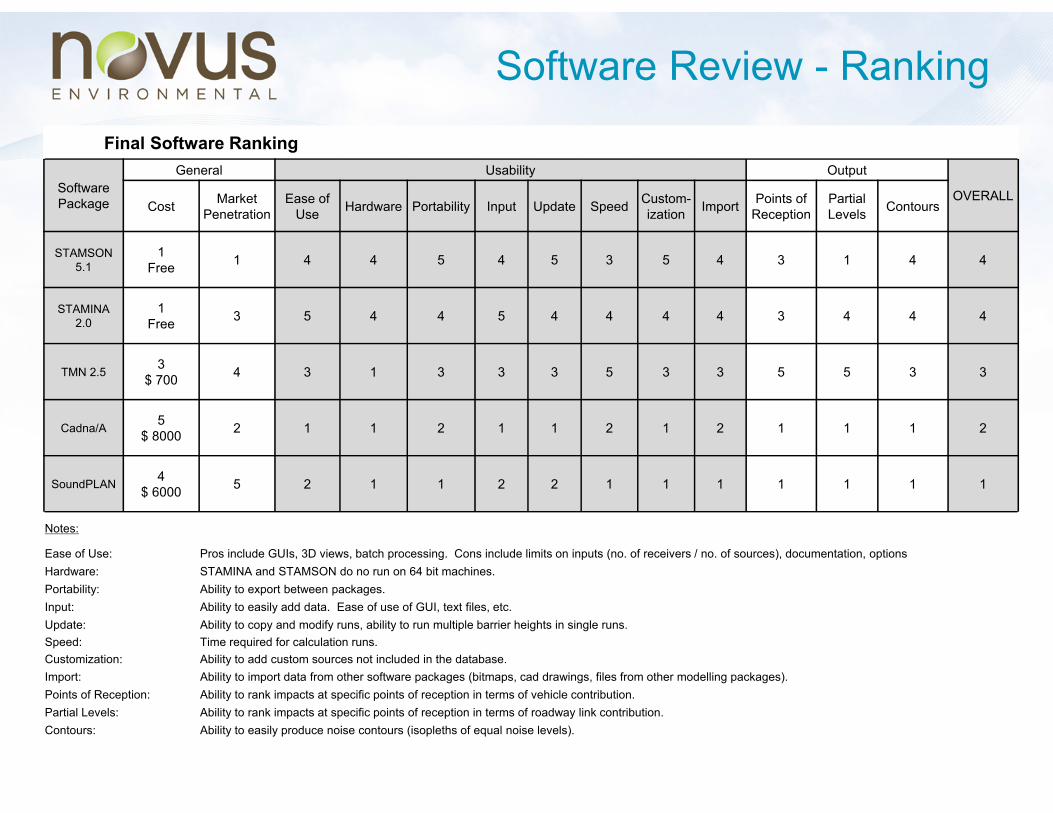
Final Software Ranking
SoftwarePackage
General Usability Output
OVERALLCost Market
PenetrationEase of
Use Hardware Portability Input Update Speed Custom-ization Import Points of
ReceptionPartialLevels Contours
STAMSON 5.1
1Free 1 4 4 5 4 5 3 5 4 3 1 4 4
STAMINA 2.0
1Free 3 5 4 4 5 4 4 4 4 3 4 4 4
TMN 2.5 3$ 700 4 3 1 3 3 3 5 3 3 5 5 3 3
Cadna/A 5$ 8000 2 1 1 2 1 1 2 1 2 1 1 1 2
SoundPLAN 4$ 6000 5 2 1 1 2 2 1 1 1 1 1 1 1
Notes:
Ease of Use: Pros include GUIs, 3D views, batch processing. Cons include limits on inputs (no. of receivers / no. of sources), documentation, optionsHardware: STAMINA and STAMSON do no run on 64 bit machines.Portability: Ability to export between packages.Input: Ability to easily add data. Ease of use of GUI, text files, etc.Update: Ability to copy and modify runs, ability to run multiple barrier heights in single runs.Speed: Time required for calculation runs.Customization: Ability to add custom sources not included in the database.Import: Ability to import data from other software packages (bitmaps, cad drawings, files from other modelling packages).Points of Reception: Ability to rank impacts at specific points of reception in terms of vehicle contribution.Partial Levels: Ability to rank impacts at specific points of reception in terms of roadway link contribution.Contours: Ability to easily produce noise contours (isopleths of equal noise levels).
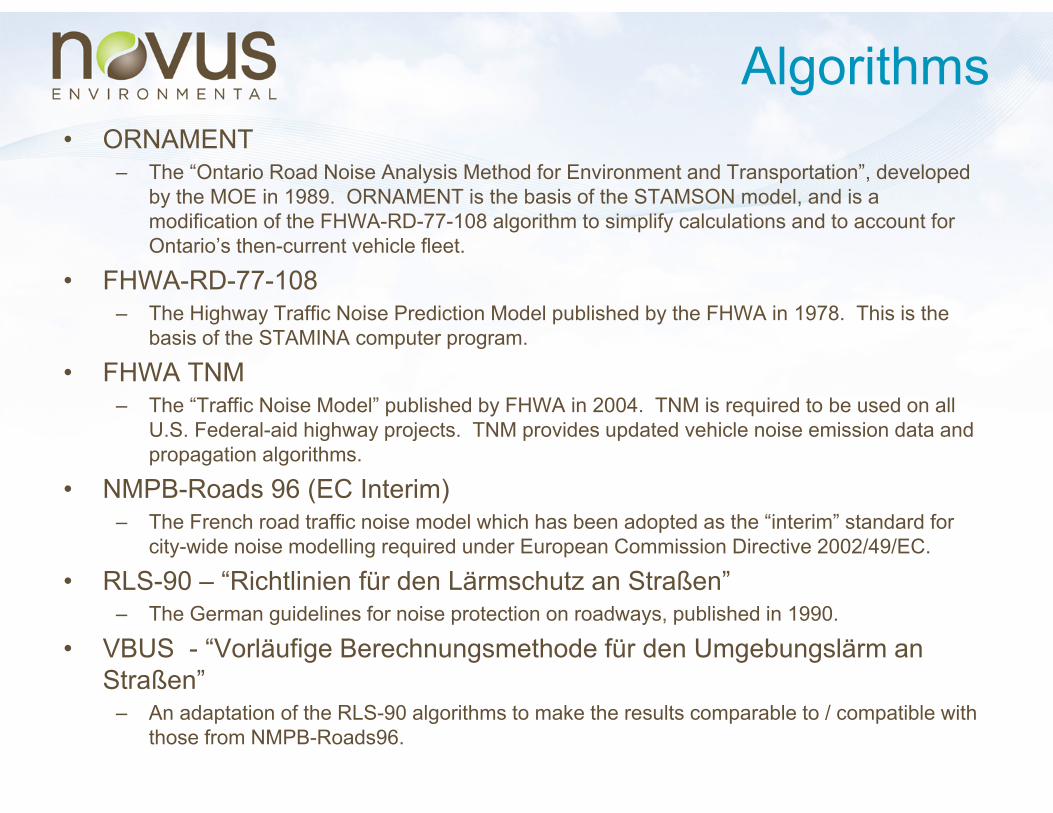
Algorithms• ORNAMENT
– The “Ontario Road Noise Analysis Method for Environment and Transportation”, developed by the MOE in 1989. ORNAMENT is the basis of the STAMSON model, and is a modification of the FHWA-RD-77-108 algorithm to simplify calculations and to account for Ontario’s then-current vehicle fleet.
• FHWA-RD-77-108– The Highway Traffic Noise Prediction Model published by the FHWA in 1978. This is the
basis of the STAMINA computer program.
• FHWA TNM – The “Traffic Noise Model” published by FHWA in 2004. TNM is required to be used on all
U.S. Federal-aid highway projects. TNM provides updated vehicle noise emission data and propagation algorithms.
• NMPB-Roads 96 (EC Interim)– The French road traffic noise model which has been adopted as the “interim” standard for
city-wide noise modelling required under European Commission Directive 2002/49/EC.
• RLS-90 – “Richtlinien für den Lärmschutz an Straßen”– The German guidelines for noise protection on roadways, published in 1990.
• VBUS - “Vorläufige Berechnungsmethode für den Umgebungslärm an Straßen”
– An adaptation of the RLS-90 algorithms to make the results comparable to / compatible with those from NMPB-Roads96.
• Ranked on:– Noise emissions– Noise propagation
Algorithms
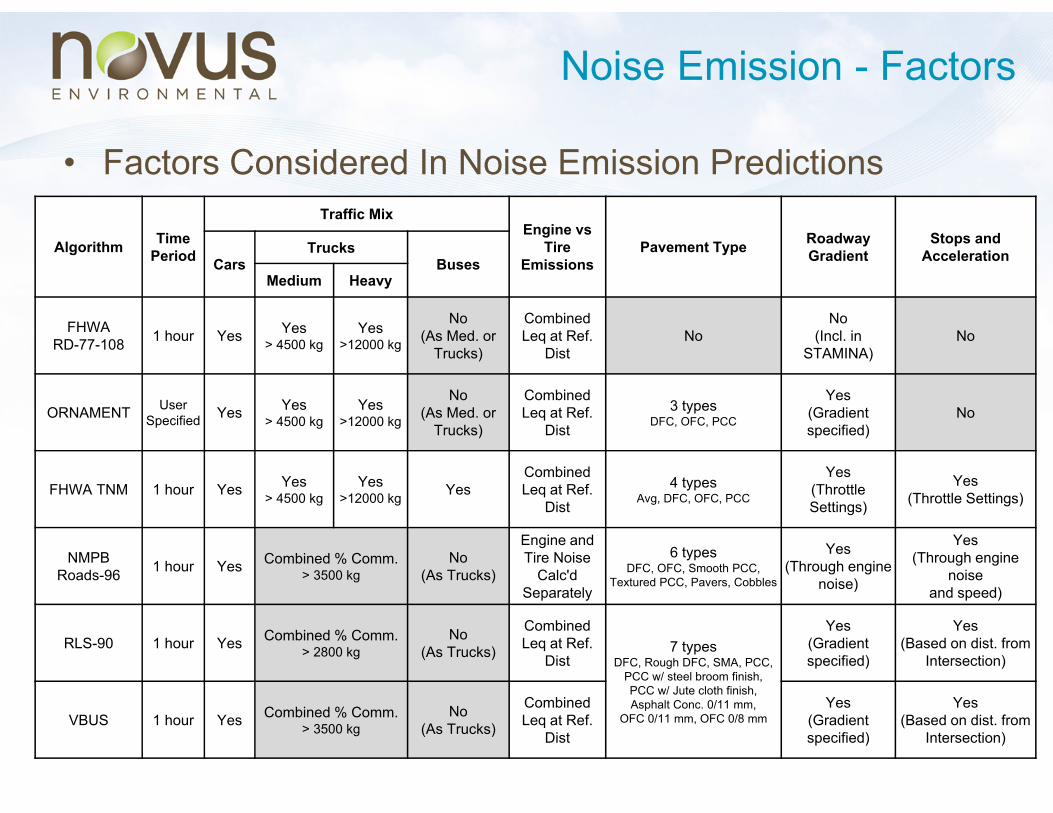
Noise Emission - Factors
• Factors Considered In Noise Emission Predictions
Algorithm Time Period
Traffic MixEngine vs
Tire Emissions
Pavement Type Roadway Gradient
Stops andAccelerationCars
TrucksBuses
Medium Heavy
FHWARD-77-108 1 hour Yes Yes
> 4500 kgYes
>12000 kg
No(As Med. or
Trucks)
Combined Leq at Ref.
DistNo
No(Incl. in
STAMINA)No
ORNAMENT User Specified Yes Yes
> 4500 kgYes
>12000 kg
No(As Med. or
Trucks)
Combined Leq at Ref.
Dist
3 typesDFC, OFC, PCC
Yes(Gradient specified)
No
FHWA TNM 1 hour Yes Yes> 4500 kg
Yes>12000 kg Yes
Combined Leq at Ref.
Dist
4 typesAvg, DFC, OFC, PCC
Yes(Throttle Settings)
Yes(Throttle Settings)
NMPB Roads-96 1 hour Yes Combined % Comm.
> 3500 kgNo
(As Trucks)
Engine and Tire Noise
Calc'dSeparately
6 typesDFC, OFC, Smooth PCC,
Textured PCC, Pavers, Cobbles
Yes(Through engine
noise)
Yes(Through engine
noise and speed)
RLS-90 1 hour Yes Combined % Comm.> 2800 kg
No(As Trucks)
Combined Leq at Ref.
Dist7 types
DFC, Rough DFC, SMA, PCC,PCC w/ steel broom finish, PCC w/ Jute cloth finish, Asphalt Conc. 0/11 mm,
OFC 0/11 mm, OFC 0/8 mm
Yes(Gradient specified)
Yes(Based on dist. from
Intersection)
VBUS 1 hour Yes Combined % Comm.> 3500 kg
No(As Trucks)
Combined Leq at Ref.
Dist
Yes(Gradient specified)
Yes(Based on dist. from
Intersection)
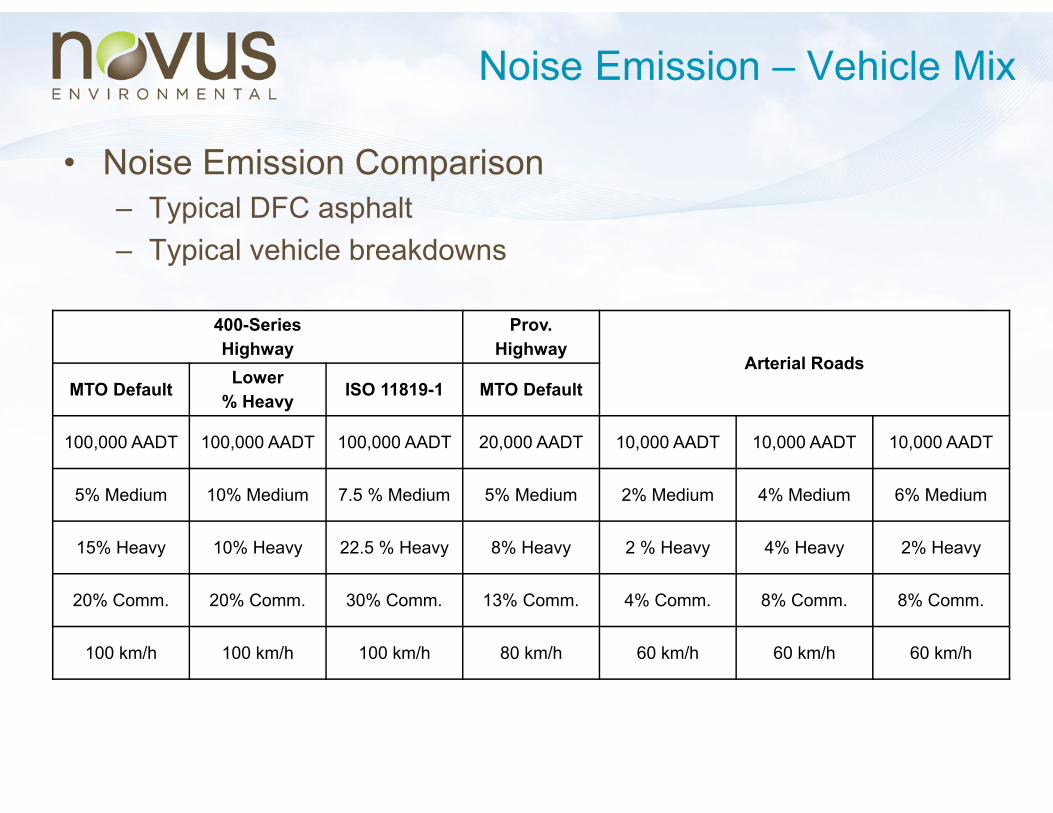
Noise Emission – Vehicle Mix
• Noise Emission Comparison– Typical DFC asphalt– Typical vehicle breakdowns
400-Series Highway
Prov. Highway
Arterial RoadsMTO Default Lower
% Heavy ISO 11819-1 MTO Default
100,000 AADT 100,000 AADT 100,000 AADT 20,000 AADT 10,000 AADT 10,000 AADT 10,000 AADT
5% Medium 10% Medium 7.5 % Medium 5% Medium 2% Medium 4% Medium 6% Medium
15% Heavy 10% Heavy 22.5 % Heavy 8% Heavy 2 % Heavy 4% Heavy 2% Heavy
20% Comm. 20% Comm. 30% Comm. 13% Comm. 4% Comm. 8% Comm. 8% Comm.
100 km/h 100 km/h 100 km/h 80 km/h 60 km/h 60 km/h 60 km/h
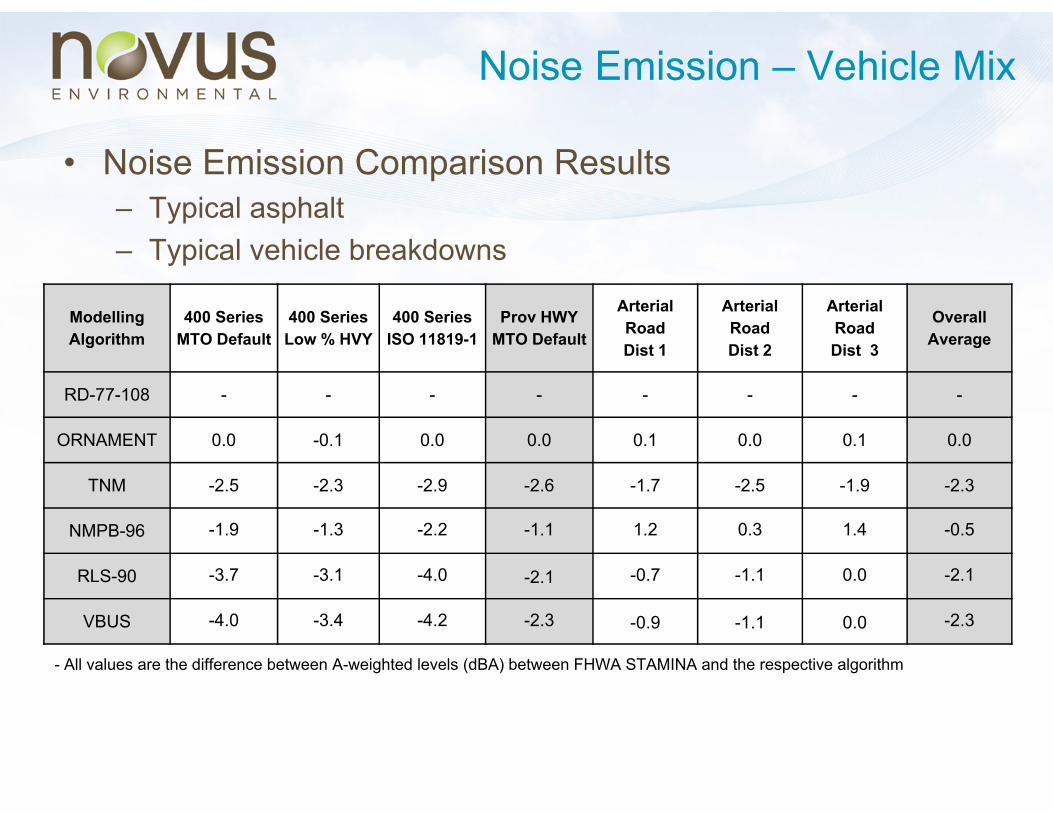
Noise Emission – Vehicle Mix
• Noise Emission Comparison Results– Typical asphalt– Typical vehicle breakdowns
Modelling Algorithm
400 SeriesMTO Default
400 SeriesLow % HVY
400 SeriesISO 11819-1
Prov HWYMTO Default
Arterial RoadDist 1
Arterial RoadDist 2
Arterial RoadDist 3
OverallAverage
RD-77-108 - - - - - - - -
ORNAMENT 0.0 -0.1 0.0 0.0 0.1 0.0 0.1 0.0
TNM -2.5 -2.3 -2.9 -2.6 -1.7 -2.5 -1.9 -2.3
NMPB-96 -1.9 -1.3 -2.2 -1.1 1.2 0.3 1.4 -0.5
RLS-90 -3.7 -3.1 -4.0 -2.1 -0.7 -1.1 0.0 -2.1
VBUS -4.0 -3.4 -4.2 -2.3 -0.9 -1.1 0.0 -2.3
- All values are the difference between A-weighted levels (dBA) between FHWA STAMINA and the respective algorithm
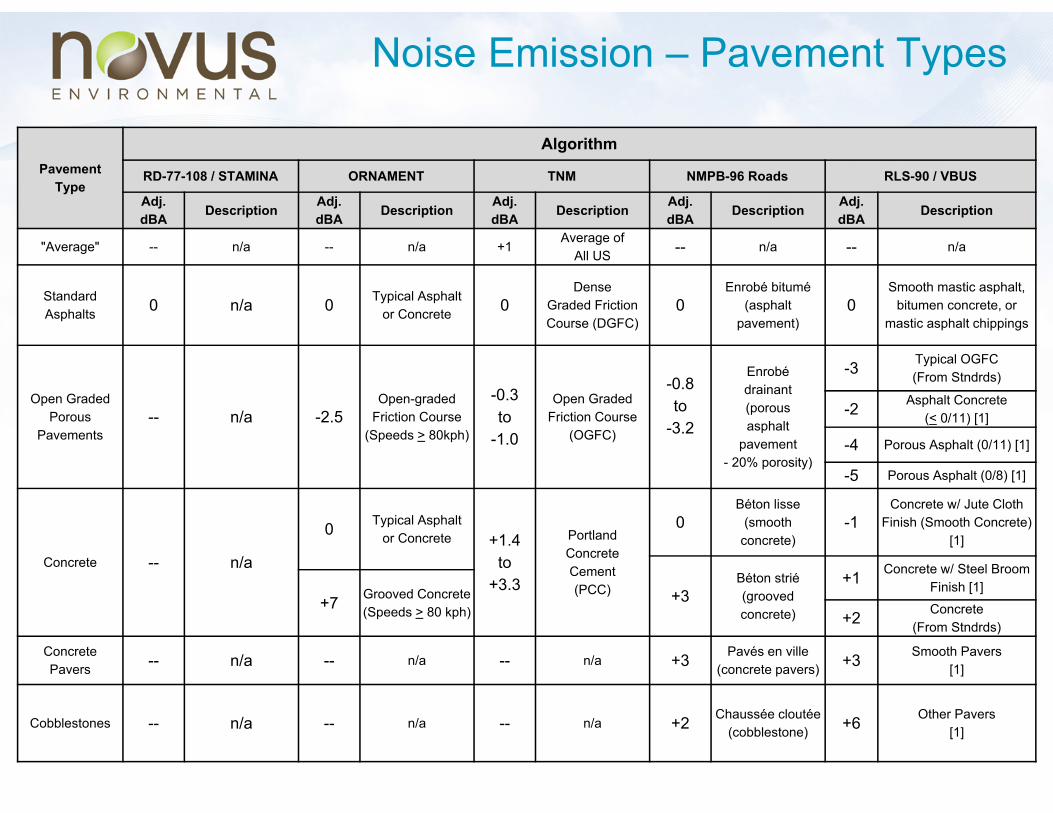
Noise Emission – Pavement Types
Pavement Type
Algorithm
RD-77-108 / STAMINA ORNAMENT TNM NMPB-96 Roads RLS-90 / VBUS
Adj. dBA Description Adj.
dBA Description Adj. dBA Description Adj.
dBA Description Adj. dBA Description
"Average" -- n/a -- n/a +1Average of
All US -- n/a -- n/a
Standard Asphalts 0 n/a 0 Typical Asphalt
or Concrete 0Dense
Graded Friction Course (DGFC)
0Enrobé bitumé
(asphalt pavement)
0Smooth mastic asphalt,
bitumen concrete, or mastic asphalt chippings
Open Graded Porous
Pavements-- n/a -2.5
Open-graded Friction Course
(Speeds > 80kph)
-0.3 to
-1.0
Open Graded Friction Course
(OGFC)
-0.8to
-3.2
Enrobédrainant(porous asphalt
pavement - 20% porosity)
-3 Typical OGFC(From Stndrds)
-2 Asphalt Concrete (< 0/11) [1]
-4 Porous Asphalt (0/11) [1]
-5 Porous Asphalt (0/8) [1]
Concrete -- n/a
0 Typical Asphalt or Concrete +1.4
to +3.3
Portland Concrete Cement (PCC)
0Béton lisse
(smooth concrete)
-1Concrete w/ Jute Cloth
Finish (Smooth Concrete) [1]
+3Béton strié(grooved concrete)
+1 Concrete w/ Steel Broom Finish [1]
+7 Grooved Concrete (Speeds > 80 kph) +2 Concrete
(From Stndrds)
Concrete Pavers -- n/a -- n/a -- n/a +3 Pavés en ville
(concrete pavers) +3 Smooth Pavers[1]
Cobblestones -- n/a -- n/a -- n/a +2 Chaussée cloutée (cobblestone) +6 Other Pavers
[1]
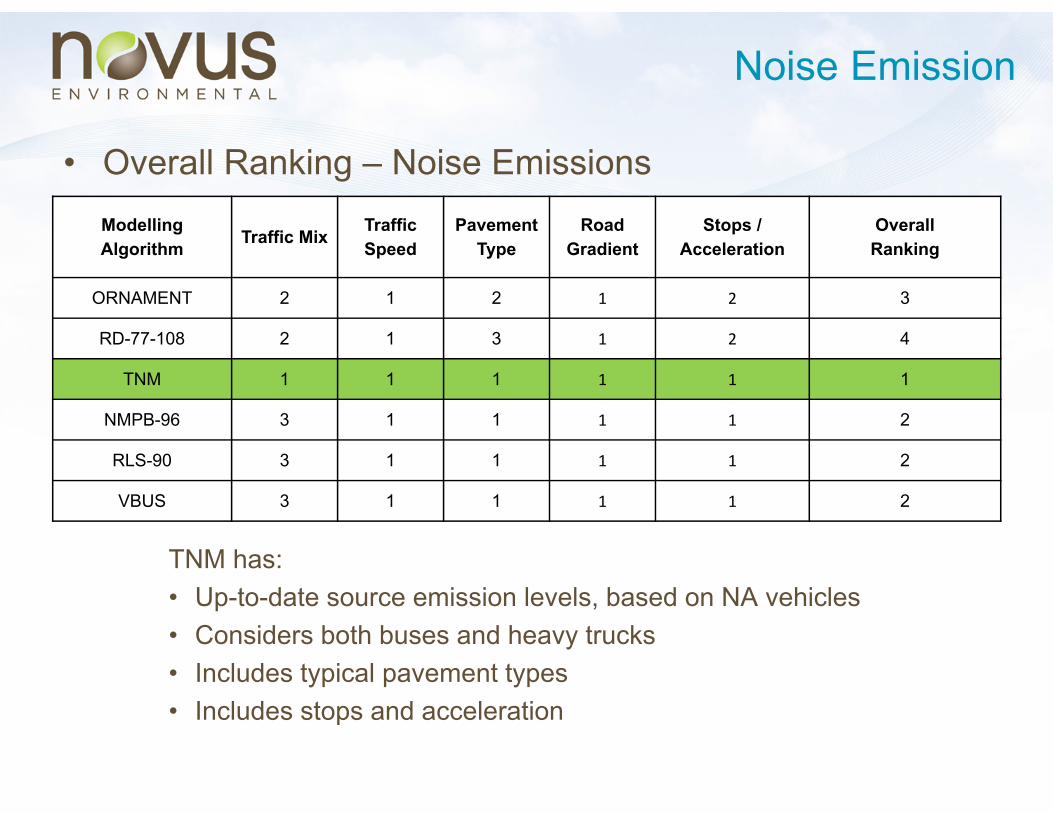
Noise Emission
• Overall Ranking – Noise Emissions
TNM has:• Up-to-date source emission levels, based on NA vehicles• Considers both buses and heavy trucks• Includes typical pavement types• Includes stops and acceleration
Modelling Algorithm Traffic Mix Traffic
SpeedPavement
TypeRoad
GradientStops /
AccelerationOverallRanking
ORNAMENT 2 1 2 1 2 3
RD-77-108 2 1 3 1 2 4
TNM 1 1 1 1 1 1
NMPB-96 3 1 1 1 1 2
RLS-90 3 1 1 1 1 2
VBUS 3 1 1 1 1 2
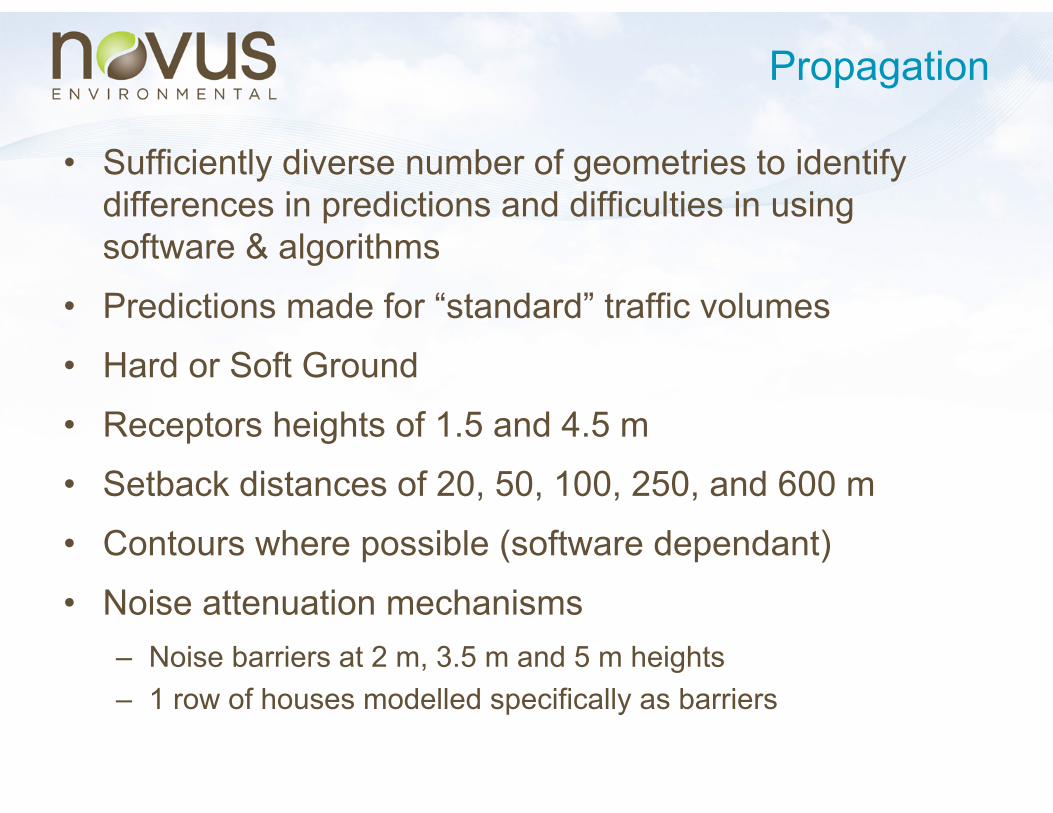
Propagation
• Sufficiently diverse number of geometries to identify differences in predictions and difficulties in using software & algorithms
• Predictions made for “standard” traffic volumes
• Hard or Soft Ground
• Receptors heights of 1.5 and 4.5 m
• Setback distances of 20, 50, 100, 250, and 600 m
• Contours where possible (software dependant)
• Noise attenuation mechanisms– Noise barriers at 2 m, 3.5 m and 5 m heights– 1 row of houses modelled specifically as barriers
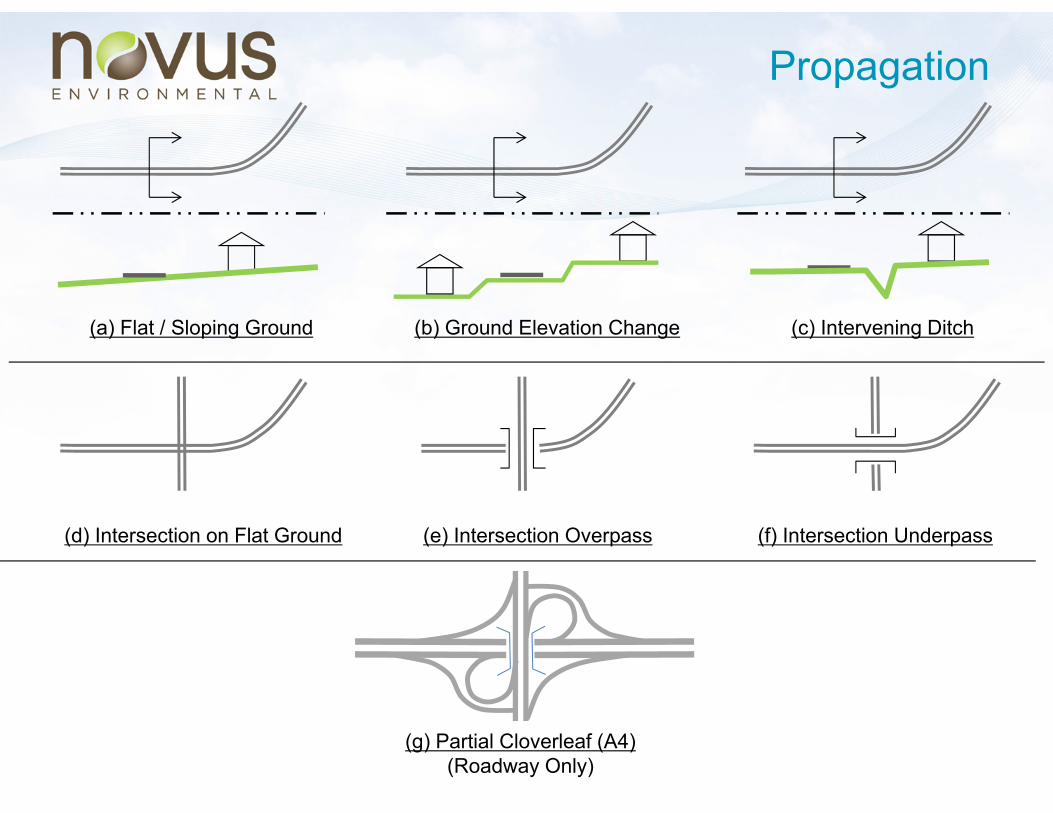
Propagation
(a) Flat / Sloping Ground (b) Ground Elevation Change (c) Intervening Ditch
(d) Intersection on Flat Ground (e) Intersection Overpass (f) Intersection Underpass
(g) Partial Cloverleaf (A4)(Roadway Only)
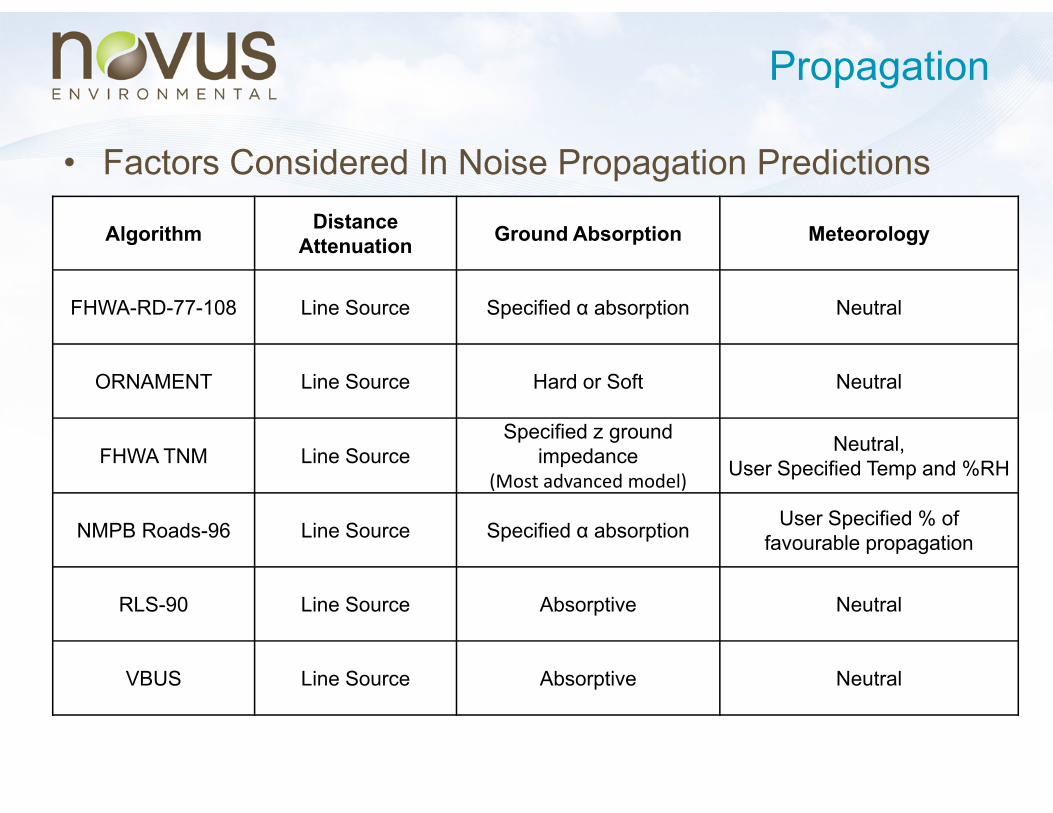
Propagation
• Factors Considered In Noise Propagation Predictions
Algorithm Distance Attenuation Ground Absorption Meteorology
FHWA-RD-77-108 Line Source Specified α absorption Neutral
ORNAMENT Line Source Hard or Soft Neutral
FHWA TNM Line SourceSpecified z ground
impedance(Most advanced model)
Neutral, User Specified Temp and %RH
NMPB Roads-96 Line Source Specified α absorption User Specified % of favourable propagation
RLS-90 Line Source Absorptive Neutral
VBUS Line Source Absorptive Neutral
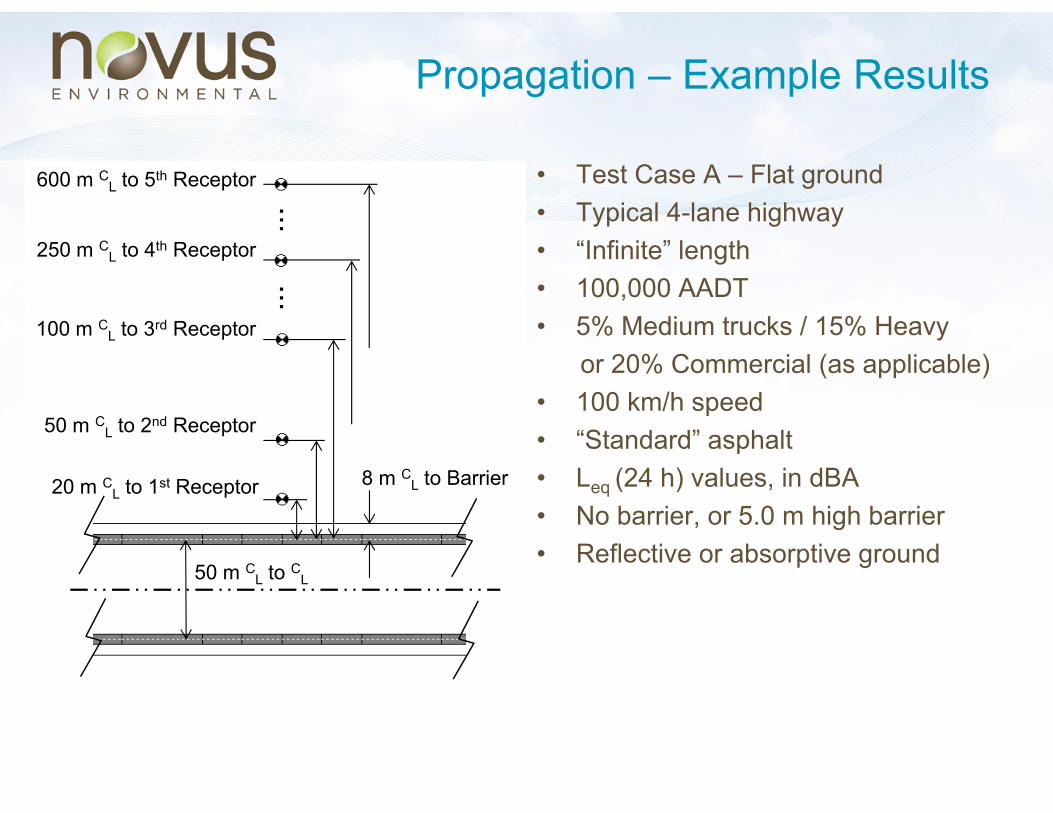
Propagation – Example Results
• Test Case A – Flat ground• Typical 4-lane highway• “Infinite” length• 100,000 AADT• 5% Medium trucks / 15% Heavy
or 20% Commercial (as applicable)• 100 km/h speed• “Standard” asphalt• Leq (24 h) values, in dBA• No barrier, or 5.0 m high barrier• Reflective or absorptive ground
50 m CL to CL
8 m CL to Barrier 20 m CL to 1st Receptor
50 m CL to 2nd Receptor
100 m CL to 3rd Receptor
...
...
250 m CL to 4th Receptor
600 m CL to 5th Receptor
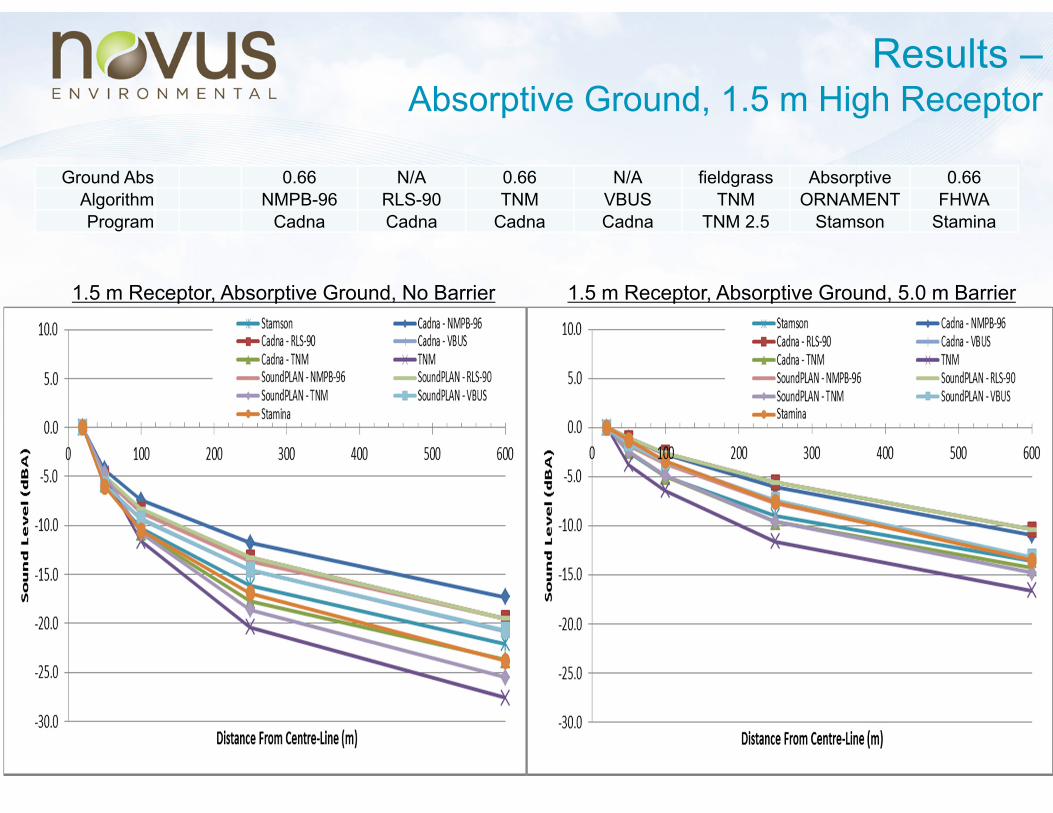
Results –Absorptive Ground, 1.5 m High Receptor
Ground Abs 0.66 N/A 0.66 N/A fieldgrass Absorptive 0.66Algorithm NMPB-96 RLS-90 TNM VBUS TNM ORNAMENT FHWAProgram Cadna Cadna Cadna Cadna TNM 2.5 Stamson Stamina
1.5 m Receptor, Absorptive Ground, No Barrier 1.5 m Receptor, Absorptive Ground, 5.0 m Barrier

Results –Reflective Ground, 1.5 m High Receptor
Ground Abs 0.33 N/A 0.33 N/A pavement Reflective 0.33Algorithm NMPB-96 RLS-90 TNM VBUS TNM ORNAMENT FHWAProgram Cadna Cadna Cadna Cadna TNM Stamson Stamina
1.5 m Receptor, Reflective Ground, No Barrier 1.5 m Receptor, Reflective Ground, 5.0 m Barrier
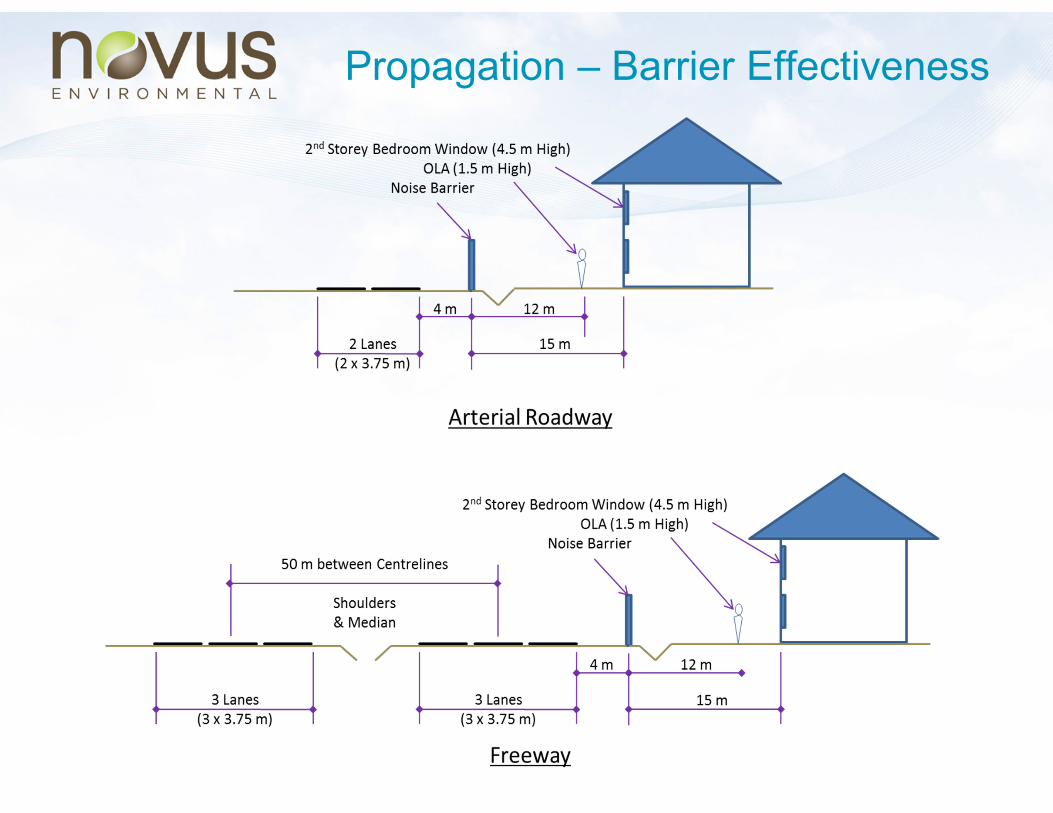
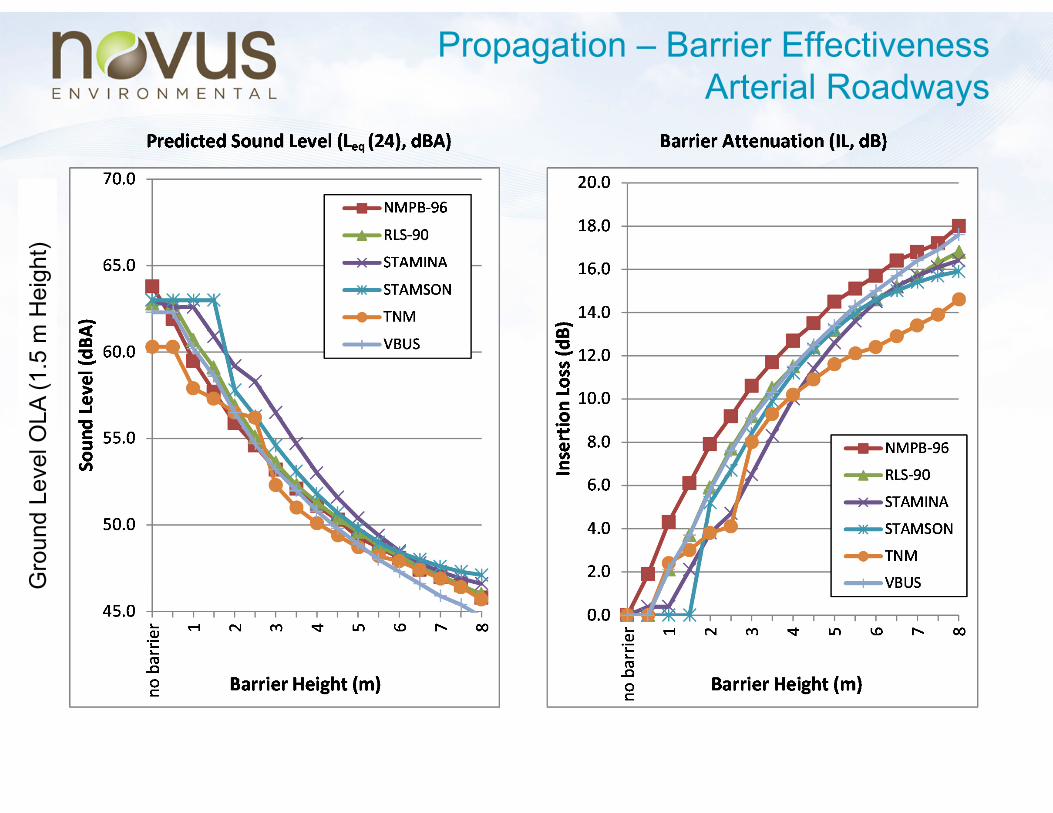
Propagation – Barrier Effectiveness
Gro
und
Leve
l OLA
(1.5
m H
eigh
t)Propagation – Barrier Effectiveness
Arterial Roadways
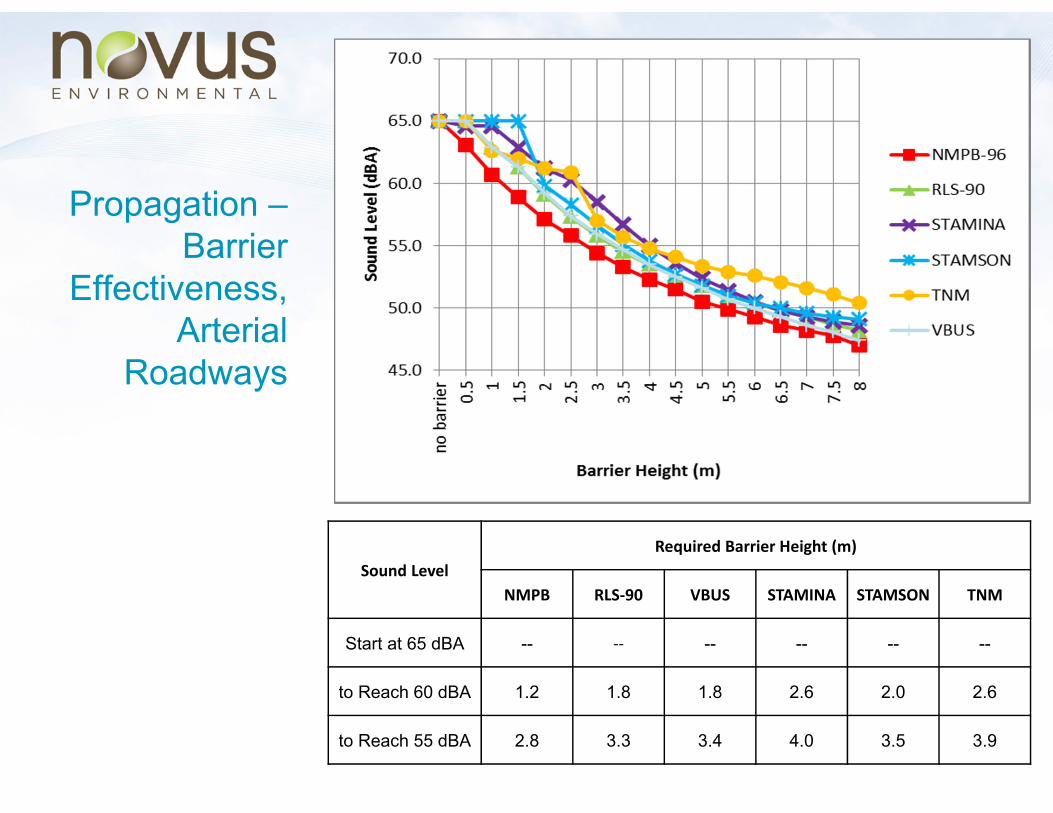
Sound LevelRequired Barrier Height (m)
NMPB RLS‐90 VBUS STAMINA STAMSON TNM
Start at 65 dBA -- ‐‐ -- -- -- --
to Reach 60 dBA 1.2 1.8 1.8 2.6 2.0 2.6
to Reach 55 dBA 2.8 3.3 3.4 4.0 3.5 3.9
Propagation –Barrier
Effectiveness, Arterial
Roadways
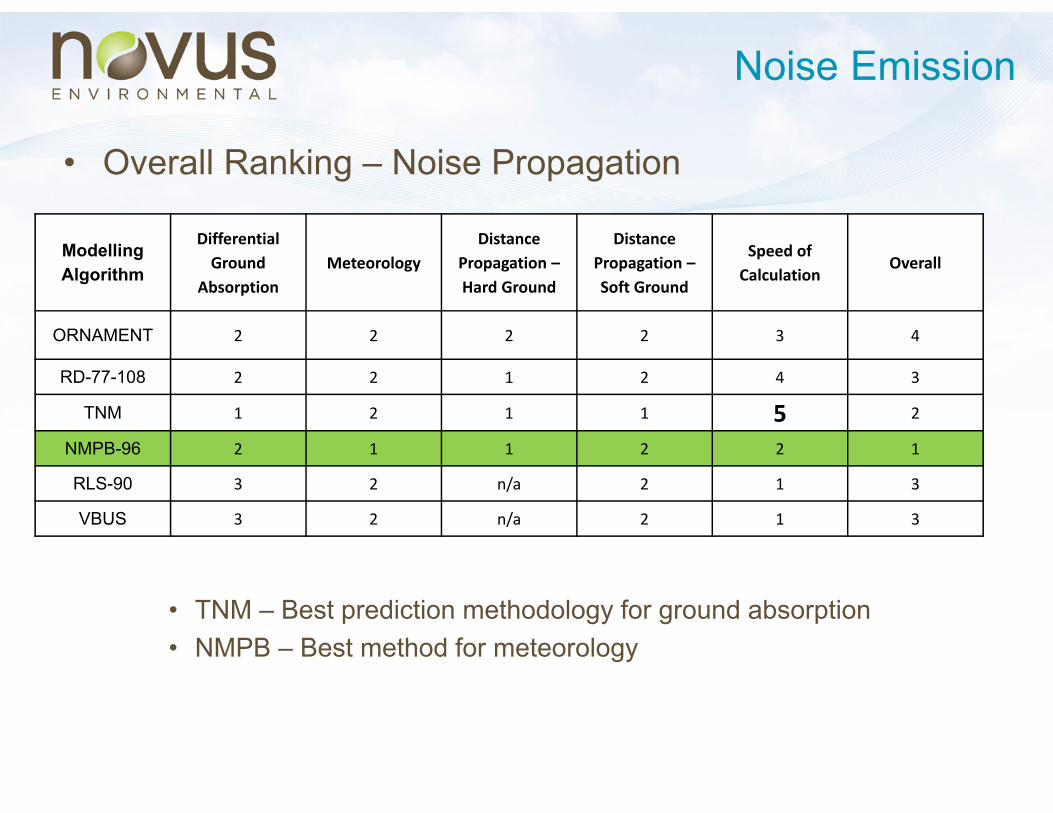
Noise Emission
• Overall Ranking – Noise Propagation
• TNM – Best prediction methodology for ground absorption• NMPB – Best method for meteorology
Modelling Algorithm
DifferentialGround
AbsorptionMeteorology
DistancePropagation –Hard Ground
DistancePropagation –Soft Ground
Speed of Calculation
Overall
ORNAMENT 2 2 2 2 3 4
RD-77-108 2 2 1 2 4 3
TNM 1 2 1 1 5 2
NMPB-96 2 1 1 2 2 1
RLS-90 3 2 n/a 2 1 3
VBUS 3 2 n/a 2 1 3
Algorithms - Ranking
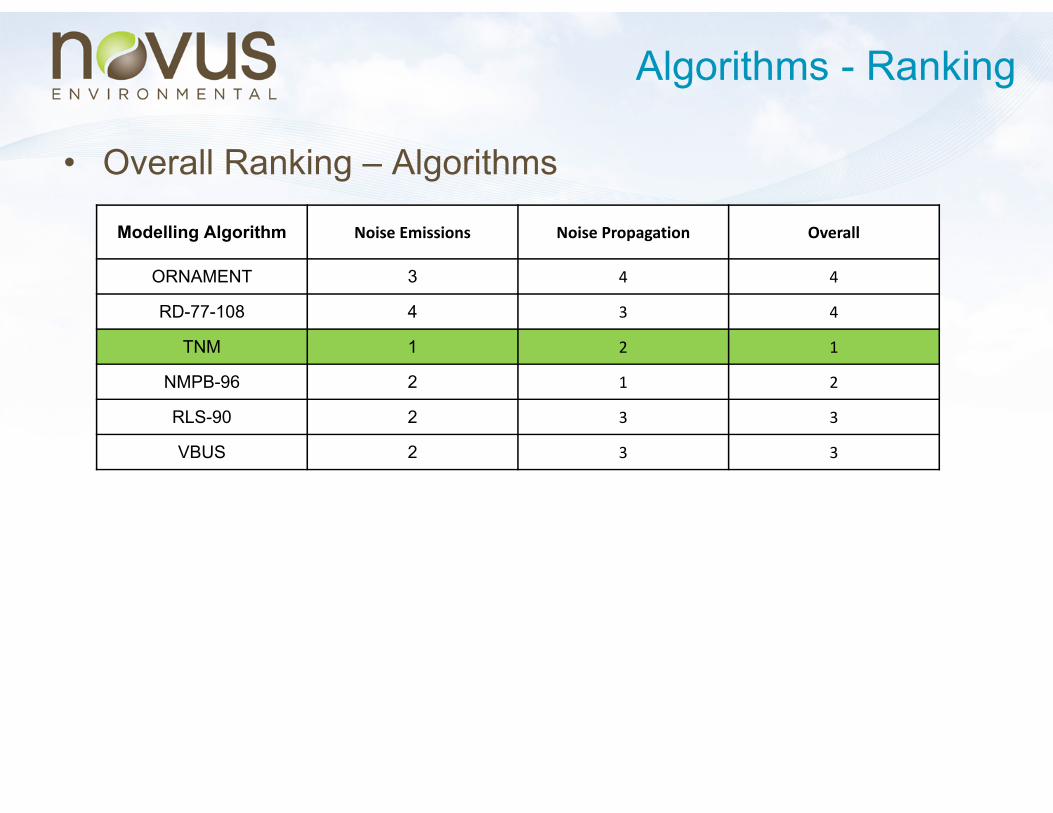
• Overall Ranking – Algorithms
Modelling Algorithm Noise Emissions Noise Propagation Overall
ORNAMENT 3 4 4
RD-77-108 4 3 4
TNM 1 2 1
NMPB-96 2 1 2
RLS-90 2 3 3
VBUS 2 3 3
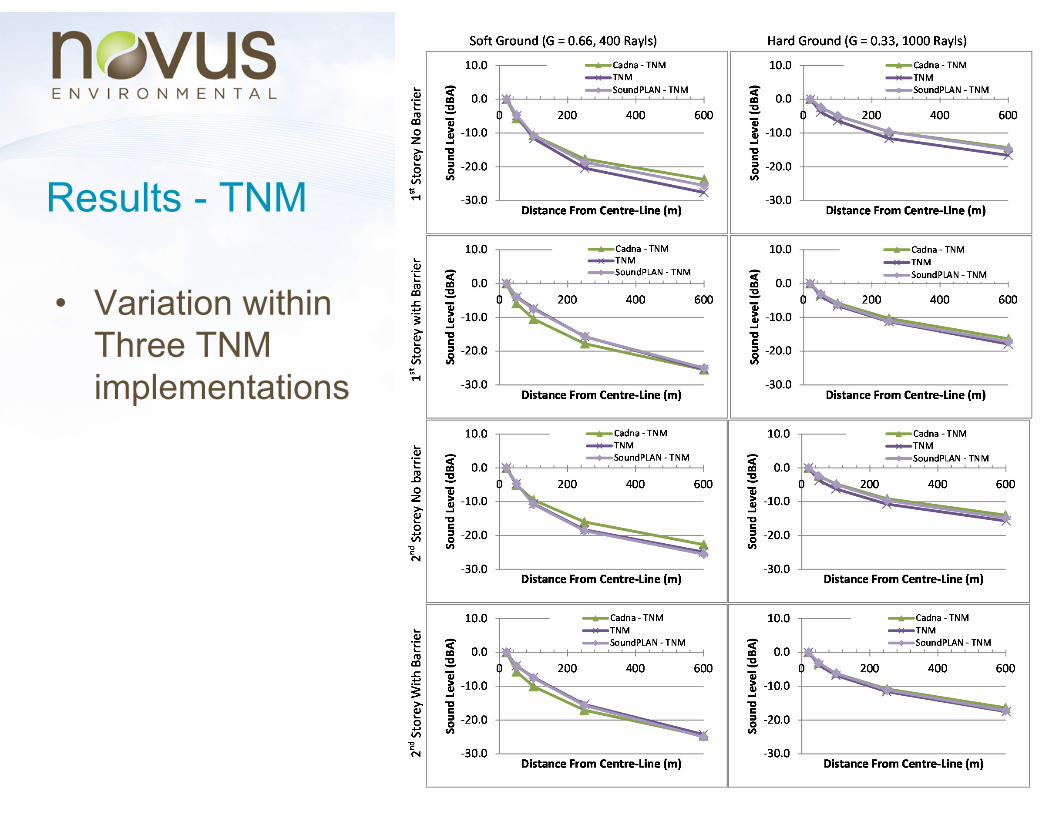
Results - TNM
• Variation within Three TNM implementations
TNM Results
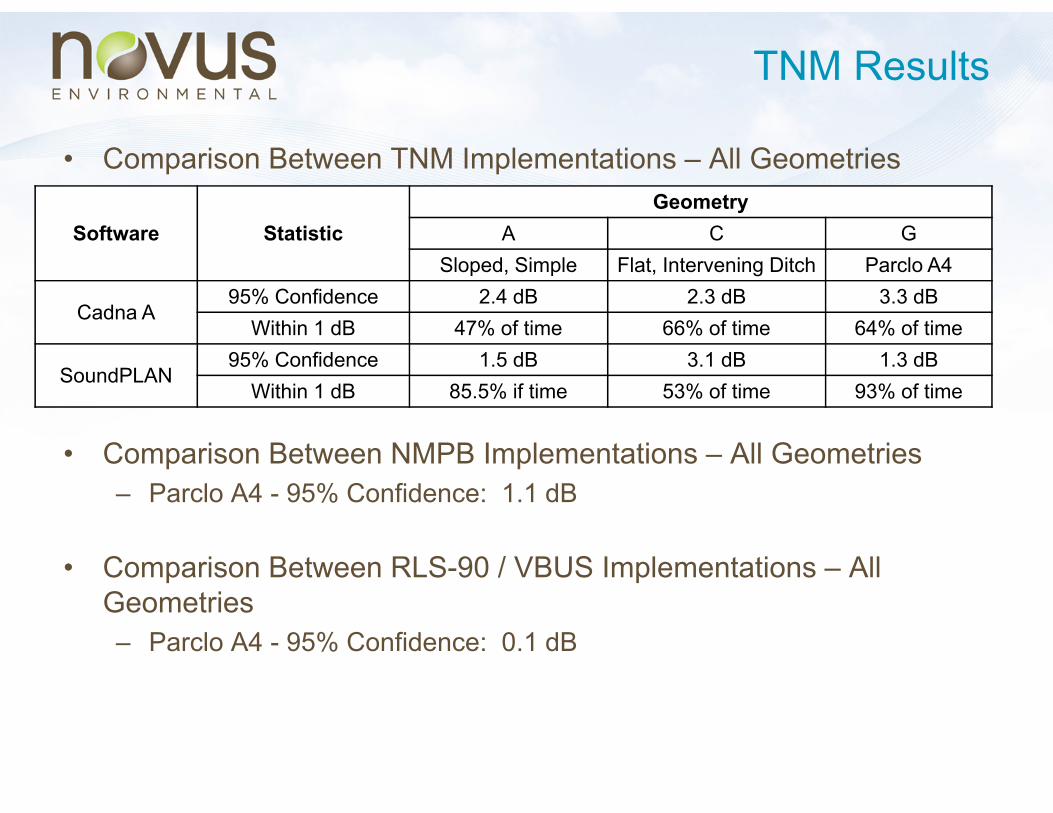
• Comparison Between TNM Implementations – All Geometries
• Comparison Between NMPB Implementations – All Geometries– Parclo A4 - 95% Confidence: 1.1 dB
• Comparison Between RLS-90 / VBUS Implementations – All Geometries– Parclo A4 - 95% Confidence: 0.1 dB
Software StatisticGeometry
A C GSloped, Simple Flat, Intervening Ditch Parclo A4
Cadna A95% Confidence 2.4 dB 2.3 dB 3.3 dB
Within 1 dB 47% of time 66% of time 64% of time
SoundPLAN95% Confidence 1.5 dB 3.1 dB 1.3 dB
Within 1 dB 85.5% if time 53% of time 93% of time

Interim Technical Findings
Overall• Existing methods are conservative (~ 2 dB over-prediction)• TNM as the algorithm• TNM v2.5 as the software package (v3.0 when it is released)• Until results have a demonstrable greater degree of consistency, Cadna/A
and SoundPLAN are not be desirable for calculation of the FHWA TNM algorithms
• SoundPLAN in limited cases, export to for “official” run

TNM SummaryPros Cons
Includes up-to-date NA-based noise emission data
Includes typical splits used in Ontario noise modelling- cars, medium trucks, heavy trucks
Includes buses as separate vehicle category- Transit noise impact assessments
Includes state-of-the art treatments for ground absorption and barrier effects- 1/3-octave, impedance based
“Fresnel” bug is known error in calculations
Graphical user interface- Input and QA checks
Current interface is “clunky”
Reasonable cost- $ 700
Outputs are sortable by vehicle type Outputs are NOT sortable by roadway link- Need to do multiple runs to pull out this data
Runs on modern computers and operating systems Run times are excessively long
Algorithm is published (and in English)- “Simple” spreadsheet version could be developed
Most complex of all road noise algorithms
Examines “worst-case” met conditions Met conditions are not state-of-the-art and are not fully user specifiable
Can import STAMINA files
Can import DXF files Imported as polylines, conversion is difficult, essentially need to redraw, cannot import aerial photography
Theoretically, can calculate contours TNM V2.5 software warns you that this is too slow to do.- Need to do cluster computing?
Future versions to be released should address all or the majority of the “Cons”

Thank you!