roadmap for biomethane market development in … · “roadmap for biomethane market development in...
TRANSCRIPT
ROADMAP FOR BIOMETHANE MARKET DEVELOPMENT
IN POLAND
November 2013
2
TABLE OF CONTENTS
1 Introduction ..................................................................................................................................... 4
2 Biogas Policy in Poland .................................................................................................................. 5
2.1 Poland’s energy policy, including biogas plants ..................................................................... 5
2.2 Development of renewable energy sources use, including biogas, in Poland ......................... 6
2.3 Green Certificates in Poland .................................................................................................... 7
2.4 Energy law amendment – “Small three-pack” (2013) ............................................................. 8
2.5 Main assupmtion of the renewable energy sources law being prepared (2013/2014) ............. 9
2.5.1 Scope of the law .............................................................................................................. 9
2.5.2 Aims of the law ............................................................................................................. 10
2.5.3 Auctioning system ......................................................................................................... 10
3 Possibilities for financing biogas installations .............................................................................. 11
3.1.1 Biogas plant support in the “Bocian” programme of the National fund for
environmental protection and water management .................................................................... 11
3.1.2 Biogas plant support in the green investment scheme (GIS) ......................................... 12
3.1.3 Biogas plant support by the Environmental Protection Bank (BOŚ) ............................ 13
3.1.4 Biogas plant support in the Infrastructure and Envirionment Operational Programme
2014 – 2020 .............................................................................................................................. 14
4 Agricutural biogas production ....................................................................................................... 15
4.1 Biogas production process ..................................................................................................... 15
4.2 Producing biogas from plant and animal waste ..................................................................... 16
4.3 Technologies of upgrading biogas to natural gas parameters ................................................ 20
4.3.1 Methods of biogas upgrading ........................................................................................ 21
4.3.2 Water scrubber method .................................................................................................. 22
4.3.3 Costs of biogas upgrading ............................................................................................. 22
4.3.4 Quality of the biomethane injected into the grid ........................................................... 23
5 Biogas plants in Poland ................................................................................................................. 25
3
5.1.1 Availibility of substrate and biogas potential ................................................................ 25
5.1.2 Current state of biogas plants in Poland ........................................................................ 25
5.1.3 Construction of new agricultural biogas plants in Poland ............................................. 28
5.1.4 Production of agricultural biogas .................................................................................. 28
5.1.5 List of resources used in biogas production .................................................................. 29
6 Barriers for biomethane use and mechanisms of goal achievement .............................................. 32
7 Projections of biomethane production in Poland according to GreenGasGrids project estimates 34
8 Conclusion ..................................................................................................................................... 36
4
1 INTRODUCTION
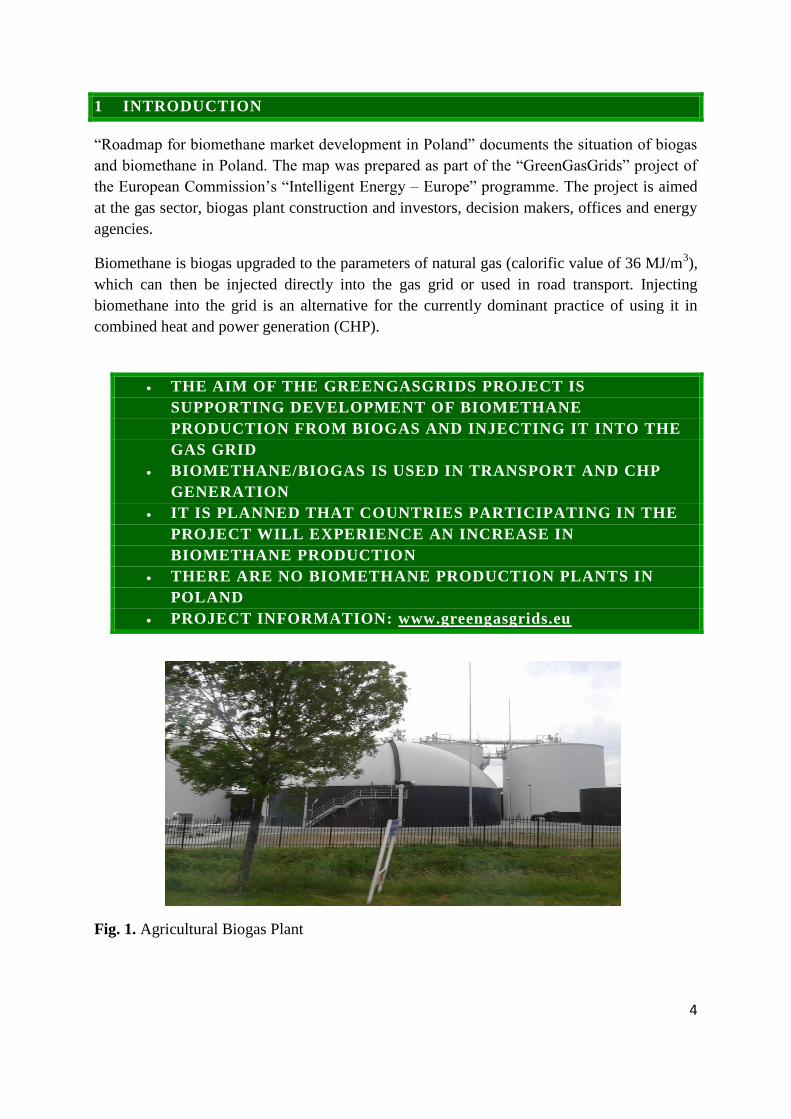
“Roadmap for biomethane market development in Poland” documents the situation of biogas
and biomethane in Poland. The map was prepared as part of the “GreenGasGrids” project of
the European Commission’s “Intelligent Energy – Europe” programme. The project is aimed
at the gas sector, biogas plant construction and investors, decision makers, offices and energy
agencies.
Biomethane is biogas upgraded to the parameters of natural gas (calorific value of 36 MJ/m3),
which can then be injected directly into the gas grid or used in road transport. Injecting
biomethane into the grid is an alternative for the currently dominant practice of using it in
combined heat and power generation (CHP).
THE AIM OF THE GREENGASGRIDS PROJECT IS
SUPPORTING DEVELOPMENT OF BIOMETHANE
PRODUCTION FROM BIOGAS AND INJECTING IT INTO THE
GAS GRID
BIOMETHANE/BIOGAS IS USED IN TRANSPORT AND CHP
GENERATION
IT IS PLANNED THAT COUNTRIES PARTICIPATING IN THE
PROJECT WILL EXPERIENCE AN INCREASE IN
BIOMETHANE PRODUCTION
THERE ARE NO BIOMETHANE PRODUCTION PLANTS IN
POLAND
PROJECT INFORMATION: www.greengasgrids.eu
Fig. 1. Agricultural Biogas Plant
5
2 BIOGAS POLICY IN POLAND
2.1 POLAND’S ENERGY POLICY, INCLUDING BIOGAS PLANTS
Poland, as a member state of the European Union, actively participates in the creation of a
common energy policy, as well as implements the main resolutions and aims, in its specific
national circumstances, taking into account the protection of the interest of recipients, the
possessed energy resources, and the technological conditions of energy production and
transmission.
The basic directions of “Poland’s energy policy up to 2030” are:
improving energy efficiency,
increasing the security of the fuel and energy supply,
diversification of the power generation structure by introducing nuclear power, ,
development of renewable energy sources use, including biofuels, ,
development of competitive fuel and energy markets,
limiting the effects of the energy sector on the environment.
The goals of Poland’s energy policy are:
increasing the share of renewable energy sources (RES) in final energy use to at least
15% in 2020 and further increasing this share in subsequent years,
achieving a 10% share of biofuels in the transport fuel market by 2020 and increasing
the use of 2nd
generation biofuels,
protecting forests from excessive exploitation for biomass acquisition and sustainable
used of agricultural areas for RES, including biofuels, to prevent competition between
renewable energy and agriculture industries, and maintaining biological diversity,
using existing water impounding measures belonging to the State to generate power,
increasing the diversification of energy supplies and creating optimal conditions for the
development of distributed energy generation based on locally available resources.
With respect to the development of the biogas market, the document “Directions for the
development of agricultural biogas plant in Poland for 2010 – 2020” defines the goals and
effects of such development, namely:
creating optimal conditions for the construction of 2000 installations producing
agricultural biogas;
developing preliminary changes in the law to facilitate the construction of biogas
installations;
indicating appropriate financing programmes as well as educational and promotional
actions;
improving the energy security of the State by increasing the supply of renewable energy
carriers produced from national resources;
6
basing a significant part of the gas, power and heat energy supply, and agricultural
biogas as transport fuel on numerous local biogas production plants, which will create
possibilities of supplying biomethane to people living in villages and towns as well as
economic entities;
creating local value added chains, by, among others, economically activating villages
and increasing employment in the local communities and economic entities of the
agriculture and RES energy industries;
stimulating the development of local enterprises connected to the use of locally
generated heat;
improving the energy infrastructure and increasing the competitiveness of the polish
agriculture industry (dispersed energy infrastructure);
generating significant heat and power energy from resources, which do not compete
with the food industry, defined as agricultural by-products and waste from the
agriculture and food industry;
increasing the income of municipal local governments;
acquiring significant quantities of environmentally friendly, high quality, organic
fertilizers as post-fermentation substrate waste of agricultural origin and granulate;
using organic waste, which release greenhouse gases, for energy purposes.
2.2 DEVELOPMENT OF RENEWABLE ENERGY SOURCES USE,
INCLUDING BIOGAS, IN POLAND
According to the National Action Plant on energy from renewable sources (2010), biogas is a
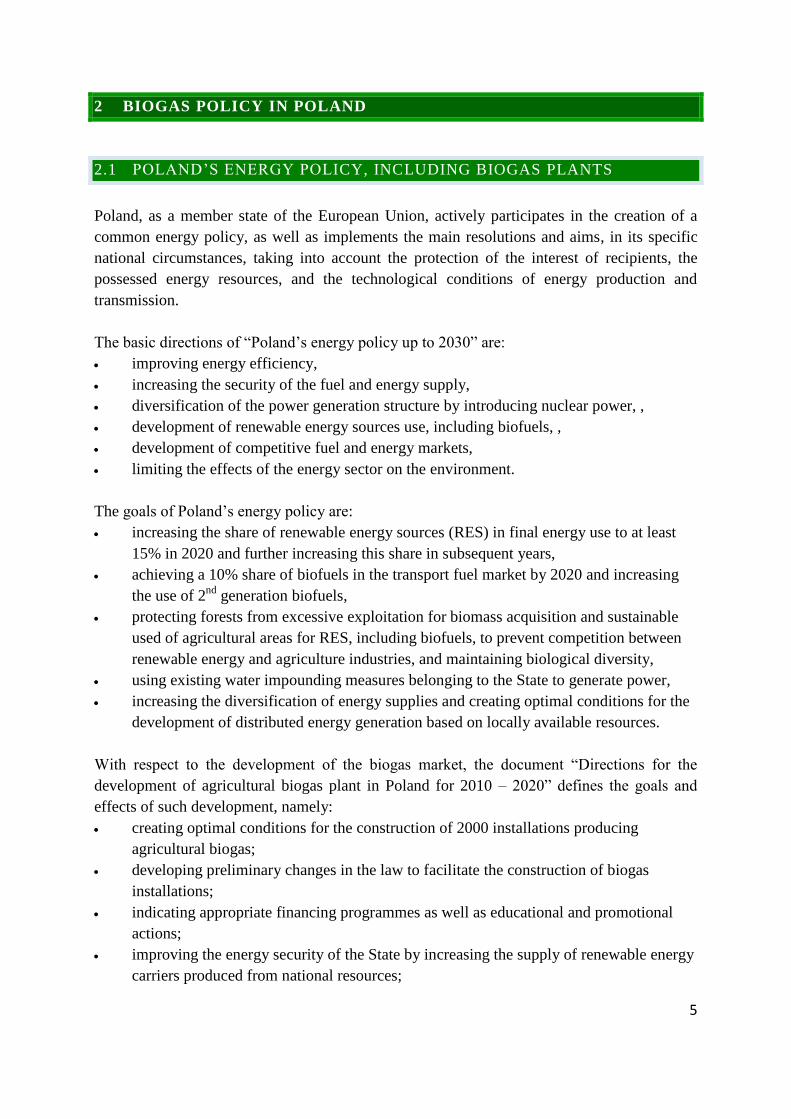
fuel of significant importance for achieving the goals of developing the use of energy sources,
which include both power and heat production. The increase in energy production up to 2020,
including biogas is presented in Fig. 2 and 3.
Fig. 2. presents the predicted gross electricity production for various RES technologies in
Poland up to 2020.
2279 2311 2343 2375 2407 2439 2471 2503 2535 2567 2969 2310 3255 4308 5327 6491 7541
8784 9860 11210 12315
15210
6028 7110
8192 8774
9438 9893
10348 11008
11668 12943
14218
0
5000
10000
15000
20000
25000
30000
35000
2010 2011 2012 2013 2014 2015 2016 2017 2018 2019 2020
GW
h
Biomass
Wind Energy
Solar Energy
Water Energy
7
It is predicted that in 2020 the increase in energy generation from biogas, with respect to
2010, will be 1125%, with an average annual growth rate of 28,5%.
It is predicted that in 2020 the increase in heat generation from biogas, with respect to 2010,
will be 597%, with an average annual growth rate of 21,4%.
2.3 GREEN CERTIFICATES IN POLAND
The key issue with regard to the economy of RES systems is their support mechanism, which
is based on Green Certificates, a quantitative mechanism introduced in 2005, on the basis of
the amended Energy Law (EL) from 10th
April 1997. Green certificates are property rights
created from certificates of energy generated from RES which are issued by the Head of the
Energy Regulatory Office. They are currently indefinite instruments subject to revocation by
the Head of the Energy Regulatory Office. Energy generated from RES is exempt from excise
tax.
Issuing certificates of biogas origin was regulated separately in art. 90 of the EL, and is a
confirmation of producing agricultural biogas and introducing it into the gas distribution
network. For a biogas producer to receive a certificate he must fulfil both conditions, that is
produce biogas and inject it into the grid. Then the proper gas distribution network operator
can confirm the quantity of gas injected into his grid. Detailed information including the
quality of the agricultural biogas injected, requirements of measurement, registration and the
means of calculating the quantity of biogas produced, or converting the quantity of biogas
produced to the equivalent amount of energy produced from RES is defined by the Ordinance
of the Ministry of Economy from 24th
August 2011 on the detailed scope of obligation to
1 1 toe=41,868 GJ
Fig. 3. Predicted final energy use from RES in Poland up to 2020 in ktoe.
1
0
1000
2000
3000
4000
5000
6000
7000
2010 2011 2012 2013 2014 2015 2016 2017 2018 2019 2020
kto
e
Heat pumps
Biogas
Solid biomass
Solar
Geothermal
8
confirm data concerning biogas produced and injected into the gas distribution network (Dz.
U. Nr 187, poz. 1117).
The amount of produced agricultural biogas is converted into the equivalent amount of energy
possibly produced from RES according to the equation:
∑( )
where the symbols represent:
- the amount of electrical power possibly produced from RES as equivalent to the
biogas produced and injected into the gas distribution network [MJ],
n - the number of batches of agricultural biogas injected into the gas distribution
network,
m - designation of the next batch of agricultural biogas injected into the gas
distribution network,
Mbri - amount of biogas injected into the gas distribution network in each batch [m3],
with a defined calorific value measured with the measuring equipment,
ri - real calorific value of each batch of agricultural biogas injected into the gas
distribution network [MJ/m3],
- reference efficiency value of generating electricity in units using agricultural
biogas ( )
In accordance with the regulation in art. 9 act 1 of the EL the scope of the entities obligated to
submit and revoke certificates of origin is defined in art. 9 act 1a of the EL. Fulfilment of this
obligation can also be done by settlement of the substitute fee. (art 9a act 1 section 2 of EL) or
fulfilment of the obligation part in certificates of origin and part in settlement of the substitute
fee. Failure to fulfil these obligations in either of the above mentioned methods causes
monetary fines being levied by the Head of Energy Regulatory Office.
In January 2014 an amendment of the EL brought back support mechanism for high
efficiency combined heat and power (CHP) generation, called yellow certificates, which will
be available and used by biogas plants. The support mechanism concerns units with a total
installed power of 1 MW or fuelled by gas fuels. The amendment extended the duration of the
mechanism until 2018.
2.4 ENERGY LAW AMENDMENT – “SMALL THREE-PACK” (2013)
In July 2013 the Parliament accepted the Energy Law (EL) amendment, the so called “Small
Three-pack”. The new law promotes the producer and consumer energy markets. The
document introduces a number of new notions and solutions as follows:
• In art. 3 section 20f of the EL “Renewable Energy Sources” were defined as sources
using wind, solar, aero-thermal, geothermal, hydrothermal, wave, sea currents, river
9
drop energy and energy from biomass, biogas from landfill sites and biogas from
sewage removal and treatment, or decomposition of plant or animal refuse.
• The “Small Three-pack” also introduces a definition of micro-installations, as RES
installations below 40 kW, the owners of which, will be exempt from the costs of
connection and registering their economic activity.
• The new EL defines the notion of a “Prosumer”, as a producer and consumer of energy,
who can sell energy. The prosumer is not obligated to deduct health care premiums.
• The EL promotes using energy generated from RES for personal use and selling its
surplus to the power grid. In accordance with art. 9u of the EL, generating electricity in
a micro-installation by a private entity, who is not an entrepreneur, in the sense of the
freedom of economic activity law, and further, the sale of this energy is not considered
economic activity. What is more art. 9v of the EL emphasises that the energy generated
in the micro-installation connected to the distribution network in the area of operation of
an official energy seller and offered for sale by the seller mentioned in art. 9u, the
official seller is obliged to buy it. The price of energy sold in this way is equal to 80%
of the average price of energy in the previous calendar year, which is established by the
Head of the Energy Regulatory Office in accordance with art. 23 act 2 section 18 of the
EL.
The regulation of the “Small Three-pack”, due to the size of currently realized single biogas
plants, will not directly affect their development, just like the law on RES under development.
2.5 MAIN ASSUPMTION OF THE RENEWABLE ENERGY SOURCES LAW
BEING PREPARED (2013/2014)
2.5.1 SCOPE OF THE LAW
The new law is aimed at adapting current solutions to the market conditions, which chiefly
include maintaining the current support mechanism for existing RES installations. The new
law is supposed to guarantee respecting the established rights of everyone who produced
energy from RES before the law came into power.
The regulation on the production of energy from renewable resources concerns defining the
rules and conditions of operation in generating electricity, heat or cold and energy from
agricultural biogas. The document also describes the support mechanisms and instruments for
generating power as well as heat and the rules of issuing certificates of renewable resources
origin in RES and agricultural biogas installations.
10
2.5.2 AIMS OF THE LAW
The law on renewable energy sources is to ensure the achievement of the goals set in the
“National Action Plan” and “Poland’s energy policy up to 2030”.
Poland is to achieve intermediate goals for increasing energy production from RES, 9,54% up
to 2014, 10,71% up to 2016 and 12,27% up to 2018. The achievement of these goals will be
based on two resource pillars available in Poland that is an increase in generating electricity
from wind generation and increasing biomass energy use. The goals can only be achieved if
RES development is sustainable. This growth should commence not only with regard to
Poland’s obligations to the EU, but also in respect of environmental protection. Increasing
energy generation from RES cannot compete with food production. Due to this RES
development should follow in harmony with the interests of the investors and entities
concerned with agricultural activity.
The RES law assumes the achievement of a number of goals, among others:
• increasing energy security and environmental protection by, inter alia, effectively using
renewable energy sources;
• rational RES use, taking into account the long term economic development policy of
Poland, the fulfilment of international agreements and increasing the innovativeness and
competitiveness of the Polish economy;
• shaping support mechanisms and instruments for generating electricity, hear or cold, or
agricultural biogas in installations using renewable energy sources;
• creating and optimal and sustainable supply for end consumers in electricity, heat or
cold, or agricultural biogas from installations using renewable energy sources;
• creating new employment opportunities as a result of an increase in new operational
installations using renewable energy sources;
• ensuring by-products and refuse from the agricultural industry and industries using
agricultural resources is used for energy purposes.
2.5.3 AUCTIONING SYSTEM
The new law also proposes solutions based on optimizing the economic account for existing
RES installations and introducing a modern auctioning system for new and modernized RES
installation, which guarantees the maximization of benefits connected to the need to achieve
the set share of RES in 2020, and allows the development of the small scale prosumer energy
sector aimed at the users satisfying their own energy needs.
11
3 POSSIBILITIES FOR FINANCING BIOGAS INSTALLATIONS
3.1.1 BIOGAS PLANT SUPPORT IN THE “BOCIAN” PROGRAMME OF THE
NATIONAL FUND FOR ENVIRONMENTAL PROTECTION AND
WATER MANAGEMENT
Preparing RES investments such as agricultural biogas plants involves high preliminary
investment costs, which significantly slow down their development.
Since January 2014 the National Fund for Environmental Protection and Water Management
offers funds for financing dispersed renewable resources. An element of the “Bocian”
programme, with a budget of about 420 mln zł, will be propagating the limiting and
elimination of CO2 emissions and increasing the production of green energy by constructing
and redeveloping renewable energy sources installations. Qualified systems are photovoltaic
installations between 200 kw and 1 MW, wind farms up to 3 MW, small water power plants
up to 5 MW, biomass heating plants up 20 MW, biogas plants, as installations producing
electricity and heat using agricultural biogas between 300 kW and 2 MW, installations
producing biogas for injections into direct and distribution networks, and producing electricity
in high efficiency CHP up to 5 MW. The produced energy can be used for the personal use of
the investor or commercial purposes. Per unit costs of the investments should not exceed
specified limits – financing rates are determined by the propagation of innovative
technologies by the projects.
The predicted financing mechanism for the “Bocian” programme is a preferential loan, not
subject to redemption, with a minimal value of 2 mln zł and a maximum value of 40 mln zł.
Due to the EU set target of achieving 15% shares of RES in final energy use in 2020, green
energy investments are unavoidable. At the same time funding them is necessary. Potential
sources of financing in the new 2014 – 2020 perspective will be available at the end of 214.
The main criterion for grant will be the investors readiness to realize the project
(environmental decisions, building permit, financial planning). Matters concerning the form
of financing are still being discussed. Appealing loans – up to 70% of qualified costs will be
tough to realize. A business plan for a new energy installation, construction of which will
begin after 2014 using financing funds, should include a grant in the form of a refundable
loan. In the new programme period, the loan will be a preferred form of grant for investments
with low risk indicators, among others, for RES installations. Grants will be awarded for
actions in disciplines requiring the development of new innovative solutions, in accord with
the science and industry sector as well as their commercialization. In the case of research and
development projects where the investor takes greater risk, it will be minimized with a non-
refundable grant.
The above mentioned instruments are meant to support construction of biogas producing and
generating power and heat from biogas investments.
12
3.1.2 BIOGAS PLANT SUPPORT IN THE GREEN INVESTMENT SCHEME
(GIS)
As part of the Green Investment Scheme, the National Fund for Environmental Protection and
Water Management acting as the National Operator of the Green Investment Scheme,
implements a new priority programme – agricultural biogas plants.
Among the financing options available to the beneficiaries the ones worth noting are:
interest loans,
providing co-financing.
As part of the programme the National Fund for Environmental Protection and Water
Management foresees financing for the following actions connected to the production of
biogas and biomethane:
costs of acquisition or construction of new fixed assets, including:
structures and buildings (there should be a direct link between the bought
structure and buildings and the projects purpose),
machines and equipment,
tools, instruments and apparatus
technical infrastructure connected to the new investment, while the construction of
the technical infrastructure equipment is understood as indoor installations in
technological buildings, connections providing utilities to the technological
buildings,
roads and technological squares etc.;
cost of the assembly and starting-up the fixed assets;
cost of building materials or construction work given they remain directly connected to
the project financed;
cost of acquiring non-material assets and intellectual properties such as patents,
licenses, unpatented know-how, technical, technological or concerning organization and
management;
cost of oversight required by law.
Budget
1. The budget is set for:
planned commitments for non-refundable forms of financing are
100 729,2 thousand zł – funds from transactions of granted emission units or other
Nation Fund for Environmental Protection and Water Management assets,
pay-outs of funds from realized or planned commitments for non-refundable forms of
financing of the programme are 140 576,5 thousand zł,
planned commitments for refundable forms of financing are 160 789,1 thousand zł –
from National Fund for Environmental Protection and Water Management funds,
payouts of funds from realized and planned commitments for refundable forms of
financing in the programme are 209 001,3 thousand zł.
13
More information available at: http://www.nfosigw.gov.pl/system-zielonych-inwestycji---
gis/programy-priorytetowe/
3.1.3 BIOGAS PLANT SUPPORT BY THE ENVIRONMENTAL PROTECTION
BANK (BOŚ)
Since July 2014 the Environmental Protection Bank (BOŚ) will give out “Loans with Good
Energy” – intended for financing of projects concerning RES. The programme is designed
for:
territorial government entities;
municipal utility companies;
large, small and medium enterprises.
“Loans with Good Energy” will implement projects concerning the use of renewable
energy sources, with financing for the construction of:
biogas plants;
wind farm power plants;
photovoltaic power plants;
installations producing energy from biomass;
other projects concerning renewable energy.
“Loan with Good Energy” offers:
financing up to 90% of the net investment cost, 100% of the cost for territorial
government entities;
long loan period, which allows the distribution of investment costs over 15 years;
deferral of paying the loan capital up to 18 months;
deferral of paying interest up to 18 months;
the loan is available in a number of currencies e.g. PLN, EUR, USD;
variable interest rates, based on the WIBOR 3M/6M rate and increased by the bank’s
margin.
More information available at: http://www.bosbank.pl/?page=3243
14
3.1.4 BIOGAS PLANT SUPPORT IN THE INFRASTRUCTURE AND
ENVIRIONMENT OPERATIONAL PROGRAMME 2014 – 2020
Funds from the programme are mainly intended for low carbon emission economy,
environmental protection, limiting and adapting to climate change, transport, energy security
as well as protection of health and cultural heritage.
The main beneficiaries of the new programme will be public entities, including territorial
government entities and enterprises, specifically large companies. The programme budget is
27 513,9 mld EUR from European Funds, or 114,94 mld zł.
The priorities of the Infrastructure and Environment Operation Programme 2014 – 2020
concerned decreasing the emission in the economy by increasing energy efficiency and using
renewable energy sources by companies, the public and housing sector, promoting low
emission strategies, and the development and implementation of intelligent distribution
systems.
15
4 AGRICUTURAL BIOGAS PRODUCTION
4.1 BIOGAS PRODUCTION PROCESS
Organic matter (matter originating from animals and plants) is subject to number processes by
bacteria in anaerobic conditions, as a result producing a gas rich in methane. The quantity and
quality of the gas produced in anaerobic fermentation is dependent on a variety of factors,
however most importantly::
type of primary resource (feedstock),
degree of resource fermentation,
temperature of the fermentation process,
mechanical treatment (mixing),
duration of process.
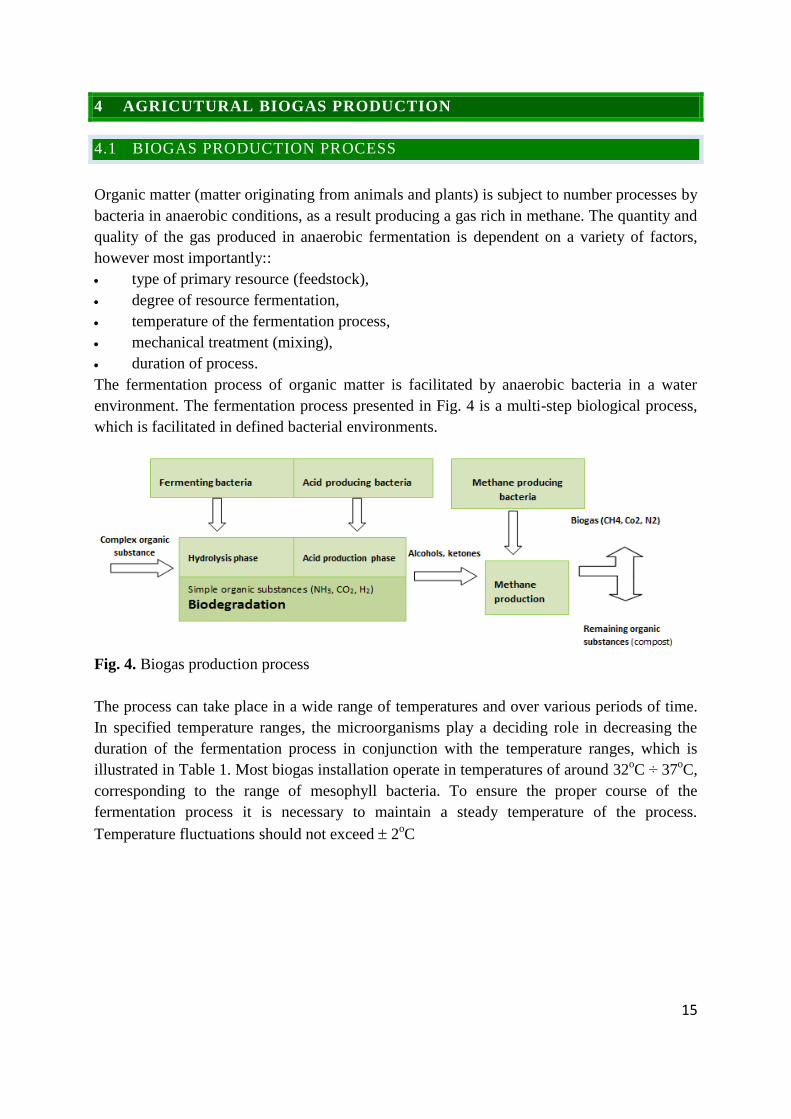
The fermentation process of organic matter is facilitated by anaerobic bacteria in a water
environment. The fermentation process presented in Fig. 4 is a multi-step biological process,
which is facilitated in defined bacterial environments.
Fig. 4. Biogas production process
The process can take place in a wide range of temperatures and over various periods of time.
In specified temperature ranges, the microorganisms play a deciding role in decreasing the
duration of the fermentation process in conjunction with the temperature ranges, which is
illustrated in Table 1. Most biogas installation operate in temperatures of around 32oC ÷ 37
oC,
corresponding to the range of mesophyll bacteria. To ensure the proper course of the
fermentation process it is necessary to maintain a steady temperature of the process.
Temperature fluctuations should not exceed 2oC
16
Table 1. Temperature and duration of fermentation for basic anaerobic microorganisms
No. Microorganism Temperature
[oC]
Fermentation time
[days]
1. Psychrophilic 12 ÷ 16 90 ÷ 120
2. Mesophyll 32 ÷ 37 25 ÷ 30
3. Thermophile 51 ÷ 60 10
Apart from the temperature another important factor is the ratio of carbon atoms to nitrogen
atoms (C:N) in the feedstock mass of the biogas plant, which should be 10÷25 : 1, and the
nitrogen, phosphorus, sulphur ratio (N:P:S) which should be 7:1:1. If C:N ratio is too low
nitrogen particles are released as ammonia. This increases the pH of the environment. If the
C:N ratio is too high biogas production decreases.
Table 2. presents the possible produced quantity of biogas, defined in litres per 1 kg of dry
feedstock mass, in a 26 day cycle, when using different sources of feedstock, with the time
required to produce biogas for each particular feedstock source.
Table 2. Producing biogas from different feedstock materials (Kotowski, Fechner)
No. Type of biogas plant feedstock Quantity of biogas after a
26 day cycle
[l/kg dry mass]
1. Rape straw 184
2. Potato leaves and stems 171
3. Beetroot leaves 418
4. Grass 427
5. Wheat straw 206
6. Rye straw 252
7. Pig livestock excrement 203
8. Cattle excrement 159
4.2 PRODUCING BIOGAS FROM PLANT AND ANIMAL WASTE
Biogas is a gas obtained from biomass, particularly in installations processing plant and
animal waste, water treatment plants and landfill sites. Biogas is composed of methane CH4,
carbon dioxide CO2, nitrogen N2, carbohydrates H2, sulphuric acids H2S, and oxygen O2. The
chemical composition of biogas is shown in Fig. 5.
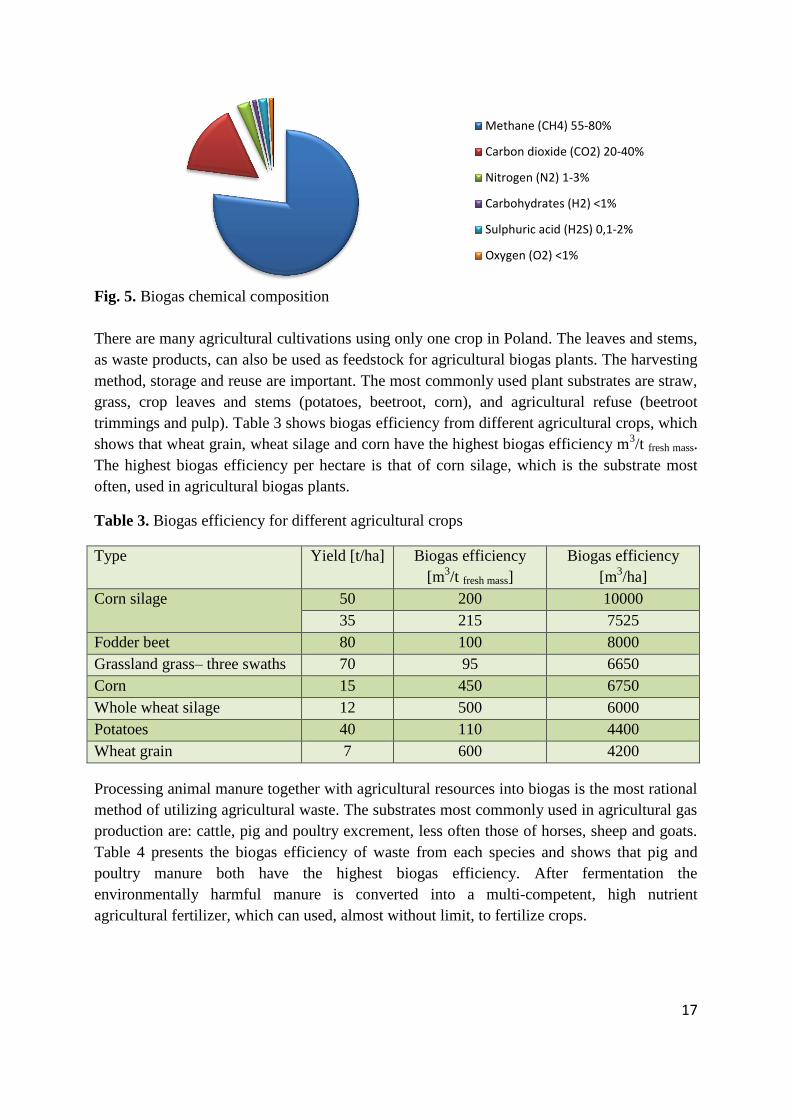
17
Fig. 5. Biogas chemical composition
There are many agricultural cultivations using only one crop in Poland. The leaves and stems,
as waste products, can also be used as feedstock for agricultural biogas plants. The harvesting
method, storage and reuse are important. The most commonly used plant substrates are straw,
grass, crop leaves and stems (potatoes, beetroot, corn), and agricultural refuse (beetroot
trimmings and pulp). Table 3 shows biogas efficiency from different agricultural crops, which
shows that wheat grain, wheat silage and corn have the highest biogas efficiency m3/t fresh mass.
The highest biogas efficiency per hectare is that of corn silage, which is the substrate most
often, used in agricultural biogas plants.
Table 3. Biogas efficiency for different agricultural crops
Type Yield [t/ha] Biogas efficiency
[m3/t fresh mass]
Biogas efficiency
[m3/ha]
Corn silage 50 200 10000
35 215 7525
Fodder beet 80 100 8000
Grassland grass– three swaths 70 95 6650
Corn 15 450 6750
Whole wheat silage 12 500 6000
Potatoes 40 110 4400
Wheat grain 7 600 4200
Processing animal manure together with agricultural resources into biogas is the most rational
method of utilizing agricultural waste. The substrates most commonly used in agricultural gas
production are: cattle, pig and poultry excrement, less often those of horses, sheep and goats.
Table 4 presents the biogas efficiency of waste from each species and shows that pig and
poultry manure both have the highest biogas efficiency. After fermentation the
environmentally harmful manure is converted into a multi-competent, high nutrient
agricultural fertilizer, which can used, almost without limit, to fertilize crops.
Methane (CH4) 55-80%
Carbon dioxide (CO2) 20-40%
Nitrogen (N2) 1-3%
Carbohydrates (H2) <1%
Sulphuric acid (H2S) 0,1-2%
Oxygen (O2) <1%
18
Table 4. Biogas efficiency of different animal manure
Substrate Content of
dry mass
(dry mass)
[%]
Content of dry
organic mas
(dry organic
mass) [% dry
mass]
Theoretical biogas efficiency
from 1 kg dry
organic mass
[dm3]
from 1 kg
fresh mass
[dm3]
Cattle excrement 8-11 75-82 200-500 20-30
Calf excrement 10-13 80-84 220-560 20-25
Pig excrement 4-7 75-87 300-700 20-35
Sheep excrement 12-16 80-85 180-320 18-30
Cattle manure 20-26 68-78 210-300 40-55
Pig manure 20-25 75-80 270-450 55-65
Horse manure 20-40 65-80 280-350 50-60
Fresh poultry manure 30-32 63-80 250-450 70-90
In some biogas plants additions like animal fat from meat processing plants is also added to
the feedstock substrates.
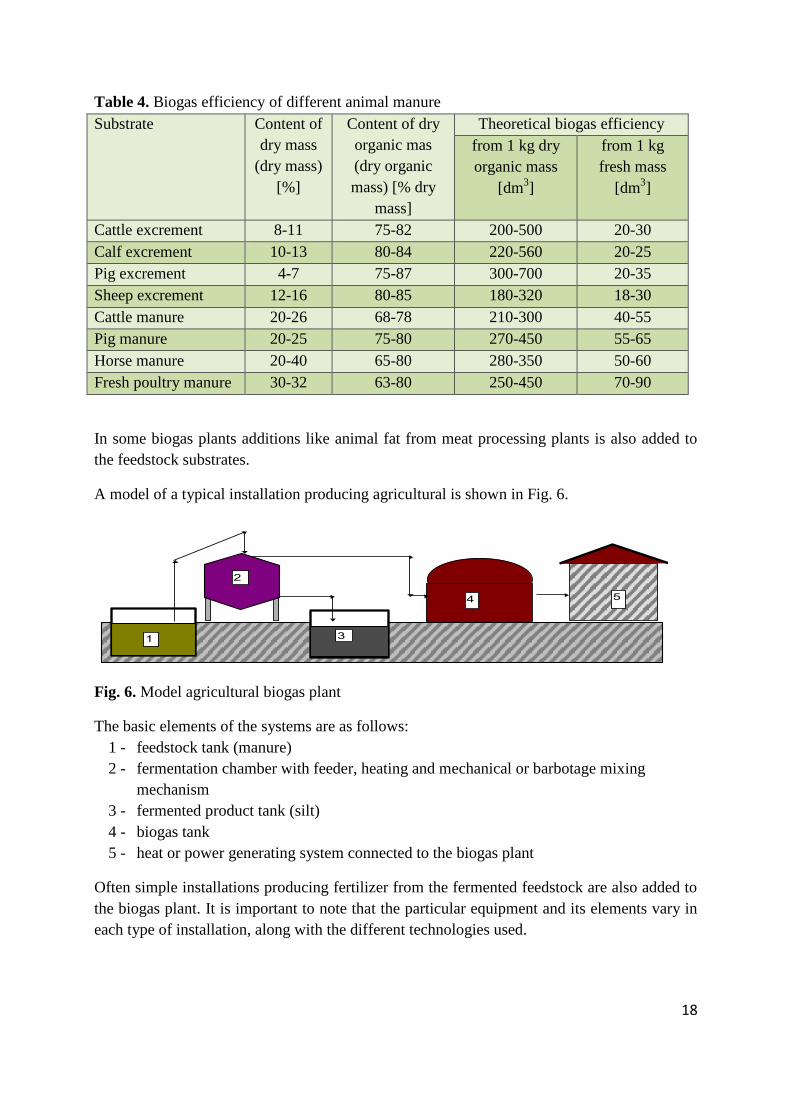
A model of a typical installation producing agricultural is shown in Fig. 6.
1 3
4 5
2
Fig. 6. Model agricultural biogas plant
The basic elements of the systems are as follows:
1 - feedstock tank (manure)
2 - fermentation chamber with feeder, heating and mechanical or barbotage mixing
mechanism
3 - fermented product tank (silt)
4 - biogas tank
5 - heat or power generating system connected to the biogas plant
Often simple installations producing fertilizer from the fermented feedstock are also added to
the biogas plant. It is important to note that the particular equipment and its elements vary in
each type of installation, along with the different technologies used.
19
The size of the installation can vary and is dependant of the size of the livestock herd and the
quantity of energy produced. In the case of biogas plants with small fermentation chambers,
around 25 m3, so a livestock heard of 20:40 AL (Adult livestock) the biogas production
process consists of the following:
a) The manure flows from the livestock building to the fresh manure tank (feedstock tank)
using gravity. The manure is then acutely mixed.
b) From the resource tank the prepared manure is cyclically fed into the fermentation
chamber. The fermentation process is continuous at above room temperatures (the tank
is equipped in appropriate heaters). Inside the fermentation chamber the mixing
continues using special stirrer.
c) Through the overflow placed in the fermentation chamber, the fermented manure is
transferred to another tank from where it can be retrieved as a final product of the
fermentation process, or fertilizer.
d) Biogas produced in the fermentation process is transferred to a biogas tank. Installations
are always equipped with pressure and fire safeties (flame arresters),
e) A fraction of the energy produced from the manure can, and often is used for heating
the fermentation tank, while there rest remains for heat and power generation.
The complexity of the installation increases with its size.
The floor of the livestock building should be equipped with a grate. The fresh manure tank
can be placed below the livestock building. It’s also possible to use a second tank which
collects waste from food processing plants. In this case both tanks the feedstock is mixed
using a centrifugal pump. The fermentation chamber, similarly to before, is equipped with an
overflow transferring already fermented manure into a secondary, drainage tank, where the
fermented product can be composted or converted for fertilizer use. Drainage tank are
equipped with overflow tanks.
In large fermentation chambers and important part of the process, apart from heating the
feedstock, is the mixing, to prevent the feedstock from sinking to the bottom of the tank (the
larger the tank, the more of a significant problem this becomes). Typically hydraulic mixing
mechanisms are employed. The pump of the mixing mechanism forces the manure from the
bottom to the top of the fermentation tank.
The gas installation is equipped with the proper control system, safety measures and
purification system made up of sulphur and water removers.
20
4.3 TECHNOLOGIES OF UPGRADING BIOGAS TO NATURAL GAS
PARAMETERS
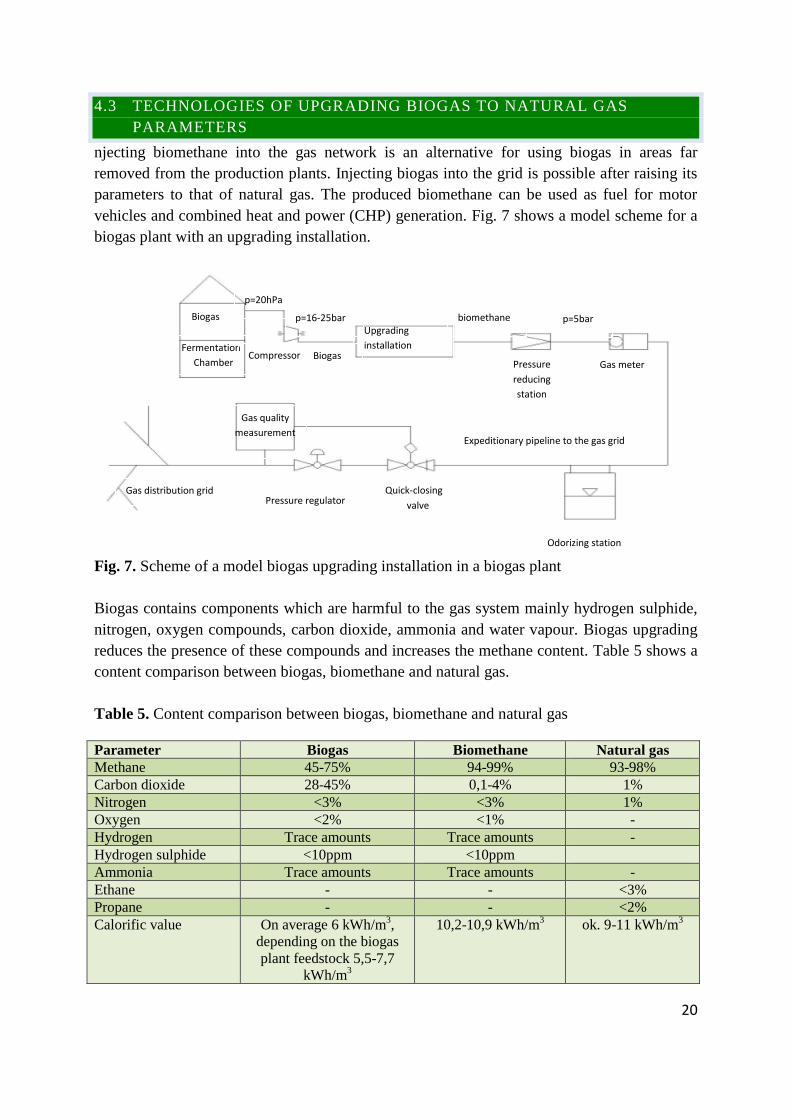
njecting biomethane into the gas network is an alternative for using biogas in areas far
removed from the production plants. Injecting biogas into the grid is possible after raising its
parameters to that of natural gas. The produced biomethane can be used as fuel for motor
vehicles and combined heat and power (CHP) generation. Fig. 7 shows a model scheme for a
biogas plant with an upgrading installation.
Fig. 7. Scheme of a model biogas upgrading installation in a biogas plant
Biogas contains components which are harmful to the gas system mainly hydrogen sulphide,
nitrogen, oxygen compounds, carbon dioxide, ammonia and water vapour. Biogas upgrading
reduces the presence of these compounds and increases the methane content. Table 5 shows a
content comparison between biogas, biomethane and natural gas.
Table 5. Content comparison between biogas, biomethane and natural gas
Parameter Biogas Biomethane Natural gas
Methane 45-75% 94-99% 93-98%
Carbon dioxide 28-45% 0,1-4% 1%
Nitrogen <3% <3% 1%
Oxygen <2% <1% -
Hydrogen Trace amounts Trace amounts -
Hydrogen sulphide <10ppm <10ppm
Ammonia Trace amounts Trace amounts -
Ethane - - <3%
Propane - - <2%
Calorific value On average 6 kWh/m3,
depending on the biogas
plant feedstock 5,5-7,7
kWh/m3
10,2-10,9 kWh/m3 ok. 9-11 kWh/m
3
Biogas
Gas distribution grid Pressure regulator
Quick-closing
valve
Fermentation
Chamber
p=20hPa
p=16-25bar
Biogas
biomethane
Pressure
reducing
station
Gas meter
p=5bar
Odorizing station
Expeditionary pipeline to the gas grid
Gas quality
measurement
Upgrading
installation Compressor
21
4.3.1 METHODS OF BIOGAS UPGRADING
The most often used methods of biogas upgrading to natural gas parameters are Pressure
Swing Adsorption (PSA), water scrubber, solvent scrubber, membrane separation and
cryogenic separation, less often the GPP®2 method. Table 6 shows technologies of upgrading
biogas to natural gas parameters, which shows that the best method of biogas upgrading is the
amine scrubber chemical adsorption.
Table 6 Technologies of biogas upgrading
When choosing a biogas upgrading method is essential to keep in mind a number of aspects. It
is important to include the power and heat requirements of each installation and a rage of
processes generating additional costs such as: sulphur removal, water removal, adjusting the
calorific value and pressure of the gas.
2 www.gtsbv.com
Technology Effect Methane content
after process
Methane loss
Pressure Swing
Adsorption (PSA)
Adsorption of CO2 on
active charcoal under
pressure
> 96% 2-4%
Water scrubber Dissolving CO2 in
pressurized water
> 96% 1-3%
Chemical adsorption
Amine scrubber
Chemical reaction of
CO2 with MEA
( monoethanolamine )
> 99% < 0,1%
Physical adsorption
Solvent scrubber
Dissolving CO2 in
solvent under pressure
> 96% ok. 2%
Membrane separation Different speeds of gas
molecule fermentation
> 95% ok. 2%
Cryogenic separation Aggregation conditions
dependent on the
temperature
> 99% -
22
4.3.2 WATER SCRUBBER METHOD
The water scrubber method is currently
the most commonly used of upgrading
biogas to natural gas parameters. The
process consists of:
compressing and cooling raw gas
physical absorption of CO2 in
pressurized wad
drying pure gas and content analysis
compression to grid pressure and
legalized measurement, followed by
injection into the grid
regeneration of the water scrubber by
reducing the pressure.
Fig. 8. Biogas upgrading installation
Biogas upgrading installations using the
water scrubber method consist of three
columns:
1 desorption column (called the
Stripper)
2 absorption column
separating CO2 from biogas
pressure (around 7 bar)
water and biogas meet in counter-flow
3 Flash columns
water treatment
reducing pressure to 2 bar
Fig. 9. Biogas upgrading columns
4.3.3 COSTS OF BIOGAS UPGRADING
The costs of biogas upgrading are dependent on the technology used. The average investment
cost of biogas plant investments using biogas purification technologies with 250 Mm3
biogas/h (equivalent to 500 kWel) efficiency range between 0,5 and 0,8 mln EUR. Investment
costs of and installation with an efficiency of 1000 Nm3/h (equivalent to 2 MWel) range close
to 1,2 – 1,5 mln EUR. The operating costs of technologies producing biomethane are
inversely proportional to the technologies’ efficiency. Larger unit operating costs are
23
generated by a smaller biomethane production. An installation producing 250 Nm3 biogas/h
generates costs of 13 – 17 EUR/MWh, while and installation with an efficiency of
1 000 Nm3 biogazu/h generates costs of 7 – 13 EUR/MWh.
4.3.4 QUALITY OF THE BIOMETHANE INJECTED INTO THE GRID
According to art. 9a law. 11 and art. 7 law 8, when connecting a biogas installation to the grid
one must pay special attention to::
the qualitative parameters of the agricultural biogas injected to the gas distribution grid,
which are as follows:
hydrogen sulphide content should not exceed 7,0 mg/m3;
thiol content should not exceed 16,0 mg/m3;
total sulphur content should not exceed 40,0 mg/m3;
mercury vapour content should not exceed 30,0 µg/m3;
water dew point temperature at pressures of 5,5 MPa should be:
from 1st April to 30
th September 2011 no more than: + 3,7°C,
from 1st October to 31
st March 2011 no more than: - 5°C;
heat of combustion should not be lower than::
34,0 MJ/m3 – for agricultural biogas injected into a grid transporting high-
methane group E natural gas with a Wobbe index range from 45,0 MJ/m3 up
to and including 54,0 MJ/m3,
30,0 MJ/m3 – for agricultural biogas injected into a grid transporting
nitrified subgroup Lw natural gas with a Wobbe index range from 37,5
MJ/m3 up to and including 45,0 MJ/m
3,
26,0 MJ/m3 – for agricultural biogas injected into a grid transporting
nitrified subgroup Ls natural gas with a Wobbe index range from 32,5
MJ/m3 up to and including 37,5 MJ/m
3,
22,0 MJ/m3 - for agricultural biogas injected into a grid transporting
nitrified subgroup Ln natural gas with a Wobbe index range from 27,0
MJ/m3 up to and including 32,5 MJ/m
3,
18,0 MJ/m3 - for agricultural biogas injected into a grid transporting
nitrified subgroup Lm natural gas with a Wobbe index range from 23,0
MJ/m3 up to and including 27,0 MJ/m
3.
Parameters, in law 1, are defined for the following conditions of the combustion
process:
pressure - 101,325 kPa,
temperature - 298,15 K (25°C);
of volume:
pressure - 101,325 kPa,
temperature - 273,15 K (0°C).
requirements concerning measurements, registration and methods of calculating the
amount of the produced agricultural biogas,
24
place where the measurement of the biogas quantity was done for the fulfilment of
obligations,
method of converting the quality of agricultural biogas produced into equivalent
electricity produced in renewable energy resources for the fulfilment of the obligation in
art. 9a law 1,
conditions for connecting a installation producing agricultural biogas to the distribution
network, taking into account the need to ensure the operational safety of the gas system
and the available agricultural biogas production technologies,
the biogas supplier bears the cost of injecting biogas into the distribution network,
the conditions for connecting to the network are set by the operator of the distribution
grid.
The amount of agricultural biogas injected into the gas distribution network is calculated
according to the formula:: Ibio = Ibiok – Ibiop,
where the symbols represent:
Ibio – amount of produced biogas injected into the gas distribution network [m3],
Ibiok – final value shown by measuring equipment [m3],
Ibiop – initial value shown by the measuring equipment [m3].
Injecting biogas into the gas distribution grid requires constant control of the gas’ calorific
value and period testing of the harmful substance content. The amount of biogas possibly
injected into the distribution network is dependent on the gas demand in the supply station
Developing a monitoring system for the injected biogas is required, but most importantly
monitoring of the following parameters must be improved:
sulphur content,
siloxane content,
trace elements, which could affect health,
oxygen content,
hydrogen content,
methane number (parameter connected to knocking combustion in engines, comparison
– octane rating for liquid fuels).
25
5 BIOGAS PLANTS IN POLAND
5.1.1 AVAILIBILITY OF SUBSTRATE AND BIOGAS POTENTIAL
The huge energy potential of Poland’s agricultural sector is a great chance for the
development of the biomethane/biogas sector3. The estimated resource potential is equal to 5
mln m³ of biogas. The potential includes the use of agricultural by products, liquid and solid
animal manure and refuse from the agriculture and food sectors. Alongside with using these
resources, the creation of energy crop cultivations, with the purpose of using them as substrate
for biogas plants, is predicted. Eventually this is possible for about 700 thousand ha, which
would cover the national food demand and obtain additional resources required to produce
biofuels and agricultural biogas. The real potential of agricultural by-products and refuse from
the agriculture and food industries is 1,7 mld m3 of biogas annually (847 ktoe, 35,6 PJ)
4.
Quantities of this magnitude would be enough for 1,2% of the final energy demand.
The Institute of Renewable Energy, in an 2007 expertise for the Ministry of Economy, states
that the economic potential of biogas in 2020 is estimated at 204 PJ, which is equivalent to 6,6
mld m3 of biogas, making up 4,6 % of the final energy use.
5.1.2 CURRENT STATE OF BIOGAS PLANTS IN POLAND
The recent years have shown a significant development of the biogas industry in Poland. Over
the last couple of years the number of biogas units produced almost doubled, which could
indicate investment profitability and substrate availability. There are currently 44 biogas plant
is Poland (Table 7) with a combined efficiency of 162 170 554 m3/year, an installed electric
power of 51,743 MWe and 50,985 MWt of installed heating power. However the quantity of
biogas currently produced is still low compared to the possible potential. This is due to a
number of barriers slowing down the development of the biogas sector in Poland. One of
them is the lack of regulation on renewable energy sources and waiting for potential investors.
3 „Directions for the development of agricultural biogas plant in Poland for 2010 – 2020”
4 „Poland’s energy policy up to 2030”
26
Table 7. Registered biogas plants in Poland5
No. Energy company name Location Annual
agricultural biogas
production of the
biogas plant
(m³/year)
Installed power
electricity
(MWe)
heat
(MWt)
1. Poldanor S.A. Koczała 8 212 500 2,126 2,206
2. Poldanor S.A. Pawłówko 3 802 655 0,946 1,101
3. Poldanor S.A. Płaszczyca 2 299 500 0,625 0,68
4. Poldanor S.A. Nacław 2 299 500 0,625 0,686
5. Poldanor S.A. Świelino 2 299 500 0,625 0,686
6. Poldanor S.A. Uniechówek 4 100 200 1,063 1,081
7. Poldanor S.A. Giżyno 4 100 200 1,063 1,081
8. Poldanor S.A. Kujanki 1 124 470 0,33 0,342
9. Biogaz Agri Sp. z o.o. Niedoradz 631 000 0,252 0,291
10. Spółka Rolna Kalsk
Sp. z o.o.
Kalsk 5 000 000 1,140 1,060
11. Elektrownie Wodne Sp.
z o.o.
Liszkowo 7 400 000 2,126 1,198
12. Biogaz Zeneris Sp.z.o.o. Skrzatusz 2 080 000 0,526 0,505
13. Eko - Energia Grzmiąca
Sp. z o.o.
Grzmiąca 7 000 000 1,600 1,600
14. BIO-WAT Sp. z o.o. Świnica 4 000 000 0,900 1,100
15. BIO-BUT Sp. z o.o. Sośnicowice 2 470 915 0,526 0,540
16. Bioelektrownia
Sp. z o.o.
Uhnin 4 500 000 1,200 1,160
17. Bioenergy Project
Sp. z o.o.
Konopnica 9 353 755 1,998 2,128
18. Allter Power Sp. z o.o. Mełno 6 200 000 1,600 1,800
19. Wikana Bioenergia
Sp. z o.o.
Piaski 3 906 960 0,999 1,040
20. AWW Wawrzyniak
Sp. j.
Zbiersk
Cukrownia
4 176 558 1,600 1,620
21. Biogal Sp.z.o.o. Boleszyn 7 840 000 2,000 2,020
22. Gospodarstwo Rolne
Kargowa - Klępsk
Ryszard Maj
Klępsk 4 633 117 1,000 1,400
5 Agricultural Market Agency
27
23. P.P.H.U. "SERAFIN"
Sp. z o.o.
Szklarka
Myślniewska
3 000 000 0,660 0,640
24. Elektrociepłownia
Bartos Sp. z o.o.
Piekoszów 2 464 000 0,800 0,855
25. Polskie Biogazownie
"Energy-Zalesie"
Sp. z o.o.
Domaszowice 8 000 000 2,000 2,016
26. DOBITT ENERGIA
Sp. z o.o.
Liszkowo 7 400 000 2,126 1,198
27. FARM FRITES Poland
S.A.
Lębork 3 500 000 1,200 1,223
28. Südzucker Polska S.A. Strzelin 5 173 875 2,000 2,065
29. DMG Sp. z o.o. Koczergi 3 900 000 1,200 1,300
30. "BIO-POWER Sp. z o.o. Zaścianki 3 500 000 1,200 1,251
31. Cargill Poland Sp. z o.o. Kobierzyce 1 300 000 0,526 0,581
32. Biogazownia Rypin
Sp. z o.o.
Rypin 6 811 090 1,875 1,813
33. Minex-Invest Sp.z.o.o. Łęguty 4 561 200 1,200 1,220
34. "EKOENERGIA WKM"
Sp. z o.o.
Orchówek 3 500 000 1,063 1,299
35. Nadmorskie Elektrownie
Wiatrowe Darżyno
Sp. z o.o.
Darżyno 7 700 000 2,400 2,448
36. Zakład Usługowo-
Handlowy
„Wojciechowski"
Zdzisław
Wojciechowski
Opoczno 1 883 314 0,500 0,646
37. EL-KA Sp.z.o.o. Byszewo 4 400 000 1,00 1,201
38. BIOGAZ Przemysław
"Łąkrol" Sp.z.o.o
Resko 7 000 000 1,600 1,600
39. PFEIFER&LANGEN
GLINOJECK S.A.
Glinojeck 7 305 840 1,560 a
40. Elektrownia Biogazowa
„Borzęciczki” Sp. z o.o.
Borzęciczki 3 600 000 1,200 1,320
41. Agro Bio Sp. z o.o. Kętrzyn 1 680 000 0,400 0,445
42. „Eco – Progres”
Sp. z o.o.
Giże 4 240 000 1,063 1,104
43. Ośrodek Hodowli
Zarodowej „Gajewo”
Tragamin 2 880 000 0,800 0,789
28
Sp. z o.o.
Total : 162 170 554 51,743 50,985
5.1.3 CONSTRUCTION OF NEW AGRICULTURAL BIOGAS PLANTS IN
POLAND
Between 2015 and 2018 the completion of the following biogas plant is expected::
Rzędów – 9,6 MW bio-power plant– completion 2015. – commissioning 2016.
Starachowice – 7 MW bio-power plant, including a 3 MW biogas plant – completion
2016 – commissioning 2017
Łoninów – 2 MW bio-power plant, 1 MW biogas plant– completion 2016 –
commissioning 2017
Kopaniny – 3 MW bio-power plant– completion 2017 – commissioning 2018
Końskie – 1 MW bio-power plant– completion 2017 – commissioning 2018
Gnojno – 2 MW bio- power plant – completion 2016 – commissioning – 2017
Wielopol – 2 MW bio- power plant
Pokutulsko – PHU Rolpako Sp. z o.o. – 0,5 MW
Bara – Poldanor S.A. – 0,3 MW
Tychowo – Biogas Kikowo Sp. J. – 0,5 MW
Jerzyce – Jabro Sp. z o.o. – 1 MW
Significant development of biomethane installations in Poland is not possible without proper
legislation (RES Law), however if projects concerning biomethane will be successful, in the
near future stations for injecting biomethane into the gas grid will be built, along with CNG
distribution installations.
5.1.4 PRODUCTION OF AGRICULTURAL BIOGAS
Currently agricultural biogas plant generate both electric power and heat. In 2011 the amount
of agricultural biogas produced was 36,64 mln m3, the amount of electricity produced was
73,43 GWh, while the amount of heat produced was 82,63 GWh. In 2012 the amount of
agricultural biogas produced was 73,14 mln m3, the amount of electricity produced -
141,79 GWh, and the amount of heat produced - 158,64 GWh. The data shows that between
2011 and 2012 the production of agricultural biogas doubled. This indicates significant
growth of this energy sector in Poland
29
Table 8 Production of agricultural biogas, electricity and heat from agricultural biogas
between 2011 and 2012
Year Amount of produced
agricultural biogas
[mln m3]
Amount of electricity
produced from
agricultural biogas
[GWh]
Amount of heat
produced from
agricultural biogas
[GWh]
2011 r. 36,64 73,43 82,63
2012 r. 73,14 141,79 158,64
1st half of 2013 r. 52,53 106,80 121,54
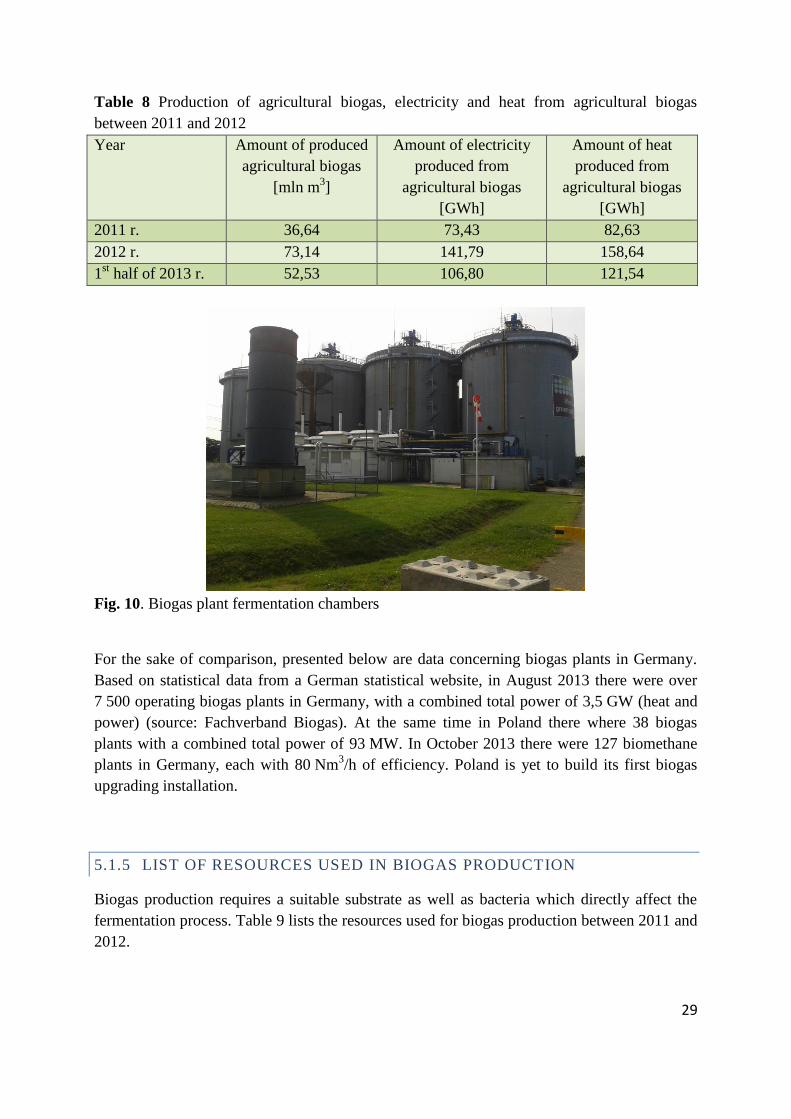
Fig. 10. Biogas plant fermentation chambers
For the sake of comparison, presented below are data concerning biogas plants in Germany.
Based on statistical data from a German statistical website, in August 2013 there were over
7 500 operating biogas plants in Germany, with a combined total power of 3,5 GW (heat and
power) (source: Fachverband Biogas). At the same time in Poland there where 38 biogas
plants with a combined total power of 93 MW. In October 2013 there were 127 biomethane
plants in Germany, each with 80 Nm3/h of efficiency. Poland is yet to build its first biogas
upgrading installation.
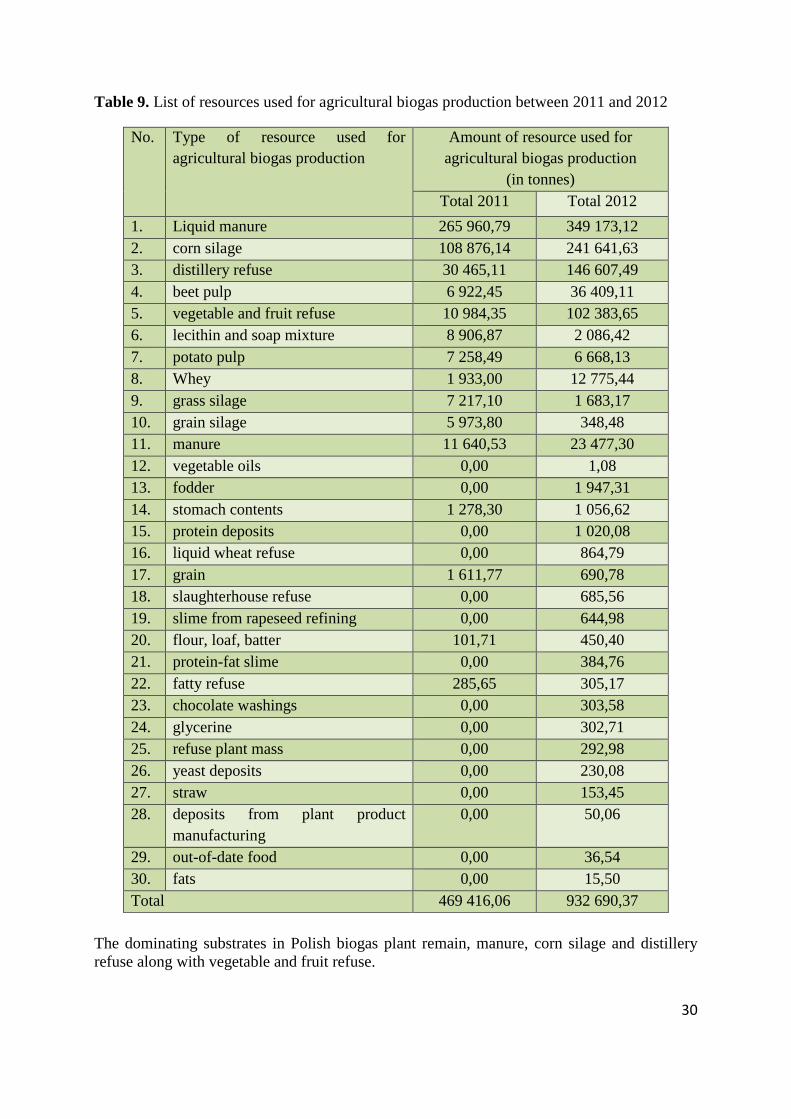
5.1.5 LIST OF RESOURCES USED IN BIOGAS PRODUCTION
Biogas production requires a suitable substrate as well as bacteria which directly affect the
fermentation process. Table 9 lists the resources used for biogas production between 2011 and
2012.
30
Table 9. List of resources used for agricultural biogas production between 2011 and 2012
No. Type of resource used for
agricultural biogas production
Amount of resource used for
agricultural biogas production
(in tonnes)
Total 2011 Total 2012
1. Liquid manure 265 960,79 349 173,12
2. corn silage 108 876,14 241 641,63
3. distillery refuse 30 465,11 146 607,49
4. beet pulp 6 922,45 36 409,11
5. vegetable and fruit refuse 10 984,35 102 383,65
6. lecithin and soap mixture 8 906,87 2 086,42
7. potato pulp 7 258,49 6 668,13
8. Whey 1 933,00 12 775,44
9. grass silage 7 217,10 1 683,17
10. grain silage 5 973,80 348,48
11. manure 11 640,53 23 477,30
12. vegetable oils 0,00 1,08
13. fodder 0,00 1 947,31
14. stomach contents 1 278,30 1 056,62
15. protein deposits 0,00 1 020,08
16. liquid wheat refuse 0,00 864,79
17. grain 1 611,77 690,78
18. slaughterhouse refuse 0,00 685,56
19. slime from rapeseed refining 0,00 644,98
20. flour, loaf, batter 101,71 450,40
21. protein-fat slime 0,00 384,76
22. fatty refuse 285,65 305,17
23. chocolate washings 0,00 303,58
24. glycerine 0,00 302,71
25. refuse plant mass 0,00 292,98
26. yeast deposits 0,00 230,08
27. straw 0,00 153,45
28. deposits from plant product
manufacturing
0,00 50,06
29. out-of-date food 0,00 36,54
30. fats 0,00 15,50
Total 469 416,06 932 690,37
The dominating substrates in Polish biogas plant remain, manure, corn silage and distillery
refuse along with vegetable and fruit refuse.
31
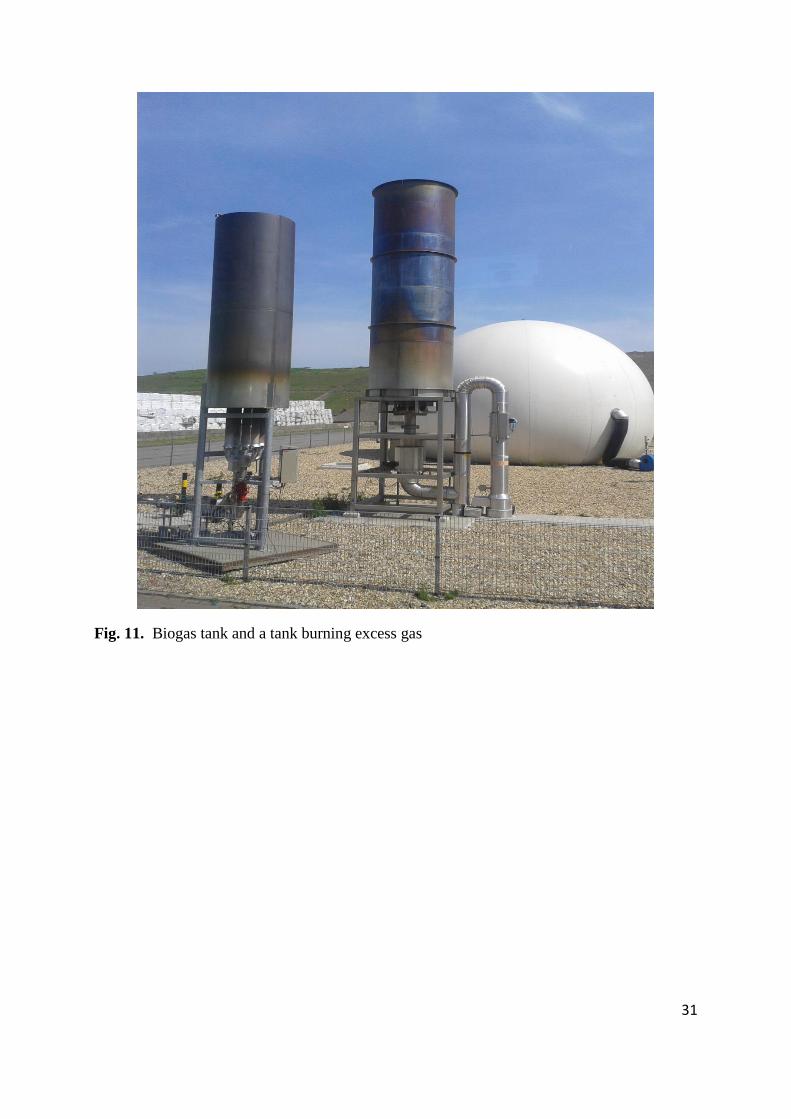
Fig. 11. Biogas tank and a tank burning excess gas
32
6 BARRIERS FOR BIOMETHANE USE AND MECHANISMS OF GOAL
ACHIEVEMENT
Poland faces many barriers for biogas and biomethane production, which are:
location decision for biogas plants are burdensome and take significant amounts of time
(Local Spatial Use Plans do not include RES installations),
before biogas plant construction the agricultural status of the plot must be removed,
no guarantee/priority of connecting the biogas power plant to the power or gas grids,
procedure of acquiring connection terms is 150 days long, regardless to the size of the
installation
low stability of the certificate system and their low price,
unregulated issue of using fermentation product (silt) as crop fertilizer, even in cases
where the installation uses substrates of agricultural origin (plant and animal waste),
necessary testing of the silt if it is to be used as fertilizer,
no regulation on handing off the silt to physical entities,
no technical and methodological support, weak gas power and heat grid infrastructures,
no access to information on biogas plant operation,
no public support for biogas investments.
33
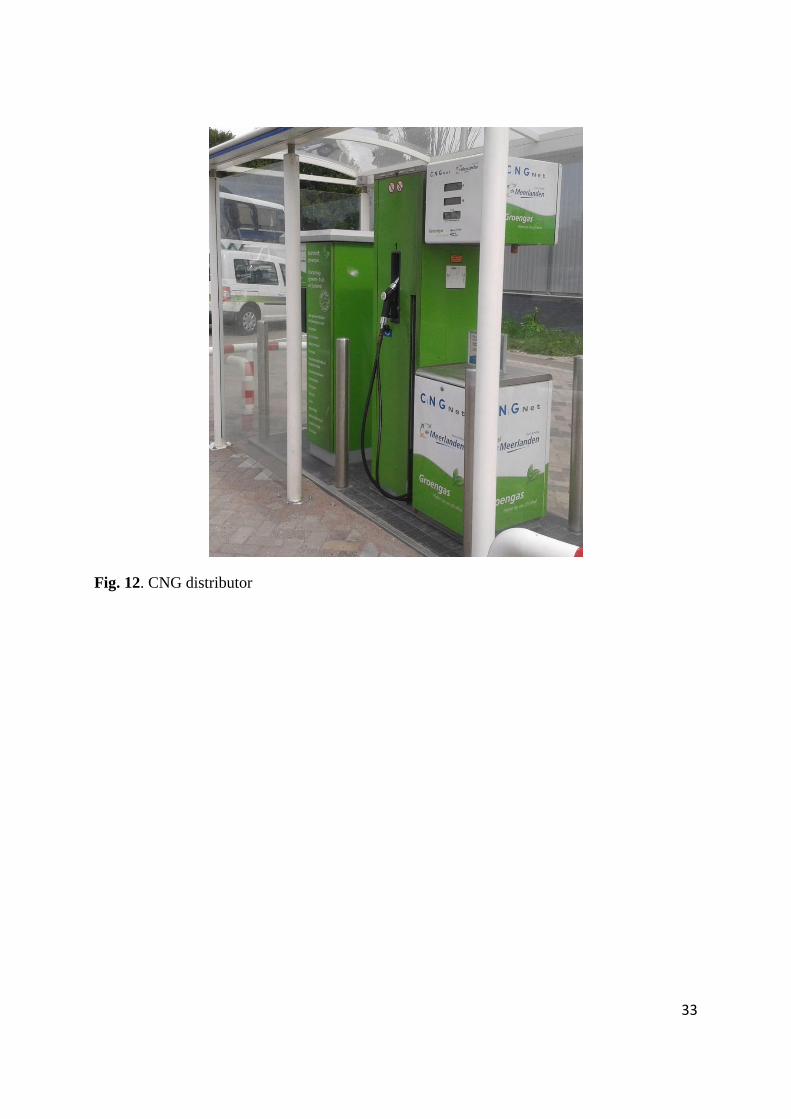
Fig. 12. CNG distributor
34
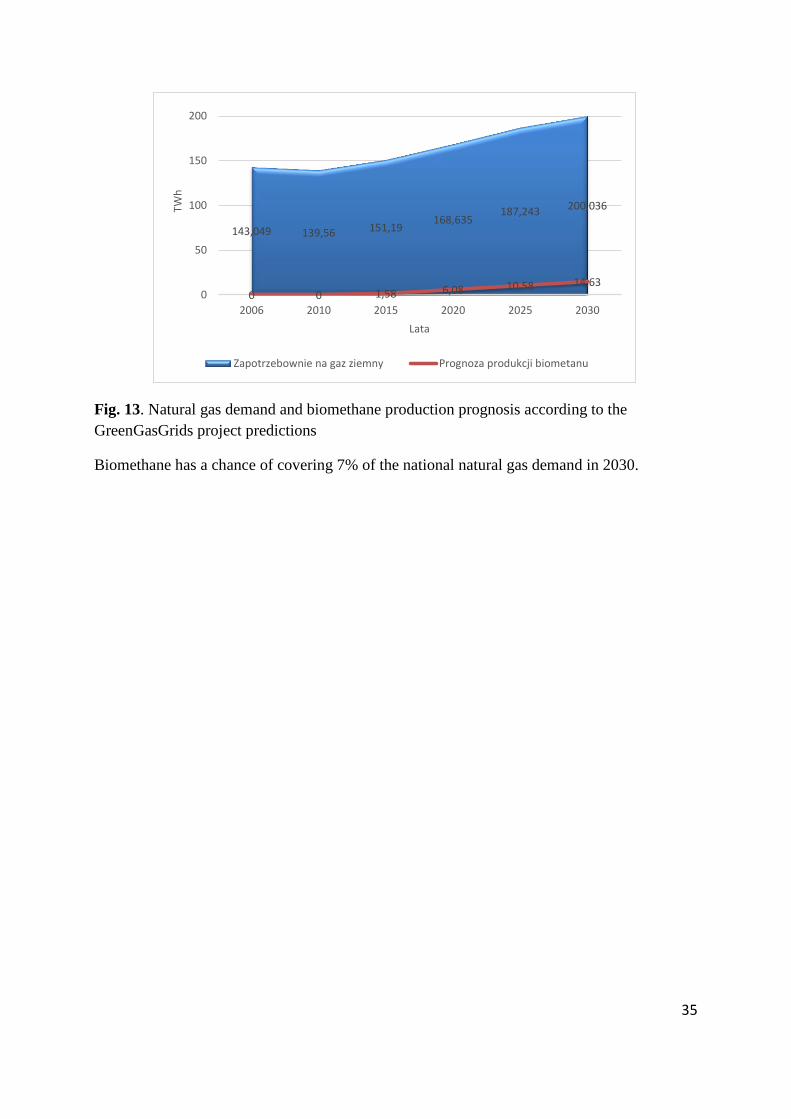
7 PROJECTIONS OF BIOMETHANE PRODUCTION IN POLAND
ACCORDING TO GREENGASGRIDS PROJECT ESTIMATES
Currently there are no plants upgrading biogas to natural gas parameters in Poland. The first
installations are predicted for 2015. At the same time the demand for natural gas in Poland
will systematically increase, reaching 200 TWh6 in 2030.
The “Biomethane Market Matrix”7 shows that anaerobic fermentation technologies and the
biogas industry have large possibilities of development in Europe, while Poland, in the
GreenGasGrids project partner countries ranking, is part of a group with good conditions for
developing a biomethane market. The lack of financial and legislative support for biogas plant
owners is the main reason while the sector is not developing.
The predicted biomethane production of biomethane in Poland in 2030 was calculated on the
basis of available resources – firstly crops, then all remaining resources.
The potential of agricultural crops constituting the substrates of anaerobic fermentation in
partner countries was estimated on the basis of the area of cultivated land. The resulting
values were compared to a reference country (United Kingdom), resulting in a scale
coefficient. The biomethane potential was calculated including the availability of resources
such as, sewage, straw, lignocellulose crops, food refuse, biodegradable waste and food
processing waste. The size of the biogas production was scaled with the population size. The
results are presented in Fig. 13, with reference to natural gas demand.
6 Poland’s energy policy up to 2030, document accepted by the Cabinet of Ministers on 10th
November 2009.
7 www.greengasgrids.eu/
35
Fig. 13. Natural gas demand and biomethane production prognosis according to the
GreenGasGrids project predictions
Biomethane has a chance of covering 7% of the national natural gas demand in 2030.
143,049 139,56 151,19 168,635
187,243 200,036
0 0 1,58 6,08 10,58 14,63 0
50
100
150
200
2006 2010 2015 2020 2025 2030
TWh
Lata
Zapotrzebownie na gaz ziemny Prognoza produkcji biometanu
36
8 CONCLUSION
The development of the biomethane market in Poland is dependant from economic factors.
For the sector to develop it requires financial support for investors and companies.
The development of agricultural biogas plants and possibilities of using biogas is further
limited by a number of social, institutional, legislative and economic barriers. The
development of biogas plants in Poland will be primarily based on removing those
institutionally-legislative barriers and carefully selected economic stimuli, which will affect
the creation of a market and technological support of biogas installations. The growth of this
energy resource, produced in agricultural biogas plants is firstly appealing from the economic
and environmental perspective of limiting losses in generating heat and power, and secondly,
from the possibility of supplying this energy carrier to households in villages and small towns
The structure of the polish gas system is significantly different from the ones in western
Europe, and the possibilities of injecting biomethane produced in biogas plants in Poland
seem limited. Biomethane should be treated as a non-competitive fuel, but also as a method of
diversifying the natural gas supply.

37
Roadmap for biomethane market development in Poland
2014
Authors: Ryszard Wnuk, Bartłomiej Asztemborski
The report is available on the KAPE S.A. website
www.kape.gov.pl