roadmap item: supporting decision makers with life cycle ...c.ymcdn.com/sites/ file · web viewat...
TRANSCRIPT
Draft for public comment November 12, 2014
Roadmap item: Supporting Decision Makers with Life Cycle Assessment (LCA)The LCA Community needs to address the lack of data, knowledge and methods needed to effectively interpret LCA results and inform decision makers.
Current status:At the current time (2014), it is difficult for LCA practitioners to effectively inform decision makers unless the results of a study are resoundingly conclusive: showing a clear advantage or disadvantage across all impact categories by a large enough margin to accommodate uncertainty in the data and impact assessment methods. To inform decision makers appropriately, there need to be scientifically sound methodologies to address trade-offs. While different types of normalization and weighting have been proposed to handle tradeoffs, none have been strongly supported by the LCA community. From the impact assessment side, the characterization factors often do not have stated uncertainty, and if they do, very few tools can utilize this uncertainty. These issues will only become compounded if the LCA results are incorporated into a larger set of sustainability considerations, such as societal and economic impacts.
The different kinds of stakeholders and/or decision-makers throughout a product’s life cycle may require tailored communication. These stakeholders, who may be in product design, R&D, sales, procurement, or at the consumer use phase, will understand and respond to different kinds of information.
The goal of this roadmap item is to identify specific needs and milestones to improve the decision-making ability of researchers, engineers, purchasers, industry management, government administrators, politicians and consumers.
We recognize that LCA is an imperfect model; we also recognize that it is a useful and informative model. This roadmap works to address LCA’s weaknesses as a decision-support tool and strengthen its ability to inform decisions notwithstanding uncertainty in data and methods.
Possible solutions:Potential solutions exist, some of which are fully developed for use in other applications, some of which are newly in development. This roadmapping group has identified 5 areas in which solutions must be developed or identified, evaluated and recommended by the LCA community. Specifically, the community needs: to establish sufficient confidence in environmental profile differentials; to identify selection criteria for impact categories for each system; to develop or identify a rational and consistent normalization scheme; to develop or identify rational and consistent multi-criteria decision analysis methods; and to address the need for effective visual presentation of data. Each of these areas is discussed in detail.
LCA Capability Roadmap Item “Supporting Decision Makers with LCA” Page 1
Draft for public comment November 12, 2014
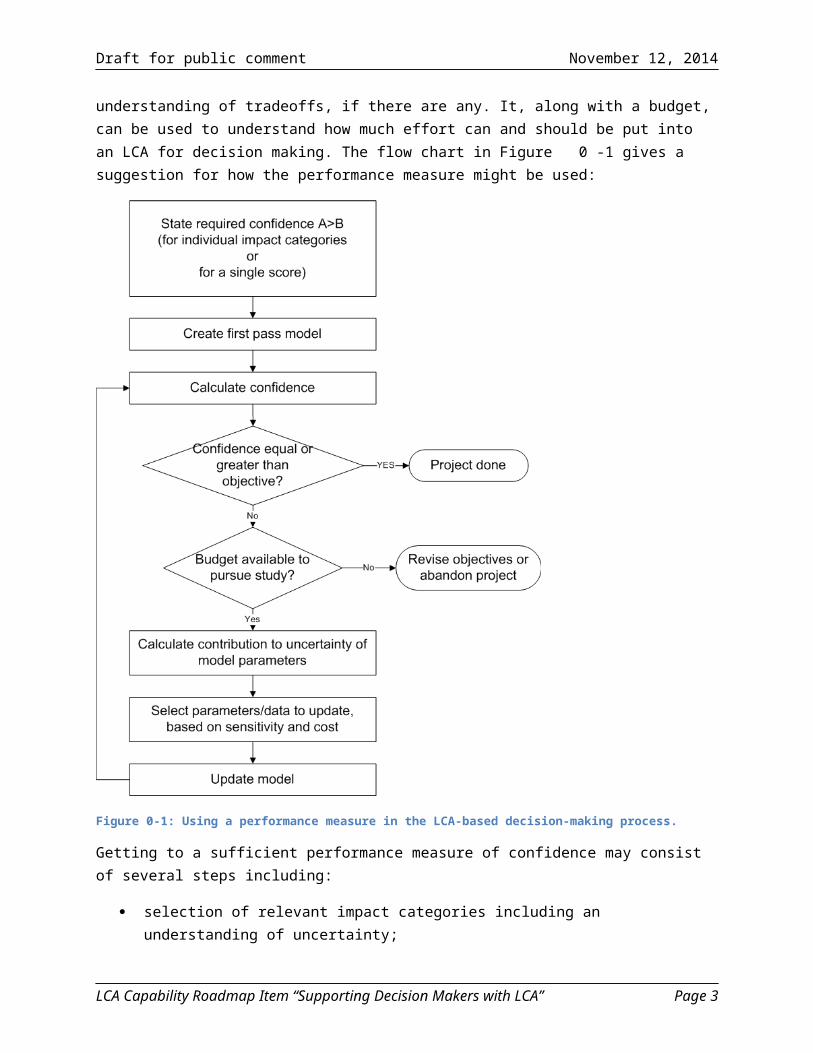
Performance measure of confidenceGetting to a performance measure of confidence in the difference between impacts has been an issue of increasing interest over the last 20 years. As a starting point the Second Working Group of SETAC Europe (1999) developed the “best available practice regarding impact categories and category indicators in Life Cycle Impact Assessment”. Huijbregts et al. (1998) identified that a general distinction should be made in LCA between parameter, scenario, and model uncertainty, in order to understand the uncertainties among study outcomes. Recently, the effect of all of these variables on the differences between impacts and the overall life cycle impact assessment have been studied by Weidema (2014) and Owsianiak et al. (2014). This roadmap effort is a part of the current UNEP/SETAC flagship initiative on LCA indicators to update the best practices. Good decisions require some measure of confidence in the difference between alternatives. The required degree of confidence may vary for different applications. This measure, called performance measure of confidence, includes an indication of the robustness1 of the decision between alternatives as well as an understanding of tradeoffs, if there are any. It, along with a budget, can be used to understand how much effort can and should be put into an LCA for decision making. The flow chart in Figure 0-1 gives a suggestion for how the performance measure might be used:
1 Hertwich, E.G. and Hammitt J.K. (2001), 'A decision-analytic framework for impact assessment, part I—LCA and decision
analysis ', Int J Life Cycle Assess 6:5–12
LCA Capability Roadmap Item “Supporting Decision Makers with LCA” Page 2
Draft for public comment November 12, 2014
Figure 0-1: Using a performance measure in the LCA-based decision-making process.
Getting to a sufficient performance measure of confidence may consist of several steps including:
selection of relevant impact categories including an understanding of uncertainty; normalization; assessment of tradeoffs
The status of these steps is shown below.
Selection of Impact CategoriesThe ISO guidance on selection of impact categories is insufficient for many applications. The guidance indicates that the categories shall be consistent with the goal and scope, comprehensive, and have an identified effect (end-point). The uncertainty associated with each impact category should be
LCA Capability Roadmap Item “Supporting Decision Makers with LCA” Page 3
Draft for public comment November 12, 2014
considered and communicated with the results of the study. Over time, practitioners learn that certain industries and products have higher impacts in specific categories and that those categories are important. As examples, agricultural products have high impacts in land use (direct and indirect), eutrophication, and water use. Most petro-derived products have impacts in fossil fuel depletion and climate change. Semiconductor processing adds water use to that list. In addition, categories that are of concern by specific stakeholders should also be considered. This might include human toxicity for natural gas extraction and disruption of animal migration patterns for wind and hydropower. This type of information can and should be codified for new and existing users, so that a designer looking at replacing a petro-based product with an agricultural product does not ignore the eutrophication and water use in the deliberations.
NormalizationNormalization is a step that puts category indicator results into perspective by relating them to some kind of reference information. There are a number of normalization methods in use today that are described below. The method which has the greatest acceptance in the LCA community is external normalization to the total or per capita regional emissions/extractions. Additional work is needed to consider some of the newer methods of normalization (as well as others which have not yet been developed or identified) to understand which of them will lead to the most robust decisions.
A non-exhaustive summary of existing normalization methods is found in Appendix A: Non-exhaustive overview on existing normalization methods.
Assessments of TradeoffsIn order to identify the best alternative when doing a comparison, it is often necessary to understand the tradeoffs between different impact categories. Some type of Multi-criteria Decision Analysis (MCDA) technique is needed to assist with this interpretation of results. This may include weighting or other MCDA techniques.
Even with the best normalization technique, LCA results may still not be conclusive, with one product having advantages in one set of impact categories and the other having advantages in a different set. MCDA can be used to support decision making in the presence of such tradeoffs.
As practitioners begin to assess social impacts along with LCA results to provide a more comprehensive sustainability assessment, the requirements for a robust MCDA technique expand and need to be integrated into a roadmap with a longer term vision. The largely numeric and negative environmental impacts must now be weighed against societal impacts that may be positive or negative and are often intangible, making it difficult to put them into quantitative metrics. To put these two sets of metrics into a framework that can compete with the driving economic impacts is a further challenge.
A number of MCDA techniques exist in the literature and the science is continuing to expand (see the list below). The most common method proposed today for LCA is Simple Additive Weighting (SAW). Some of the other existing methods may work in the LCA and expanding context. Work needs to be done to test and assess these methods for use with LCA to determine which methods may be appropriate fora given application. The methods may need to be refined as appropriate. Further guidance is required, along with consideration of when a particular method is appropriate over another, for example.
LCA Capability Roadmap Item “Supporting Decision Makers with LCA” Page 4
Draft for public comment November 12, 2014
A non-exhaustive summary of existing MCDA methods is found in Appendix B: Non-exhaustive overview on existing MCDA methods.
Results VisualizationVisualization techniques currently used in LCA do not effectively help decision makers. Bar graphs of characterization results, in particular, can be misleading and do nothing to aid in assessing tradeoffs. Better ways to visualize results, particularly with respect to tradeoffs and uncertainty need to be found to enable better decision making. One way of better understanding the needs of decision makers would be to survey decision makers about the information they need to make good decisions (the decision makers surveyed would need some prerequisite understanding of LCA and its uncertainty).
A non-exhaustive summary of existing results visualization techniques is found in Appendix C: Non-exhaustive overview on existing results visualization techniques.
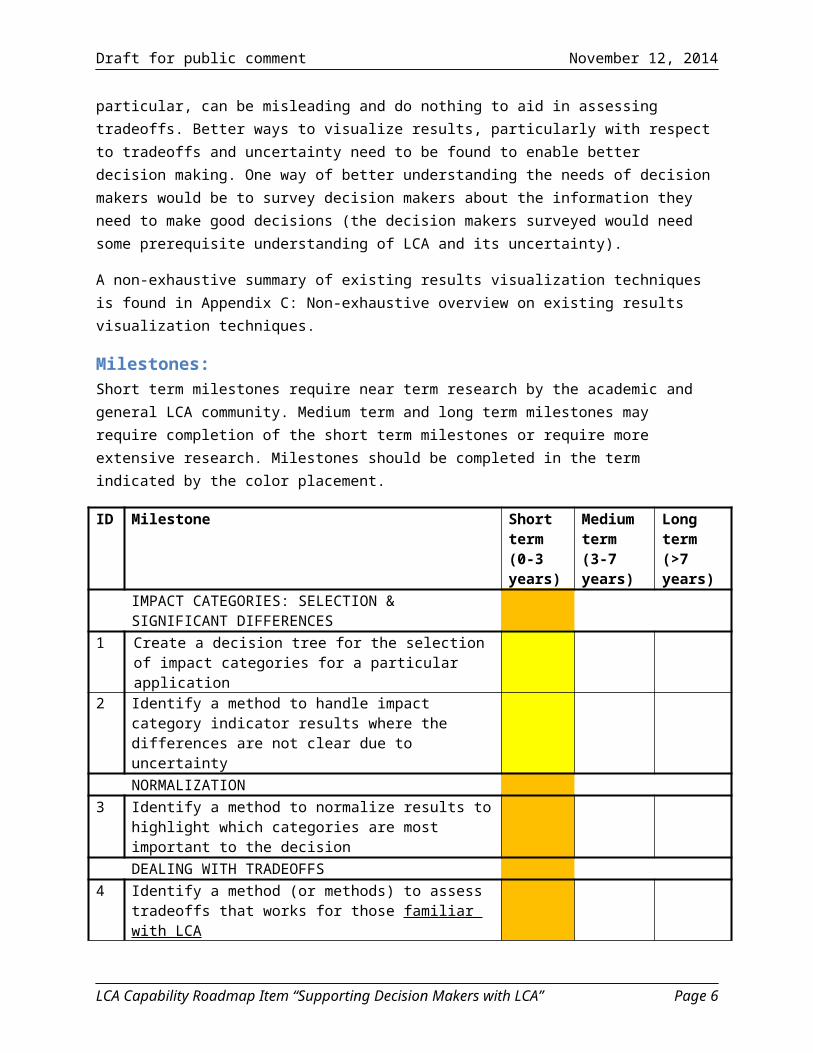
Milestones:Short term milestones require near term research by the academic and general LCA community. Medium term and long term milestones may require completion of the short term milestones or require more extensive research. Milestones should be completed in the term indicated by the color placement.
ID Milestone Short term (0-3 years)
Medium term (3-7 years)
Long term (>7 years)
IMPACT CATEGORIES: SELECTION & SIGNIFICANT DIFFERENCES
1 Create a decision tree for the selection of impact categories for a particular application
2 Identify a method to handle impact category indicator results where the differences are not clear due to uncertaintyNORMALIZATION
3 Identify a method to normalize results to highlight which categories are most important to the decisionDEALING WITH TRADEOFFS
4 Identify a method (or methods) to assess tradeoffs that works for those familiar with LCA
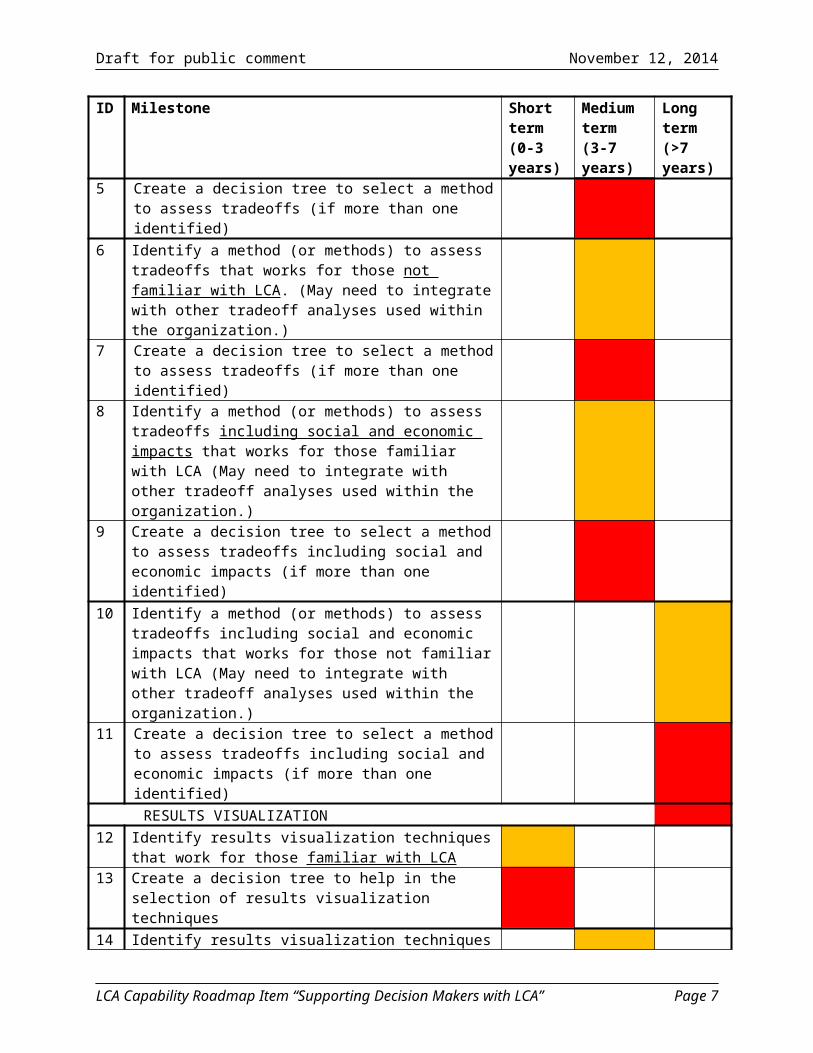
5 Create a decision tree to select a method to assess tradeoffs (if more than one identified)
6 Identify a method (or methods) to assess tradeoffs that works for those not familiar with LCA. (May need to integrate with other tradeoff analyses used within the organization.)
7 Create a decision tree to select a method to assess tradeoffs (if more than one identified)
LCA Capability Roadmap Item “Supporting Decision Makers with LCA” Page 5
Draft for public comment November 12, 2014
ID Milestone Short term (0-3 years)
Medium term (3-7 years)
Long term (>7 years)
8 Identify a method (or methods) to assess tradeoffs including social and economic impacts that works for those familiar with LCA (May need to integrate with other tradeoff analyses used within the organization.)
9 Create a decision tree to select a method to assess tradeoffs including social and economic impacts (if more than one identified)
10 Identify a method (or methods) to assess tradeoffs including social and economic impacts that works for those not familiar with LCA (May need to integrate with other tradeoff analyses used within the organization.)
11 Create a decision tree to select a method to assess tradeoffs including social and economic impacts (if more than one identified)
RESULTS VISUALIZATION12 Identify results visualization techniques that work for those
familiar with LCA13 Create a decision tree to help in the selection of results
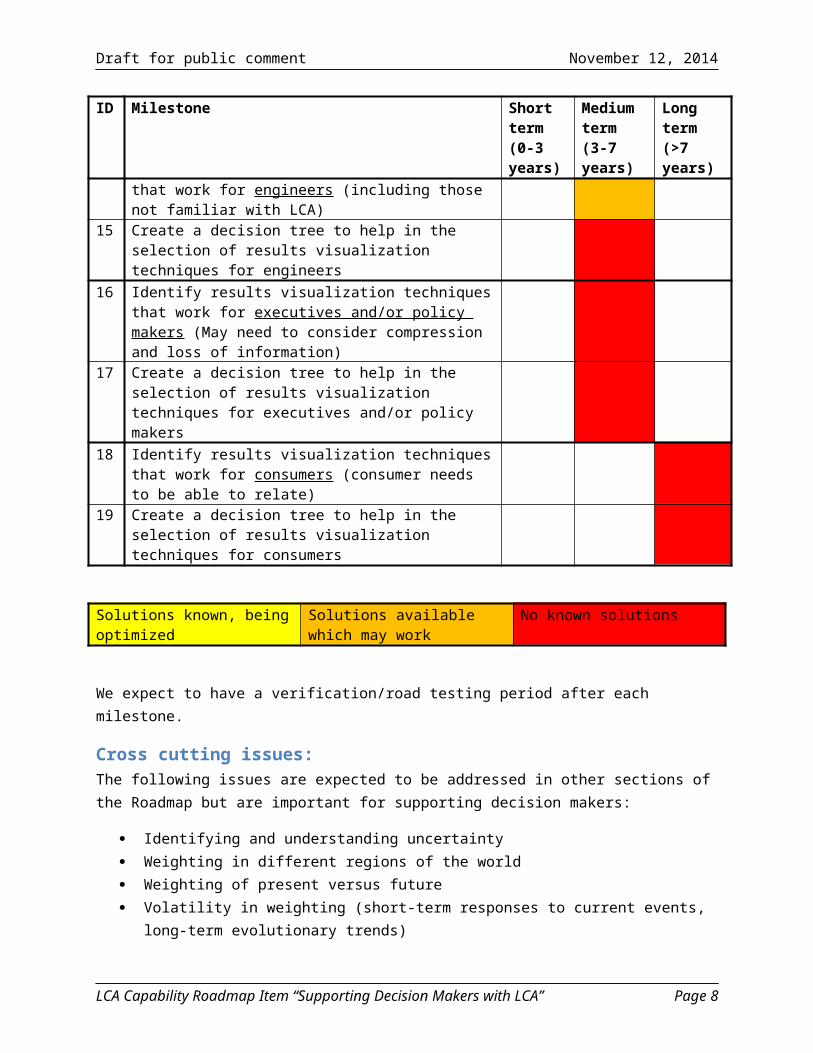
visualization techniques14 Identify results visualization techniques that work for
engineers (including those not familiar with LCA)15 Create a decision tree to help in the selection of results
visualization techniques for engineers16 Identify results visualization techniques that work for
executives and/or policy makers (May need to consider compression and loss of information)
17 Create a decision tree to help in the selection of results visualization techniques for executives and/or policy makers
18 Identify results visualization techniques that work for consumers (consumer needs to be able to relate)
19 Create a decision tree to help in the selection of results visualization techniques for consumers
Solutions known, being optimized
Solutions available which may work
No known solutions
We expect to have a verification/road testing period after each milestone.
Cross cutting issues:The following issues are expected to be addressed in other sections of the Roadmap but are important for supporting decision makers:
LCA Capability Roadmap Item “Supporting Decision Makers with LCA” Page 6
Draft for public comment November 12, 2014
Identifying and understanding uncertainty Weighting in different regions of the world Weighting of present versus future Volatility in weighting (short-term responses to current events, long-term evolutionary trends) Harmonization of Impact Assessment Framework Calculating confidence of difference in performance
References and Bibliography:BASF, (2014). 'Eco-Efficiency Analysis',available at: http://www.basf.com/group/corporate/en/sustainability/eco-efficiency-analysis/eco-efficiency-analysis
Helias A. Udo de Haes, Olivier Jolliet, G. F. M. H. W. K. R. M.-W. (1999), 'Best available practice regarding impact categories and category indicators in life cycle impact assessment', The International Journal of Life Cycle Assessment 4(3), 167-174.
Huijbregts, M. (1998), 'Part II: Dealing with parameter uncertainty and uncertainty due to choices in life cycle assessment', The International Journal of Life Cycle Assessment 3(6), 343-351.
ISO 14040, (2006), 'Environmental management - life cycle assessment - principles and framework'.
Koffler, C. (2013), 'An Obituary for Bar Charts, Cross-Category Visualization & Interpretation Tools to Handle the Increasing Complexity in LCA Results', PE INTERNATIONAL, http://lcacenter.org/lcaxiii/final-presentations/798.pdf
Norris G.A., (2001). 'The requirement for congruence in normalization', Int J Life Cycle Ass 6:85–88.
PRé Consulting. 'Example of a network diagram derived with the software SimaPro', available at: http://www.pre-sustainability.com/five-crucial-lca-features-in-simapro
Prado V, Rogers K, Seager TP, (2012), I'ntegration of MCDA tools in valuation of comparative life cycle assessment', In: Curran MA, editors. Life cycle assessment handbook. Salem (MA): Scrivener Publishing. p 413–431.
Tufte, (2014). 'Example of a map depicting several kind of information in one diagram Napoleon's March', available at: http://www.edwardtufte.com/tufte/posters
US Energy Efficiency & Renewable Energy office. 'Example of Sankey diagram: Energy flow in U.S. Manufacturing', available at: http://energy.gov/eere/amo/sankey-diagram-energy-flow-us-manufacturing
Weidema, B. P. (2014), 'Comparing Three Life Cycle Impact Assessment Methods from an Endpoint Perspective', Journal of Industrial Ecology, n/a--n/a.
LCA Capability Roadmap Item “Supporting Decision Makers with LCA” Page 7
Draft for public comment November 12, 2014
Appendix A: Non-exhaustive overview on existing normalization methodsThe following are some normalization methods that have been considered for use with LCA:
External normalization to some reference material or process o Benefits: Accessible approach for regions with no normalization data bases. May be
better understood by some decision makers. o Drawbacks: Results are subject to the performance (good and bad) of the reference
process. Also, it can be difficult to obtain reference data. External normalization to the total or per capita regional emissions/extractions.
o Benefits: Useful in hotspot identification for guiding improvement assessment.o Drawbacks: Data availability and uncertainty. Results are subject to the performance of
the area (good and bad) of the reference region (Prado et al. 2012). Internal normalization to the highest impacting alternative
o Benefits: This type of internal normalization is widely used to produce bar charts in comparative assessments for a quick inspection.
o Drawbacks: While these do evaluate mutual differences directly, they fail to incorporate uncertainty data so they can be misleading when identifying tradeoffs. Bar charts (and radar plots) suffer from magnitude insensitivity because figures remain the same whether differences are in mg, g or tonnes (Norris, G.A., 2001). Also the normalization is dependent upon the case studies which are being used for comparison. Changing the case studies can change the ranking, which may not reflect the expectations and desires of the decision makers.
Internal normalization via outranking (Outranking normalization is based on pair wise comparisons and used for comparative assessments exclusively)
o Benefits: The benefit of outranking is that it focuses the analysis on the tradeoffs between alternatives to help find the best compromise. Outranking avoids linear aggregation algorithms that allow for improvements in one aspect to make up for degradation in others (burden shifting) – otherwise known as compensation in decision analysis. Outranking algorithms also avoid magnitude insensitive issues of internal normalization methods by division.
o Drawbacks: Outranking algorithm requires preference and indifference thresholds (value choices). Existing application of outranking to LCA uses uncertainty in the data to generate the thresholds. However, the effect of thresholds is an area that requires further study in LCA. Also outranking is dependent upon the case studies which are being used for comparison. Changing the case studies can change the ranking, which may not reflect the expectations and desires of the decision makers.
LCA Capability Roadmap Item “Supporting Decision Makers with LCA” Page 8
Draft for public comment November 12, 2014
Appendix B: Non-exhaustive overview on existing MCDA methodsThe following are some MCDA methods that have been considered for use with LCA:
Simple Additive Weighting (SAW)Weight elicitation via surveys; weighted sum of normalized indicator results (single score)
o Benefits: simple, transparent, allows the use of generic weighting sets o Drawbacks: least sophisticated Multi-Attribute Decision Making (MADM) method
Additive Weighting with Voting Rules Uses voting rules to construct ranking of alternatives using 'better' or 'equal' statements based on majorities in group decision situations
o Benefits: Optimizes decision towards eligibility for compromise in group decision contexts (e.g., panels)
o Drawbacks: Drawbacks: complex algorithm, needs software support, decision depends on individuals' observed or expressed preferences, which need to be established first
Utility Value Analysis (UVA): similar to SAWUses utility functions to project attribute values onto an ordinal scale
o Benefits: can handle non-linear relationships between impacts and utility values o Drawbacks: does not add value in LCA (less is better for all impacts)
Multi-Attribute Utility Theory (MAUT): Similar to SAW, but using utility functions to convert attribute values to cardinal utility values
o Benefits: strong theoretical foundation, sophisticated process, can handle non-linear relationships between impacts and utility values
o Drawbacks: complex, time-consuming definition of utility functions, does not allow use of generic weightings
Monetization: Similar to SAW, but using Willingness-to-pay or Willingness-to-accept to convert impacts to monetary unit
o Benefits: convert impacts to easily understood unit ($), and therefore, can be compared to other costs (present and future)
o Drawbacks: converting preferences introduces additional uncertainty; however, the uncertainty introduced is not necessarily more than that from other weighting methods such as human health “disability weights” used to derive DALY (disability adjusted life years). Because the units are economic, they can be interpreted as having greater certainty than scoring.
Analytical Hierarchy Process (AHP): Similar to SAW; uses pairwise comparisons of impact categories to establish weights
o Benefits: weight two impacts at a time o Drawbacks: n*(n-1)/2 pairwise comparisons necessary, frequent inconsistencies
LCA Capability Roadmap Item “Supporting Decision Makers with LCA” Page 9
Draft for public comment November 12, 2014
Technique for Order Preference by Similarity to Ideal Solution (TOPSIS): Weight elicitation via surveys; calculates the Euclidean distance of alternatives to a hypothetical optimal solution using weighted indicator results
o Benefits: logical o Drawbacks: Still dependent upon stakeholder elicitation which is a drawback of all of the
above techniques. More complex mathematics involved. Stochastic Multiattribute Analysis (SMAA)
Similar to SAW, but assumes all weight sets are possible and provides a probability that a stakeholder will prefer a specific alternative
o Benefits: inclusive of all possible weightings and value choiceso Drawbacks: requires uncertainty analysis on weights, may include weightings not held
by stakeholders Sustainability Return on Investment (S-ROI)
Similar to monetization but uses stakeholders’ monetization (including the ability to apply a distribution to the cost) on a stakeholder by stakeholder basis
o Benefits: converts impacts to easily understood units, considers effects on multiple stakeholders, easy to add other impact indicators, such as societal impacts
o Drawbacks: requires stakeholder engagement for each representative project
LCA Capability Roadmap Item “Supporting Decision Makers with LCA” Page 10
Draft for public comment November 12, 2014
Appendix C: Non-exhaustive overview on existing results visualization techniques
BASF Ecoefficiency metric“Eco-efficiency analysis looks at environmental impact in proportion to a product's cost-effectiveness. It helps BASF, BASF’s customers, and customers’ customers to decide which products are the best choice both ecologically and economically. Eco-efficiency analysis can also be used to identify ways to make improvements in terms of environmental impact and cost.” (BASF,2014)
Environmental impacts are described based on seven categories. The total environmental impact of a product or process is derived. Also various costs incurred in manufacturing or using a product are included in the calculation. The economic analysis and the overall environmental impact are used to make eco-efficiency comparisons.
In the following Figure C1 the economic and ecological data are plotted on an x/y graph. The costs are shown on the horizontal axis and the environmental impact is shown on the vertical axis. The graph reveals the eco-efficiency of a product or process compared to other products or processes.
Figure C1: Example of a comparison of different alternatives according to the eco-efficiency (BASF,2014).
Network diagramsA “Network diagram” can be for example, a graphical representation of a model.
LCA Capability Roadmap Item “Supporting Decision Makers with LCA” Page 11
Draft for public comment November 12, 2014
Figure C2: Example of a network diagram derived with the software SimaPro (PRé Consulting , 2014).
Sankey diagramsSankey diagrams are a specific type of flow diagram, in which the width of the arrows is shown proportionally to the flow quantity. They are typically used to visualize energy or material or cost transfers between processes.
In the following Figure C3 an example of a Sankey diagram representing the Energy flow in U.S. Manufacturing is shown.
Figure C3: Example of Sankey diagram: Energy flow in U.S. Manufacturing. (US Energy Efficiency & Renewable Energy office, 2010).
TreemapsTreemaps display hierarchical (tree-structured) data as a set of nested rectangles. Each branch of the tree is given a rectangle, which is then tiled with smaller rectangles representing sub-branches.
LCA Capability Roadmap Item “Supporting Decision Makers with LCA” Page 12
Draft for public comment November 12, 2014
In the following Figure C4 an example of a Treemap displaying an “Endpoint (ReCiPe H) Contribution Analysis” is shown.
Figure C4: Example of a Treemap:”Exemplary Endpoint (ReCiPe H) Contribution Analysis”,(Koffler,C., 2013).
Tufte Tufte's writing is important in such fields as information design and visual literacy, which deal with the visual communication of information. He coined the word “chartjunk” to refer to useless, non-informative, or information-obscuring elements of quantitative information displays (Tufte,2014).
Figure C5: Example of a map depicting several kind of information in one diagram “Napoleon's March”*
*A map by Charles Joseph Minard portrays the losses suffered by Napoleon's army in the Russian campaign of 1812. Beginning at the Polish-Russian border, the thick band shows the size of the army at each position. The path of Napoleon's retreat from Moscow in the bitterly cold winter is depicted by the dark lower band, which is tied to temperature and time scales (Tufte 2014).
LCA Capability Roadmap Item “Supporting Decision Makers with LCA” Page 13
Draft for public comment November 12, 2014
Dynamic visualization of resultsDynamic visualization of results can be done for example, during a presentation by showing a series of slides or by showing a video clip of, e.g. the spatial resolution of changing NOx emissions during a day within a certain country, etc.
LCA Capability Roadmap Item “Supporting Decision Makers with LCA” Page 14