rob winters - travelbird
TRANSCRIPT

Building a Personalised Offering
8 November 2016

2
800k emails sent to NL recipients (2,6M across
EU)
Every person in each market gets the same 6
offers
Goal: 100% personalisation
TravelBird: Six daily dealsBuilding a real personalised offer

3We had three personalisation goals
Deliver what would someone be interested in
Ensure the right amount of diversity and “freshness”
Send the selection at the most relevant time
Building a real personalised offer

So we built a personalisation platform!Building a real personalised offer

5TravelBird’s indicators of interest
Pageviews
Email opens
Sales flow interactions
Favorites
Searches
Image clicks
….
Customer Interactions
>500M events over 2,5 years (but now >15M/day!)
Other Attributes
Similar customers
Time since last activity
User seasonal preferences
“Normal” behaviour
All of this is used to create a score per customer per offer interaction
Building a real personalised offer

6Fed into collaborative filtering (like Netflix)
Based on all customers and all products ever, rank online* offers from best to worst for each recipient
Building a real personalised offer

7Problem: Offers will be quite similar
Denmark
Germany
Long-haul trips:
(Cuba, Nepal, USA, Iceland,
Morocco)
Building a real personalised offer

8So customers will get thisBuilding a real personalised offer
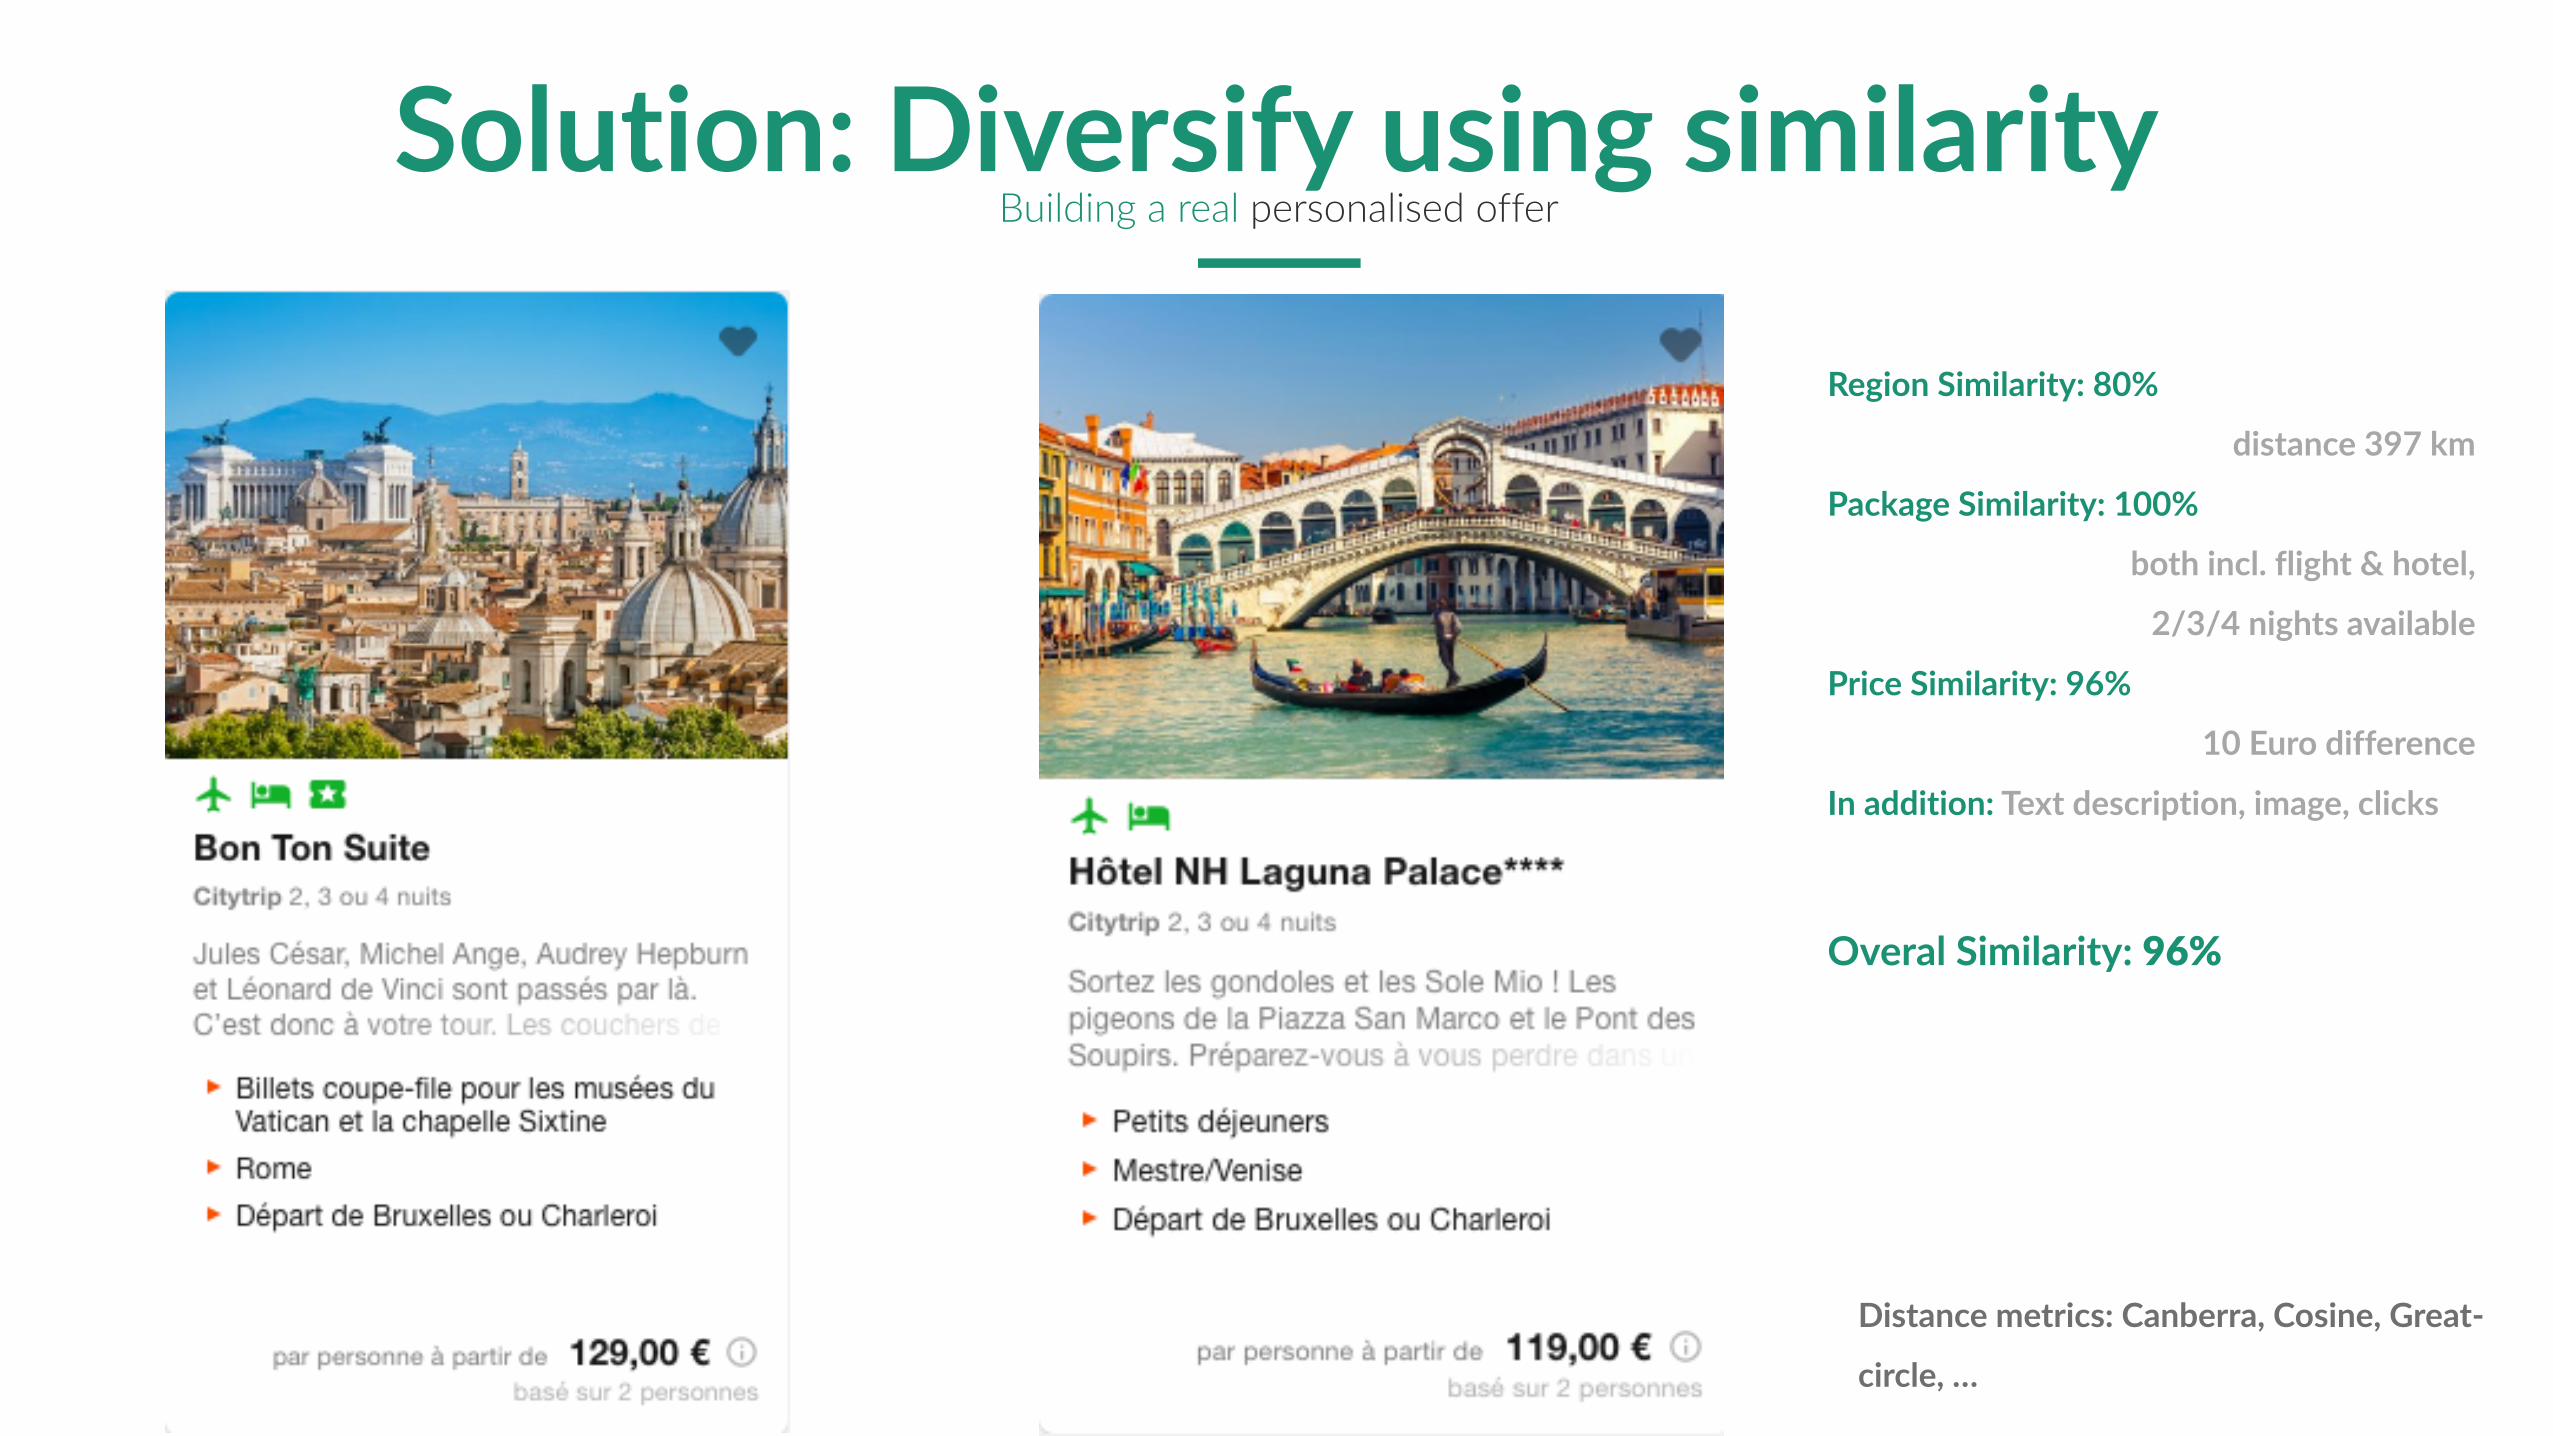
Region Similarity: 80%
distance 397 km
Package Similarity: 100%
both incl. flight & hotel,
2/3/4 nights available
Price Similarity: 96%
10 Euro difference
In addition: Text description, image, clicks
Overal Similarity: 96%
Solution: Diversify using similarity
Distance metrics: Canberra, Cosine, Great-
circle, …
Building a real personalised offer
10
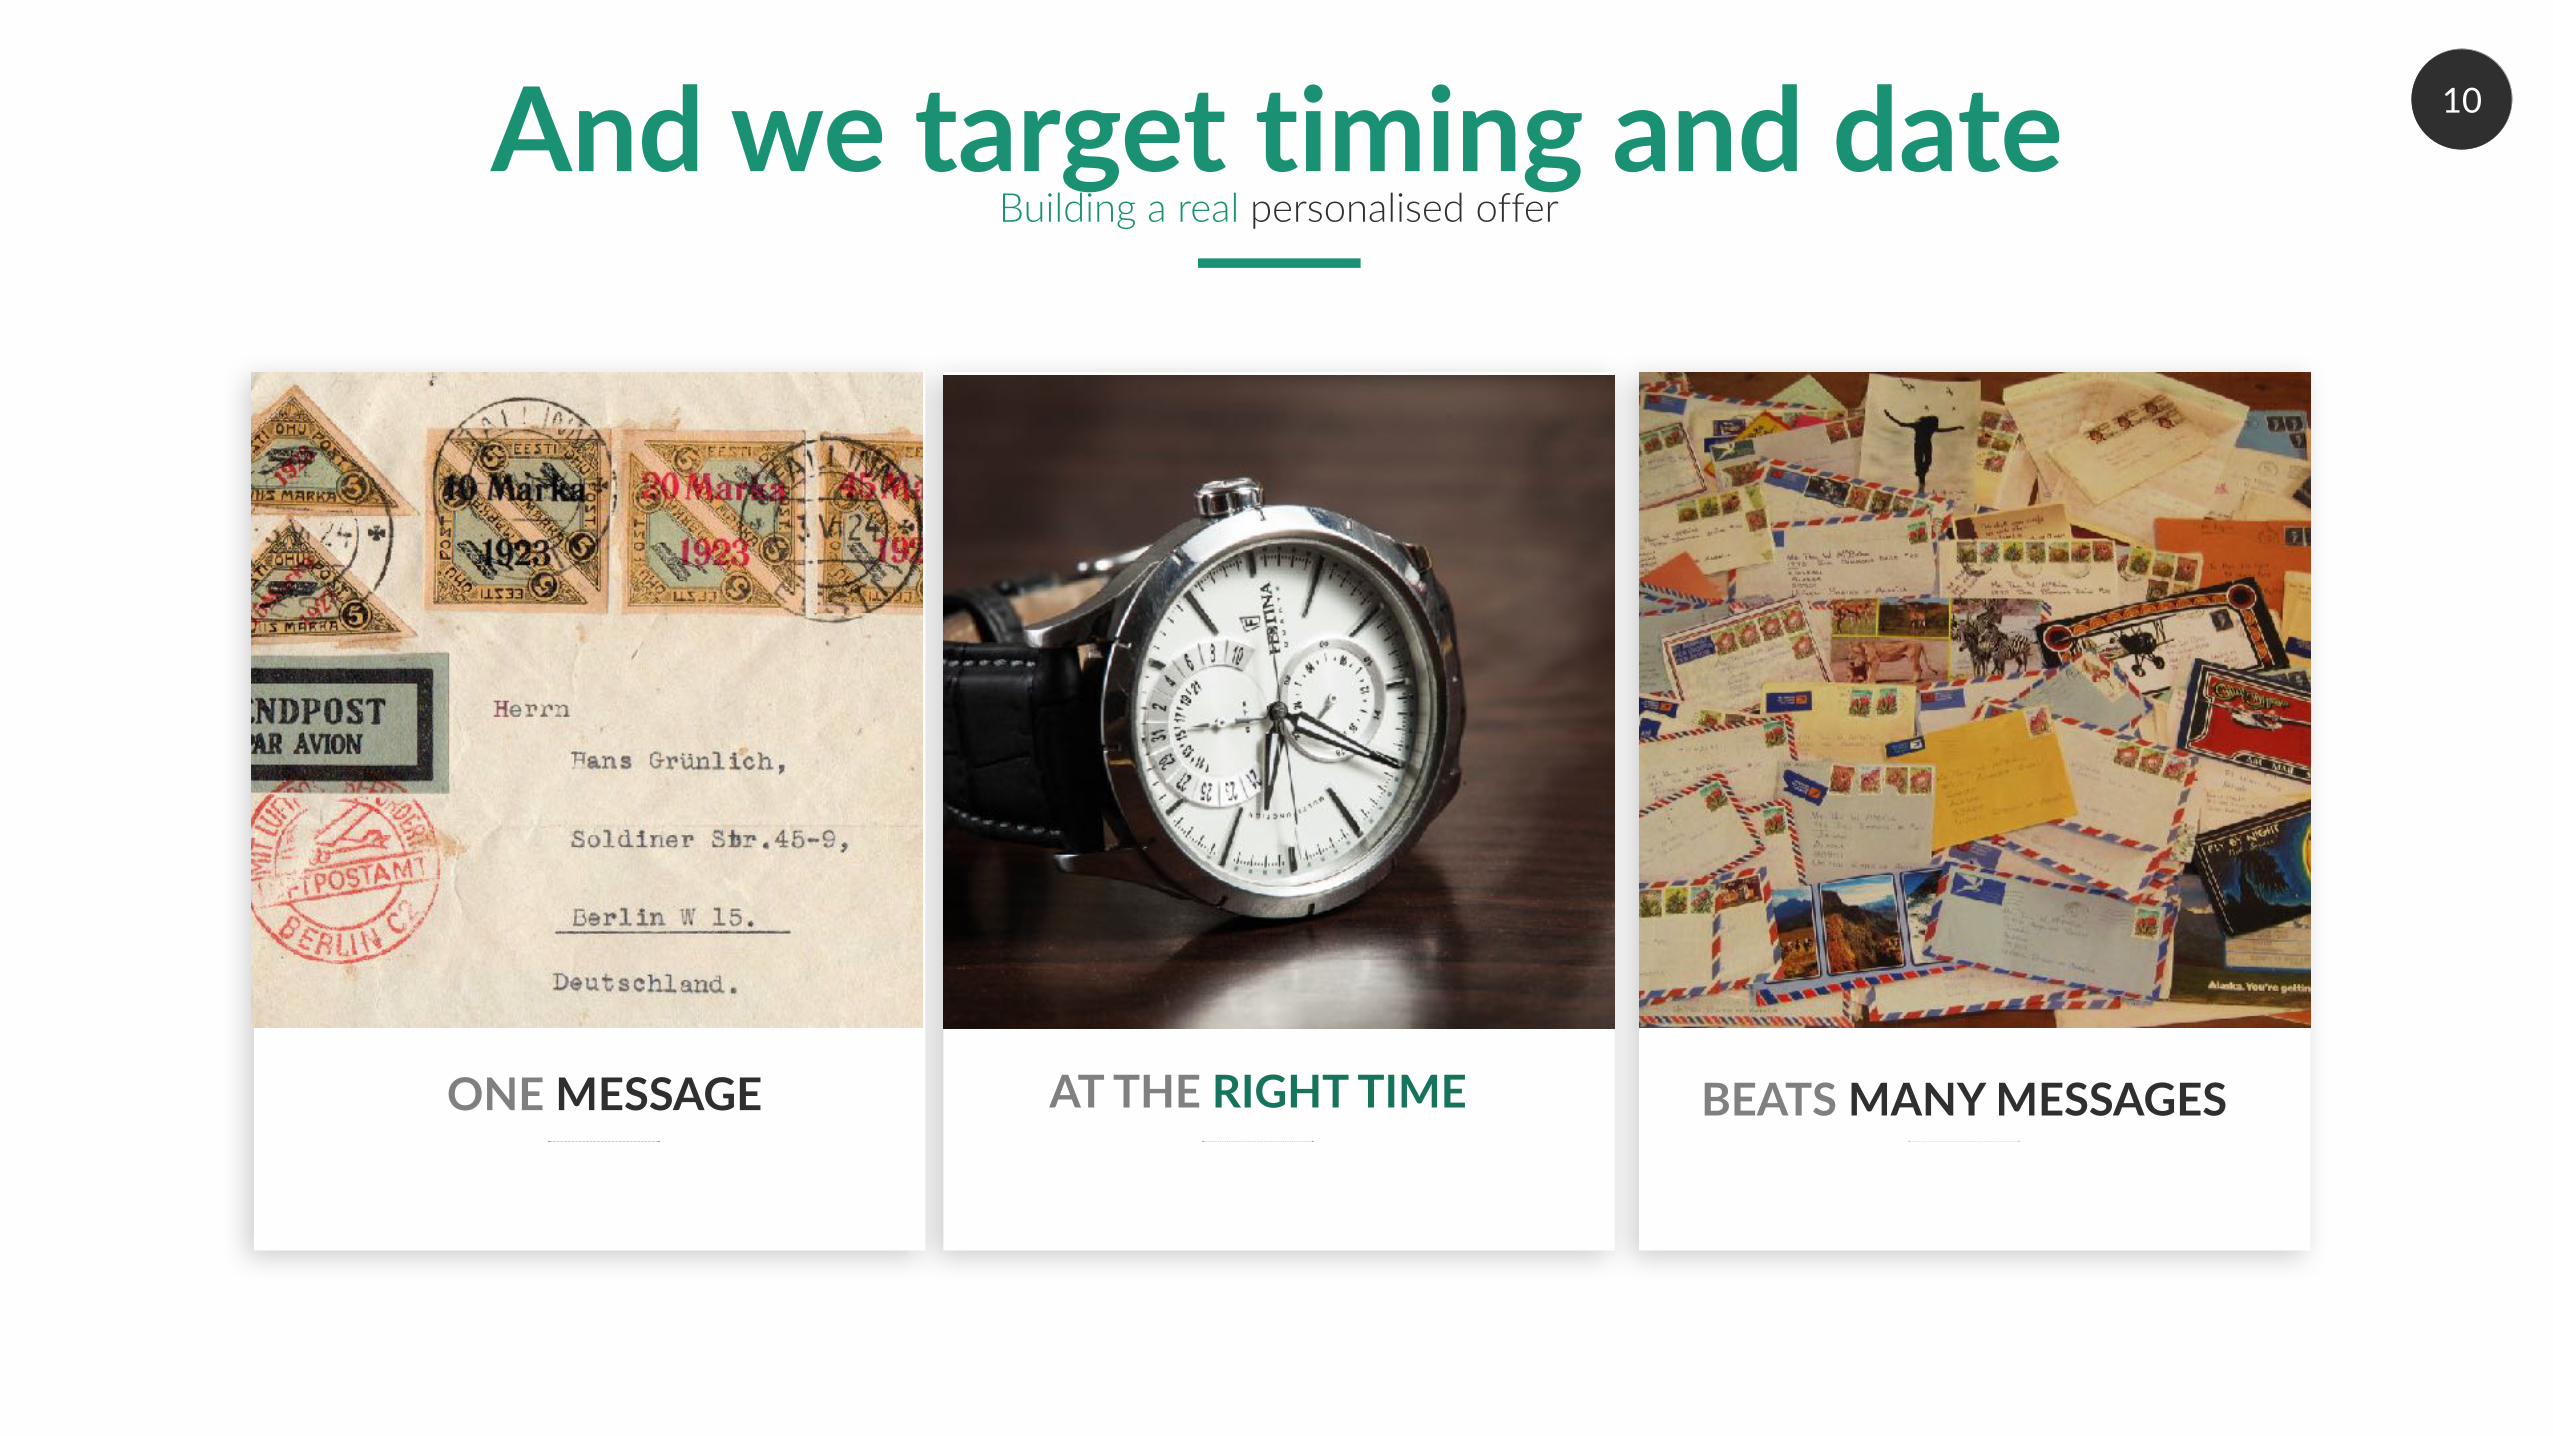
ONE MESSAGE AT THE RIGHT TIME BEATS MANY MESSAGES
And we target timing and dateBuilding a real personalised offer

11In the end: What we builtBuilding a real personalised offer
EventsMonitoring every platform for
user interaction, each day’s events are fed back into our databases for inclusion in the
next day’s selections
ModelsIn Apache Spark we use a variety
of models to come up with scores for product recommendations
DiversificationThese scores are the enriched with weather, seasonality, and
other data to build an optimised planning calendar for each
recipient
CommunicationCommunication is automatically
scheduled to deliver this optimised content at the right time and frequency for each
customer
12
Building a real personalised offer
Next, unlock value with continuous improvement

13
Ops MeetingsWeekly sessions are held with all country teams to
identify opportunities
Model AnalyticsConversion results are
analysed to identify which customer groups under/overperform the
average.
Business AnalyticsOverall company trends are assessed to identify which macro activities are not captured in the
model.
External ResearchBlogs, white papers, etc are explored to identify
potential tests
Surfacing opportunitiesBuilding a real personalised offer

14
Additional market chosen and
original scaled to 50%
Roll out to all markets
Test market chosen and 25% tested
Test and micro conversion
defined
Our testing cycleBuilding a real personalised offer
Result: More than ten tests and 50 code releases completed per week

15
Ops-driven developmentRelease notes are publicly available, suggestions are continuously captured via Slack and email, the suggestions log is adjusted weekly with two groups: -Product planners: operational improvements -Regional managers: overall program direction
Assigned partnersIn each country team, operational partners are assigned from each team to conduct business analytics, audit the product portfolio, and coordinate learnings within their discipline
Company presentationsChanges in personalisation and impacts are shared each month in a company-wide presentation and weekly with company leadership
Maintaining alignmentBuilding a real personalised offer

0
13
25
38
50
Open Rate CTOR Conversion Profit
ControlTest Marketing Definition
Lorem ipsum dolor sit amet, consectetur adipiscing elit. Aliquam tincidunt ante nec sem congue convallis. Pellentesque vel
Open RatesOpen rates increased 8% due to more relevant products in the subjectt line, improving deliverability
Profit per SendAs a result of the higher conversion and better targeting of high profit products, profit more than doubled per send
Click Through from Open RateCTOR increased 30-50% per market, driving a 60% growth in email traffic
Conversion from SendAs a result of the significant traffic increase and higher interest level to products, conversion from send doubled
Our ResultsBuilding a real personalised offer
Performance improvements were observed in all metrics relative to the status quo due to the effect of personalization, with the highest gains coming in engagement. Unsubscription rates dropped >25% in the test group.
