robert brian anderson. a collocation study of pm-10 and …
TRANSCRIPT

ABSTRACT
ROBERT BRIAN ANDERSON. A Collocation Study of PM-10
and PM-2.5 Inertial Impactors for Indoor Aerosol Exposure
Assessment. (Under the direction of Mr. Richard M. Kamens)
Two different designs of PM-10 and PM-2.5 micron
aerodynamic cut size impaction inlets have been developed
for the characterization of human exposure to inhalable
particulate matter in the indoor environment. The present
research provides initial characterization for the free¬
standing Micro-Environmental Monitor (MEM) and the shirt
collar-mounted Personal Exposure Monitor (PEM). Triplicatesof the PM-10 and PM-2.5 MEM and PEM inlets were collocated
with three Andersen dichotomous samplers and exposed to a
homogeneous aerosol of fine AC Test Dust. Results indicated
that the PM-2.5 and PM-10 MEM and the PM-2.5 PEM samplers
compared well to the dichotomous sampler averaging 6.4%,
7.5% and 5.2% greater mass concentrations respectively. The
PM-10 PEM, however, consistently over sampled averaging
greater than 30% higher mass concentrations relative to the
dichotomous sampler.

ACKNOWLEDGEMENT
I would like to thank Mr. Richard M. Kamens, Dr.
Russell W. Wiener and Mr. Charles E. Rodes for their
guidance and encouragement toward the completion of this
technical report. I am also grateful to Dr. Morris A. .
Shiffman for serving on my research committee.
I wish to thank Dr. Bob Bagnell and the staff of the
Scanning Electron Microscope Laboratory, University of North
Carolina at Chapel Hill, School of Medicine, Pathology
Department. I also thank Ms. Vonda Parker of Belk-Leggett
Inc. for the loan of the manikins used in this research.
The equipment and expertise provided by the staff of the
U.S. Environmental Protection Agency, Atmospheric Research
and Exposure Assessment Laboratory, Equipment and
Calibration Laboratories were invaluable.
I especially appreciate my wife Virginie for her
patience and encouragement.
Finally I wish to thank the Air and Industrial Hygiene
Program in cooperation with the U.S. Environmental
Protection Agency, Grant No. 5-35378-2311, who supported
this project and made possible my education at Environmental
Sciences and Engineering.

11
TABLE OP CONTENTS
ABSTRACT
ACKNOWLEDGEMENT i
LIST OF TABLES V
LIST OF FIGURES vi
DEFINITION OF TERMS vii
INTRODUCTION 1
LITERATURE REVIEW 3
APPROACH 20
General 2 0
Uniformity Experiments 21
Collocation Experiments 23
EQUIPMENT 27
Chamber and Associated Equipment 27
Particle Injection System 28
Test Aerosol 35
Air Sampling, and Metering Systems 36
Vacuum Manifold System 3 6
Calibration Equipment 38
Sampling Devices 39
Andersen Cascade Impactor 39
Micro-Environmental Monitor 41
Personal Exposure Monitor 45
Dichotomous Sampler 47
PCD-1 52
37mm Open-Face Filter Cassette 53
Gravimetric Collection Media 53

TABLE OF CONTENTS (continued)
ill
Teflon Filters 53
Pallflex Filters 53
Cellulose Acetate Ester Filters 53
Cascade Impactor Foil Substrates 54
E.P.A. Weighing Chamber 54
Weighing Chamber 54
Balance Tools 54
Scanning Electron Microscope 55
Miscellaneous 56
DESCRIPTION OF EXPERIMENTS 58
General 58
Uniformity Experiments 58
Collocation Experiments 62
RESULTS AND DISCUSSION 65
Characterization of Fine A.C. Test Dust 65
Uniformity Experiments 68
Collocation Experiments 73
Shirt-form PEM and MEM Samplers
versus Dichotomous Samplers 73
Free-standing PEM
versus Shirt-form PEM Samplers 81
PEM Samplers on People versus
Shirt-form PEM Samplers 83
Correlation Between Like Samplers 85

TABLE OF CONTENTS (continued)
XV
SUMMARY, CONCLUSIONS AND RECOMMENDATIONS
Summary
Conclusions
Recommendations
REFERENCES
APPENDICES
Appendix A
Appendix B
Appendix C
Appendix D
89
89
96
98
100
A-1
A-1
B-1
C-1
D-1

LIST OF TABLES
1. Specifications for the Dichotomous Sampler 512. Particle Size Distribution Issued with
Fine A.C.Test Dust 65
3. Particle Size Distribution of Fine
A.C. Test Dust as Determined by Sedigraph 664. Uniformity Experiments, Filter Cassettes 695. Uniformity Experiments, Cascade Impactors 706. Collocation Experiments, PM-2.5 Samplers 747. Collocation Experiments, PM-10 Samplers 758. Correllation between like PM-2.5 samplers 869. Correllation between like PM-10 samplers 87

VI
LIST OF FIGURES
1. Turntable Dust Feeder/Injection System 302. Venturi Injector Pickup 323. Venturi Injector 344. Cascade Impactor 405. MEM Nozzle Plate 42
6. MEM Base and Impaction Plate 437. MEM Cover 44
8. PEM Base 46
9. PEM Cap 4710. PEM Impaction Plate 4811. PEM Impaction Plate Ring 4912. Test Chamber Floor Layout 5913. Sampler Placement, Uniformity Experiments 6114. Sampler Placement, Collocation Experiments 6315. Particle Size Distribution Plot 72
16a. Shirt-form PM-2.5 PEM vs Dichot 76
16b. PM-2.5 MEM vs Dichot 76
17a. Shirt-form PM-10 PEM vs Dichot 78
17b. PM-10 MEM vs Dichot 78

Vll
DEFINITION OF TERMS
, The following terms are defined briefly to aid the
reader and to avoid possible ambiguities:
Aerodynamic Diameter (Da) - Diameter of a particle-
having the same settling velocity as a spherical particle of
unit density (1.0 g/cm^^) . This value is not a direct
measurement of the particle but is based on aerodynamic
properties it exhibits (Hinds, 1982). Particle size
references in this report, unless otherwise stated,
represent aerodynamic diameters.
AMMD (Aerodynamic Mass Median Diameter) - Value
representing the 50% point in the distribution of
aerodynamically separated particle sizes (Reist, 1984).
G.M. (Geometric Mean) - The geometric mean diameter is
equal to the 50% cumulative mass value taken from log
probability data plots. This value defines AMMD if the
particle size is distributed log-normally. This value is
mathematically represented by
log(d ) = [(Sum)nj_ logdj^/(sum) n^^where
log(d ) = geometric mean diameter (Reist, 1984)

Vlll
G.S.D. (Geometric Standard Deviation) - For log-normally distributed particle sizes,the value represented bythe ratio of the 84 percentile to the 16 percentile. Thisvalue is mathematically represented by
log(sigmag) = [(Sum)ni (logdg-logdi) 2/(sum) (nj^)-1] V2where
log(sigma„) = geometric standard deviation(Reist, 1984)
PM-10 (Particle Mass lOum) - The measured particle massconcentration of those particles less than lOum inaerodynamic diameter.
PM-2.5 (Particle Mass 2.Sum) - The measured particlemass concentration of those particles less than 2.5um inaerodynamic diameter.
C.V. (Coefficient of Variation) - This is a statisticalterm. It is defined as:
C.V.= Standard Deviation/Mean
This equation results in a decimal value. In thispaper the decimal value was multiplied by 100 and expressedas a percentage.

INTRODUCTION
Two different designs of PM-10 and PM-2.5 micronaerodynamic cut size impaction inlets have been developed byDr. Virgil Marple of the University of Minnesota through theMSP Corporation for the characterization of human exposureto inhalable particulate matter in the indoor environment.The new inlets were developed in response to the needs ofthe United States Environmental Protection Agency (U.S. EPA)Particle - Total Exposure Assessment Methodology (P-TEAM)program. This program seeks to develop a frequencydistribution of human exposure to inhalable particulate.The present research provided initial characterization forthe shirt collar-mounted Personal Exposure Monitor (PEM) andthe free-standing Micro-Environmental Monitor (MEM). Adetailed description of the PEM and MEM is available in theEquipment section.
This study evaluated the new inlets against wellcharacterized referee samplers utilizing a challenge aerosolin a well mixed test chamber. Two distinct experiments wereconducted to meet this goal. The first characterized theparticle mass distribution and particle size distribution ofthe generated aerosol reaching the test zone of the chamberwhere the new inlets will be tested. The second experimentcompared triplicate PM-10 and PM-2.5 mass concentrationsmeasured with PEM inlets mounted on shirt-form manikins andfree-standing MEM inlets with three Andersen dichotomous

samplers (dichots) used as referee samplers. A detaileddescription of the dichot is available in the Equipmentsection. The differences in PM-10 and PM-2.5 were alsoassessed for PEM devices positioned on a person versus PEMsplaced in a free-standing orientation as area samplers.
The collocation experiments provided non-wind-tunnelinformation describing PM-10 and PM-2.5 as measured by thenew inlets in relation to PM-10 and PM-2.5 as measured bythe dichot under high loading of relatively coarse aerosols.This research resulted in regression equations describingsampling differences between the dichot and the MEM and PEMsamplers. This data may be utilized by P-TEAM fieldinvestigators to directly compare data collected using thedichot outdoors and the MEM and PEM inlets indoors. IndoorPEM and MEM data would be far less expensive to obtain andless intrusive upon household inhabitants than datacollected with the dichot sampler. Industrial hygienestandards and guidelines are beginning to quantify potentialhealth risks of airborne particulate as a function of themass concentration below a given size range (A.C.G.I.H.,1988-89). The data gathered in this study may impact on thefuture acceptability of the use of PEM and MEM inlets inquantifying particulate hazards in the workplace.

LITERATURE REVIEW
There are numerous studies which highlight some
important factors which may influence the present research.
These studies address a number of research topics including
collocation studies, indoor and outdoor particle size
distributions, the use of manikins to simulate sampling on
humans and justification for the manner in which certain
instruments are used. In the next 4 pages the salient
information from the reviewed studies will be summarized and
this will be followed by a more detailed literature review
beginning on page 7. Inertial impaction theory is also
germane to this study. Selected works of Dr. Virgil Marple
were reviewed and are available in Appendix A.
Collocation experiments have been conducted by several
investigators (Kamens et al., 1988; Lioy et al., 1988;
Solomon, 1982; Camp et al., 1978) although only Camp et al.
(1978) attempted to determine the homogeneity of the test
aerosol. The work of Camp et al. (1978) also suggests that
the use of multiple samplers would increase the accuracy of
the data collected. Comparing data collected from referee
samplers to that computed from test samplers either directly
or by determining the ratio of concentrations is a recurring
theme (Kamens et al., 1988; Lioy et al., 1988; Solomon,
1982; Camp et al., 1978; Chung et al., 1987; Vincent, 1986;
and Wood and Birkett, 197 9). The investigations of Kamens
et al. (1988) and Lioy et al. (1988), both employed the

dichot as the referee sampler for comparison with PM-10 andPM-2.5 test samplers.
Investigators used different approaches to theplacement of samplers relative to each other. Beaulieu etal. (1980), reports on the work of Brief (1975), who notedthat large distances between collocated samplers in ambientair can significantly reduce their intercomparability.Thus, Beaulieu et al. (1980) chose to place samplers only2.4cm apart. Chung et al. (1987), placed samplers on thefront of a manikin for his wind tunnel studies within 7cm of
each other. Chung found that the effect of this spatialarrangement on the samplers was negligible. Camp et al.(1978) placed collocated samplers at distances of between 20and 140cm apart. Specific reasoning for the placement ofthe samplers was not available although Camp did suggestthat future collocation investigators take steps to ensurethat the exhaust of one sampler does not bias the air
sampled by any other sampler. Industrial ventilation designtheory maintains that the capture velocity at a distance of1 duct diameter from a plain duct opening is only about 10%of the duct face velocity (Committee on IndustrialVentilation, 1986). For the current research I assumed thatthe flow field at 5 duct diameters from the intake of anysampler to be negligible.
Indoor and outdoor aerosol particle size distributionswere determined by Lundgren and Paulus (197 5), and by El-Shobokshy and Hussein (1988). These investigators found

that the AMMD for either aerosol was between 0.03uin and
20um. Kamens et al. (1988) found that the vast majority ofaerosols found in the indoor environments of three non¬
smoking households were less than lOum in size.
Fairchild et al. (1981) measured particle mass
concentration using downward-facing, open-face 37mm filter
cassettes. He found that under wind conditions up to
200cm/s, the mass concentration of particles of up to 20um
in size could be measured within +/- 20% of the true
concentration. Beaulieu et al. (1980) suggested that
orientation of open-face filter cassettes may minimize
potential sampling errors due to deposition of particles by
sedimentation and variation in wind speed and direction.
Investigators including Chung et al. (1987) and Vincent
(1986), found that increased wind speeds did effect the
efficiency of the sampler units placed on manikins. Chung
also found that changes in orientation relative to wind
direction effected sampler efficiency. Several manikin
orientations relative to wind direction were used and the
results averaged to compensate for potential orientation
bias by Vincent (1987), and by Chung et al (1987). Chung et
al. (1987) used a honey comb mesh to smooth the flow
patterns and produce small scale turbulence in the
atmosphere approaching his sampling array. Wilson et al.
(1971) found that finely divided silica dust released into a
160ft^ chamber, mixed with rotating fans, remained airbornewith a half-life of several hours after the fans were turned

off. Baines and Peterson (1951) found that passing air
through 2 or more layers of uniform screens of low to
moderate solidity ratio (5 to 10) was effective in
eliminating large swirling effects from fans while
increasing small scale turbulence.
The work of Chung et al. (1987), Vincent (1986)
suggested that a bluff body effect may exist when sampling
devices are worn on a person. Tests using personal sampling
inlets on manikins were conducted in wind tunnels. But the
results of wind tunnel tests must be viewed guardedly
because wind tunnel conditions do not represent ambient wind
conditions. Investigators did find that lower air
velocities produced the least effect on personal samplers
(Chung et al., 1987). The work of Wood and Birkett (1979)
suggested that the effects of normal respiration and local
thermal currents were negligible.
Experiments in relatively calm air comparing collocated
PEM like devices to the dichot have been conducted by Kamens
et al. (1988) and by Lioy et al. (1988). However, neither
investigator measured to the homogeneity of the aerosol to
which the samplers were exposed nor were the relative
differences between PEM devices used as personal samplersversus PEMs used as area monitors assessed. Kamens et al.
(1988) sampled indoors and noted high potential error due to
low mass loadings of the samplers. Lioy et al. (1988)
indicated in their study that variations in filter weightswere most probably due to glass fiber filter material

sticking to the perforated screen. The authors suggested asimilar study be conducted comparing PEMs to the dichotusing Teflon filters to avoid the filter sticking problem.
Andersen Cascade Impactors were investigated byMitchell et al. (1988), and by McFarland and Rodes (1979).
Both investigators found that uncoated impaction surfacespromoted particle bounce. Moss and Kenoyer (1987) andMcFarland and Rodes (1979) suggested the use of oil basedcoatings to prevent particle bounce in impaction units.Turner and Herring (1987) tested several coatings and foundthat low viscosity oil placed on impaction surfaceseffectively reduces particle bounce. A detailed review ofthese studies follows:
Camp et al. (1978) evaluated 11 different outdoor
aerosol sampling designs in side-by-side tests. Thesamplers were placed in a line along the edge of the rooftop of the Federal Building in Charleston, West Virginia.Distances between samplers ranged from 20 to 14 0cm. Sixteentest runs, each of 12-hour duration, were conducted.Although wind direction and speed varied during the Camp etal. (1978) investigation, three automatic dichotomoussamplers placed in the middle and at either end of thesampling array to test for aerosol homogeneity did not showsignificant differences in dispersion of pollutants. Mostof the samplers separated the collected particulate intofine and coarse size fractions. The lower aerodynamic 50%cut size ranged from 2.4 to 4.3um. The upper 50%

8
aerodynamic cut size ranged from 14 to 30um. Differences in
the upper 50% aerodynamic cut size produced the largest
effect in the total mass of particulate collected. The
reported reason for this is because the mass of any particle
is directly related to the volume of that particle. The
volume of a particle, in turn, is related by a cube function
to the particle aerodynamic diameter. Thus differences in
aerodynamic cut sizes for larger particles have a greater
effect on the total mass collected than would be observed
for similar changes in aerodynamic cut sizes for smaller
particles.
The investigators made several recommendations for
future research. They recommended that the flow rates of
samplers be checked at least twice daily; that side-by-side
samplers be used both before and after the study to
determine possible non-homogeneity; that at least duplicate
samplers be used to represent a sampler type; and that steps
should be taken to ensure that the exhaust of one sampler
does not bias the air sampled by any other sampler.
Solomon (1982) conducted collocation experiments
comparing a standard high-volume sampler which measures
total suspended solids (TSP), a high-volume sampler fitted
with a size selective inlet (SSI) and a dichotomous virtual
impactor (DVI). Both the DVI and the SSI were designed to
have a upper limit aerodynamic cut size of 15um and sample
independent of wind speed. The TSP, SSI and DVI samplers
were compared by collocating them on a Tucson, Arizona roof

9
top and operating them every day for 6 months. Wind speedand total aerosol concentrations varied. The highestparticulate concentrations were reported on hot windy days.Regression analyses comparing the DVI and SSI units to theTSP unit were conducted independently. The TSP was used asa referee sampler. Although r^ values of 0.93 for bothanalysis strongly suggested the samplers were not effectedby wind speed and mass loading, the SSI and DVI did notcompare well to each other relative to the TSP sampler. TheDVI collected only about 75% of the particle mass of theSSI. The author concluded by suggesting that thediscrepancy was due to differences in the upper aerodynamiccut sizes on each sampler.
The PEM impactor inlets used in the present researchhave undergone several configuration changes since Dr.Virgil Marple produced the first models. One PEM typeproduced was called the Indoor Air Sampling Inlet (lASI).Lioy et al. (1988) conducted collocation experiments usingthe lASI inlets and the Andersen dichotomous sampler as areferee sampler. The experiments were carried out on ascreened porch at the home of one of the investigators.Glass fiber filters were used as collection media in the
lASI units. These filters were supported by a perforatedmetal screen. Investigators found that, although the lASIgenerally compared well to each other and to the dichot,variations in data points were most probably due to glassfiber filter material sticking to the perforated screen.

10
The authors suggested a similar study be conducted comparing
the indoor inlets to the dichot using Teflon filters to
avoid the filter sticking problem. The lASI units tested in
this study were placed in a free-standing orientation; thus
the probable effects of having a person wear the sampler was
not addressed. No ambient particle size distribution
information was provided and no specific tests for
homogeneity were conducted.
A preliminary study to characterize indoor particulate
matter in three single-residence homes was conducted by
Kamens et al. (1988). One purpose of the study was to
compare prototype versions of the PEM devices, utilizing
37mm Teflon filters, to the dichot sampler. Kamens et al.
(1988) found that 37% of the mass concentration of the
indoor particulate was less than 2.5um and 64% was less than
lOum in size. Vacuuming was found to be the most
significant large particle generating event. This probably
resulted from large scale air movements and physical
agitation involved. Cooking was found to promote the
production of small particles. Comparisons between the PM-
2.5 dichot and PEM samplers were in close agreement. In the
2.5um to lOum size range the PEM samplers exceeded the
concentrations measured by the dichots by 20% to 70%.
Homogeneity characterization of the test zone was not made
during the sampling period, but the close agreement between
the two dichot samplers placed 1.5m apart for both the
coarse and fine fraction suggested that the sampling zone

11
was reasonably homogeneous. The experiments were conducted
in the homes of non-smokers. This probably contributed to
low particulate mass loading on many of the filters. Low
mass loading increased overall potential error in
gravimetric determination relative to normal systematic
error.
Lundgren and Paulus (1975) utilized specialized cascade
impactors (Lundgren design) to measure outdoor aerosol
concentrations up to lOOum in aerodynamic diameter. Results
of the 16 test runs indicated that in the area sampled
outdoor aerosol tends to be bimodal in nature. The small
particle mass mode, due to condensation-type events, was in
the range of 0.03 to 5ura in size while the large particle
mass mode, due to dispersion events, was in the 5 to lOOum
size range. The AMMD in the large size mode appears to be
between 10 and 20um. Particles over lOum in size
contributed more to the total mass collected than did
smaller particles. The author concluded that the ability to
correctly measure PM-IO concentrations will rely heavily on
the ability to produce sharp cut size samplers which exclude
the collection of particles over lOum from reaching the
filters of PM-IO samplers.
El-Shobokshy and Hussein (1988) investigated indoor
particle size distributions compared to those found
outdoors. The experiments were conducted simultaneously
inside and outside at two faculty offices at King Saud
University, Riyadh, Saudi Arabia. The atmospheres sampled

12
were aerodynamically separated using three eight-stageAndersen cascade impactors. The resulting data was plottedon log-probability paper and the AMMD determined. Theoutdoor particle AMMD was 5um for both locations. Theindoor particulate AMMD was 2um and lum for air-conditionedand non-air-conditioned buildings respectively. Thedifference between the two indoor location was probably dueto the fact that the non-air-conditioned room was completelysealed providing a still environment in which particleslarger than lum could settle out while the air-conditionedroom added recirculated air to filtered outside air.
Wilson et al. (1971) utilized a eiOft^^ smog chamber tostudy photochemical smog generation. Their chamber was madeof polished aluminum with Teflon windows. The chambercontents were stirred with 12 inch fans rotating at 13 00rpm. While validating the design criteria for the chamberthe author briefly reviewed an experiment in which finelydivided silica dust (no particle size distributioninformation available) was dispersed in the chamber. Thedust attained a half-life of several hours after the chamber
mixing fans had been turned off.
Baines and Peterson (1951) studied the flow of airthrough screens. The authors concluded that large scaleturbulence can be enhanced by passing air through a singlelarge diameter bar screen. Conversely, they found that airpassing through 2 or more layers of uniform screens of lowto moderate solidity ratio (5 to 10), is the most effective
13
in eliminating variations in velocity distributions. This
information was utilized in the present research to design
the screened mixing fan covers used in the test chamber.
The effects of external airflow on personal sampling
was investigated by Wood and Birkett (1979). Their
experiment utilized a full scale human model connected to a
breathing machine to simulate average human respiratory
action. The model was placed in a wind tunnel at relatively
low flow rates (Im/s). A neutral buoyancy soap bubble
instrument was used to observe the flow field in the front
of the model during simulated respiration. The authors
concluded that the mounted samplers were not affected by
respiratory action and that local thermal currents were
likely to be negligible. This study may be a fair
representation of the probable effects of respiration on a
sampler placed on the torso of a person facing a Im/s flow
field but does not adequately address similar effects in
still air. More varied conditions would help to show the
effect of variable wind speeds on personal sampling inlets.
Vincent (1986) reviewed sampling tests conducted on
personal samplers with a design flow rates of 2.0Lpm. The
samplers had been widely used by industrial hygienists in
Britain. The samplers had three different face
configurations, (a) a single 4mm hole; (b) a 7 (4mm) hole;
(c) a single 15mm protruding hole (Vincent design); and a
25mm open-faced filter holder. The samplers were placed on
the clothed breast of a half manikin and tested with a fine

14
fibrous aerosol in a wind tunnel at relatively low wind
speeds. No preferred orientation was given to the manikinrelative to the wind direction. The particle mass sampled
by the four samplers was compared to the particle mass
sampled by a 25mm filter cassette placed in the mouth of the
manikin under simulated breathing. It was concluded that
all of the samplers compared well at low wind speeds of
0.5m/s. However, as wind speed increased the concentration
ratio of test inlets to the mouth mounted sampler decreased.
The single 4mm hole and the 7 (4mm) hole samplers exhibited
this effect to the greatest extent. The 25mm open-face
filter holder was somewhat effected while the single hole
15mm sampler was the least effected. This experiment showed
that both sampler design and wind speed effect sampler
performance.
Chung et al. (1987) mounted 12 different types of dust
samplers on a half-manikin. This study provided an in-depth
look at the effect of wind direction and speed on personal
dust samplers. The manikin was placed in a wind tunnel
1.22m wide and 1.83m high. Three wind speeds were
investigated, 0.6, 1.0 and 3.5m/s. Orientations of the
manikin included facing (0°), at right angle to (90°) andback-facing (180°) the incoming airflow. Silicon carbidetest dust (Sohio Electro-Minerals, UK.; 1:1 mixture of
grades F800/F1000) was dispersed forming an airborne cloud
with a mass median coulter diameter of 5.6um with a 6um
inner-quartile range. After traveling around a 180° bend

15
the aerosol passed through a grid of 22mm honey comb to
reduce large scale turbulence on its way to exposure area.
The turbulence intensity was about 8% with a scale of 5mm.
An interesting technique for analyzing sampler filters
was introduced by Chung and Griffiths (1983). The technique
involved the dissolution of a gelatin filter and averaging
three counts using a Coulter Counter model TA II.
Performance of each sampler was defined for specific
particle sizes as a collection ratio of dust particles
accumulated on a sampler's filter to that entering an
isokinetic probe. Adjustments were made to the particles
from the probe for those particles impinging on the wall of
the probe. Three replicate runs were made for each sampler
tested. During each run two duplicate samplers were placed
on the manikin as far from each other as possible but within
30cm Clft.) of the manikin's nose. Photographs of the
samplers attached to the manikin suggest that the samplers
are within 7cm of each other. Results indicated that the
effect of spatial placement of the samplers on the front of
the manikin was negligible. Although many samplers were
tested and the results varied, the review will be limited to
the MUK sampler which physically resembles the current PEM
inlet more than any of the other samplers tested. When
attached to the front of the manikin and facing the wind,
the MUK at low wind speeds under-sampled slightly (<10%) up
to 7um and fell to 2 0% at 12um. Below lOum the average was
below 10%. At moderate wind speeds efficiency rose from 10%

16
at 4um to +10% at 14um. At high wind speeds the MUK
consistently over-sampled but never in excess of 10%.
The MUK inlet was sampled at various flow rates facing
a 0.6m/s wind. Sampling at l.OLpm resulted in a 40 to 50%
reduction in efficiency. However, average efficiencies
within +/- 10% resulted from ?..o and 4. OLpm flow rates. The
MUK inlet was sampled at various flow rates facing a 3.5m/s
wind. Sampling at l.OLpm resulted in a 50% reduction in
efficiency at 4.0um, rose to 80% at 9um and declined with
increasing particle size. Flow rates of 2.OLpm consistently
increased efficiency an average of 10%. A 4.OLpm flow rate
resulted in consistent efficiencies of about 85% up to lOum
and increased steadily with increasing particle size.
A right angle placement of the MUK sampler resulted in
a general trend over all wind speeds. Efficiencies averaged
80% for particles less than Sum in diameter and fell to
around 50% for larger particulates.
Tests of the MUK sampler attached to the manikin in the
back-facing orientation resulted in efficiencies slightly
greater than unity (+/- 10%) for low to moderate wind speeds
and averaged +/- 10% below unity for high wind speeds.
The author concluded that when the directional results
were averaged for all orientations at any wind speed, the
MUK sampler performed the best in relationship to the
International Standardization Organization/American
Conference of Governmental Industrial Hygienists efficiency
curves for particle inspirability. This corresponds to a

17
sampling efficiency of about 80% for particles less than
lOum in size.
Research to compare the relative sampling efficiency of
standard 37mm filter cassettes when operated in both open
and closed-face configurations was conducted by Beaulieu et
al. (1980). Beaulieu reviewed the investigative work done
by Davies (1966 and 1968) , and by Breslin and Stein (1975).
Under the theory of either investigator it was expected that
the 4mm opening used with the closed face sampler would
probably produce a bias against large particles. The
experiment was designed to minimize documented sampling
errors. These included placement of the samplers to avoid
deposition of particles by sedimentation, variation in wind
speed and direction and geometric orientation of the
cassettes. Control of sampler flow rate was also
considered. Work by Brief (1975) was cited which indicated
that large distances between samplers can significantly
reduce the intercomparability of collocated samplers. For
this experiment Beaulieu et al. (1980) placed the samplers
only 2.4cm apart. Sampling was conducted by placing the
paired open and closed-face filter cassettes on the upper
torso of participating workers. Several occupational
environmental particulates were sampled. Most of the
sampling occurred in calm air. The filters of each sampler
were removed from the cassette, desiccated for 24 hours and
weighed on a microbalance. Open-face sampler data was
assumed to represent the workers true exposure. Statistical
18
analysis of the controls to the samplers indicated that the
only significant bias in the comparison between sampler
types was the inlet size. Results of the study indicated
that since large particles account for much of the weight in
a sample that differences in the particle mass concentration
between samplers was due to reduced efficiency in the
collection of particles larger than lOum using closed-face
filter cassettes.
Fairchild et al. (1981) conducted experiments
assessing 37mm filter cassettes under field flow conditions
of 2 and 5m/s. The author concluded that downward facing
open faced filter cassettes under wind conditions up to
200cm/s measure particles up to 20um within +/- 20% of the
true concentration. These results must be used guardedly
however. Wind conditions of this velocity are not normally
found under typical sampling conditions.
Mitchell et al. (1988) tested Andersen Mark II cascade
impactors with polymer latex particles. Significant
particle bounce and blow off was found to occur when using
uncoated impaction plates. McFarland and Rodes (1979) used
Fine A.C. Test Dust (A.C. Spark Plug Division, General
Motors Corp., Flint, MI), which is primarily a sand based
material, to test the Andersen cascade impactor. Smaller
AMMD resulted from the use of uncoated aluminium substrates
than with oil coated substrates. This was consistent with
problems associated with particle bounce. Moss and Kenoyer

19
(1987) recommend the use of one of many oily substances to
coat impaction surfaces.
Turner and Hering (1987) reviewed the work of others
describing advances in substances used to prevent particle
bounce from impaction surfaces. Special note was made of
the excessive bounce of particles originating in arid and
desert regions. The work of Reischl and John (1978) was
reviewed describing the ineffectiveness of grease coatings
used on impaction substrates under high particle loadings.
Incoming particles were found to bounce off those particles
already collected on the greased surface. Reischl and John
were also credited with presenting data describing an oil
saturated sintered metal imapaction surface. Low viscosity
mineral oil, held in the pores of the sintered metal
material, coated impacted particulate by capillary action.
The collection efficiency for such an impactor was found to
be almost 100% independent of particle loading.

20
APPROACH
General
This study was designed to compare samplers exposed to
a homogeneous aerosol in a well mixed test chamber. This
required that two types of experiments be conducted. First,
a characterization experiment to determine particle mass and
particle size distribution in and near a designated test
zone. Second, collocation experiments comparing the PM-10
and PM-2.5 concentrations attained using the new inlets in
several configurations against a referee sampler.
The 193.7m-^ University of North Carolina at Chapel Hill
smog chamber at the Pittsborro, NC provided a site well
suited for this study (Fox et al., 1975). The large
capacity chamber was equipped with mixing fans and can be
continually exhausted. Exhausting the chamber reduces the
build up of fine particulates which tend to remain airborne
for long periods (Wilson et al., 1971). Wind speed has been
found to influence the efficiency of some sampling devices
(Chung et al., 1987; Vincent, 1986). The chamber mixing
fans were modified by using adjustable fan enclosures to
reduce large scale air movement in the chamber while mixing
the chamber contents. Metal screening and wooden lattice
materials were chosen to enclose the tops of the fan
enclosures. Flow through screens of such material has been
shown to significantly reduce large scale swirl and increase

21
small scale turbulence (Baines and Peterson, 1957). The
modifications are described in detail in the Chamber and
Associated Equipment section of the Equipment chapter.
Aerosol, in the form of Fine A.C. Test Dust (A.C. Spark
Plug Division, General Motors Corporation, Flint, MI) was
continuously injected into the test chamber. Fine A.C. Test
Dust was chosen as the challenge aerosol because the
particle size distribution of this material more closely
approximates that encountered in indoor and outdoor
environments than other readily available materials. The
AMMD of the bulk material is 7.5um. However, cascade
impactor data indicate that the airborne AMMD of the
challenge aerosol reaching the samplers was roughly 3um.
SEM evaluation indicates that particles exceeding lOum do
reach the test zone. Investigators have found that indoor
and outdoor particulate AMMD range from 0.3 to Sum and 5 to
20um respectively (El-Shobokshy and Hussein, 1988; Lundgren
and Paulus, 1975). In light of these observations. Fine AC
Test Dust was a good representative aerosol for ambient
indoor particulate matter. The PCD-1 was used in both
experiments to sense relative particle loading in the
chamber. Information from the PCD-1 was used to adjust the
injection rate of the aerosol generator.

22
Uniformity Experiments
This research required that the particle mass and
particle size distribution in and near the test zone be
relatively homogeneous. As recommended by Camp et al.
(1978), experiments were conducted to establish uniformity
prior to conducting collocaton experiments. This was done
to insure that each sampler was exposed to equal aerosol
concentrations. The experimental test zone chosen within
the chamber was well down stream from the aerosol generation
and as far as practical from mixing fans. This allowed for
maximum aerosol mixing and minimized possible local fan
effects. The chamber and aerosol generator were operated in
exactly the same manner during the homogeneity and
collocation studies.
Standard open-face 37mm filter cassettes (Millipore
Corporation, Bedford, MA) and Andersen Mark II cascade
impactors (Andersen Instruments Inc., Atlanta, GA) were used
to assess particle mass and particle size distributions
respectively. The downward facing orientation for the 37mm
filter cassettes were chosen primarily to prevent sampling
error due to sedimentation of large particles outside the
range of interest for this study (Beaulieu, 1980). The
literature also suggests that 37mm open-face filter
cassettes in the downward facing orientation can measure
particulate less than 20um (+/-20%) in size at wind speeds
of 200cm/s at flow rates as low as l.SLpm and were the least
23
effected by variations in wind direction of any of thesamplers tested (Fairchild, 1981).
Andersen Mark II cascade impactors were chosen for the
study because they fractionate the particulate collectedinto size ranges of interest for the current research, havebeen well characterized (McFarland et al., 1979; Mitchell et
al., 1988) and were readily available. Cumulative masspercent data reduced from the cascade impactors providedparticle size distribution information. Cascade impactorswere maintained in an upright position so that the oiled
foil impaction substrates contained within each unit wouldnot contact other surfaces and be destroyed.
Collocation Experiments
The collocation study was designed to compare the PM-10and PM-2.5 concentrations between the dichot, MEM and PEM
samplers. The Andersen Dichotomous Sampler (dichot) was
chosen as a referee sampler because it has been used by the
U.S. EPA for several years for outdoor ambient PM-10 and PM-
2.5 measurements (Hinton et al., 1984) and was well
characterized (Loo et al., 1976). The dichot is a free¬
standing instrument. A detailed description of the dichot
is available in Sampling Devices section of the Equipment
Chapter. The MEM samplers are also designed to sample in a
free-standing orientation. Although the PEM devices aretypically placed on the front of a person's torso near thebreathing zone as a personal sampler, the PEM may also be

24
used as an area monitor in an unobstructed or spatially free
configuration. In the design of this research PEM devices
were placed on shirt-form manikins (Silvestri California
LTD, Los Angeles, CA) to simulate the placement of the
samplers on people. Additional comparative investigations
involving the placement of the PEM sampler in a "static" or
free-standing orientation and the placement of the PEM
sampler on human participants were also undertaken. Open-
face 37mm samplers and Cascade impactors oriented similarly
to those used in the homogeneity experiment provided
information on the relative particle mass and particle size
distribution.
Participants in the study were informed of the purpose
and design of the experiment. Participants were required to
read and sign a University of North Carolina at Chapel Hill
Human Participant Consent Form prior to taking part in the
experiment. An example of the consent form is available in
appendix D. To minimize human exposure to the test aerosol
participants and the investigator wore NIOSH approved half-
mask respirators. The respirators utilize a type "S" filter
cartridge which are approved for dusts and mists.
Wind speed in the current research was assessed
qualitatively using thin strips of tissue paper attached to
a metal rod. Tissue movement in the test zone area was not
observed. Thus wind speed was not considered to have
significantly effected sampler performance in the current
research.

25
Manikins were used in this study to investigate the
possible effects of PM-2.5 and PM-10 PEMs worn by a person.
Three approaches were taken. First, PEMs placed on
stationary shirt-form manikins were compared to the dichot.
Second, free-standing PEM devices were compared to shirt-
form PEMs. Third, PEMs worn by participants in the test
zone were compared to those on shirt-forms. The manikins in
the current study were headless and Tyvek shirts clothed
both the manikins and the persons on which PEMs were placed
to avoid possible bias due to clothing differences. No
corrections were made for human respiration or thermal
currents.
For the current research those samplers with the
largest flow rates were placed relatively far from other
samplers. Each of the samplers was placed at least 10 duct
diameters from the nearest other sampler. To avoid possible
biases due to potential dilution of the test atmosphere all
sampling devices were exhausted outside of the test chamber
and the entrance sealed during testing.
The test zone was divided into four test sections.
Three of the four sections form a triangle in which all of
the test samplers were placed except for those worn by
participants. Each section of the inclusive triangular
section represented roughly one third of the non-participant
test zone area. Each section of the triangle consisted of a
corner and two extending legs. The dichot occupied the
corner of each section. Paired MEM devices with or with out

26
a cascade impactor were placed 3 0cm apart along one of the
extending legs of the triangular test zone. An inward
facing manikin bearing paired PEM inlets placed 15cm apart
on the front of the torso was placed along the other leg.
To offset potential bias caused by directional placement of
the manikins, each manikin faced 120° from any other
manikin. Symmetry was maintained whenever possible. The
PCD-1 was placed in the center of the test zone.
Participants sat in small straight back wooden chairs. The
distance between participants was maintained at 0.5m.

27
EQUIPMENT
Chamber and Associated Equipment
The experiments were conducted at the outdoor aerosol
chamber facility (Fox et al., 1975) located eighteen miles
south of the University of North Carolina at Chapel Hill.
The aerosol chamber used was a wooden A-frame structure
lined with 5 mil clear Teflon film. The interior dimensions
of the chamber were 5.6m high, 5.2m wide and 11.8m long.
The side walls of the structure formed right angles to the
floor at a height of 0.6m. The volume of the chamber is
193.7m-^, with a surface to volume ratio of 1.25 m"-*-. The
chamber was operated so that its contents were exhausted at
a rate of approximately 552ft"^/hr (Kuhlman, 1974) . The
chamber was equipped with four, four-blade fans located 0.46
meter off the chamber floor. The aluminum fan blades
measured 25.4cm from center to tip and rotated at
approximately 1200rpm. The fan blades were supported and
driven by 2.54cm diameter steel shafts which penetrated the
chamber floor in an equal offset arrangement. Each shaft
was powered by a General Electric R@,.25 HP, 115 volt, 60
Hz, 2-phase electric motor. The motor transmitted power to
the shaft through a 1.12m by 1.27cm v-drive belt (Gates
Inc., Dayton, OH). The mixing fans had been modified for
this experiment to reduce variations in the velocity
distribution emanating from the fans and to quench the

28
swirling effects (Baines and Peterson, 1951) of the aerosol
injection system while effectively mixing the chamber
contents. Right angle iron frames measuring 50.8cm on each
side were placed on the floor over each fan. Two galvanized,
18 gauge sheet metal panels were fabricated to enclose the
sides of each angle iron frame. The first of the two 3 0.5cm
wide panels was riveted to the angle iron frame such that
the top edge of the panel was flush with the top of the
frame. A second 30.5cm panel enclosed the lower part of the
frame and overlapped the first panel. The bottom panel
could be adjusted up or down and secured with bolts to
regulate intake air access to the low pressure area of each
fan. This distance was set at 1.27cm. The top surface of
the fan enclosure was covered with metal screening material
(Baines and Peterson, 1951). Two layers of 0.16cm thick
wire screen with 1.27cm holes were placed, one on top of the
other, atop the fan enclosures and were permanently attached
with metal clips. A 0.64cm thick wooden lattice section
measuring 0.56m on a side were also placed on top of the fan
enclosures. The lattice, whose open sections measured 7.0cm
and closed sections measured 6.3cm, helped to increase
diffusion of the air stream exiting the enclosure.
Particle Injection System
Particulate was injected into the atmosphere using a
venturi injection port and rate-controlled continuous feed
dust feeder (Garrison and Goodman, 1985) . Compressed air

29
for the system was provided by a 220 volt, 20 gallon
capacity, Speedaire Industrial Duty Air Compressor model #
2z255 (Dayton Electric Co., Chicago, IL). Output pressure
was controlled by a double valve system model # lz838B
(Dayton Electric Co., Chicago, IL). One valve functioned as
a bleed valve and the other valve indicated in-line pressure
(30psi). The compressed air flowed through a compressed air
filter model # 282-160091 (Sears, Chicago, IL) which removed
entrained oil mist and a Speedaire model # 3z529 compressed
air dryer (Dayton Electric Co., Chicago, IL) which removed
entrained water vapor. The compressed air was then
conducted to the dust injection system through 30.48m of
1.9cm high pressure hose (Gates Inc., Dayton, OH) to the
dust feeder/injection system.
The dust feeder/injection system (Garrison and Goodman,
1985), illustrated in Figure 1, consists of three main
sections; the dust reservoir/feeder, the turntable and the
venturi injector. The reservoir is an aluminum cylinder
measuring 7.48cm in length. The diameters of the base and
top of the cylinder are 25.4cm and 22.9cm respectively.
This slight inverted conical shape prevents the dust from
forming bridges as it moves downward in the reservoir. An
extended lip at the top of the reservoir provides an opening
to add dust to the unit. A 150 watt flood lamp was placed
at the opening to minimize the relative humidity and help
desiccate the dust in the reservoir. A model # sdr21

30
w^m^'^'^"
^r^:^
Figure 1. Dust feeder/injection system. The system
consists of a dust reservoir/feeder, turntable and
venturi injector (from Garrison and Goodman, 1985).

31
vibration device (Vibco Inc., Wyoming, RI) is used to shake
the dust in the hopper while a model # 2z797a, potentiometer
controlled, gearmotor (Dayton Electric Co., Chicago, IL)
attached to a chain and sprocket pulley system slowly rotate
paddles on the hopper floor. This motion causes dust to
fall through a narrow slot in the hopper floor where a
funnel directs it to an opening above the turntable surface.
The turntable is an acrylic plastic platter 0.635cm thick
and 21.6cm wide. It is supported by a central vertical
drive shaft which is driven by a potentiometer-controlled
model # 2z797a gearmotor (Dayton Electric Co., Chicago, IL).
The platter can be adjusted to rotate from 0.254cm/s to
0.1016cm/s. Four 0.635cm circular grooves, each 2.54cm
apart, have been machined into the platter surface so that
as the platter rotates under a series of rubber scrapers
only the dust which has been forced into the grooves remains
on the platter. The balance of the dust delivered from the
hopper is scraped from the platter surface into a pan
extending from beneath the platter. Paddles attached to the
underside of the platter move the excess dust to a gravity
feed exit point for collection and recycling. After
emerging from under the last scraper the dust in the groove
is gently deagglomerated by contact with a loop of thin wire
as shown in Figure 2. This allows the dust to be vacuumed
from the groove at a relatively uniform rate instead of it
breaking away in large agglomerated chunks.

32
Figure 2. Close up view of the venturi injector pickup
tube vacuuming dust from the groove of the turntable
platter. Compacted dust is deagglomerated with the
wire loop.

33
The venturi injector is illustrated in Figure 3. Theinjector suctions the dust from the groove of the platterand forcefully ejects it into the atmosphere. Compressedair is conducted into an annular space, within the venturi,surrounding a solid metal tube. The compressed air escapesthe annulus at a point where the annulus narrows, forming aventuri throat and is separated from the outer circumferenceof the top end of the tube by about only 1.0mm. Beyond theventuri throat the cross-sectional area of the nozzleincreases. As the compressed air moves through this pointin the nozzle it expands, forming a zone of relatively lowpressure. This low pressure causes a strong vacuum in thetube. The bottom end of the tube rides in the machinedgroove on the platter surface and vacuums the dust from thegroove into the venturi. Sonic air velocities at theventuri throat cause extreme turbulence and maximizedeagglomeration of the aspirated dust. The dust isforcefully expelled from the top end of the venturi unit atan angle of 45 from the horizontal towards the back wallof the chamber.
Contact charging occurs when non-metallic, dry granularmaterial is separated from solid surfaces. When the aerosolparticles touch the solid, charge eguilibration between thetwo objects occurs. Upon separation the particles carrywith them either a net positive or negative charge dependingon the types of materials involved (Hinds, 1982). Althoughcontact charges may be continuously generated the effects of

34
mmy
#
v.iMiirJ.
Figure 3. Close up view of venturi injection unit.
Dust vacuumed from the turn table platter is
forcefully expelled from the top of the unit.
35
possible contact charging were minimized by bleeding any net
charge on the venturi injection device to ground. This was
accomplished by double wrapping a grounded, uninsulated,
braided wire around the brass exit port on the venturi
injector.
A model # HP 33P blower (Clements Mfg. Co., Chicago,
IL) was placed vertically in line with and at a position
0.61m in front of and 15.2cm below the brass exit port of
the venturi injector. The blower motor speed was controlled
by a type 3NP1010 variable autotransformer voltage regulator
(Statco Inc., Dayton, OH). The voltage was set at 65% over
the 12 0 volt range. The flow from the blower is directed at
a 110° angle from the horizontal toward the top of the
chamber and in front of a 3-speed 61cm X 61cm house fan
(Sears and Roebuck Inc., Chicago, IL), positioned on a free
standing 2.44m aluminium ladder directly above the blower.
The fan, facing and 5.64m from the test zone, was set on low
and was tilted at a 75 angle. Qualitative measurements
using long poles and thin strips of paper at distances of
0.5 to 3m above the chamber floor indicated that directional
air movement emanating from the fan could not be detected at
distances exceeding 3.66m from the aerosol generator.
Test Aerosol
Fine Air Cleaner (A.C.) Test Dust (pkg. #1543094) (AC
Spark Plug Division, General Motors Corp, Flint, MI) was
used as the challenge aerosol. Fine A.C. Test Dust is a

36
sand based material. Elemental x-ray analysis in this study
indicate that the chemical make up of the material is
primarily silicon and aluminium with relatively smaller
amounts of potassium, calcium and magnesium. The results of
x-ray elemental analysis are presented in appendix D. A
Sedigraph (5100 Micro Meritics, Norcross, GA) particle size
analyzer was used to size the bulk A.C Test Dust. Results
of the analysis are presented in the Characterization of
Fine A.C. Test Dust section of the Results and Discussion
chapter.
Air Sampling, Conducting and Metering Systems
Vacuum Manifold System
The manifold assembly was suspended in the air by three
laboratory support stands and ring stand clamps. The
manifold itself was fabricated from a 1.22m length of 5.08cm
outside (O.D.), 3.81cm inside diameter (I.D.), standard
grade black steel pipe. Twenty holes, 10 on each side of
the manifold, were drilled and tapped to accept l/2inch
Swagelock (Swagelock corp., Solon, OH) fittings. The
swagelock fittings were applied and silver soldered in
place. Approximately 10cm long sections of 3/8inch O.D.
copper pipe were attached to the manifold with Swagelock
fittings. Needle valves (Whitney Valves, Highland Heights,
OH) were plumbed onto 16 of the copper pipes to control air
flow through the attached rotometers.

37
Dwyer "Rate-Master", Rotometers (Dwyer, Michigan City,
IN) were attached to all 20 manifold ports. Six 10 to 50
Standard Cubic Feet per Hour (SCFH) rotometers were provided
for the lO.OLpm samplers. Ten 1 to 10 SCFH rotometers were
provided for the 4.OLpm samplers. These 16 rotometers were
controlled by the aforementioned needle valves. Four 1 to
5Lpm rotometers equipped with top mounted valves were
plumbed into the remaining 4 manifold ports. Two large
model #727-CM-39 electric air pumps (Thomas Industries Inc.,
Shebogan, MI) provided vacuum pressure for the manifold
system. The pumps were connected to the sampling manifold
placed within the chamber through two, 15.2m heavy duty
garden hoses (Gates Inc., Dayton OH). The hoses were
connected to each of the two ends the manifold pipe and to
the pumps by hose to pipe fittings. Air from samplers was
conducted to the 16, 10 to 50 and 1 to 10 SCFH rotometers
through 6.0m lengths of 7/8inch O.D. l/4inch I.D. standard
grade surgical tubing (Fisher Scientific, Pittsburgh, PA).
Air from samplers was conducted to the 4, 1 to 5Lpm
rotometers by 9.1m lengths of l/4inch O.D., l/8inch I.D. red
tubing (Fisher Scientific, Pittsburgh, PA).

38
Calibration Equipment
Model 50MJ10, Laminar Flow Elements (LFEs), (Meriam
Instrument, Cleveland, OH) were used to calibrate all flow
rate measuring equipment. LFEs measure gas volume rate of
flow using capillary flow principles. The differential
pressure across the LFE were used to determine the
volumetric flow rate. The LFEs were calibrated by the
manufacturer to within +/-0.5% of flow standards traceable
to the National Bureau of Standards (Installation and
Operation Instructions, 1985). The LFEs were used in
conjunction with a digital readout monitoring manometer unit
(MKS Instrument Inc., Burlington, MA) to measure
differential pressure across the LFEs. Measurements from
these devices and each instrument calibrated were inputted
into an H-P model 9845-B computer (Hewlett-Packard, Palo
Alto, CA) equipped with EPA produced software. The output
was plotted on an H-P model 9872-C plotter (Hewlett-Packard,
Palo Alto, CA) which produced a calibration curve used in
the field. Specific information on the calibration of each
instrument is available in Appendix B.
During the experiment it was found that the 1/4 inch
O.D. tubing produced an excessive pressure drop and reduced
flow rate. This problem was corrected by using a calibrated
mass flow meter (Niagara Scientific, E. Syracuse, NY) to set
the correct flow rate.

39
Sampling Devices
Andersen Mark II Cascade Impactors
The Andersen Mark II Cascade Impactor (C/I) consists of
up to 8 aluminium stages that are held together by three
springs extending form the base plate to the inlet cone. An
air tight seal is formed between each layer of the stacked
plates by a neoprene rubber "O" ring. A stainless steel
impaction plate is placed below each aluminium stage. Each
plate supports an oiled aluminium foil substrate which
collects the impacted particulate. The C/I is designed to
fractionate captured particulate into cut sizes of 0 to
l.lum, 1.1 to 2.1um, 2.1 to 3.3um, 3.3 to 4.7um, 4.7 to
V.Oum and 7.0 to Hum depending on the number of stages
used. This study used 5 and 6 stage C/Is. Particles less
than l.lum diameter pass through the lowermost stage on the
impactor and were captured on Pallflex filter contained
within a 47mm metallic filter holder (BGI Corp., Walthham,
MA) placed in-line downstream from and immediately after the
cascade impactor. Foil substrate and Pallflex filter media
is described in detail in the Gravimetric Collection
Substrates section of the Equipment chapter. The operation
of the impactor is shown visually if Figure 4. Data
reduction is described in the Uniformity Experiments section
of the Results and Discussion chapter.

40
AMBIENT AIR FLOW
n
^ i
Figure 4. Schematic cross section of the Andersen MarkII Cascade Impactor. Impactor jet sizes of each stagebecome progressively smaller causing the impaction ofsmaller particles on each succeeding stage.

41
Vacuum pressure for each of the impactor units was
provided by a model #727-CM-39 electric air pump (Thomas
Industries Inc., Shebogan, MI). Flow to the pumps was
controlled by in-line needle valves (Whitney Valves,
Highland Heights, OH) placed just upstream each unit's 10 to
100 SCFH Dwyer "Rate-Master", Rotometer (Dwyer, Michigan
City, IN). Air from impactor units was conducted to
rotometers through 6.0m lengths of 7/8inch O.D. 1/4inch I.D.
standard grade surgical tubing (Fisher Scientific,
Pittsburgh, PA).
Micro-Environmental Monitor
The Micro-Environmental Monitor (MEM) inlet (MSP
Corporation, Minneapolis, MN) is a lO.OLpm sampling device
which was designed to be used in a free-standing
configuration to monitor indoor air. The MEM was provided
in two cut sizes, PM-IO and PM-2.5. One unique feature of
the MEM device was the sintered stainless steel impaction
surface which held mineral oil (E.R. Squibb and Sons Inc.,
Princeton, NJ). A 2um pore size teflon filter was supported
in the MEM unit by a plastic filter cassette (Andersen
Instruments Inc., Atlanta, GA). Teflon filter media is
described in detail in the Gravimetric Collection Substrates
section of the Equipment chapter. Plan views of a PM-10 MEM
nozzle plate, base and impaction plate, and cover are
provided in Figures 5, 6 and 7 respectively.

42
Axi& X
THRU Hole. Of DiA D^(\0) ECuKuV SfAUD CMA 1.600 B.C. A*! SHoujNC^K. 0.0 E> :^p
A AH>VX
2.000 p.
c^ZZZZ^
TFT^
3.20 0
EiLoT DlWiS.0.58t THRU Czl
StlOujH OM A a.tis' fc£-.— RoTATt UP UHT.L CENTtBcti
6N Axii Ij AT A DEPTtt OK
lOlDTH IS 0.250 tTnio f« •X,-Jd")Also ctkiTtBi oc ON Ax>i X
* UoTE ASyWtlftETRV o F TWO SloTi
15 A
IVvAx, ftACiui = O.C?
SEcnow Aa^/Q^
THREE PiECti OF T*t AtOUE PfttT SHOULD C>€ VV\AtEfOt E.AL» SET- OF bivnEVl iiBNi fclvADa fcELOuT.
li1
E>
\.50
\.H\
\.fe5
\.5t
^^USE " 2M DRlU. (c iSi";UU ^Sl DtlU. CDOtVi
PN«^ * 1 No^lLC PL/ATt ( »WAk£ C> toA«l ('i "o, > t ">
Figure 5. Plan Drawing of a PM-10, Micro-EnvironmentalMonitor (MEM) nozzle plate (from MSP Corp.,Minneapolis, MN August 15, 1989).

«KM E.t>bC 0.030 X tSTut'' LiCHtLy frLiiH Limt
— 2.S30 �
l.'\BO rffi.ofce U—i.Stof—<»]
^/ /
iS:
SttnoM rt\. fti.
• LU5«-«iD.DBE
1.350 0 -mO.I 00
PA^T 2 IwdPALTtoivj Plate (ww<,l Sut")
P!>V-
2250 i—^• i.aso #-»t»l.l25«.*4
Dt>U fc TTi"
SEi.T>otJ *». o-siNb beoovtO.0°»0
For Hti.ao. H.Xi-io)INSERT — 0. fco OPU^ tQJ»>su.^ S!>M.CC. ON
BSeMt MS > t.32
Ph?.T'' 1 bh^t K tfyMS. SeA")^
43
Figure 6. Plan Drawing of a PM-10, Micro-EnvironmentalMonitor (MEM) base and impaction plate (from MSP Corp.,Minneapolis, MN August 15, 1989).

0.50 THRO Hole
0.1?
\.'K'\S *
a.ZH 9------»>
BKNV HLtiCEy D.07 X MS"
D.olO X Ms"
"iECTIDM C^L «X
X.Xx)(*rft 0.00 2
O-RlMti; 1-028 ViTDtg (2)
En^x sA'^pi^ —
^2W ')-/
'MiH.irtej.1-• •«« •*•
44
Figure 7. Plan Drawing of a PM-10, Micro-EnvironmentalMonitor (MEM) cover (from MSP Corp., Minneapolis, MNAugust 15, 1989).
45
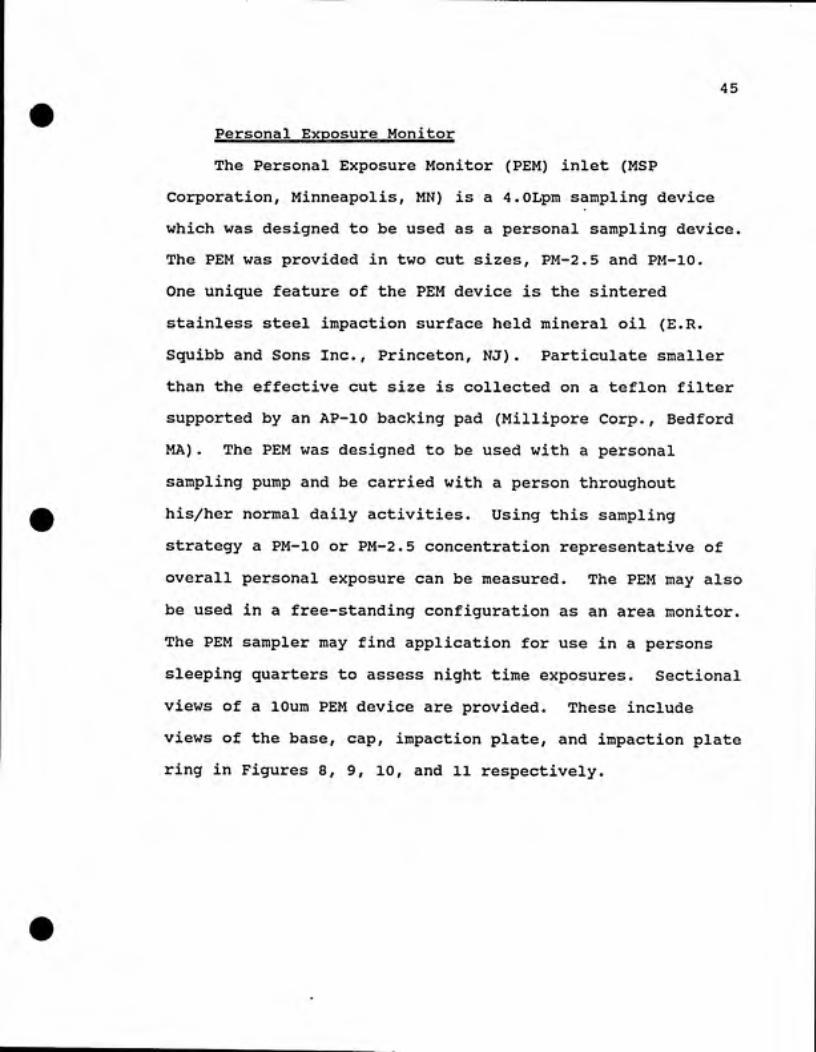
Personal Exposure Monitor
The Personal Exposure Monitor (PEM) inlet (MSP
Corporation, Minneapolis, MN) is a 4.OLpm sampling device
which was designed to be used as a personal sampling device.The PEM was provided in two cut sizes, PM-2.5 and PM-10.
One unique feature of the PEM device is the sintered
stainless steel impaction surface held mineral oil (E.R.Squibb and Sons Inc., Princeton, NJ). Particulate smallerthan the effective cut size is collected on a teflon filter
supported by an AP-10 backing pad (Millipore Corp., BedfordMA). The PEM was designed to be used with a personalsampling pump and be carried with a person throughouthis/her normal daily activities. Using this samplingstrategy a PM-10 or PM-2.5 concentration representative of
overall personal exposure can be measured. The PEM may alsobe used in a free-standing configuration as an area monitor.
The PEM sampler may find application for use in a personssleeping quarters to assess night time exposures. Sectionalviews of a lOum PEM device are provided. These includeviews of the base, cap, impaction plate, and impaction platering in Figures 8, 9, 10, and 11 respectively.

46
11200141
—, ^ l«l (6 125 « I ®? 000 K
US I?)
)inj8-sw>eig7SHi2)
«M(?I
BRWK Hff 0 0? I <r 12) - rr9\(n-
-oi.m
\\ L.vi^^a
BBEWHH 0 04X45--^ BH 0 193/190-SKUWA
-------- 000=>- iOO^X^ 210V^ 310^ 350
-H«EDff0 02«4?l21
.100
ri
laEUIGS
III to 0?I III ID 010
inifiini
SECTIWB
l"i I "wi.
J
125
Vq-
tsp ctmiunoK i^«-- ' »"•»tm»« IMl.]*gl HI lUIVt:
ini<ISI
BASE
k-k|.SMl»
PEH-OI1
Figure 8. Plan drawing of a PM-10, Personal Exposure
Monitor (PEM) base (from MSP Corp., Minneapolis, MN,
August 15, 1989).

47
R.m(4) Tw 0.120 ON * 01,00 BHC110) AS am
llftj HOLES FOR 8-3? (21CSKfORfHSON*01,975BHC
R2W(2
MAK EDGE 0 02X45° (10)BREAK EDGE 0.06 X 45
BREAK EDGE 0 02 X 45° (^^ 01 350
lUEMtCES
I It to VI Ml ID 010Iralf tl r
Figure 9. Plan drawing of a PM-10, Personal Exposure
Monitor (PEM) cap (from MSP Corp., Minneapolis, MN,
August 15, 1989).

48
032 .070
j!!>\\\\s\ss'^
M
01.455
ttVlSlOHS
OESCHIPIIJI D>lt I KWOVEO
T>«S DRAWMQ 8 THE PnOI>enY OFMSPCoRPOMnoN. ooNorooPt;oupucATE OR suMrriDOuraBePARTIES FOR EXAMMXnONWITMOUTKjnWRITTENcoNaBfr. rrsHAaBE
1^0 ONLY wrrvi REFERBCE TO WORKUNDER COMTRACT OR PROPOSALSllBM|-n-F[?RrMSFCQR,rofViT1QN, ,
TOLERANCES
Ml i0.02Mil 10.010Angle 11.0°
KSP mPOEiTIONItlejhK: (6121 Ufrga FH: (6121 r»-39B5
1313FifthStrwt Si Suite XCKrn^Us. m S5/I4
STOt 6061 a SMI
2:1
iini
IMPACTION PLATE
1W*»' «.«. IBW* »t 7/I1/S9mmav »Ji
mnmiatB PEH-006
Figure 10. Plan drawing of a PM-10, Personal ExposureMonitor (PEM) impaction plate (from MSP Corp.,Minneapolis, MN, August 15, 1989).

49
-^<?)./4U-^
I
ftvisioe
1* jtsmm. m I mxi
NOTE: CUT ON EDH
.030 AS SUPPLIED
01.340 jlIt* OMMMM B ItC PnOPERTY OPMSP CORPORATION. DO NOT COPY.
.ATE. OR SUBMIT TO OUIBlOefAK riES FOR EXAMWATION WnHO/T
, OUR WRITTEN CONSBO: iraHMJLBEluSED ONLY WITH REFERENCE TO WORK
UNDER CONTRACT OR PB0W8ALSUBMITTED BY MSP CORPORATION.
laERANCES
Ml i0.02nil lO.oio
Angle 11.0°
#57' comEmofi1tl«)to«: 161?) 379-SS3 F«: (612) JJS-SSBS
1313 fUtii Stntt S.(. SuittXeKmfelis. m Sin
STSIT iwous siHKiss smiFINISH
SOLE
2:1
nu
IMPACTION RING
(w* Bt K.H. mm l»fWWVffiBr
7/ia«
.UIE
ORHINGHKB)
PEH-005
Figure 11. Plan drawing of a PM-10, Personal Exposure
Monitor (PEM) impaction plate ring (from MSP Corp.,
Minneapolis, MN, August 15, 1989).

50
Dichotomous Sampler
The model 244 Andersen dichotomous sampler with the
model 246-B, lOum cut size sampling head (dichot) (Andersen
Instruments Inc., Atlanta, GA) was used as a referee sampler
for this study. The legs on the standard model were
shortened to adjust the height of the sampling inlet to Imabove the chamber floor. The dichot unit consists of a
control module/pump, sampling module and interconnecting
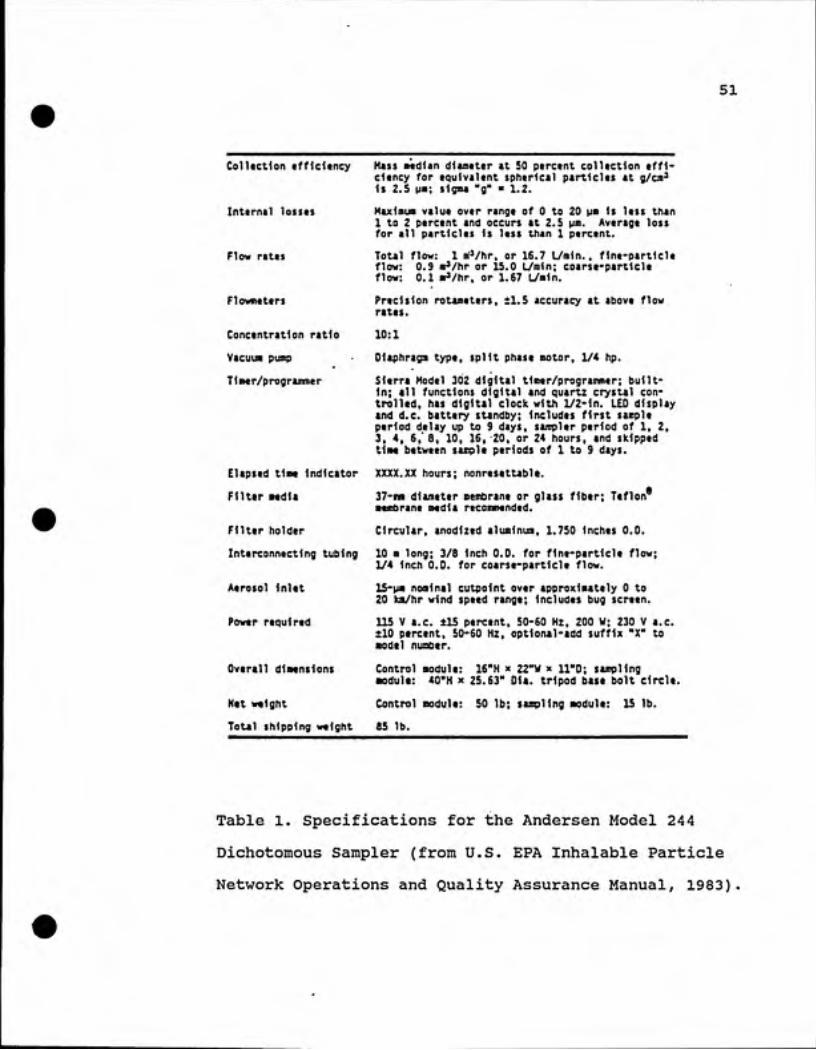
tubing. The specifications for the dichot used in this
research are the same as those presented in Table 1 except
that the model 246-B inlet used in this study had a lOum cutsize.
As specified in Table 1, the dichot operates at a total
flow rate of 16.7Lpm. The total flow is split between the
coarse fraction which samples at 1.67 Lpm and the fine
fraction which samples at 16.7-1.67 = 15.03Lpm. The coarse
and total flow rates are controlled by adjusting precision
rotometers mounted on the control module/pump. Mass
concentrations for the fine and coarse fractions are
calculated as follows:
Mf
Fine Particle Concentration (ug/m3) = ---------<= 2.Sum Q2 * T
Coarse Particle Mc - (Cf * t * Ql)Concentration (ug/m3) = -------------------2.5um > PM <= lO.Oum Qo * T
51
•
Colltction tff1ci«ncy Mass aedian diameter at 50 percent collection cffi*cieney for equivalent spherical particles at g/as*is 2.5 am; sigma "g" = 1.2.
Inttrnal lossas Haxiaua value over range of 0 to 20 ^^m is less than1 to 2 percent and occurs at 2.5 mri. Average lossfor all particles is less than 1 percent.
Flow rites Total flow: 1 m'*/hr, or 16.7 L/nin. , fine-particleflow: 0.9 n*/hr or 15.0 L/min; coarse-particleflow: 0.1 B^/hr, or 1.67 L/«in.
FloMMtcrs Precision rotameters, il.5 accuracy at above flowrates.
Concentration ratio 10:1
VacuM pump Oiaphragn type, split phase motor, 1/4 hp.
TlMr/programmer Sierra Model 302 digital timer/programmer; built-in; all functions digital and quartz crystal con¬trolled, has digital clock with l/2-1n. LEO displayand d.c. battery standby; includes first sampleperiod delay up to 9 days, sampler period of 1, 2,3, 4, 6,' S, 10, 16, 20, or 24 hours, and skippedtime between sample periods of 1 to 9 days.
Elapsed tint Indicator XXXX.XX hours; nonresettable.
•Flltar Mdia 37-ni diameter membrane or glass fiber; Teflon
membrane media recommended.
FlUtr holder Circular, anodized aluminum, 1.750 inches O.D.
Interconnecting tubing 10 m long; 3/8 Inch O.D. for fine-particle flow;1/4 inch 0.0. for coarse-particle flow.
Aerosol inlet IS-pm nominal cutpoint over approximately 0 to20 ka/hr wind speed range; Includes bug screen.
Power required 115 V a.c. ±15 percent, 50-60 Hz, 200 W; 230 V a.c.�10 percent, 50-60 Hz, optlonal-add suffix "X" toodd number.
Overall dincnsions Control module: 16"H » 22"V x irO; samplingmodule: 40''H x 25.63" Dia. tripod base bolt circle.
Net weight Control module: 50 lb; sampling module: IS lb.
Total shipping weight 65 lb.
Table 1. Specifications for the Andersen Model 244
Dichotomous Sampler (from U.S. EPA Inhalable Particle
Network Operations and Quality Assurance Manual, 1983)

52
Where:
Qo = total flow rate into sampler (0.0167m-^/min)
Ql = coarse particle flow rate (0.00167m-^/min)
Q2 = fine particle flow rate (0.01503m-^/min)
Mf = fine particle mass (ug)
Mc = coarse particle mass (ug)
T = elapsed sampling time (minutes) (adaptedfrom Inhalable Particle Network Operations andQuality Assurance Manual, 1983).
PCD-1
The PCD-1 (MDA Scientific, Lincolnshire, IL) respirabledust monitor is a micro-processor based direct-reading unitthat uses a light-scatter detector. The instrument drawsparticulate laden air into a chamber where the resultinglight-scatter is continuously monitored (PCD-1 OperationsGuide, 1988). This instrument was not calibrated and wasused only to provide a relative response indication of realtime particle loading in the chamber.

53
37mm Open Face Filter Cassette Samplers
Standard Millipore 37mm filter cassettes operated in anopen face configuration (Millipore Corporation, Bedford, MA)were used to monitor atmospheric particulate in the chamber.The flow through the cassettes was 4.0Lpm.
Gravimetric Collection Substrates
Teflon Filters
37mm, 2 micron pore size #R2PJ037 (Gelman Filters Inc.,Ann Arbor, MI) Teflon filters with an olefin ring were usedwith the PEM, MEM and dichot samplers.
Pallflex Filters
Pallflex 47mm type T60A20 (Pallflex Products Corp.,
Putnam, CN) were use as back up filters for the Andersen
Mark II Cascade Impactor units. Particles less than l.lumdiameter pass through the lowermost stage on the impactorand were captured on the filter. A Pallflex filter containedwithin a 47mm metallic filter holder (BGI Corp., Walthham,
MA) was placed in-line, just downstream from and immediatelyafter the cascade impactor.
Cellulose Acetate Ester Filters
37mm, 0.8um pore size cellulose acetate ester filters
(Millipore Corp., Bedford, MA) were used in the open facesamplers.

54
Cascade Impactor Foil Substrates
Circular aluminium foil substrates, part# 20-304,
(Andersen Instruments Inc., Atlanta, GA) were used ascollection substrates on each impaction stage. A low
viscosity aerosol applied silicone oil (Cling Surface Co.,Angola, NY) was used to coat the foil substrates prior touse.
Environmental Protection Agency Weighing Chamber
Weighing Chamber
Gravimetric determinations were made in the EPA
weighing chamber. The weighing chamber was maintained at aconstant temperature of 2 0°C +/-2°C and a relative humidityof 40% +/-2%. Within the chamber the two balances were setup on thick granite balance tables.
Balance Tools
The Rite-Weight balance Type 2 R160-9 (Rite-Weight
Inc., Duluth, GA) was used to weigh oiled foil substrates
used in the cascade impactors. The Rite-Weight balancemeasures to 1 x 10"^ gram. All other gravimetric filtermaterial was weighed on a three section Mettler balancesystem consisting of a ME 22 balance unit, BE 22 balancecontrol unit and BA 25 digital balance display unit (MettlerInstruments Corp., Hightstowne, NJ). The Mettler balancesystem measures to 1 x 10~^ gram.

55
Polonium 210 "static master" (Nuclear Products Company,
South El Monte, CA) static-control units were used to
control potential static problems on filter media.
Scanning Electron Microscope and Associated Equipment
Nuclepore filters with 0.2um pore size (Nuclepore
Corp., Pleasanton, CA) were used with 37mm filter cassettes
to briefly sample the aerosol in the chamber. The filters
were subjected to Scanning Electron Microscope (SEM) and X-
ray elemental analysis.
Each sample was prepared for analysis in the SEM by
cutting a representative wedge from a Nuclepore filter and
fixing these on individual 1mm diameter holders called
"stubs". In order to prevent possible charging effects
from the electron beam (Lawes, 1987) the specimens were
first coated with a very thin uniform layer of gold-
palladium alloy (60% Au, 40% Pd) (Electron Microscopy
Sciences, Fort Washington, PA) utilizing the vacuum
evaporation coating process. The process was carried out
within a Denton Vacuum Evaporator (Denton Vacuum, Cherry
Hill, NJ) vacuum chamber. The SEM used was a Cambridge
Stereo Scan 200 (Cambridge Instruments Inc., Deerfield, IL).
The SEM has a resolution of O.Olum when operated under
optimum conditions (Bagnell,1989) . Typically particles as
small as O.OSum can be seen. Generated X-ray pulse signals
of different energy levels were accumulated electronically
on a Kevex 7000 EDS (Kevex Corp., Foster City, CA) computer.

56
Quantex (Quantex Inc., Sunnyvale, CA) software was used to
identify the peaks for elemental identification. The X-ray
analysis plots were plotted on a Decwriter II printer
(Qualimetrics Inc., Sacramento, CA). The Ziess Videoplan
(Ziess Corp., West Germany) and associated computer were
used to generate particle size information on the particles
sampled.
Miscellaneous
PEM and MEM sampler impaction surfaces were scraped
clean with a razor blade. Accessible interior surfaces were
wiped down with acetone using a clean cloth. Cascade
impactor stages, plastic snap rings and 37mm filter
cassettes were cleaned by submersion in a solution of
"Micro" liquid laboratory cleaner (Cole-Parmer Instrument
Co., Chicago, IL) and water in an 2 quart capacityultrasonic bath.
The relative humidity, temperature and barometric
pressure were tracked within the chamber using a calibrated
Metrograph (Weathertronics Inc., Sacramento, CA).
Three headless shirt-form manikins were used to
simulate sampling on humans in the experiments. The shirt-
forms were loaned to me by Ms. Vonda Parker of the Belk-
Leggett Co., South Square Mall, Chapel Hill, NC. The shirt-
forms were 52cm by 24cm at the shoulder and stood 1.12m
above the chamber floor.

57
Investigators wore NIOSH approved half mask respirators
P/N 460968 (MSA Co., Pittsburgh, PA) with type "S" filter
cartridges P/N 459321 (MSA Co., Pittsburgh, PA). Tyvek
(DuPont Corp., Kennett Square, PA) coveralls were worn by
the manikins and human participants in the study.

58
DESCRIPTION OF EXPERIMENTS
General
In both the characterization and Collocation
experiments Fine A.C. Test Dust was continuously injectedinto the chamber using the aerosol injection system. The
chamber contents were continuously exhausted. Rotometer and
instrument readings from all sampling devices used during a
given experiment were recorded at the beginning of each
experimental run and each 3 0 minutes thereafter.
Adjustments in sampler flow rates and aerosol injection rate
were made as necessary. Relative humidity, temperature and
barometric pressure were tracked using a metrograph. Thesemeasurements were recorded at the beginning of each
experimental run and each 3 0 minutes thereafter.
Uniformity Experiments
The Test Zone as shown in Figure 12 was identified
prior to conducting characterization experiments. The apexof the test zone triangle was aligned vertically withcenter-line of the A-frame structure 1.53m from the front
wall of the chamber. The base of the triangular test zoneruns parallel to and 3.35m from the front wall of the
chamber. The base was 2.2 9m in length. The length of theleft and right legs of the central triangular test zone were

59
3.35ni
/
Exhaust
o
Intake
9=,AEROSOLGENERATOR
o
/ EnclosedFan
2.29m
TEST /'ZONE/ 1.82m
0.94m
/
5.2m
11.8m
Figure 12. Drawing of the chamber floor layout.Drawing shows the test zone, enclosed fans, aerosolgenerator, intake and exhaust port locations and actualdistances (drawing not to scale).

60
2.2 6m and 2.05m respectively. The adjacent section of the
test zone where the participants were seated during the
collocation experiment extends from the triangular test zone
apex a distance of 0.94m towards the right chamber wall.
From this point the adjacent section of the test zone
extends to right base corner of the triangular test zone.
Uniformity of particle mass and particle size
distributions in and near the defined test zone were
determined using data from Andersen Mark II cascade
impactors and standard 37mm open-face samplers evenly
distributed throughout the test zone. The inlets of all
samplers were placed at a height of 0.91m to 1.02m above the
chamber floor. Both types of samplers were operated during
each of the three runs conducted. One sampling run was made
each day during a three day period. Placement of the
samplers is illustrated in Figure 13.
Particle size distribution within the test zone were
assessed using 3 evenly distributed 5-stage Andersen Mark II
cascade impactor units operated at a design flow rate of
28.3Lpm. The cascade impactors were operated face up. The
size distribution of particles collected on standard 37mm
open-faced filter cassettes were assessed by analyzing data
from Nuclepore filters placed in standard 37mm open-faced
filter cassettes. The samplers were operated briefly in a
downward facing orientation at a flow rate of 4.0Lpm.
Sections of the Nuclepore filters were mounted, coated and
analyzed using a SEM.

61
o\ o o
o o
o\
\ °—1
1) o
o
O = Open-face SamplersCascade Impactors
Figure 13. Placement of samplers around test zone forparticle mass and particle size distribution uniformityexperiments. Drawing showing the placement of open-face 37mm filter cassettes and 5-stage cascadeimpactors (drawing not to scale).

62
Particle mass distribution was measured using 10, 37mmfilter cassettes in the open-face configuration. Thefilter cassettes, operated at 4Lpm, were oriented facing thefloor of the chamber.
Collocation Experiments
Ten experimental runs were conducted between Januaryand March, 1989. Particle mass and particle sizedistributions were tracked using cascade impactors and open-face filter cassettes. Two cascade impactors were operatedat a design flow rate of 28.3Lpm during each test run totrack the particle size distribution. One to 3 downwardfacing open-face filter cassettes sampling at 4.0Lpm wereoperated during each test run.
The dichot, MEM and PEM samplers were placed in thechamber as shown in Figure 14. All of the devices wereoperated at the design flow rates 16.7Lpm, lOLpm and 4Lpmrespectively. Free standing PEM samplers were suspendedfrom the aluminium tubing which defines the test zone. Eachsampler operated during a single test run was operated forthe same period of time -/+3 0 seconds. Total sample runtimes varied from 75 to 240 minutes. PEM samplers worn byparticipants and those placed in the free-standingorientation were not operated during every test run due tothe limited number of sampling ports. All samplers wereoperated at a height of 0.96 to 1.02 meter except the

63
Free-standing PEMsn n
\(D)W oo ®A^f
----/
\<^10 MEIv^\ /
PEMs on ^Tnq 2.5 ^7Shirt-forms \j K^) A^ "m
ANDER'^EN'DICHOTim
PEMs on Persons
Figure 14. Placement of samplers in the test zone forcollocation experiments. Diagram shows the location ofdichot, MEM, shirt-form PEM, free-standing PEM, andPEMs placed on participants (drawing not to scale).

64
personal PEM devices which varied in height based on human
variability and differences due to the person's positioning
in either a sitting or standing position.
During the course of the experiments the participants
remained seated the majority of time during the test runs.
In order to simulate activity of a person within a home,
however, the participants were instructed to stand and walk
at a normal pace back and forth in front of the test zone
area for 5 minutes after each 30 minute seated period during
the test run.

65
RESULTS AND DISCUSSION
Characterization of Fine A.C. Test Dust
Measurements were made to characterize the Fine AC TestDust. The size distribution information issued with the
product is shown in Table 2.
Table 2. Mass Percent Particle Size Distribution
Information Issued With Fine A.C. Test Dust
Particle size range (um) % in range0-5
5-10
10 - 20
20 - 40
40 - 80
(from pkg. #1543094 AC Spark Plug Division,General Motors Corp.,Flint MI).
The upper limit of the particle size range intervalswere plotted on log probability paper vs cumulative mass %less than that size (Reist, 1984). A straight line wasfitted to the data points which describe the log normalparticle size distribution. The AMMD, which is representedby the geometric mean or the 50% cumulative mass value(Reist, 1984), was equal to 7.6um.
range Cum. % <
39 +/- 2% 39
18 +/- 3% 57
16 +/- 3% 73
18 +/- 3% 91
9 +/- 3% 100

66
Selected results from the SediGraph 5100 particlesizing instrument are shown in table 3.
Table 3. Mass Percent Particle Size Distribution of
Fine A.C Test Dust From Sedigraph 5100 Analysis
Particle size range (um) Cum. % <
0 - 5 39.5
5 - 10 58.4
10 - 20 76.4
20 - 40 91.6
40 - 80 97.4
The SediGraph analysis reports the AMMD was equal to7.46um. The cumulative mass percent information from theSediGraph were well within the tolerances reported by themanufacturer for Fine A.C. Test Dust. The close agreementof these two data sets suggest that the SediGraph analyticalmethod was a valid method for determining the particle sizedistribution of bulk Fine A.C. Test Dust material.
Nuclepore filters were used to confirm that testaerosol particles greater than lOum in size did reach thetest zone and to provide limited information describing theparticle size distribution of the test aerosol. Studies byFairchild (1981) indicate that particles greater than 20umin size are sampled with an efficiency less than 80% for37mm filter open-face cassettes placed in a downward facing

67
orientation. However, SEM photographs of particles sampledon Nuclepore filters in this way indicated that A.C. TestDust particles larger than lOum did reach the test zone andwere sampled.
Prepared Nuclepore filter samples were analyzed by the
SEM and reduced to 823 digitized particle images. The SEMimages were processed using the Zeiss video plan and itsassociated computer to produce minimum, maximum andgeometric mean values for Feret-x diameter. These valueswere 0.111386um, 11.4348um and 0.746602um respectively. TheFeret-x diameter is the maximum distance across a particleas measured along the x-axis (Fraser). Large numbers ofparticles, assumed to be oriented randomly, were counted.Feret-x data was used to approximate irregular particlediameter. Aerodynamic diameter was calculated from
irregular particle diameter using the following equation:
da = dg (Pp/PoX)0-5 (gq_ 2)(Hinds, 1982)
Where
dg = Aerodynamic Diameter
dg = Irregular Diameter
Pp = Particle Density (2.6g/cm-^)(Leith, 1989)
pQ = Unit Density (l.Oq/cm?)X = Dynamic Shape Factor (Quartz=1.36)
(Hinds, 1984).

68
The dynamic shape factor for quartz was chosen becauseof the high silicon content of the A.C. Test Dust asdetermined by the SEM X-ray elemental analysis.
From eq. 2 an aerodynamic particle size range of0.154um to 15.815um and an AMMD equal to 1.03um wasdetermined. While this AMMD value was considerably lowerthan that of either the average cascade impactor or the bulkmaterial, 3.Oum and 7.46um respectively, it was notunexpected. Many larger particles present in the bulkmaterial were probably lost to sedimentation and did notreach the test zone area. Cascade impactor units wereoperated in a face up orientation. This appears to haveresulted in a higher capture efficiency of large airborneparticles relative to the open-face samplers. Smallerparticles, however, tend to remain airborne for long periods(Wilson et al., 1971). The net effect of these combinedprocesses appears to have resulted in the decreased AMMDobserved using open-face filters in the test zone relativeto the measured AMMD of both the cascade impactors and thebulk material.
Uniformity Experiments
The characterization data using open-face 37mm filtercassettes and 5-stage Andersen cascade impactors are listedin tables 4 and 5.

69
Table 4. Test Zone Uniformity Experiments. DataSummery For Open-face Filter Cassettes
RUN 11 RUN 12 RUN 13
COKC.(ug/i3) CONC. (ug/«!3) C0NC.(ug/i3)tt 1154.13
215.76203.77203.77241.44210.62203.91215.76220.89212.33
844.231467.311511.541253.841480.771413.461480.771571.151359.611478.84
1966.801960.942132.812228.521951.172273.442005.862099.611955.081958.98
AVS = 308.74 AV5 = 1386.15 AVS = 2053.32
ALL STD.DEV. 297.24 STD.DEV., 209.67 STD.DEV. 122.41
VAlUES VAR. SE349.0 VAR. 43962.55 VAR. 14935.03
TOTAL 3037.37 TOTAL 13861.52 TOTAL 20533.21
cv= 96.27 1 CV= 15.13 I CV= 5.96 I
AVS = 214.81
itt iJ/G STD.DEV. 11.46OUTLIER VAR.
TOTALCV=
131.301933.25
5.33 X
Note: ** = probable outlier.*** = statistical analysis with out outlier.

70
Table 5. Test Zone Uniformity Experiments. DataSummery For 5-Stage Cascade Impactors
IHFfiCTOROR RUN tl RUN 12 RUN 13
5E0. KEAN(ut) GSD BED , KEAN UB ) 65D EEO. KEAN(ufil BSD
f! 3.27 2.50 3.05 2.42 FOIL SUBSTRATE DESRQYED
12 2.94 2.50 3.03 2.50 FOIL SUBSTRATE DESROYED
13 3.13 2.60 3.07 2.50 3.41 2.40
AVG= 3.11 2.53 AVG= 3.05 2.472 STC.DEV +/-0.33 +/-0.11 +/-0.04 +/-0.09
71
Good agreement was achieved between open-face samplersduring all three test days. Utilizing all the availabledata to analyze the similarities in mass concentrations, theaverage C.V. was equal to 39.12*. The suspected outlier wasdropped because its value exceeded the mean value of run #1by more than 2.5 times the computed standard deviation.After dropping this point the remaining data yielded C.V.sequal to 5.33, 15.13 and 5.96 for runs #1, #2 and #3respectively and an average C.V. of 8.8%.
The cascade impactor cumulative mass percent data wasplotted as log aerodynamic diameter versus cumulative masspercent probability. A representative log-probability plotis shown in Figure 15. The AMMD and geometric standarddeviation were computed for each data set. Although the cutsize for each of the impactors were not calibrated prior tothis experiment, good agreement between impaction units wasobserved. The average geometric mean for three impactorswere 3.Hum +/-0.33um and 3.05um +/-0.04um for runs #1 and#2 respectively. The average geometric standarddeviationsfor the three impactors was 2.53 +/-0.11 and 2.47+/-0.09 for runs #1 and #2 respectively. One or more of theoiled foil substrates used in cascade impactors 1 and 2during run #3 stuck to the surface of the stage above. Thedata set was lost since useful cascade impactor data wasplotted as cumulative mass percent of the entire collectedmass. These cascade impactor data indicated a very similarparticle size distribution throughout the test zone area for

72
crLUI-LU:^<QO
<z>-DoLU<
Characterization lAGM = 3.056 GSD = 2.416
40
20
10-"""
^ **
-*'
^«
4.0
2.0
^P"
^
1.0^,'
0.4 ^-.•',-•"
0.2
0 1 10 30 50 70 90
CUMULATIVE MASS PERCENT
99
Figure 15. Cascade impactor data plot. Typical,aerodynamic diameter versus cumulative mass percentprobability. The geometric mean (G.M.) is representedby the 50% cumulative mass percent value. Thegeometric standard deviation (G.S.D.) is a measure ofthe slope of the line.

73
particles up to 7um in size. Close similarity between AMMDvalues determined over several days also showed that thetest atmosphere particle size distribution could berepeatedly generated.
Collocation Experiments
Fine and coarse concentration results for the ten
sampling runs are presented in tables 6 and 7 respectively.Dichot pump failure and contamination of some of the PEM andMEM sampler units resulted in the loss of no more than 10%of the potential data points reported. The results of theseexperiments are discussed in sections.
Shirt-form PEM and MEM Samplers vs DichotFor all 10 test runs a nearly complete data set was
obtained for the shirt-form PEM, MEM and dichot samplers.The shirt-form PEM and MEM samplers were compared on a oneto one basis with the dichot. All three sampler types werelocated in the same test section. Mass concentration datafrom the PM-2.5 cut size PEM and MEM samplers compared verywell to dichot PM-2.5 measurements. Regression analysis forthe 2.5um PEM and MEM samplers are shown in Figure 16. Asshown on the concentration comparison graphs, the 2.Sum PEMand MEM samplers closely approximated the one to one line ofperfect correlation to the dichot. Average concentrationsfor the 2.Sum cut size PEM and MEM samplers were 5.2% and6.4% higher than for the dichot samplers. High r values

74
Table 6. PM-2.5 Collocation Experiment Cone. ForDichot, MEM, and Shirt-form, Personal, and Free-standing PEM
Samplers
RUN * DICHOT MEM PEH-S/F PEM-PER PEH-FREE1 1205.43 1305.93 1194.44
1227,65 1207,41 1218.521202.22 1251.85
2 956.93 1045.87 1043.28847.98 978.04 977.07947,89 991.60 1002.91
3 1309.42 1407.17 1363.40 1344.941317.86 1283.76 1326.48
1289.03 1242.09
4 745.00 784.17 752.08 780.21756,67 714.58 741,67 730,21
762.08 721.88
5 783.85 858.54 842.09 847.34723.34 838,24 824.58 843.84762.84 839.64
6 238.52 254.81 346.30 313.52227,16 241.48 301.85 336,85224,69 266.67 342.59 309.26
7 287.41 343.33 366.67 336.11295.56 324.44 169.44 427.78276.30 375.56 366.67 372.22
8 410.67 469.33 430.00 516,67440.00 444.00 433.33 660.00404.44 472.00 470.00 493.33
9 368,71 431.63 410.71 448.98 428.57371.43 383.67 443.88 397.96 390.31349.66 396.94
10 347.78 378.33 350.00 385.42 375.00347.22 357.50 327.08 354.17 356.25319.44 375.83

75
Table 7. PM-10 Collocation Experiment Cone. For Dichot, MEM,Shirt-form, Personal, and Free-standing PEM Samplers
t DICHOT MEH PEH-S/F PEH-PER PEH-FREE1 1081.94 1179.18 1241,03
1048,67 1065,10 1303,991045,63 1075,47 1213,25
2 878,27 1404,75758,86 798,16 955.79786.39 871.81 1154.43
3 1151.93 1317.161161.20 1170.53 1492.26 1104.61
1104.08 1268.11
4 594.41 637.36 765,49 687.36584.26 592.36 819.65 689.44595,18 561,94 672,78
5 713.31 797,25 955,51 811.95695,46 744.72 946.76 843.46724.22 751.03 867.97
6 171.31 196.54 373.58195.51 205.43 388.40 295.80187.33 206.91 360.62 273.58
7 256,69 306,91 349,69 452.47268.51 276.91 391.36 380.25249.82 304.69 413.58 388.58
8 364.52 438.96 478.30 584.96343.23 380.30 538.30 441.53 •369,14 412.30 498.30 574.96
9 370,07 415.31 455.61 468.37 516.84345.36 398,98 442.86 447.96 496.43320.04 402.04
10 324.50 368.52 397.27 278.52 499.35333.04 333.52 380.60 430.60 478.52337.82 329.35
Note: The average dichot fine fraction (PM-2.5) wassubtracted from the total concentration measured by each PM-10 test inlet for direct comparison to the dichot coarse.

76
(a) SHIRT FORM PEM 2.5mii vs DICHOT FINE1.^ - .^--'11i- S/FPEM = 0.978*Df + 57 u^
f^o- i* = 0.977 a ^^^
1- o ^jX^E ,-.3 In - ^x%^in X) g,X^'cvj E 0.6- }^,''
5 HJ .
DX?3%
0.6-
D^^X^llw0.4- -rff^a-'''
- ^^^'
0-
O
f 1 1 1 1 1 1 1 1 —|—02
(b)
0.41.20.6 0.8 1
(Thousands)DICHOT FINE (ug/m3)
MEM 2.5um vs DICHOT FINE
1.4
F3 TD 1
tn C
w
2 H 0.8
UJ5 1^
MEM = 1.012*Df440.42
I*-0.990
0.6 0.6 1(Thousands)
DICHOT FINE (ug/m3)
1.2 1.4
Figure 16. Collocational comparisons of PM-2.5samplers.

77
indicate a very strong linear correlation of the test pointsat all concentrations tested. The Systat (Evanston, IL)statistics package was used to conduct the two sided t-test.Systat was used to test if the slopes of the regressionlines were statistically different from a slope of 1.0. Inboth tests the regression line could not be statisticallydistinguished from a slope of 1.0 at a p-value of 0.95.These results were expected in view of the work of otherresearchers (Kamens et al., 1988, Lioy et al., 1988) whoalso showed that earlier 2.5 PEM and MEM samplers correlatewell to the dichot. Small particles tend to follow the flowlines and were relatively easy to sample.
These results also tend to corroborate the results
attained by Turner and Hering (1987). Even at relativelyhigh mass loading, particle bounce from the oil-soakedsintered metal impaction surfaces did not appear to occur.Capillary action in the MEM and PEM samplers may have beenenhanced by smaller impacted particles and lowerd oilviscosity.
Comparisons of the dichot coarse fraction with the
resulting lOum PEM and lOum MEM sampler concentrations areshown on Figure 17. In order to directly compare the dichotcoarse fraction to each new PM-10 sampler, the average massconcentration computed for the dichot fine fraction (PM-2.5)was subtracted from the total concentration measured by eachPM-10 PEM and MEM impaction inlet.

78
(a) SHIRT FORM PEM lOum vs DICHOT COARSE_., ..JJ_ _
1.4- y• 1.2-
S/FPEM = 1.12*Dc + 118
E i« =--0.78 o >^ ''O 1s 1-
>^ <r 1•^ 1^ 1
^ CO»><^ ' 1
Hi a o.e- 5^ 'Cl u ./^ ^•^
5 B >/^° ''cc lE0 C
0.6- y/^ /u. _^ .'-'1:1h 0.4- rii>tPtn3 ^'tc ^ ^
XC/3 02-
0-"----r-—1--------1--------1--------1--------1--------1--------1--------1——I----------1----------1----------1----------1----------
(b)
0.2 0.4 120.6 0.6 1
(Thousands)DICHOT COARSE (ug/m3)
MEM lOum vs DICHOT COARSE
1.4
"
<" 1
1.4 -^^ 1
- MEM = 1.024*Dc 425.2 1
1.2- y. x* = 0.9B l^'°
•»-
^/^f
D '- 1-. «
>%'
' T) .
^i 0.6-
o ^'- o vr^
lu C0.6- y^
10.4 -
0.2-^
y-'X'A
0- ^—1--------1--------1-—1------------------------1-------------------------1--------------------------1-------------------------1--------------------------1--------------------------1——I--------------1--------------1 ' 1-------------102 OA 0.6 0.6 1
(Thousands)DICHOT COARSE (ug/m3)
12 ^A
Figure 17. Collocational comparisons of PM-10 samplers,Dichot (PM-2.5) average subtracted from PM-10 inlet total.
79
In contrast to the PM-2.5 PEM and MEM inlets which had
intercepts less than or equal to 57ug, and r^ values greaterthan 0.97, indicating consistent sampling over all aerosolconcentrations tested, the lOum PEM did not compare as wellto the dichot. The average concentrations for the lOum cutsize PEM samplers were 31.5% higher than those for thedichot samplers. The lOum PEM versus dichot regressiondata, shown in Figure 17a, yielded an intercept equal to118ug. The slope of the lOum PEM regression line, however,was not found to be statistically different from 1.0 at a p-value of 0.95. This may be due to more variability of thedata points at higher concentrations.
One explaination for the scatter may be particle bouncefrom the impactor plate. One would expect particle bounceto result from high particulate loading on the impactionplate leading to an inability of the oil to coat theincoming particles. However, if loading alone was the onlyparameter which could cause particle bounce then it is
logical that the 2.Sum samplers would display this effect toa larger degree than lOum samplers because significantlymore material was impacted per unit time. The size of theimpacted particulate material may have inhibited the abilityof the oil, held in the sintered metal surface, to flow ontothe impacted particles. The lOum PEM design, unlike the MEMdevice, allows full exposure to incoming large particles.As large particles pile up on each other, the interstitialspace created between them must be small enough to provide

80
the driving force necessary to cause the oil to flow betweenthe particles surfaces by capillary action (Adamson, 1976).On the day in which the lOum PEM data exhibited the greatestvariability above the regression line it was noted that thetest chamber temperatures averaged only 14.3°C, lower thanon any other sampling day. The particle generation rate wasalso significantly increased at the end of that test run.If particle bounce or blow off did occur in the lOum PEMdevices it appears that this effect may have been enhancedby relatively high loading of large particles and decreasedoil viscosity due to lower temperatures.
The relatively high intercept seemed to indicaterecurring over sampling. The explanation for the oversampling became apparent when the cut size of the PM-10 PEMunits used in this study was re-evaluated and found to havean effective cut size of 10.5 um (Wiener, 1989)
The lOum MEM coarse sampler, however, showed excellentcorrelation to the dichot (see Figure 17b). The slope ofthe regression line was not significantly different from aslope of one (p=0.95) and the intercept was relativelysmall. The average concentrations for the lOum cut size MEMsamplers were 7.5% higher than those for the dichotsamplers. The hooded entrance port on the MEM devices mayhave acted similarly to the inlet of the dichot inrestricting the entrance of very large particles.
Dichot specifications estimate wall losses within thedichot to be roughly 1% near the 2,5um particle size range.

81
Potential losses to the walls of the MEM and PEM samplers isnot known at this time. The consistent slight under
sampling of the dichot sampler relative to the PEM and MEMsamplers may be due in part to particulate loss to the wallsof the dichot unit (Inhalable Particle Network Operationsand Quality Assurance Manual, 1983).
Free-standing PEM versus Shirt-form PEM Samplers
Experiments using free-standing PEMS were conductedduring runs 6,7,8,9 and 10. The small number of samplesinhibits meaningful statistical analysis. However, trendsin the data collected were evaluated. Free-standing PEMswere associated with PEM samplers placed on shirt-forms inthe test zone; thus 1:1 comparisons were made betweenindividual samplers. The analysis was based on massconcentration ratio of each free-standing PEM sampler to thethat of the corresponding shirt-form mounted PEM sampler.During run 6 it was determined that a 6-10% decrease in thedesign flow rate of 4.0Lpm had occurred. During theremaining 4 runs flow rates were adjusted to 4.0Lpm for bothfree-standing and shirt-form PEMs using a calibrated massflow meter.
Free-standing lOum PEMs operated at the decreased flowrate showed an average reduction in mass concentration ofabout 25% compared to lOum shirt-form samplers. Thisappears to have been caused by the reduced mass sampled.Free-standing lOum PEMs operated at flow rates equal to the

82
flow rate of shirt-form lOum PEMs, however, showed a generaltendency to sample higher than similar samplers placed onshirt-forms. Free-standing PEM samplers exceeded a massconcentration ratio of 1.0 versus the shirt-form PEMs for70% of the data points. The average mass concentrationratio for all the samplers was 1.12. This suggests that anegative bluff body effect does occur with the use of thelOum PEM sampler. The bluff body essentially blocks orchanges a portion of the capture flow field which isgenerated around the sampler. The blockage reduces thevolume of the flow field velocities capable of acceleratinga particle enough to capture it. The bluff body may alsocause particulate to change direction as the air movesaround the object (Chung et al., 1987).
Free-standing 2.Sum PEM samplers operated at the lowerflow rate resulted in a reduced average mass concentrationratio of 2.5%, however, the results were somewhatinconclusive. Two of the ratios indicated 10% lower resultsand one ratio was 11.6% higher. Insensitivity to flow ratein the fine fraction was again noted. Comparisons ofpersonal 2.5um PEMs operated at equivalent flow rates alsoresulted in mass concentration ratios exceeding unity for70% of the data points. The average increase for all thedata points was 23%. One ratio value exceeded 2.5.Excluding this point, the average mass concentration ratiowas 1.09.

83
Both PM-10 and PM-2.5 data sets display a negative
bluff body effect for PEM devices placed on the manikin.
This effect was increased for lOum PEM samplers. This was
expected based on the work of other investigators (Beaulieu,
et al., 1980; Chung et al., 1987; Vincent,1986) who have
shown that larger particles tend to be more difficult to
sample and do not follow the flow field as well as smaller
particles. These data suggest that samplers worn on a
manikin or person may limit the concentration of larger
particles at the entrance to the sampling device.
PEM Samplers on People versus Shirt-form PEM Samplers
Experiments using PEMS placed on participants (personal
PEMs) were conducted during runs 3,4,5,9 and 10. Again, the
small number of samples inhibits meaningful statistical
analysis, although data trends were evaluated. Personal
PEMs were not directly associated with samplers within the
test zone. Thus, analysis were based on the mass
concentration ratio of each personal PEM to the average
value of the shirt-form mounted PEMs for that run. During
runs 3,4 and 5, it was determined that the long 6mm sampling
lines used for the personal PEMs caused an in line pressure
drop resulting in a 6-10% decrease in the design flow rate
of 4.0Lpm. During test runs 9 and 10 flow rates were
adjusted to 4.OLpm for both personal and shirt-form PEMs
using a calibrated mass flow meter.

84
Personal lOum PEMs operated at the decreased flow rateshowed an average reduction in mass concentration of about12% when compared to lOum shirt-form samplers. This wasprobably caused by the reduced mass sampled. Personal lOumPEMs operated at flow rates equal to the flow rate of shirt-form lOum PEMs, however, show quite good agreement. Threeof the four data points were within +/-10% with an averagemass concentrations within 3.7% of the shirt-form lOum PEMs.The fourth data point was approximately 50% lower.
Personal 2.5um PEM samplers operated at the lower flowrate had an increase in average mass concentration of about2% compared to the 2.Sum shirt-form samplers. This slightincrease may have been caused by an increased effective cutsize due to the lower flow rate combined with a relativelyhigh percentage of particles near this size range. Personal2.Sum PEMs operated at equivalent flow rates resulted in anaverage of 4% higher mass concentration than those 2.SumPEMs operated on shirt-forms. But in this case theseresults were not considered important. 1 of the 4 datapoints strongly influenced the average value (table 5, value385.42). The mass concentration ratios of the remainingthree values did not exceed +/-7% and thus were consideredessentially equivalent. These data suggest that for thisexperiment 2.Sum PEM samplers were rather insensitive tovariations in flow rate. As with the lOum samplers theselimited data also suggest that shirt-form manikins may, as

85
used in this study, adequately represent human beingswearing the PEM devices.
Correlation Between Like Samplers
Similarity between like samplers during a single testrun was assessed for all 10 test runs. Uniformity ofconcentrations between like samplers during eachexperimental test run was calculated. The ratio of theindividual sampler to that of the average value of thecombination of like samplers during a single experiment wascomputed using the following equation:
Absolute value[l-(Sj^/Sg) ]*100 (eq. 3)Where:
Sj^ = Mass cone, of an individual sampler (ex. testrun 1, Value 1 of 3, shirt-form lOum PEM)
83= Average mass cone, of all like samplers (ex.test run 1, mean value of samplers 1, 2, and3, shirt-form lOum PEM)
The ratio value was subtracted from unity and theabsolute value of the percent difference computed. Themean, variance and standard deviation of the percentdifference for each sampler type over all 10 sampling runswere also computed. The results of this test for PM-2.5 andPM-10 samplers are presented in tables 8 and 9 respectively.
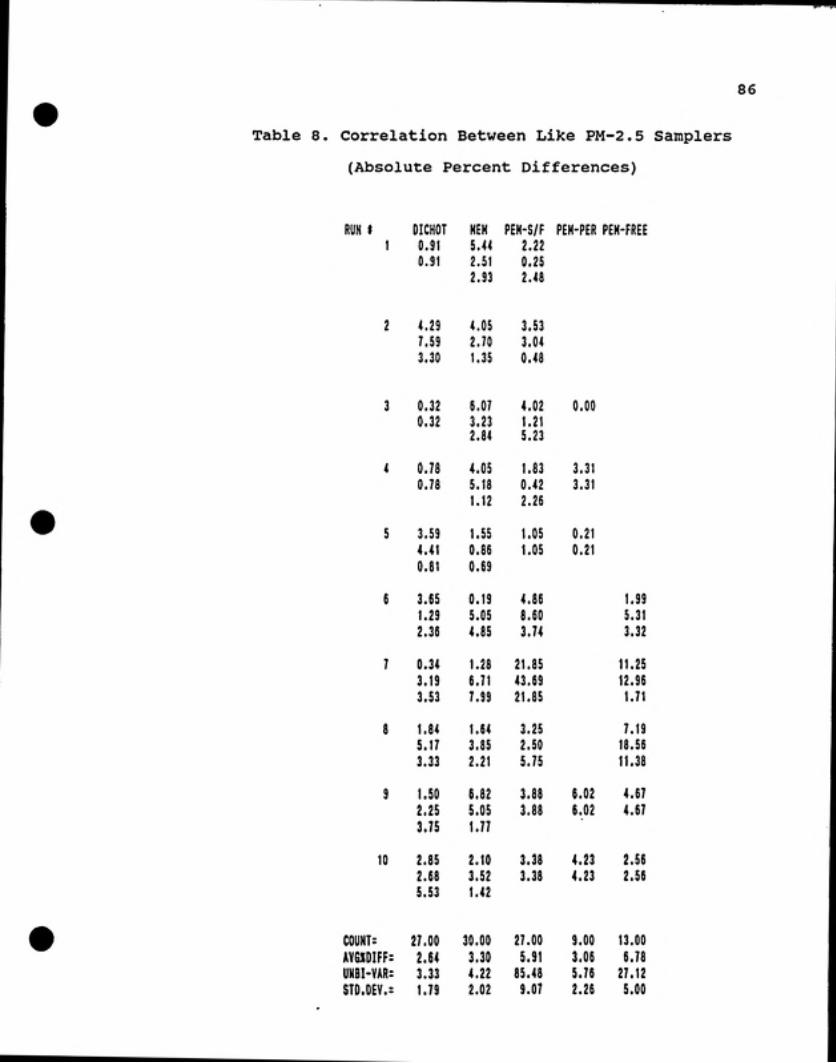
86
Table 8. Correlation Between Like PM-2.5 Samplers(Absolute Percent Differences)
RUN i1
DICHOT0.910.91
HEH5.442.51
2.93
PEM-S/F2.220.25
2.48
PEH-PER PEH-FREE
2 4.29
7.593,30
4.052,70
1.35
3.533,040.48
3 0.320.32
6.073.232.84
4.021.215.23
0.00
4 0.780.78
4.055.18
1.12
1.830.42
2.26
3.313.31
5 3.594.41
0.81
1.550.86
0.69
1.051.05
0.21
0.21
6 3.651.292.36
0.195.054.85
4.868.603.74
1.995.31
3.32
7 0.343.193.53
1.28
6.71
7.99
21.85
43.69
21.85
11.2512.961.71
8 1.845.17
3.33
1.643.852.21
3.252.50
5.75
7.19
18,56
11.38
9 1.50
2.253.75
6.825.051.77
3.88
3.88
6.026.02
4.67
4.67
10 2.85
2.685.53
2.103.521.42
3.383.38
4.234.23
2.562.56
COUNT:AVGXDIFF:UHBI-VAR:STD.DEV.:
27.002.643.33
1.79
30.003.304.22
2.02
27.00
5.9185.489.07
9.00
3.065.76
2.26
13.00
6.7827.125.00

87
Table 9. Correlation Between Like PM-10 Samplers
(Absolute Percent Differences)
RUN » DICHOT HEM PEH-S/F PEH-PER PEH-FREE1 2.19 6.56 0.94
0.95 3.75 4.09
1.24 2.81 3.15
2 3.40 19.89
1.78 6.03 18.42
1.78 2.64 1.47
3 0,40 10.01
0.40 2.23
7.78
8.12
8.12
0,00
4 0,53 6.72 1.71 0.15
1.19 0.81 8.90 0.15
0.65 5.91 10.61
5 0.33 4.31 3.48 1.90
2.19 2.57 2.53 1.90
1.86 1.74 6.00
6 7.26 3.16 0.16
5.84 1.22 3.79 3.90
1.41 1.95 3.63 3.90
7 0.64 3.63 9.14 11.14
3.94 6.50 1.68 6.60
3.30 2.88 7.46 4.55
8 1.55 6.93 5.28 9.57
4.38 7.36 6.60 17.27
2.83 0.43 1.32 7.70
9 7.22 2.43 1.42 2.23 2.01
0.06 1.S9 1.42 2.23 2.01
7.28 0.84
10 2.20 7.19 2.14 21.45 2.13
0.38 2.99 2.14 21.45 2.13
1.82 4.20
COUNT: 28.00 30.00 27.00 9.00 12.00
AVGXOIFF: 2.34 4.02 5.32 5.72 6.08
UNBI-VAR: 4.79 6.17 24.54 80.37 22.01
STD.OEV.: 2.15 2.44 4.86 8.45 4.49

88
Correlation between the three dichots, which wereplaced the greatest distance apart of any sampler type,consistently represented the lowest average percentdifference and least variation for both the coarse (PM-10)and fine (PM-2.5) fraction data. Thus, the greatestprecision was observed with the use of the dichot sampler.The highest variability occurred among the lOum PEM devices,with average differences and standard deviations of 5.32,4.86; 5.72, 8.45 and 6.08, 4.49 for the shirt-form, personworn and free-standing lOum PEMs respectively. The meanvariability between any type of like sampler over allsampling days did not exceed 6.8%.
Measurement uniformity between like samplers during thesame test run may be due to several experimental variables.It may indicate the manufacturers ability to consistentlyproduce the sampler or the quality of care with which theexperiments were conducted. It may show filter or sampleloss to contacted surfaces, variations in flow rates,weighing precision or any number of other potentialinfluences on the experimental outcome. But mostimportantly, in this study, it demonstrates the degree ofuniformity of the particle mass and size distributions towhich the samplers were exposed. The results of theseinternal control tests strongly support the conclusions ofthe test zone characterization experiments which indicatedthat particle mass and particle size distribution within thetest zone were uniform.

89
SUMMARY, CONCLUSIONS AND RECOMMENDATIONS
Summary
This study was designed to compare new PM-10 and PM-2.5
inertial impaction sampling inlets to a collocated referee
sampler. All the samplers were exposed to a homogeneousaerosol in a well mixed test chamber. This research
required that two types of experiments be conducted. First,
a characterization experiment to determine particle mass andparticle size distribution in a designated test zone within
the test chamber. Second, collocation experiments comparing
PM-10 and PM-2.5 concentrations measured using the newinlets to PM-10 and PM-2.5 concentrations measured with the
Andersen dichotomous sampler (dichot).
The experiments were conducted m a large 193.7m smog
chamber located 18 miles south of the University of North
Carolina at Chapel Hill. In both the characterization and
collocation experiments, Fine A.C. Test Dust was
continuously injected into the chamber and the chamber
contents were continuously exhausted. Exhausting the
chamber limited the build up of fine particulates which tend
to remain airborne for long periods. The chamber mixing
fans were modified by using adjustable fan enclosures toreduce large scale air movement in the chamber while mixingthe chamber contents.

90
The characterization experiments utilized 3 evenlydistributed 5-stage Andersen Mark II cascade impactor unitsoperated at a flow rate of 28.3Lpm and 10, 37mm downwardfacing open-face filter cassettes operated at 4.0Lpm toassess the particle size and particle mass distributionswithin a designated test zone within the chamber. Threetest runs were conducted.
The average geometric mean for three impactors was3.Hum +/-0.33um and 3.05um +/-0.04um for runs #1 and #2respectively. The average geometric standard deviations forthe three impactors was 2.53 +/-0.11 and 2.47 +/-0.09 forruns #1 and #2 respectively. Data from 2 of the threecascade impactors operated on the third day were destroyed.
Good agreement was achieved between open face samplersduring all three test days. Utilizing all the availabledata to analyze the similarities in mass concentrations, theaverage C.V. was equal to 39.12%. The suspected outlier wasdropped because its value exceeded the mean value of run #1by more than 2.5 times the computed standard deviation.After dropping this point the remaining data yielded C.V.sequal to 5.33, 15.13 and 5.96 for runs #1, #2 and #3respectively and an average C.V. of 8.8%.
These results indicated a very similar particle sizeand particle mass distribution throughout the test zone areaover the 0 to greater than 7um cut size range sampled by the5-stage cascade impactor.

91
The collocation study was designed to compare the PM-10
and PM-2.5 concentrations between the dichot, MEM and PEM
samplers. The free-standing dichot instrument was chosen as
the referee sampler. The dichot has been used by the U.S.
EPA for large scale studies of ambient PM-10 and PM-2.5
(Hinton et al., 1984) and has been well characterized (Loo
et al.,1976). The MEM samplers are also designed to sample
in a free-standing orientation. Although the PEM devices
are typically placed on the front of a person's torso near
the breathing zone as a personal sampler, the PEM may also
be used as an area monitor in an unobstructed or spatially
free configuration. In the design of this research PEM
devices were placed on shirt-form manikins to simulate the
placement of the samplers on people. Additional comparative
investigations involving the placement of the PEM sampler in
a "static" or free-standing orientation and the placement of
the PEM samplers on human participants were also undertaken.
Participants in the study were informed of the purpose
and design of the experiment. Participants were required to
read and sign a UNC-CH Human Participant Consent Form prior
to taking part in the experiment. To minimize human
exposure to the test aerosol the participants and the
investigator wore NIOSH approved half mask respirators.
Ten experimental runs were conducted between January
and March, 1989. Particle mass and particle size
distributions were tracked using cascade impactors and open
face filter cassettes. The dichot, MEM and PEMs mounted on

92
shirt-forms, positioned in a free-standing orientation andplaced upon human participants were placed within the testzone. Each sampler operated during a single test run wassampled for the same time period -/+3 0 seconds. Totalsample run times varied from 7 5 to 240 minutes. PEMsamplers worn by human participants and those placed in thefree-standing orientation were not operated during everytest run due to the limited number of sampling ports. Allsamplers were operated at a height of 0.96 to 1.02 meterexcept the PEM devices on persons which varied in heightbased on human variability and differences due to theperson's positioning in either a sitting or standingposition. During the course of the experiments theparticipants remained seated the majority of time during thetest runs. In order to simulate activity of a person withina home, however, the participants were instructed to standand walk at a normal pace back and forth in front of thetest zone area for 5 minutes after each 30 minute seated
period during their test run.Dichot pump failure and contamination of some of the
PEM and MEM sampler units resulted in the loss of no morethan 10 % of the potential data points reported.
Regression analysis of the 2.5um PEM and MEM samplerscompared to the dichot closely approximated the one to oneline of perfect correlation to the dichot. High r^ valuesindicate a very strong linear correlation of the test pointsat all concentrations tested. The two sided t-test (p=0.95)

93
was used to test if the slopes of the regression lines werestatistically different from a slope of 1.0. In both teststhe regression line could not be statistically distinguishedfrom a slope of 1.0 at a p-value of 0.95. The averageconcentration of the PM-2.5 PEM and MEM samplers were 5.2%and 6.4% higher than the concentration of the dichotsamplers. These results were expected because particlesless than 2.Sum tend to follow the flow lines and are
relatively easy to sample.In order to directly compare the dichot coarse fraction
(2.Sum to lOum) to each new PM-10 (0 to lOum) sampler, theaverage mass concentration computed for the dichot finefraction (0 to 2.Sum) was subtracted from the totalconcentration attained by each PM-IO MEM and PEM impactioninlet.
The lOum shirt-form PEM did not compare as well to thedichot as the other samplers tested. The lOum PEM versusdichot regression data yielded an intercept equal to 118.The average concentration for the PM-10 PEM sampler was31.5% higher than that for the dichot sampler. The slope ofthe lOum PEM regression line, however, was not found to bestatistically different from 1.0 at a p-value of 0.95. Thismay be due to more variability of the data points at higherconcentrations. This scatter may have been due to particlebounce. The relatively high intercept seemed to indicaterecurring over sampling. The explanation for the oversampling became apparent when the cut size of the PM-10 PEM

94
units used in this study was re-evaluated and found to havean effective cut size of 10.5 um.
The lOum MEM coarse sampler, however, showed excellentcorrelation to the dichot sampler. The slope of theregression line was not significantly different from a slopeof 1.0 at a p-value of 0.95 and the intercept was relativelysmall. The average concentration of the PM-10 MEM samplerwas 7.5% higher than for the dichot samplers. The hoodedentrance port on the MEM devices may have acted similarly tothe inlet of the dichot in restricting the entrance of verylarge particles.
Data trends were examined comparing free-standing PEMsto PEMs placed on shirt-form manikins. Free-standing PEMswere associated with PEM samplers placed on shirt-forms inthe test zone; thus 1:1 comparisons were made betweenindividual samplers. The analysis was based on massconcentration ratio of each free-standing PEM sampler to thethat of the corresponding shirt-form mounted PEM sampler.
Free-standing lOum PEMs showed a general tendency tosample higher than similar samplers placed on shirt-forms.Shirt-form samplers exceeded a mass concentration ratio of1.0 for 70% of the samplers tested. The average massconcentration ratio for all the samplers was 1.12. Free¬standing 2.5um PEMs also showed a general tendency to samplehigher than similar samplers placed on shirt-forms. Ratioscomparing personal 2.5um PEMs operated at equivalent flowrates resulted in mass concentration ratios exceeding unity
95
for 70% of the data points. The average increase for allthe data points was 23%. This average was stronglyinfluenced by one ratio value which exceeded 2.5. Excludingthis point, the average mass concentration ratio was 1.09.This effect appears to be increased for lOum PEM samplers.The average mass concentration ratio for lOum PEM samplerswas 1.09. These data display a negative bluff body effectfor PM-2.5 and PM-10 PEM devices placed on shirt-forms.
Data trends were examined for PEMs placed on persons(personal PEMs) compared to those on shirt-forms. PersonalPEMs were not directly associated with samplers within thetest zone. Thus, analysis were based on the massconcentration ratio of each personal PEM to the averagevalue of the shirt-form mounted PEMs for that run.
Personal lOum PEMs showed quite good agreement withlOum PEMs placed on shirt-forms. Three of the four datapoints were within +/-10% with an average massconcentrations within 3.7% of the shirt-form lOum PEMs.Comparisons of personal 2.Sum PEMs to those placed on shirt-forms resulted in essentially equivalent sampling values.These rather limited data indicated that shirt-formmanikins, as used in this study, may adequately representhuman beings wearing the PEM devices.
Uniformity of concentrations between like samplersduring each experiment was calculated. The mean variabilitybetween any type of like sampler over all sampling days didnot exceed 6.8%. The dichot coarse and fine particle mass

96
concentrations consistently showed the least variability
between like samplers. The results of these internal
control tests strongly support the conclusions of the test
zone characterization experiments which indicated that
particle mass and particle size distribution within the test
zone was uniform.
Initial characterization experiments of new PM-10 and
PM-2.5 inlets have been conducted. The information gained
through these investigations is appropriate to represent
sampler performance under high mass loading conditions of
relatively coarse aerosols. It should not be presumed,
however, that the test inlets will perform equivalently
under field conditions. Complete characterization using
different aerosols should be pursued.
Conclusions
Conclusions which may be drawn from this research
include:
Results from the cascade impactors and open-face 37mm
filter cassettes used in the characterization study indicate
that a uniform aerosol distribution was achieved within the
test zone of a large, well mixed test chamber. The low
variability between like samplers used in the collocation
experiments also support this conclusion. The test
atmosphere was effectively utilized to challenge samplers
measuring PM-10 and PM-2.5.

97
The PM-2.5 MEM and PM-2.5 PEM samplers were shown to becomparable to the dichot. Average mass concentration ratiosof the PM-2.5 MEM and PM-2.5 PEM samplers were 5.2% and 6.4%higher respectively. This conclusion is supported byregression analysis yielding high r values and slopes notsignificantly different from 1.
The PM-10 MEM sampler was comparable to the dichot.The average mass concentration ratio of the PM-10 MEMsampler was 7.5% higher. As with the 2.5um PEM and MEMsamplers this conclusion is supported by regression analysisyielding a high r value and a slope not significantlydifferent from 1.
The PM-10 PEM sampler and dichot did not compare aswell as the other samplers tested. The average massconcentration ratio of the PM-10 PEM sampler was 31.5%higher. The slope of the regression line was not found tobe significantly different from 1 although scatter of datapoints at high aerosol concentrations may have produced thiseffect. An r value of only 0.78 was observed compared tor^ values exceeding 0.97 for the other inlets tested.Although the scatter noted at high concentrations may haveresulted from particle bounce, the consistent over samplingappears to have been caused by an actual effective cut sizeof 10.5um for the PM-10 PEM sampler.
Limited test data from both the 2.5 and lOum PEM inlets
suggest that shirt form manikins used in this study mayadequately represent human beings wearing the PEM devices.

98
Comparisons of both lOum and 2.Sum free standing PEM
devices to duplicate samplers placed on shirt-forms resulted
in average differences of 12% and 9% respectively. These
limited data suggest that a negative bluff body effect does
occur with the use of PEM samplers.
The samplers were rigorously tested against a challenge
aerosol. Field samplers exposed to smaller particle size
distributions may perform better.
The PM-10 and PM-2.5 PEM and MEM samplers show much
promise as a useful tool for size selective personal and
micro-environmental sampling. Industrial hygiene mass
concentration guidelines and standards are changing to
reflect the hazards of airborne particulate based on size
distribution (A.C.G.I.H., 1988). It appears that these
impactors may provide an inexpensive, portable and effective
means of single size selectively quantifying particulate
contaminants in the workplace as well as in the indoor
environment.
Recommendations
The following recommendations are made for further
study:
Further studies should be conducted to investigate the
apparent differences between shirt-form and free-standing
PEM devices.

99
Although most of the samplers tested were relatively
insensitive to particle mass loading effects, future chamber
studies should include lower particle mass concentrations.
Statistical analysis of the mass concentration
differences measured by the samplers could not be assessed
because effects could not be singularly ascribed to either
sampler design discrepancies or to different sampler
locations. Future studies should include rotating the
sampling devices into different positions within the test
chamber during each successive test run.

100
REFERENCES
Adamson, A.W., Physical Chemistry of Surfaces. John Wiley
and Sons, New York, 1976.
"Ambient Air Methods," in Quality Assurance Handbook for Air
Pollution Measurement Systems. 2, U.S. Environmental
Protection Agency, EPA-60G/4-77-027a., 1977.
American Conference of Governmental Industrial Hygienists,
Threshold Limit Values and Biological Exposure Indices
for 1988-1989. A.C.G.I.H., Akron, OH.
Bagnell, B., "Personal Communications," March 16, 1989.
Baines, W.D., Peterson, E.G., "An Investigation of Flow
Through Screens," Transactions of the A.S.M.E., 73., PP-
467-480, July 1951.
Beaulieu, B.J., Fidino, A.V., Arlington, K.L.B., Buchan,
R.M., "A Comparison of Aerosol Sampling Techniques:
"Open" versus "Closed-face" Filter Cassettes", A.I.H.A.
Journal. #41, pp. 758-765, October, 1980.
Camp, D.C., Van Lehn, A.L., Loo, B.W., "Intercomparison of
Samplers Used in the Determination of Aerosol
Composition," U.S. Environmental Protection Agency,
EPA-600/7-78-118, Research Triangle Park, NC, 1978.
Chung, K.Y.K., Ogden, T.L., Vaughan, N.P., "Wind Effects on
Personal Dust Samplers," Journal of Aerosol Science.
18, #2, pp. 159-174, 1987.
Committee on Industrial Ventilation, American Conference of
Governmental Industrial Hygienists, Industrial

101
Ventilation; A Manual of Recommended Practice, 19^^^
ed., A.C.G.I.H., Lansing, MI, 1986.
El-Shobokshy, M.S., Hussein, F.M., "Correlation Between
Indoor-Outdoor Inhalable Particulate Concentrations and
Meteorological Variables," Atmospheric Environment. 22.
#12, pp. 12667-2675, 1988.
EPA Procedure for Calibration of Dry Gas Meters Using LFEs,
EMSL/RTP-SOP-QAD-518, Rev. #0.December 5, 1980, Rev.
#0.
Fairchild, C.I., Tillery, M.I., Smith, J.P., Valdez, F.O.,
"Collection Efficiency of Field Sampling Cassettes,"
National Institute for Occupational Safety and Health;
U.S. Environmental Protection Agency, EPA-600/7-81-145,
Washington, D.C., August, 1981.
Fox, D.L., Sickles J.E., Kuhlman, M.R., Reist, P.C., Wilson,
Wm.E., "Design and Operating Parameters for a Large
Ambient Aerosol Chamber," J.A.P.C.A.. 25. #10, pp.
1049-1053, October, 1975.
Eraser, D.A., "Sizing Methodology," in The Industrial
Environment - Its Evaluation & Control, U.S. Department
of Health and Human Resources, U.S. Government Printing
Office, Washington, D.C., 1973.
Garrison, J.A., Goodman, R.G., "Development and Operation of
an Improved Turntable Dust Feeder," Unpublished
Manuscript, #E-85-3, Department of Environmental
Sciences and Engineering, School of Public Health,

102
University of North Carolina at Chapel Hill, October
28, 1985.
Harris, D.B., "How To Measure It Once You've Collected It,"Proceedings: Seminar on In-stack Particle Control
Device Evaluation. U.S. Environmental Protection
Agency, EPA-600/2-77-060, February, 1977
Harris, D.B., "Procedures for Cascade Impactor Calibrationand Operation in Process Streams," U.S. Environmental
Protection Agency, EPA-600/2-77-004 or NTIS PB-263623,1977.
Hinds, Wm. C., "Aerosol Technology, Properties, Behavior andMeasurement of Airborne Particles," New York, John
Wiley and Sons, 1982.
Hinton, D.O., Sume, J.M., Suggs, J.C., Barnard, Wm.F.,
"Inhalable Particle Network Report / Operation and Data
Summery (Mass Concentrations Only)," Vol. 1, April,
1979-December, 1982, PB85-148682, U.S. Environmental
Protection Agency, EMSL, Research Triangle Park, NC,1984.
"Inhalable Particle Network Operations and Quality AssuranceManual," U.S. Environmental Protection Agency, Office
of Research and Development, EMSL, Research Triangle
Park, NC, March, 1983.
Installation and Operation Instructions, Meriam LFE LaminarFlow Elements, 1985.
Kamens, R., Lee, C., Leith, D. "A Preliminary Study toCharacterize Indoor Particles in Three Residential

103
Homes," Final Report, PEI Inc., Subcontract #790-87,
Research Triangle Park, NC, March, 1988.
Kuhlman, M.R., "The Ambient Aerosol Research Facility:
Design Criteria and Validation," M.S.P.H. Technical
Report, Department of Environmental Sciences and
Engineering, University of North Carolina at chapel
Hill, 1974.
Lawes, G., Scanning Electron Microscope (SEM) and X-Ray
Micro-analysis. Analytical Chemistry by Open Learning,
A.M. James (ed.), John Wiley and Sons, New York, 1987.
Leith, D., "Personal Communications," March 15, 1989.
Lioy, P.J., Wainman, T., Turner, W., Marple, V.A., "An
Intercomparison of the Indoor Air Sampling Impactor and
the Dichotomous Sampler for a lOum Cut Size,"
J.A.P.C.A.. 38, #5, pp. 668-670, May, 1988.
Loo, B.W., Jeklevic, J.M., Goulding, F.S., "Dichotomous
Virtual Impactors for Large Scale Monitoring of
Airborne Particulate Matter," in Fine Particles, B.Y.H.
Lui (ed.), Academic Press, NY, 1976, pp. 315-350.
Lundgren, D.A., Paulus, H.P., "The Mass Distribution of
Large Atmospheric Particles," J.A.P.C.A.. 25, #12, pp.
1227-1231, December, 1975.
Marple, V.A., "Personal Correspondence," MSP Corporation,
Minneapolis, MN, August 15, 1989.
Marple, V.A., "Personal Communications," April 20, 1989.
Marple, V.A., Rubow, K.L., "Theory and Design Guidelines,"
in Cascade Impactor Sampling & Data Analysis." J.P.

104
Lodge, Jr., T.L. Chan (ed.)f American Industrial
Hygiene Association, Akron, OH, 1986.
McFarland, A.R., Oritz, C.A., Rodes, C.E., "Evaluation of
the NASN Cascade Impactor Ambient Air Monitor," Texas
A&M Air Quality Laboratory Publication, 3565/07/ARM,
June, 1979.
Mitchell, J.P., Costa, P.A., Waters,S., "An Assessment of an
Andersen Mark-II Cascade Impactor," Journal of Aerosol
Science, 19. #2, pp. 213-221, 1988.
Moss, O.K., Kenoyer, J.L., "Use and Misuse: Operating
Guide," in Cascade Impactor Sampling & Data Analysis,"
J.P. Lodge, Jr., T.L. Chan (ed.), American Industrial
Hygiene Association, Akron, OH, 1986.
Radar, D.J., Marple, V.A., "Effect of Ultra Stokesian Drag
and Particle Interception on Impaction
Characteristics," Aerosol Science and Technology, 4,
pp. 141-156, 1985.
Reist, P.C, Introduction to Aerosol Science. Macmillan
Publishing Co., 1984.
Solomon, P., Derrick, M., Moyers, J., Hyde, P., "Performance
Comparison of Three Samplers of Suspended Airborne
Particulate Matter," J.A.P.C.A.. 32, #4, pp. 373-375,
April, 1982.
Turner, J.R., Bering, S.V., "Greased and oiled Substrates as
Bounce-Free Impaction Surfaces," Journal of Aerosol
Science. 18, #2, pp. 215-224, 1987.

105
Vincent, J.H., "Methodology for Determining Aerosol Exposurein Work Places," in Aerosols. S.D. Lee, T. Schneider,
L.D. Grant, and P.J. Verkerk (ed.), PP. 185-201, LewisPublishers, Chelsea, MI, 1986.
Wilson, Wm.E.,Jr., Merryman, E.L., Levy, A., Taliaferro,
H.R., "Aerosol Formation in Photochemical Smog I.
Effect of Stirring," J.A.P.C.A.. 21, #3, pp. 128-132,March, 1971.
Wood, J.D., Birkett, J.L., "External Airflow Effects on
Personal Sampling," Annals of Occupational Hygiene. 22.,#3, pp. 299-310, 1979.

A-1
APPENDIX A
Impactor Theory
Dr. Virgil Marple of the University of Minnesota is
well known for his design and theoretical work on inertial
impaction devices. A brief overview of inertial impaction
theory as described by Marple, (1986) is presented here.
Inertial impactors function by capturing particle laden
air and accelerating it through a nozzle or jet. The
entrained particulate is directed toward an impaction
surface. Particles of sufficient aerodynamic diameter will
strike the surface and be impacted. Smaller particles will
follow the air flow streamlines and will not be collected.
This effect can be visualized in Figure A-1.
The efficiency of the impaction stage (single or
multiple) is typically described by SQRT(Stks#) on the X-
axis versus the % collection efficiency on the Y-axis. The
SQRT(stks#) is defined as the following:
SQRT(Stks)= SQRT(PpVoCDp2 / 9uW) (eq. Al)
Where,
Pp= particle density
Vo= average air velocity in the nozzle throat
C= slip correction factor
Dp= particle diameter
u= fluid viscosity
W= nozzle throat diameter (Marple, 198 6).

A-2
\\
I4-
NOZZLE
jETExrr
-Ky y > y- y^ -^ .- ^\^ y y.
I Trajectory of Trajectory of particleIMPACTXX impacted particle too smd to impactPU\TE
Figure A-l. Schematic diagram of a typical impactionstage showing particle trajectories and air flowstreamlines (from Marple and Rubow, 1986).

A-3
A theoretically perfect impactor would collect all
particles larger than a given aerodynamic diameter and noneof particles less than that size. Actual impactors have anaerodynamic cut size over a range of particle sizes. The
steeper the curve near the 50% efficiency range the sharperthe cut size of the impaction stage.
The Reynolds number (Re) is also a consideration in
understanding how an impactor operates. The Reynolds numberis a dimensionless ratio of inertial to viscous forces
acting on a particle as a fluid moves around it or it can be
applied to a fluid flowing inside a pipe. As the Reynoldsnumber increases flow becomes more turbulent.
In 1980 Virgil Marple of the University of Minnesota
used high speed computers to conduct the first comprehensive
theoretical study to characterize single jet impactors based
on three dimensionless parameters: Re, jet-to-impaction
surface distance, S/W, and width of the impactor jet throat,
T/W. In 1985, Rader and Marple improved their theoretical
model. The results of this study are plotted in Figure A-2.
These collection efficiency curves appear to indicate
that collection efficiency is relatively insensitive to
changes in Re between 500 and 10,000. However, at lower Re,
the sharp cut size characteristics of the impactor arerapidly lost. Collection efficiency also appearsinsensitive to jet to plate distances between ratios of 1
and 5. Case studies indicate that theoretical design
parameters used to create impaction devices agree quite well

A-4
for aerodynamic size cuts less than 10 um in size.Theoretical parameters used for larger cut sizes yieldempirical data indicating the actual cut size issignificantly smaller than theoretical predictions. Theoryis used to approach the design parameters actually neededfor a specified cut size. However, in order to produce animpaction stage of exactly the correct cut size severaliterations of the initial design must be produced andsubsequently tested to determine the true cut size (Marple,1986).

A-5
1.0
.8
----\-------r
Re = 3000
>- 6
.2
ROUNDS/W(T/W = 0
5020I 0
05^
JJ
HHIIIIII
IIll
/"
V RECTANGULARll S/WlT/W'l)
-30-1 5-0.5
_l_________i_
A .9 1.0 I.I
VsT
(a.) Effect of jet to plate distance (Re = 3000)
1.0
;: .4
.2
ROUND
3000>v.-----10,000 '«
-I------------1-
RECTANGULARRelS/W = l.5,T/W = l)
--------10------100-----500— 3000
-10,000
1.0 I.I 1.2 1.3 1.4 1.5
Vs7
1.2
1.6
(b.) Effect of jet Reynolds number
Figure A-2. Revised impactor efficiency curves forrectangular and round impactors showing effects of jetto plate distance S and jet Reynolds number Re (fromRader and Marple, 1985).

B-1
APPENDIX B
Calibration, Quality Control and Field Use of Instruments
Calibration of Rotometers and Mass Flow Meter
The Mass flow meter and the rotometers used to indicate
flow rates for the MEM and PEM units were calibrated using
Laminar Flow Elements (LFE,s). The LFEs were used in
accordance with standard EPA protocols (EPA Procedure for
Calibration of Dry Gas Meters Using LFEs; EMSL/RTP-SOP-QAD-
518, December 5, 1980, Rev. # 0). The LFEs,s were placed at
the open end of the system. Three meters of surgical tubing
were placed between the LFE and the instrument being
calibrated. A valve placed immediately behind the mass flow
meter or rotometer controlled the flow of air through the
system. The vacuum source was supplied by an electric air
pump was connected to the valve by a 0.6 meter length of
hose. Five to seven LFE pressure readings and the
accompanying instrument or rotometer readings were recorded
spanning the entire useful range of the flow indication
instrument. LFE pressure readings were interpreted by an
EPA produced computer program. For each instrument the LFE
determined flow rates were plotted against the rotometer or
mass flow meter readings. The calibration curve was printed
out on a Hewlett-Packard plotter. An example of the
calibration curves produced is shown in Figure B-1.
Rotometers used to control 5 and lOLpm samplers were rated

B-2
at +/-5% of full scale value. Thus the potential flow rate
error assciated with these instruments was +/-0.25 (0.5%)
and +/-1.18Lpm (11.8%) respectively. Potential flow rate
error was minimized, however, by using a non-fluctuating
vacuum source and LFE prepared calibration curves.
Calibration of Cascade Impactors
Calibration curves for the three cascade impactor units
were produced exactly as those for MEM and PEM flow meters
with one exception. The leak checked cascade impactor unit
to be used with the rotometer and valve unit was placed in¬
line between the LFE and the rotometer. This was done in
order to account for the relatively high pressure drop
expected across the cascade impactor unit. An example of
the calibration curves produced is shown in Figure B-2.
Rotometers used to control 28.3Lpm cascade impactors were
rated at +/~5% of full scale value. Thus the potential flow
rate error assciated with these instruments was +/-2.3 6Lpm
(8.3%). Potential flow rate error was minimized, however,
by using a non-fluctuating vacuum source and LFE prepared
calibration curves.

DWYER FLOWMETER # 4-R
I—
cc
LINERR:R-
B-r"
0 5 10 15ROTOMETER READING (CENTER OF BRLL) SCFH
(a) Rotometer Calibration Curve (4Lpm)DWYER FLOWMETER # 10-R
Y-RX+B.4433
.28a8-3.339147
a.
LINERR:R-
Y-RX+B.4168
B- 1.1851
r- .9968SS
ROTOMETER READING (CENTER OF BALL) SCFH , . ^(b) Rotometer Calibration curve (lOLpm)
Figure B-1. Linear regression calibration curves for a4Lpm PEM and lOLpm MEM instrument.

B-4
z:
DWYER FLOW METER � CI-R
LINERR: Y-flX+B
n- .4144
B- .7270
r- .336833
0 10 20 30 40 50 G0 70 80 30 100ROTOMETER READING (CENTER OF BALL) SCFH
Figure B-2. Linear regression calibration curve for a28.3Lpin Cascade Impactor instrument.

B-5
Calibration of Dichotomous Samplers
Calibration curves for the three cleaned and
reassembled dichot units were prepared by Mr. Bobby Edmonds
of the U.S. EPA Environmental Monitoring Systems Laboratory,
Research Triangle Park, NC. The dichots were leak checked
and calibrated according to protocols described in the
Inhalable Particle Network Operations and Quality Assurance
Manual, Section 5, U.S. EPA, 1983. Calibration curves and
fine and coarse set points were produced and used in the
field to set the flow rates on the dichot instruments. An
example of the calibration curves and set points are
provided in Figure B-3.
Quality Control
Media Preparation and Sample Handling
As a preface to discussing specific samples, it should
be noted that at all times, the sample media was handled
with plastic or metal forceps only. All media was
conditioned in an environmentally controlled weighing
chamber at 20°C +/-2°C and 40% +/-!% relative humidity forat least 48 hours before tare or final weights were taken.

B-6
(a)
a.
UJ
V)
CDX
E.
INHALED PAflTICULATE NETWORK
COARSE ROTAMETER CALIBRATIONJ.U-
sji»»tia/ • o.zsse?tattrceptU • O.SSB^ ..•;^ I
2.9- cotffieimitiv » o.mna . •\^'^^'' I r-*x*B ^^><<^' t
2.0-
NXNTSI KTPOIMT- «.! . J!><^^^ I1.3-f ^^^<^' SITE a^iiaoflOB 1
• -jir^' CALiB.aY„flEE T
. •>^<^ S/N 503 11.0^: .--^-^^ EPA# 178886 1
rv>^^<^' DATE 7/ 11/88 I0.5iC-'
i
I SUMMER 23.6 C WINTER B.l C Ip
pAVERAGE PRESSURE: 750.7 mmHal
1 - ------------------1 t t > It 1---------1---------1 ^---------V1.0 2.0 3.0 4.0 5.0 8.0 7.0 8.0
ROTAMETER » SQR (T/P). CAL TfiP
8.0 10.0
(b)
20.0
INHALED PARTICULATE NETWORK
TOTAL ROTAMETER CALIBRATION
1B.0> SlofitU • I.ii3i7
IntireeptlU • o.sisa
18.0- ' CMffleimttV • 0.S9S63
14.0
r-AX*B
UJ
en
12.0
t-z
10.0'
8.0
8.0
' #-J
4.0 ' ; .--y^^2.0 • ^v/T"
MIKTEK KTPOIKT- IS.a
auMO) KTTOIMT- il.S
SITE 34USQQP6CALIB.BY BEg
S/N 503EPA# 179886
DATE 7/ 11/88SUMMER 23.8 C WINTER 5.1 C
AVERAGE PRESSURE: 750.7 moiHg
1.0 2.0 3.0 4.0 S.O 8.0 7.0 8.0 9.0 10.0
ROTAMETER » SQR (T/P). CAL T8P
Figure 3-B. Coarse and Total Rotometer CalibrationCurves For a Dichotomous Sampler.

B-7
Filter Media
Filter preparation and handling techniques were adaptedfrom the U.S. EPA document, "Inhalable Particle NetworkOperations and Quality Assurance Manual, Section 4.2, March,1983, U.S. EPA, Environmental Monitoring Systems Laboratory,Research Triangle Park, NC (IPN-QA/QC). All filter mediaused for gravimetric determination including those for theopen face, PEM, MEM, Sierra Andersen Dichotomous Samplersand the Andersen Mark II Cascade Impactor back up filterwere handled identically. Prior to the equilibration periodeach filter was placed individually in a 40mm petri dishwith the top partially opened. The petri dishes were placedhorizontally on a plastic rack and covered by a single layerof lint free paper. The tare and final weights weremeasured using the Mettler balance system. Theidentification number for each filter was recorded on the
weighing data sheets and on the petri dish when the tareweights were measured. After weighing, the collection mediaremained in the petri dishes and were transported to thelaboratory adjacent to the test chamber where they werestored until used. Blanks for each filter type were handledexactly as those used for sampling were. They were loadedinto the appropriate sampler type and then removed andplaced back in their petri dish.

B-8
Cascade Impactor Foil Substrates
Andersen Mark II Cascade Impactor foil substratesrequired a coating of adhesive material to minimize particlebounce. A low viscosity oil was used to coat one side ofeach substrate. Andersen Mark II cascade impactor foilsubstrates were placed on a clean paper surface and coatedthree times with light weight silicone oil The oiled foilsubstrates were then placed into a 100 millimeter petridish. Moss and Kenoyer, (1986) describe a drying and weightstabilization used by Harris, (1977). Their process calledfor coating the substrate with a solution of 20% grease intoluene, followed by heating to 2 04°C for one hour anddesiccation for 12 hours. This experiment used a similarprocess. However, slight variations in the stability of thesubstrate weight were acceptable due to high mass loadingsexpected. Each oiled substrate was exposed to infraredradiation for 3 minutes by placing the substrate 7cm belowan 2 0.3cm diameter heat lamp. The substrate and petri dishwere then placed in the EPA weighing room for 48 hours priorto tare weighing.
The tare and final weights were measured using theRite-Weight balance system. The identification number foreach substrate was recorded on the weighing data sheets andon the petri dish when the tare weights were measured.After weighing, the collection media remained in the petridishes and were transported to the laboratory adjacent tothe test chamber where they were stored until used. Blanks

B-9
for each substrate were handled exactly as those used forsampling. They were loaded into an impactor and thenremoved and placed back in their petri dish.
Rite Weight Balance System
Quality Assurance protocols for weighing cascadeimpactor substrates were adapted from U.S. EPA documentation(Vol. 2, EPA Ambient Air Methods, section 2.11 of theQuality Assurance Handbook for Air Pollution MeasurementSystems and IPN-QA/QC). Prior to weighing any group ofsubstrates the balance was zeroed. A 200mg "S" class weight(Fisher Scientific, Pittsburgh, PA) was added to the balancepan and a reading taken. "S" class weights are traceable tothe National Bureau of Standards and have a tolerance of +/~l.Oug. A reading of 200mg +/-100ug (0.05%) was attained.
A non-oiled aluminum foil collection substrate remained
in the EPA weighing room to serve as a laboratory blank.Prior to weighing any of the substrates used in the studythe non-oiled lab blank foil substrate was weighed and thevalue recorded. After each group of five substrates hadbeen weighed the lab blank substrate was re-weighed. If theweight of the laboratory blank exceeded +/- 20ug of itsprevious value, the weights of the last five oiledsubstrates were deemed invalid and were re-weighed. Theresults of 34 measurements produced a mean weight of358.78mg and a Standard Deviation of O.Ollmg.

B-10
It was required that the balance show a readout of0.00000 grams before each substrate was weighed. In orderto remove possible static charge which may have existed onthe substrate, each substrate was slowly moved between twopolonium 210 "static master" anti-static units placed 5cmapart for 15 seconds (Static Master directions, 1988). Atthe end of each weighing session 10% or more of thesubstrates were re-weighed. It was required that the re-weighing produce results within +/- 30ug of the originalweighing. If this condition was not met, the weighingsession for that group of substrates was deemed invalid andthe process was repeated. EPA QA procedures required thatthe QA supervisor conduct the re-weighing procedure (EPAAmbient Air Methods). However, I frequently performed myown QA re-weighing measurements.
Field blanks were used to assess the effects of
handling, transport and environmental changes on the oiledfoil substrates. Gross contact of the oiled surface to anyobject destroyed the integrity of the sample weight.Although great care was exercised to insure that the petridishes did not overturn field use did show some effect. The
field blank foil substrates were handled and weighed exactlyas oiled substrates to be uspd as collection media. The
field blank weight change results are shown in table B-1.

B-11
Table B-1.
Weight Change in Field Blanks (ug)
Sampler Maximum Minimum Mean Std. Dev. Num
Dichot 15 -5 4.87 7.16 10
MEM 11 -40 -6.67 16.51 10
PEM 23 -11 4.89 9.43 10
Open-face 103 -18 26.75 38.81 9
Cascade Foil 40 -170 -37.00 68.81 10
Pallflex 16 -2 4.40 4.60 10

B-12
Mettler Balance System
QA procedures used with the Mettler balance system were
adapted from the IPN-QA/QC document. The QA procedures used
were applied to all gravimetric filter media used in thisstudy including 37mm, 2 micron pore size Teflo Teflon
filters with an olefin ring used with the PEM, MEM anddichot samplers, 37mm, Sum pore size cellulose acetate ester
filters used with the open faced samplers and 47mm Pallflexfilters used as back up filters for the Andersen Mark II
Cascade Impactor units. After equilibration the filters weretare and final weighed on a three section Mettler balancesystem consisting of a ME 22 balance unit, BE 22 balance
control unit and BA 25 digital balance display unitaccording to procedures outlined in IPN-QA/QC Section 4.2.1.and 4.2.2. In addition two Static Master anti-static
devices were placed beneath the weighing stirrup inside thebalance unit to control filter static charge (Harris, 1977).Internal quality control procedures as outlined in IPN-QA/QCsection 4.2.3.1 were conducted. Prior to weighing any
filters the balance was zeroed and then spanned using an
internal lOmg calibration weight. A laboratory blank testfilter was weighed prior to weighing any experimentalfilters. The laboratory filter blank was then re-weighedafter each 5 filters. If the laboratory blank filter weight
had changed by more than 4ug relative to its last weighingthe filter weights measured between the two blank filterweighing were deemed invalid and were re-weighed. The

B-13
results of 92 measurements produced a mean laboratory filter
weight of 107.071mg and a standard deviation of 0.005276mg.
After weighing each group of 10 filters a span check was
made. Span readings of lOmg +/-2ug were acceptable.
The "zero" number, experimental filter number and total
filter weight were recorded on a balance record sheet. The
milligram counter weight for each tare weighed filter was
recorded on the underside of the petri dish top. This was
done so that the final weights would be based on the same
mechanical counter weight setting as the tare weights.
Between each filter weighing the balance was brought to a
steady state and the "zero" number was recorded and applied
to the next filter weighed. The "zero" was added or
subtracted from the recorded weight to compensate for "zero"
drift common to electronic balances. "Zero" checks between
each weighing were performed. "Zero" drift of up to Vug was
acceptable.
At the end of each weighing session 10% or more of each
filter type were re-weighed. It was required that the re-
weighing produce results within +/-6ug of the original
weighing. If this condition were not met, the weighing
session for that group of substrates was deemed invalid and
the entire group of filters was re-weighed. IPN-QA/QC
procedures required that the QA supervisor conduct the re-
weighing procedure. However, I frequently performed my own
QC re-weighing measurements.

B-14
Field blanks were used to assess the effects of
handling, transport and environmental changes on thedifferent filters used. The field blank filters were placedin the samplers and then removed and returned to their petridishes. Otherwise field blanks were handled and weighedexactly as those used as collection media. The weightchange mean and standard deviation results of the fieldblanks are presented in table B-1.
Field Use of Instruments
Field use protocols of the MEM and PEM inlets wereadapted from EPA Method lAOlO, (March 1989). The only majordifference was that for this research, the impaction plateswere not placed in a sonic water bath and baked dry. Thisstep was unnecessary because all external surfaces werewiped down with acetone between test runs and the impactionsurfaces were scraped clean with a razor blade prior to there-application of mineral oil. The media, identified by itslabel, was loaded into the proper samplers. Filter, samplerand location were recorded on test run data sheets. The
following represents the daily sequence of events:
1. A clean dry work area was established at the testchamber laboratory.

B-15
2. Mineral oil was added to PEM and MEM samplers if
needed so that the sintered surface was saturated but would
not drip or run.
3. Dichotomous sampler and MEM filters were placed into
plastic snap ring cassettes for mounting in the samplers and
replaced into their petri dishes.
4. The media, as identified by the label on the petri
dish was loaded into the samplers. The media and samplernumbers were recorded on data run sheets.
5. Loaded MEM, PEM and Cascade impactor sampler units
were leak checked orally. If any leakage was noted the unit
was adjusted so that no leak was detectable.
6. MEM and PEM and 37mm open face samplers were set up
in the test chamber and connected to rubber tubing connected
to the manifold system.
7. Filter cassettes were loaded into the dichotomous
samplers. The filters and sampler numbers were recorded on
the data run sheet.
8. Cascade impactor units were positioned and connected
to tubing leading to individual valve, rotometer and pumpunits.

B-16
9. The PCD-1 unit was placed in the chamber and turned
on.
10. The 3 fans operating in the chamber during the test
run were turned on.
11. The blower evacuating the chamber was turned on.
12. The air compressor and air dryer supplying
compressed air to the aerosol generation unit was turned on.
13. The aerosol generator was started and operated for
several minutes until the proper charging level had been
reached as indicated by the PCD-l readout.
14. The manifold system was switched on. The three
dichot units and the three Cascade impactors units were
switched on. All components were started within 30 seconds.
The starting time was recorded on the data sheet.
15. Flow rates were adjusted using calibration curves
for all samplers. This was accomplished within 3 minutes.
16. The PCD-1 readout was recorded. Temperature,
barometric pressure and relative humidity were recorded.

B-17
These readings were recorded throughout the sampling run at
3 0 minute intervals.
17. A drawing was recorded on the back of each data run
sheet of the configuration used during the sample run. This
included sampler type, number, flow controller and relative
position within the test zone.
18. At regular intervals of 3 0 minutes the following
parameters were checked, adjusted if necessary and recorded:
The rotometer flow rates for each sampler, the operation of
the aerosol generation unit, the temperature, barometric
pressure, relative humidity and the PCD-1 readout.
19. At the end of each sampling period a final check of
the preceding parameters was made. The dust, generator was
switched off. The air flow to all samplers was switched off
and the time recorded. The PCD-1 was manually stopped. The
average PCD-1 reading was recorded.
20. The filter cassettes were removed from the dichot
and placed back in the correctly marked petri dishes. The
PEM, MEM, 37mm open face samplers and Andersen 2000 cascade
impactors were disconnected from their tubing and removed
from the chamber to the clean work space in the laboratory.

B-18
21. The samplers were disassembled in the laboratory
and only the filters were retained in the petri dishes.
22. Each sampler was cleaned between each sample run
except for the dichot.
23. The impaction surface of each PEM and MEM sampler
was scraped clean with a razor blade. Accessible interior
surfaces were wiped down with acetone using a clean cloth.
24. The cascade impactor stages, plastic snap rings and
37mm filter cassettes were completely disassembled and
cleaned by submersion in a solution of "Micro" liquid
laboratory cleaner and water in an 2 quart capacity
ultrasonic bath. After removal from the bath the parts were
rinsed in tap water, shaken, and allowed to air dry.
25. All collection media was packed in a small box
where they remained in a horizontal orientation during
transport to the EPA weighing chamber.

C- 1
APPENDIX C
Collocation Test Data
The following pages contain the collocation
experimental data used in this research project:

C-2
Table C-1. Data from collocation test - January 18, 1989PSESSWS 758.00 r58.00 738.00 758.00 758.00 3ELTH-0
TEir H.OO 23.00 19.00 16.50 14.50
TIPC<niN> 30.00 ».00 30.00 30.00 15.00
<KIU 120.00 120.00 120.00 120.00 60.00 340.0<3 100.66 .ZPROaWLE SRHPLIHS OIFESEMCE 4B0UT 0.64Z MI6H
as 119.64 120.25 121.07 121.59 61.01 543.55 3.55 •TOTAL LPtl OELTR •0-
•1, 1/18/89•jflrf^IHO T 2.2! HOURS 133 HIHUTES HOTEtCVCCK TOTRL l»BS/16.7U>mT»1000
PC 293.000 ^0.113OBTE SPL TPii FILTER • OELTR rBSSFLOW RT (ICONC •U6/H3<10lrfine«'2 S Fine COBRSE<IOu« I >2. 5 18-Jan-89 X
18-J»>-89 S/RIM-C T1060 2711 10«I.94 1058.75 "OICH0T>2 3/R144-Cf
18-Jin-89 3/fll44-F T1053 2441 12135.43 2287.373 205.43 1081.94 S/R144-F
18-J»>-89 Vn547-C T1056 2619 1045.63 1197.86 <ICHaT<2 S/1«47-C»F
i8-j»>-89 s^tntr-f Tiosr 23S0 US0.49 2206.121 160.49 1045.63 S.'R347-F
18-J«.-B9 S/H<ll-C T103i 2641 1048.67S/<»411-C«F
18-)an-89 S/R411-F Tia33 2486 1227.65 2276.324 227.65 048.67 2256.61 0ICH0T<10 S.'R411-F>WOi OF tllN nsx STO DEV BE»<
18-Jjn-89 «riIDu«l T1043 3209 2377.04 3.00 2262.96 2377.04 31. 31 2304.44 idiO'jii
l8-J»,-89 iCHlCl>j*2 T1044 3055 2262.96 IEniOu<2
18-J«n-89 ICniCXrtJ T10<3 3069 2273.33 HEniojta
(USER OF NIN mx STO OEV REHH
18-Jan-89 l«:M2.5»l T10<2 1763 1305.93 3.00 202.22 305.93 47. 71 1238.32 tC?12.5»l
:8-Jan-89 rE^.SiZ T1041 1630 1207.41 REH2.542
18-J»i-39 ICfE.5»3 T1015 1623 1202.22 1012.5«3
NUPBER OF niN mx STO OEv mrn
18-J*i-S9 renlOu*! T1040 1317 2438.89 3.00 Mll.U 2501.85 57. 96 2450.62 PEMlOijtl
18-J«>-3^ PEMia>jt2 T1012 1351 2501.35 PE«10u«2
18-J»i-a^ PEM10u«3 TlOU 1302 2411.U PE«10JI3
0.00 0.00 0.00 0 O.OO PEniO'j»4
0.00 0.00 0.00 0 O.OO PEmo^jts
NUMBER OF niN >*W STO OEV HERN
l»-J»i-89 f>EK2.5«l T1013 645 1194.44 3.00 194.44 251.83 23. 54 1221.60 PEI12.5»l
18-j3n-89 Ptrt2.5»2 T1031 638 1218.52 PE)12.5»2
19-Jan-89 PErC.5«3 T1008 676 1231.35 PEI12.5«3
0.00 0.00 0.00 0 O.OO PEH2.544
0.00 0.00 0.00 0 0.00 l'0(2.345
MureeR OF HIH IMX STO OEV BERN
IB-Jar-S^ «-0F fl-1 1332 :?503.70 4.00 2303.70 2650.00 61. •3 2568.52 flfl-OF
l8-J^-e^ flfi-OF ft-2 1431 26fO.OO flfl-OF
l8-j3n-89 fW-OF ft-3 1407 2603.56 flfi-OF
\B-t-n-a9 fB-OF B-4 1358 2514.81 RR-OF
STRGE t msS FRBCTEFFICT.CUTSU RRNGECUm. WSS X
18-I»i-89 CI-0-1 S-O-l 1950 23.3 510.40 1 20.21 7.0 >7 0 100.00 CI-0-1
18-J*>-89 CI-0-2 S-0-2 1370 29.3 358.59 2 14.20 4.7 4.7-7 0 79.79 CI-O-2
18-J»i-8? CI-0-3 S-0-3 1520 29.3 397.85 3 13.76 3.3 3.3-4 7 45.59 CI-iVS
18-J»i-8? CI-0-4 8-0-« 1590 23.3 416. 18 4 16.43 2.1 2. -3 3 49.83 CI-0-4
l8-Jafi-8? CI-fl-5 6-0-5 2020 29.3 528.73 5 20.94 1.1 1. -2 I 33.35 CI-0-3
l8-J«>-e9 CI-O-B B-2 1197 28.3 313.31 FILTER 12.41 0.0 0.0-1 1 12.41 CI-O-S
9647.00 2525.06
l»-Jan-89 CI -X-0 6-X-l 1290 29.3 337.65 0 12.86 11.0 >11 0 100.00 CI-X-0
18-J»n-89 CI -X-1 S-X-2 420 28.3 109.93 1 4.19 7.0 7.0-11 0 87.14 CI-x-l
18-Jar-89 CI-)i-2 »-X-3 1070 23.3 290.07 2 10.66 4.7 4.7-7 0 32.96 CI-X-2
18-Jan-89 CI -X-3 S-X-4 2010 23.3 526.11 3 20.03 3.3 3.3-4 7 72.29 CI-X-3
18-J»n-B9 CI -X-4 G-X-5 1720 28.3 450.20 4 17.14 2.1 2. -3 3 52.26 CI-X-4
18-Jan-8^ CI-X-5 5-X-6 2190 28.3 573.22 3 21.83 1.1 1. -2 1 35.11 CI-X-5
l»-Jin-e9 CI -X-B 8-3 1333 29.3 348.91 FILTER 13.29 0.0 O.O-l 1 13.29 CI-X-S
l8-J«.-89 —5-^ T10!9 0 2626.096
l»-Jan-89 —teH TI007 -*
lB-Jan-89 —Ptn T10O4 10 l»-J«>-89 —flfi ft-! 5S
19-Jan-89 —CI M27 20
DHTE FiLT « sw.rvp IKT.2ER0 IKT.nRSS nOJ.IHT.UT FIN.2ER0 FIM.RRSS RDJ.FIN.UT OELTR H. (Hq)
18-Jar.-99 TIOSO S/S144-C O.OOS 109.238 109.233 0.0O4 111.948 U1.944 2.711
lB-Jan-8-J T1058 3/R144-F 0.003 111.322 111.319 0.001 113.761 113.760 2.441
l8-Jan-89 T1056 3/n547-C 0.003 113.249 113.246 0.002 115.867 115.863 2.619
18-Jin-W T1057 Vn547-F 0.003 109.241 109.238 0.003 111.591 111.388 2.350 FILTER 1/3 RBRflDED
l8-Jjn-« T1032 S/R411-C 0.002 113.249 113.247 0.003 115.893 115.888 2.641 SPECK ON FILTER
l8-J».-99 T1033 S/R4U-F 0.003 107.626 107.623 0.004 110.113 110.109 2.486
18-J*v-89 T1043 l«NIOuil 0.004 111.928 111.924 0.004 113.137 115.133 3.209
I8-Jar.-89 TIOM «m0u«2 0.003 114.309 114.306 0.003 117.364 117.361 3.053
18-J«n-99 T10«3 nE«lOu»3 0.003 108.196 108.191 0.003 111.263 111.260 3.069
I8-J«>-B9 T1042 re>e.5ii 0.004 109.442 109.438 0.003 111.204 111.201 1.763
l8-Jjn-99 T1011 rC{12.5t2 0.002 112.527 112.323 0.003 114.138 114.133 1.630
18-Jan-89 TI013 rCI12.3t3 0.003 103.291 103.286 0.004 106.913 106.909 1.623 OUST DH FILTER DISTURBED SL
l8-J«r.-89 T1010 PEMlOutl o.o» 103.780 103.773 0.001 107.093 107.092 1.317
18-Jjrt-89 Tt012 FeniOu«2 0.001 10S.S49 105.548 0.001 106.900 106.899 1.331
IS-Jin-S9 TlOU PB«0u«3 0.001 104.804 104.803 0.003 106.108 106. lOS 1.302
ie-Jav-S9 T1013 PEIC.StI Q.003 102.623 102.622 0.004 103.271 103.267 0.645
I8-J«n-e9 T103I PBC.M2 0.001 110.364 110.863 0.003 UI.324 111.321 0.638 OBJECT DROPfED OH FILTER
IS-J«1-89 T1008 FErC.5i3 0.003 104.078 104.073 0.001 104.752 104.751 0.676
lS-Jart-99 ft-1 m-OP 0.004 4».«B 49.5« 0.002 M.WZ 30.930 I.3S2 POSSIBLE CUT OH FILTER E06E
ie-Jjn-S9 ft-2 RR-OF 0.003 49.290 49.237 0.004 30.722 30.718 1.431
l8-ian-89 R-3 RR-OF 0.002 49.417 49.415 0.004 30.826 30.822 1.407
18-J»*-99 ft-4 flft-OF 0.003 48.960 48.937 0.004 30.319 30.313 1.338
I8-Jan-89 S-O-l CI-O-l 0.000 404.340 404.340 0.000 406.290 406.290 1.950
l8-J«r,-99 S-O-2 CI-0-2 0.000 410.960 410.960 0.000 412.330 412.330 1.370
lS-Jan-89 &-0-3 CI-O-3 0.000 400.150 400.150 0.000 401.670 401.670 1.520
t»-Jan-S9 S-0-4 CI-O-4 0.000 403.330 405.330 0.000 407.120 407.120 1.390
18-Jan-»9 6-0-5 CI-0-5 0.000 393.980 395.980 0.000 398.000 398.000 2.020
l8-Jjn-89 B-2 CI-0-8 0.000 64.773 64.773 0.003 65.973 63.970 1.197
18-J»<-»9 S-X-l Cl-X-0 0.000 393.300 393.300 0.000 394.590 394.590 1.290
I8-Jan-99 S-X-2 CI-x-l 0.000 399.990 399.990 0.000 400.410 400.410 0.420
I8-Jar>-8? S-X-3 CI-X-2 0.000 400.550 400.350 0.000 401.620 401.620 1.070
18-Jan-89 6-X-4 CI-X-3 0.000 423.380 423.380 0.000 42S.390 425.390 2.010
IS-Jin-e? S-X-3 CI-X-4 0.000 400,370 400.370 0.000 4O2.OT0 402.090 1.720
l8-J»>-89 S-X-6 Cl-X-3 0.000- 392.200 392.200 0.000 394.390 394.390 2.190
18-Jvr-S9 B-3 Cl-X-fl 0.000 65.667 63.667 0.004 67.004 67.000 1.333
CHRHSE FROn RUB.38.6399.37102.29103.2299.1397.37
96.95101.83101.37
94.84102.38103.02
100.4897.93101.64
102.27100.2597.38
102.5996.9398.38102.14
1197.»2oao.o13'?0.01320.01370.O1950.0
1333.02190.01720.02010.01070.0420.01290.0

C-3
Table C-2. Data from collocation test - January 19, 1989OBTE FILf t gr.TYP IKI.JERO IMT.nRSS flOJ.INT.UT FIN.ZERO FIN.nBSS "OJ.FIH.UT OiT.TR n.<rl9>
l9-Jjn-e9 TFllCn •i^l44-C 9.9W 109.238 99.239 Em ERR FILTER OROPPEO RN> OCSTlnnED
\9-Jirt-fi TI031 S/Hl44-f 0.0O3 107.64S 107.642 0.003 109.867 109.864 2.222
l»-J«i-W TI069 5/R547-C 0.0O5 110.108 110.103 0.0O4 112.333 112.391 2.278
l9-J«>-89 13036 VB54?-f 0.0O4 %.0O2 95.999 0.003 99.202 98.199 2.201
l»-Jjr»-8^ 13044 S/THll-C 0.QO3 97.409 97.405 0.005 99.391 99.336 2.191
19-J*n-OT TtOSO 5/R411-* 0.004 112.567 112.963 0.002 114.934 114.932 1.969
l»-J«i-»? T1023 itmouii 0.003 105.122 105.119 0.003 107.902 107.899 2.780 POSS MIX UP—S£E T3045
l»-J».-99 n037 icKiouta 0.002 104.207 104.205 0.000 106.361 106.961 2.656
19-J-.-99 13045 nEniaut3 0.004 99.7% 99.792 0.003 101.565 101.562 2.770
19-Jjf»-B9 T3039 iCIC.Stl 0.001 9S.783 96.794 0.0O3 99.406 99.403 1.619
I»-J»>-e9 T3039 tlC.ifJ 0.001 100.496 10O.495 0.002 102.011 102.009 1.514
19-Jjn-OT T1(E4 IOC.3t3 O.OCM 106.369 106.365 0.002 107.902 107.900 1.333
l»-J»l-89 r»46 PErnou*! 0.004 99.361 99.557 0.003 100.999 100.995 1.438
I»-Jan-9^ T1003 PE«t0u42 O.0O4 103.669 103.669 0.002 104.831 104.829 1.160
19-Jan-99 11025 POIlOuiS 0.004 101.781 101.777 0.0O4 103.064 103.060 1.283
19-JjrY-9^19-Jan-8-5 T3031 PCT2.3tl 0.003 99.927 99,924 0.003 99.573 99.570 0.546
1»-J»>-S9 T3047 P€«2.5t2 0.002 9S.281 93.279 0.003 95.897 95.834 0.605
19-Jan-8S T103S POC.3t3 0.004 106.187 106.183 0.004 106.808 106.ao4 0.6210.000
19-Jan-99
0.000
19-Ijr>-ff9 R-8 RR-OF 0.0133 49.968 48.865 0.003 50.022 50.019 1.154 5TRRTED 10 niH LHTE
19-Jan-9S R-9 RR-OF 0.0C3 48.983 48.980 0.001 50.174 30.173 1.193 STARTED 10 BIN LRTE
l»-;ir^99 R-10 RR-CF 0.0O3 49.480 49.477 0.0O2 30.683 30.633 1.206 STARTED 10 RIN LRTE
I'J-Jan-W R-ll RR-CF 0.003 49.025 49.022 0.003 . 50.293 50.290 1.268 STARTED 10 nlH LHTE
19-j3rf-«l9-Jarv-8^ lt-O-4 CI-0-1 O.OOO 409.090 409.080 0.000 410.690 410.690 1.610
19-Jar<-8^ M-l-4 CI-0-2 0.000 401.500 401.500 0.000 402.730 402.730 1.230
l9-Jar>-»9 H-O-3 CI-0-3 0.000 388.120 388.120 o.ax 389.470 389.470 1.330
19-Jar>-« H-0-2 CI-0-4 0.000 405.270 405.270 0.000 406.710 406.710 1.440
19-Jar.-99 H-O-3 CIH3-5 0.000 392.240 392.240 0.000 394.370 394.370 2.130 EXTREHfCLY UH.IKELY PRO!iABL
19-Jar>-39 B-IO ci-o-e 0.003 64.296 64.293 0.003 65.462 63.459 1.166
19-Jar»-e-?19-J»i-»9 H-X-2 CI-X-0 0.000 397.500 397.500 0.000 399.130 399.130 1.630 399.130 399 670
19-Jjn-89 H-<-3 CI-X-1 0.000 392.220 392.220 0.000 392.460 392.440 0.240 392.460 402 060
19-Jdt,-3^ H-X-4 CI-X-J 0.000 393.260 393.260 0.000 394.000 394.000 0.740 394.000 397 340
19-Jan-3-? H-X-5 CI-X-3 0.000 396.320 396.320 0.000 397.840 397.840 1.520 397.840 394 000
19-Jan-89 H-I-2 CI-X-4 0.000 400.170 400.170 0.000 402.060 402.060 1.890 402.060 392 460
19-J»v-8S H-I-3 CI-X-5 0.000 397.860 397.860 0.000 399.670 399.670 I.SIO 399.670 399 130
l9-Jan-89 B-U ci-x-e 0.002 66.134 66.132 0.002 67.413 67.411 1.279
PRESSURE 758.00 758.00 758.00 758.00 758.00
TETP 27.50 26.00 24.00 22.00 20.00
TIfCtKlH) 30.00 30.00 30.00 30.00 35.00
OCtL] 120.00 120.00 120.00 120.00 140.00 620.00 100.08 >;3>R0eABL£ SRtrLlHS OIFERENCE •rfBOUT 0.08X HISH
as 119.34 119.64 120.04 120.45 141.00 620.49 0.48 "TOTAL LPn OELm •<)•
• 2 , 1/19/89
SIWLIHe T 2.38 HOURS ISS NINUTES MOTErCKOC TOTI*. IIHSV16.7lJ>IHr41000
PC 210.000 U9.tl3OHTt SPL TPit FILTER t OELTR NRSSFUOH RT (ICOHC<Ue/rQ<10u^in*«<2.5 Finr C0RBSE<10u. h >2.5 19-Jin-89
l»-J«i-e9 VH144-C TFINOIT ERR ERR 772.63 -OICH0T>2.S/H144-C«F EFR
19-Jjn-e9 Vfll44-F T1051 2222 956.93 ERR 936.93 ERR S.'R144-F 95.89
l9-J»>-89 S/fl547-C TI069 2273 796.39 917.60 *ICH0T<2.S/R347-C*F 96.33
l9-Jan-89 S/H547-F T3036 2201 947.89 1734.294 947.89 786.39 S.'«547-F 96.90
t9-Jan-89 VR411-C T3044 2181 758.86 S/H411-C»F 103.97
19-Jar-e9 S/R4H-F T1050 1969 847.99 1606.340NUI«ER OF
847.98RIN
758.86NAK STD OEV
1670.36NERN
<ICH0T<10 S.-R411-F 106.21
19-Jan-89 fCnlOutl 11023 2780 10 1795.87 3.00 1715.76 1795.87 36.33 1767.01 BEBlOutl 99.39
I9-Jjn-e9 »CN10u«2 T1037 2656 10 1715.76 BEHlOu*: 102.99
I9-J».-99 (CmOuO r3045 2770 10 1789.41tU«ER OF RIH NRX STD OEV BERN
IEniO<jl3 96.75
19-J«r.-89 r««2.3tl T3038 1619 10 1045.87 3.00 978.04 1045.87 29.31 1005.17 ICK2.341 96.11
19-Jjf>-89 ICN2.5t2 T3039 1314 10 978.04 BEn2.S42 102.77
l»-Jaf.-89 f«n2.5t3 T1024 1535 to 991.60NWBEF OF niN NRX STO OEV NERN
IEn2.S43 101.37
19-Jin-89 PENlOuil T3046 1438 2322.35 3.00 1873.39 2322.35 183.69 2089.25 PEXlOutl 89.96
19-Jjfi-89 PEm0ui2 TIOOS 1160 1873.39 PE?110j«2 111.52
19-Jjn-S9 PWlOuiB T1025 1283 2072.03PEniO'jt3 100.83
0.00 0.00 0.00 0 0.00PEni0u*4
0.00 0.00 0.00 0 0.00HU«ER OF RIN NAK STD oev BEff
PERlOutS
t»-J»(-89 PtlC.5tl T3031 646 1043.23 3.00 977.07 1043.28 27.23 1007.75 PEH2.541 96.59
19-J»^-89 PE»C.5t2 T3047 603 977.07PEN2.542 103.14
19-Jin-89 PEtC.5i3 T1033 621 1002.91 PEB2.343 100.48
0.00 0.00 0.00 0 0.00 PEH2.5f4
0.00 0.00 O.OO 0 o.6oHU«ER OF KIN HRX STD OEV BERN
PEn2.3«5
19-Jan-89 AR-OF R-9 1154 1999.66 4.00 1999.66 2186.21 70.64 2078.02 RR-OF 104.44
l»-J»t-e9 AH-OF R-9 1193 2056.90RR-OF 101.03
l9-Jjn-89 RR-OF R-10 1206 2079.31Rn-OF 99.94
l»-Jaft-89 RR-OF R-ll 1268 2186.21RB-OF 95.05
STR6E « -OSS FSnCTEFFECT. CUr9lZE RAWeECUNM. NBSS X inuBTs-
19-j4n-»9 CI-0-1 H-0-4 1610 28.3 367.51 1 18.04 7.0 >7,0 100.00 CI-O-l 1166
19-Jjn-99 CI-0-2 H-1-4 1230 29.3 280.77 2 13.78 4.7 4.7-7.0 81.96 CI-0-2 2130
19-J»i-e9 CI-0-3 H-O-S 1350 29.3 308.16 3 15.12 3.3 3.3-4.7 68.18 CI-0-3 1440
lVj4n-89 Cl-O-4 H-0-2 1440 29.3 329.70 4 16.13 2.1 2.1-3.3 33.06 CI-0-4 1350
19-Jan-S9 CI-0-5 l«>-3 2130 28.3 4S6.21 5 23.86 1.1 1.1-2.1 36.93 CI-0-5 1Z30
19-J»»-89 ci-o-e B-IO 11668*26.00
28.3 266.162037.51
FILTER 13.06 0.0 0.0-1.1 13.06 Cl-O-B 1610
19-J4n-S9 CI-X-0 H-X-2 1630 29.3 372.07 0 17.89 II.O >11.0 100.00 CI-X-0 1279
19-J»n-89 CI-X-1 H-X-3 240 a.3 54.78 I 2.63 7.0 7.0-11.0 82.11 CI-X-1 1810
1»-J<n-B9 CI-X-2 H-X-4 740 28.3 168.92 2 8.12 4.7 4.7-7.0 79.47 CI-X-2 1890
l»-J«»-89 CI-X-3 H-X-5 1520- 28.3 346.97 3 16.69 3.3 3.3-4.7 71.35 CI-X-3 1320
19-Jan-99 CI-X-4 H-I-2 1890 28.3 431.42 4 20.75 2.1 2.1-3,3 94.66 CI-X-4 740
t9-Jan-e9 CI-X-3 H-I-3 1810 29.3 413.16 5 19.87 1.1 1.1-2.1 33.91 CI-X-5 240
l»-Jj«>-89 ci-x-e B-U 1279 29.3 291.95 FILTER 14.04 0.0 0.0-1.1 14.04 ei-x-B 1630
l»-J4r>-99 —S/n T3046 1438 2079.292t9-J»-e9 —Id T1028 -»
l»-J».-«9 -fEH TllBt 1

C-4
Table C-3. Data from collocation test - January 21, 1989DBTE FILT • 5XP.TYP IMT.3P0 iMT.fnss SDJ.IMT.tfT f:n.zeto FIM.rWSS flOJ.FIN.MT DELTfl rl. CII9)
Zl-]arr-m Tl»5 S/H144-C 0.0O2 108.0O9 109.007 0.003 111.041 111.038 2.031 BfCLY iiLWII'nj FILTER
2I-J«n-8? T3033 S/BI44-F 0.005 »4.238 94.233 0.001 96.096 96.095 1.862
2I-J»»-e9 T1004 V«547-C 0.001 109.602 109.601 0.002 99W.0OO 9999.998 9989.397 •347 FlltLED RT 2:43
21-J».-e9 T10S2 S-'BWr-F 0.004 114.470 114.666 0.003 9999.000 9998.997 9884.331 •947 FRILED BT 2:4S
21-J»i-81> TIM? VMll-C 0.0O2 113.2o5 113.263 0.0O3 115.313 115.310 2.047
21-Jan-89 T1063 S/THll-F 0.0O3 104.8S3 104.850 0.003 106.727 106.724 1.874
21-J«n-e921-J«^-ff5 T1066 "CBlcX*! 0.002 104.230 104.278 0.003 106.775 106.772 2.494
21-J«n-8? T1048 ttNl0ut2 0.003 110.053 110.050 0.0O4 112.409 112.405 2.333
Zl-Jm-S? T1061 ICNll>ji3 0.001 110.0ib6 110.063 0.003 112.360 112.357 i.iii
2l-J«>-OT21-Jar>-89 T3040 ierc.5»l 0.002 102.144 102.142 0.003 103.479 103.476 1.334 HO OBVIOUS REASON
2I-J.in-89 T3047 ltN2.S»2 0.005 101.07? 101.072 0.004 102.293 102.239 1.217
21-J«<-89 T3013 I«n2.5i3 0.003 95.100 95.097 0.000 96.319 96.319 1.222
Z1-JW.-3?2l-J»>-89 T1014 Ptniouti 0.O33 104.331 104.578 0.004 105.970 105.966 1.388 CROP OF OIL OH FILIER-OC ICISHTS
21-J»n-89 T1064 PtniOuM 0.003 109.910 109.907 0.003 110.974 110.971 1.064
21-J»>-89 T30CM P€m0u«3 0.003 92.721 92.718 0.002 93.699 93.697 0.979
21-Jw>-e'> T3033 PEBlOuM 0.003 ».312 96.309 0.002 97.289 97.237 0.978
21-j3n-3? T3013 PEHlOuiS 0.003 94.350 94.847 0.003 95.767 95.764 0.917
21-J*%-9^21-Jan-e9 T3fC9 PtrG.Stl 0.003 96.000 95.997 0.003 96.517 96.514 0.317
Zl-Jjn-a-? r3043 PErC.5t2 0.0O3 93.986 93.933 0.004 94.490 94.436 0.503
21-Jan-8<> T3006 PEM2.5i3 0.003 97.131 97.128 0.002 97.601 97.399 0.471
2J-Jan-ff» T1055 PE«2.5M 0.005 108.&48 108.643 0.001 109.154 109.153 0.310
21-J»i-89 T1017 PE(12.5t! 0.0O2 106.404 106.402 0.004 106.782 106.778 0.376 HOSE CRIWTED 0URIM8 THE EXreRIltKT
21-J*<-8921-Jsr>-e9 «»-6 nn-CF 0.003 49.a9B 49.295 0.005 50.402 50.397 1.102
21-J»i-8S B-7 Hft-OF 0.004 49.637 49.633 0.004 30.783 50.779 1.146
21-J»i-e921-J»i-89 J-0-6 CI-O-l 0.000 389.480 339.480 0.000 391.060 391.060 1.580
21-Jin-83 JHJ-4 CI-0-2 0.000 381.730 331.730 0.000 382.940 332.940 1.160
21-Jan-B9 J-0-3 CI-0-3 0.000 3S2.4S0 332.430 0.000 383.750 383.750 1.270
21-Jan-39 J-0-2 CI-0-4 0.000 388.000 338.000 o.oin 339.220 389.220 1.220
2I-J»n-89 J-O-1 c:-o-5 o.ooo 385.300 385.300 o.ooo 387.100 337.100 1.800
21-J»i-ff3 8-13 CIHJ-B 0.003 64.329 64.326 0.003 SS.217 63.214 0.388
2l-Jan-8921-J».-89 J-I-3 CI-X-0 0.000 391.450 331.450 0.000 332.790 392.790 1.340
21-Jar-89 J-I-2 CI-X-1 o.o» 374.340 374.540 0.000 374.910 374.910 0.370
21-Jan-8^ J-I-6 CI-X-2 0.000 387.300 387.300 0.000 388.130 338.130 0.830
21-J»>-89 J-1-5 CI-X-3 0.000 387.090 337.090 0.000 388.610 388.610 1.320
21-Jan-89 J-I-4 CI-X-4 o.ooo 388.070 398.070 0.000 389.620 339.620 1.330
21-Jan-ff3 J-I-1 CI-X-5 0.000 384.360 384.860 0.000 386.550 386.550 1.690
Sl-Jan-ff? B-M ci-x-e 0.004 64.809 64.805 0.003 65.795 63.792 0.987
PRESSURE 765.00 765.00TBT 17.00 14.50 11.00
TIrC<HIN> 30.00 30.00 35.00
accLi 120.00 120.00 140.00 380.00
OS 122.08 122. S7 143.88 388.54102.25 »a*OB<»LE SfWLIHS DIFEREHCE "flBOUT 2.2X HI8H8.54 •TOTFL LPH DELTW -Q-
•3 - 1/21/89
SmPLIHB T 1.58 HOUR$PCno rff«din9o9.T13
0«TE SPL TP*t FILTER21-J»n-89 VH144-C T106521-Jan-89 S/fll44-f T30352t-J»>-89 S/fl547< T100621-J«>-89 VH547-F T105221-j4n-89 S/I9411-C T104721-Jan-89 S/S411-f T1053
21-J»n-89 ICHlOutl T106621-J»i-89 nEni0u»2 T104821-J«n-89 NEHlOuia T1061
21-J4r>-89 ren2.3tl T3O402l-Jsn-89 «H2.5»2 TJ34721-J»i-89 *rG.3»3 T3013
21-Jan-89 PEmOutI2l-J»f-89 PEH10u«221-J4n-B9 PE«10ut321-Jin-89 PEl110u»4ai-jm-e? PEniouiS
T1014ri064r3oo4T3033T3018
21-Jjr>-89 PEIC.5H 130292l-J»f-89 PEre.3«2 T304321-Jan-89 PEre.3»3 T30D62l-j4n-89 PEH2.5H TUBS21-J»>-e9 POC.SIS T1017
2i-j»-e9 m-OF n-621-JJB-89 Bft-OF H-7
0.00 0.00 0.000.00 0.00 0.00
21-J»»-89 CI-O-121-Jjf»-99 CI-0-221-Jin-e9 CI-0-321-J»>-89 CI-<M2I-Jjn-89 CI-0-321-j4r>-e9 CI-O-B
21-J«n-99 CI-X-021-j4r>-e9 CI-X-121-Jan-e9 CI-X-22l-J«n-e9 Ct-X-32I-J«>-«9 CI-X-42l-im-99 CI-X-3Zl-jm-e? Cl-x-e
J-O-6J-O-4J-O-3J-0-2J-O-lB-13
J-I-3J-I-2
J-t-«J-I-SJ-l-4J-I-IB-14
OELIB nRSSFLCH20311362
96893979884331
20471874
249423352292
133412171222
13881064979978
917
317503471SIO
376
tl02U4«
00
13801160127012201800388
7918.00134037083015201350-
1690987
MOTEtOCClC TOTHL l*BS/16.7LPn»T»1000
RT aC0NC<U0/n3<10u4Fin*«<2.S Firo C08RSC<10t» ti >2.S1151.931309.42 2461.358
1161.20
1309.42 1131.93
101010
101010
4
4
4
28.328.328.328.328.328.3
28.328.328.328.328.328.329.3
1317.86
2630.802434.132417.72
1407.171283.751239.03
3660.342803.912531.752579.112418.25
1363.401326.481242.091344.94991.S6
2906.123022.15
0.000.00
388.93432.38473.33454.74670.93330.992951.35499.47137.91309.37366.S6377.75629.93367.89
2479.060HUeER OF
3.00
MUrOER OF3.00
HLKER OF3.00
1317.86niH2417.72
NIN1233.76
2381.75
1161.20l¥tt
2630.80
tmx
1407.17
3660.34
2.00 2418.25 2579.11
HUeER OF3.00
MUrSEK OF2.00
tllN1242.09
MM
1363.40
STD OEV39.02
Sro OEV56.99
STD OEV464.72
STD OEV50.77
991.56 1344.94
niN2906.12
nflx
X22.13STD OEV
38.02
srneE • xtss FHHLiu-i-tCT.cuTsizE RRN6ECum. nss z1
234
5
FILTER
01
2343
FILTER
19.9514.6516.0415.4122.7311.21
16.174.46
10.0218.3418.7020.3911.91
7.04.73.32.11.1
0.0
11.07.04.73.32.11.1
0.0
>7.04.7-7.03.3-4.72.1-3.31.1-2.10.0-1.1
>11.07.0-11.04.7-7.03.3-4.72.1-3.31.1-2,10.0-1.1
21-Jan-891156.57 «IO«>T>2. S.'ni44-C
S/«144-f1313.64 «OICH0T<2. S/BS47-C
S,-B547-FS/B411-C
2479.06 4ICHOT<10 S--B411-FHEfW2510.90 tcniOuti
>E)110<j«2fEniOu<3
HEfW1326.65 IEII2.3*!
NEM2.542f012.S»3
"EBN3016.00 shirt for* PEHlOutl
PEniOi.JI2PEniOu*3
2498.68 p*rsan PEnt0u<4PEI110u«3
1310.65 fhirt For* l>En2.StlPEn2.S«2PEI12.S«3
1168.25 parson PEn2.5«4ren2.3»5
HEm
2964.14 BB-OFBR-OFMMIFBB-OF
CI-O-lCI-0-2CI-O-3Cl-0-4CI-0-5CI-«-B
CI-X-0CI-X-1CI-X-2
CI-X-3CI-X-4Cl-X-5Cl-X-9
100.0080.05
65.40
49.3633.95tt.21
100.0083.8379.37
69.3591.0132.3011.91
100.72100.32
ERR FUSE a.CUN ORTB NERR FUSE GLOW ORTB N>
100.0099.68
95.44101.08103.83
94.28103.34102.92
82.40107.49116.8296.88103.33
96.1398.81105.5297.45132.18
102.0098.08
ERRERR
1800.1220.1270.1160.1580.
987.1690.1550.1520.830.370.1340.

C-5
Table C-4. Data from collocation test - January 25, 1989OBTE FILT • SfP.TYP IKT.aBO IMT.nRSS <OJ. IHT.UT FIN.2ER.3 FIH.IWSS OOJ.FIH.tfT DEUTB n.vhg)
2S-J«i-89 TJ0S3 S-HIM-C 0.004 no. 858 110.854 0.003 113.533 113.535 2.681
25-J«r.-e9 TIOIS S/H1*»-F 0.O51 108.156 106.155 0.002 110.839 110.837 2.682
J3-Jan-89 T1030 VB547-C 0.004 105.064 105.060 0.001 107.734 107.733 2.453
2S-Jan-a9 T302B S/HM?-f^ o.o<a 9«.<38 96.436 0.004 98.843 96.839 2.403 SECTION OF FILTER SHOU'
ZS-Jjn-e? T102? V(Vtll-C 0.002 105.487 105.433 0.002 108.132 108.130 2.645
!5-J«.-e9 T1073 iH411-F 0.003 103.207 103.204 0.003 107.931 107.928 2.724
2!-J«.-Wi5-J«n-OT T3042 ICMlOuil 0.0O2 100.082 100.080 0.003 103.343 103.345 3.265
25-J»»-89 T302& leiiouc 0.002 97.496 97.496 0.004 100.657 100.653 3.137
25-J.1-99 T3001 icmou« 0.001 96.049 96.048 0.002 101.134 101.132 3.064
23-J»i-»92S-J»^8« T300S fCK2.5«l 0.0O4 99.321 99.317 0.005 101.204 101.199 1.382
25-Jjr.-OT T30Z2 «n2.3i2 0.004 98.506 96.504 0.005 100.224 100.219 1.715
3-Jir>-8? T106? rEnz.SIB 0.0O2 106.529 106.327 0.001 108.357 lOa.356 1.929
^S-J«>-e925-j4n-8? TltB4 PEMlOud o.oos 110.258 110.253 0.003 111.685 111.632 1.429
ZS-Jan-OT T3009 PEm0u«2 0.0i>» 96.438 96.434 0.004 97.969 97.965 1.481
23-J»v-89 T3008 PBIlOuIB 0.0O4 96.407 98.403 0.004 99.747 99.743 1.340
ZS-Jtn-9} T300? PCIlCXjM O.OM 96.012 96.008 0.003 99.365 ?9.3« 1.354
25-J»i-99 T301? PEniOuK 0.003 96.702 ^.699 0.005 100.060 100.0S3 1.356
25-j3n-8923-Jjn-89 TlOlO PEH2.5tl 0.004 103.335 103.331 0.005 104.059 104.053 0.722
25-Jan-89 T3002 PEH2.5t2 0.002 96.825 96.83 0.002 97.537 97.535 0.712
S-J»i-99 T1068 Pen2.5t3 0.004 108.088 106.084 0.005 109.782 108.777 0.693
2!-J»i-89 T3027 PBC.SM 0.002 96.381 96.879 0..XI5 97.633 97.628 0.749 inPflCTCR smCK FILTER
25-Jiin-89 T3034 fnc.sts 0.004 97.496 97.492 0.0O4 99.197 98.193 0.701
25-J»n-39Z5-J»>-89 «-21 aH-CF 0.005 50.204 50.199 0.002 51.728 51.726 1.52/ aOSED FfCE
2!-J»>-89 ft-18 flft-CF 0.003 50.739 50.736 0.002 52.242 52.240 1.304 CLOSED FfCE
25-Jar»-99 ft-20 flR-OF 0.004 .51.004 51.000 0.0O2 52.609 52.607 1.607
23-Jan-89 --- fn-cr ---' ERR — — ERR ERR
25-J»i-8925-Jan-89 H-1-1 CI-O-l 0.000 408.170 4O8.170 0.000 409.980 409.990 1.810
2S-Jar.-e9 H-1-5 CI-0-2 0.0i» 405.790 405.790 0.000 407.330 407.330 1.540
25-J»>-89 H-X-S CI-O-3 o.ooo 399.320 399.320 0.000 400.980 400.930 1.660
2S-J»>-89 M-O-t CI-0-« 0.000 396.540 396.540 o.ooo 400.160 400.160 1.620
25-Jan-83 H-X-1 CI-0-5 0.000 403.110 403.110 o.ooo 403.370 405.370 2.260
25-J«n-89 B-7 ci-o-e 0.003 63.910 63.90? 0.001 65.329 65.328 1.421
25-Jar.-9925-Ja»<-e9 K-l-l ci-x-o O.ODO 385.091 385.091 o.ooo 386.380 396.830 1.789
25-Jan-e9 lt-1-2 CI-X-l 0.000 380.250 380.250 o.ooo 380.760 330.760 0.510
2!-Jan-89 lt-l-3 CI-X-2 0.000 382.550 382.550 0.000 383.750 333.750 1.200
25-J>n-89 K-\-* CI-X-3 0.000 382.130 332.130 0.000 384.170 334.170 2.040
23-Jan-89 K-l-5 CI-X-4 0.000 381.970 381.970 0.000 384.020 394.020 2.050
25-J».-e9 K-l-« CI-X-5 0.000 386.490 386.490 0.000 388.550 338.3W 2.060
25-Jan-89 B-6 Cl-X-fi 0.003 63.614 63.611 0.001 67.224 67.223 1.612
761.00 761.00
TEI* 34.50 38.30 39.50 37.30 33.50 27.30 23.00 20.50
TIrCCHIH) 30.00 30.00 30.00 30.00 30.00 30.00 30.00 30.00
QCtU 120.00 120.00 120.00 120.00 120.00 120.00 120.00 120.00 960.00
OS 118.25 117.53 117.30 117.64 118.40 119.58 120.49 121.04 930.2198.99 •XPROBfeU SWPLIHS OIFEREHCE -1.03! LOH9.79 'TOTH. LPtl OELTH 'O"
4 1/25/89
SnPLIfe T 4.00PC 152.000
OBTE SI^ TP»»25-Ja«>-89 S/ni44-C23-Jar>-e9 5/ni44-F25-Jjn-e9 S/H547-C25-Jar-89 S/nS47-F25-Jar-89 S/B411-C25-J«n-89 S/B411-F
25-J«n-89 lCH10u»l25-JV1-S9 FEmOuIZ25-Jv<-89 lCnlQu*3
25-Jsr-89 rC«2.5tl25-j4n-e9 rE«2.5«225-J«>-89 IOC.583
25-J«i-89 PEHlOuH25-Jan-89 PEH10ut22S-J»>-89 l>CniQul325-J»>-89 PEIilOuM25-Jv>-89 PEniOulS
25-J»)-89 PEM2.51125-Jan-89 PEI12.5t22S-Jan-e9 l>EK2.5t323-Jar.-e9 PEW2.SM2B-J».-89 PEHJ.SW
2S-Jir,-B9 HB-CF25-J»i-89 BB-CF2VJan-89 fW-Of25-J»l-89 flB-OF
25-J»i-e9 CI-O-l25-J«>-e9 CI-o-225-Jan-89 CI-O-323-J»i-e9 CI-O-425-J*n-B9 CI-0-523-J«n-e9 CI-O-B
2S-Jan-e9 Cl-X-025-J«>-e9 CI-X-l25-J»<-S9 CI-X-225-J«n-69 CI-X-325-J»i-69 CI-X-425-J«n-e9 CI-X-525-j4n-e9 ci-x-e
HOURS
u»'«3FILTER
240 m MUTES note:occk TOTAL I1RSS/16.7LPWT41000
• DELTB nHSSFLOM RT <lC0HCtU6/«3<10u«f ir».<2.5 Fin» COWSEdOu* k >2.S 25-Jar»-89
T1053 2681 594.41391.28 •0ICH0T>2. S.-B144-C 97.19
T1016 2682 745.00 1339.412 745.00 594.41 S/B144-F 97.05
T1030 2653 395.13723.06 >0ICH0T<2. S,'fl547-C 103.10
T3029 2403 667.50 1262.676 667.50 S95.18 S/B547-F 106.32
Tia27 2645 584.26S/B411-C 97.00
T1073 2724 756.67 1340.930 756.67 394.26 1301.80 =«!CH0T<10 S/B411-F 95.36
MUWEF OF niH NBX STO DEV HEBN
T3042 3265 10 1360.42 3.00 1283.00 1360.42 30.99 1320.23 ^cnlo>Jll 97.05
T3026 3137 10 1313.42nEniOj«2 100.37
T3001 3084 10 1295.00HUrCER OF niH MAX STO oev nEBN
ieiiOu»3 102.75
T3005 1882 10 794.17 3.00 714.59 794.17 29.03 753.61 HEnz.sfi 96.10
T3022 1713 10 714.58fEn2.5«2 103.46
TI067 1829 10 762.08HUCEK OF niH IWX STD OEV MEBN
BEI12.5«3 98.89
T1054 1429 4 1496.54 3.00 1395.83 1342.71 60.63 1475.69 shtrt for* PE)1lOu«l 99.14
T3009 14S1 4 1542.71PEI110.J42 95.66
T3008 1340 4 1393.83PEH10u«3 105.72
T3007 1354 4 1410.42 2.00 1410.42 1412.50 1.04 1411.46 p*rson PEI110u44 100.07
T3017 1356 4 1412.50)ueeK OF niH HflX STO OEV HEBN
PEII10u«3 99.93
TlOlO 722 4 752.09 3.00 721.88 752.08 12.33 738.34 jhirt for* PEn2.5»i 98.20
T3002 712 4 741.67PE>12.5t2 99.59
T1068 693 4 721.88PEH2.3t3 102.31
T3027 749 4 790.21 2.00 730.21 790.21 25.00 73S.21 FEn2.5»4 96.80
T3034 701 4 730.21MUeiB OF niN nnx STO OEV MEBN
rei12.5t5 103.42
B-21 1527 4 1390.63 2.00 1566.67 1673.96 45.99 1610.42 aOSED FflC flU-CF 101.24
B-18 1504 4 1566.67flB-CF 102.79
n-20 1607 4 1473.96OPEN F«£ BB-OF 98.20
ERR 4 EKRBB-OF an
STBfiE 1 MRSS FRBCTEFFECT.CUTSI2E RflHOECUWI. i«SS XInuw!
t»-l-l 1310 29.3 266.49 1 17.55 r.o >7.0 100.00 Cl-0-1142:
H-1-5 1540 29.3 226.74 2 14.94 4.7 4.7-7.0 82.45 Cl-0-2 2261
H-X-6 1660 23.3 244.41 3 16.10 3.3 3.3-4.7 67.51 CI-O-3 1621
H-O-1 1620 29.3 238.52 4 13.71 2.1 2.1-3.3 51.41 CI-0-4 1661
H-X-1 2260 28.3 332.74 5 21.92 1.1 1.1-2.1 3S.70 Cl-O-5 1541
B-7 1421t03tl.00
28.3 209.221318.11
FILTER 13.78 0.0 O.O-l.l 13.79 CI-O-B 1811
K-1-1 1789 29.3 263.40 0 15.89 11.0 Ml.O tOQ.OO CI-X-O 161.
K-1-2 510 28.3 73.09 1 4.53 7.0 7.0-11.0 84.11 CI-X-l 206.
K-l-3 1200 26.3 17«.68 2 10.66 4.7 4.7-7.0 79.58 CI-X-22051
K-1-4 2040 28.3 300.35 3 18.12 3.3 3.3-4.7 68.93 ei-x-3 20*
K-1-5 2090 29.3 301.83 4 18.20 2.1 2.1-3,3 30.81 CI-X-4 120
K-1-6 20*0 28.3 303.30 5 18.29 1.1 1.1-2.1 32.61 CI-X-3sr
B-6 1612 28.3 237.34 FILTER 14.31 0.0 0.0-1.1 14.31 ci-x-e J7»
T3041 IS 1637.960

C-6
Table C-5. Data from collocation test - January 26, 1989OHTt FILT • 3f.V1P IKT.IBM IMT.HBSS SOJ.IHT.HT FIH.SRO FIM.I»V3S flDJ.FIN.MT OELTn H.CIV,)
26-Jjr-OT T3W2 'vni44-c 0.004 107.764 107.760 0.003 109.631 109.648 1,388
2«-Jar.-e9 T3051 S/«144-f 0.003 100.187 100.134 0.003 101.866 101.863 1,679
2*-J»>-89 I30S3 S/n547-C 0.0O4 108.990 loe.e^ 0.003 110.800 110.793 1.909
Ib-lm-it r»54 s/«»«7-r 0.004 105.059 103.833 0.003 106,692 106.689 1.634
26-JJH-89 r3ao3 S/^ll-C O.OOZ 93.283 93.231 0.002 95.114 95.112 1.831
2«-J»n-e9 T3030 Vft4U-f 0.002 113.101 113.099 0.003 114.827 114.824 1.725 FIHft. I*SS (KXEI) lta)> KUEieH2*-Jari-e92t-J«r.-89 T3032 icnioutt 0.003 97.033 97.032 0.0O4 99.255 99.251 2.219
2*-J«n-89 11074 fCN10u«2 0.0O4 111.382 111.578 0.004 113.726 113.722 2.144
2*-Jan-B9 T3021 fCHlOuK 0.003 96.062 96.059 0.002 96.214 98.212 2.153
»-J«>-89»-Jjn-89 T1CB4 rtre.Sti 0.0O4 10S.94« 105.944 0.004 107.174 107.170 1.226
2«-J»i-e9 T»12 »e>12.582 0.004 93.9?8 93.924 0.003 97.124 97.121 1.197
2»-Jjr.-89 T1072 tcn2.5«3 0.003 1OS.079 105.076 0.008 106.280 106.273 1.199
2^Jan-89»-Jjn-B9 T3030 remouti 0.003 99,072 99.069 0.003 100.030 100.047 0.978
Jfr-Jjn-89 T1062 PEniOjt2 O.0D2 107.373 107.373 0.003 108.549 108.546 0.973
J6-J«n-8'? T1070 PEHlOutB 0.0O5 109.949 109.944 0.002 110.874 110.872 0.928
2fr-Jjo-e9 rsois PtMlOuM 0.002 97.054 97.032 0.004 97.932 97.948 0.396
26-Jan-e9 T3010 PEHlOuiS 0.0O4 100.670 m.666 0.003 101.583 101.330 0.914 njM STOFPEO FOR 3 NIH.
;*-J»\-9924-Jar-89 Tir)24 PEIC.Stl 0.001 109.703 109.702 0.001 110.134 110.133 0.481
3t-Jar-89 T1029 PEIC.582 0.0O4 103.673 103.669 a.iyrz 106.142 106.140 0.471
2*-j3n-99 T1002 PEB2.5«3 0.002 104.496 104.494 0.003 104.923 104.920 0.426 Ptl-lO STUCK
26-Jjn-89 T3019 PE[C.3»4 0.006 102.414 102.408 0.003 102.895 102.802 0.464
2S-Jan-89 T3014 PER2.5*! 0.004 93.476 95.472 0.004 95.938 93.954 0.482
26-Jir>-892^J^-89 fl-29 flft-CF 0.003 30.011 30.008 0.003 31.006 31.003 0.993 CF
2*-J»>-89 a-30 flB-CF O.0O3 30.657 50.654 0.003 31.627 31.624 0.970 CF
26-Jjn-89 »-15 SB-OF 0.001 31.069 31.068 0.005 52.066 32.061 0.993 OF
2t-Jar.-892t-J.r.-a9 K-O-l CI-O-l 0.000 383.140 383.140 0.000 334.320 334.320 1.180
;:t-Jan-89 K-0-2 CI-0-2 0.000 380.200 330.200 0.000 381.110 331.110 0.910
3t-Jan-e9 K-O-3 CI-0-3 0.000 382.360 332.360 0.000 383.340 393.340 0.980
i6-Jar.-e9 K-0-4 CI-0-4 0.000 390.000 390.000 0.000 391.020 391.020 1.020
a6-J«i-89 K-0-5 CI-0-5 0.000 377.710 377.710 0.000 379.070 379.070 1.360
2*-J»>-e9 B-13 Cl-O-fl 0.003 65.642 65.639 0.0O4 66.453 66.449 0.310
26-Jan-8926-J»,-89 L-O-1 CI-X-0 0.000 383.950 333.930 0.000 336.990 386.990 1.040
26-J»i-89 L-0-2 ci-x-1 0.000 388.910 388.910 0.000 389.240 339.240 0.330
26-Jar>-89 L-0-3 CI-X-2 0.000 378.430 378.430 0.000 379.190 379.190 0.760
26-Jar>-39 L-0-4 CI-X-3 0.000 377.380 377.830 0.000 378.920 378.920 1.O40
26-Jan-89 L-O-5 CI-X-4 0.000 374.990 374.990 0.000 376.090 376.090 1.100
J6-Jar>-89 L-0-4 CI-X-3 0.000 377.310 377.310 0.000 378.670 378.670 1.360
26-Jan-89 B-17 ci-x-e 0.0O2 66.327 66.323 0.003 67.228 67.225 0.900
lEW 21.00 21.00 20.00 18.30 17.00
TIlt'HIH) ».00 30.00 30.00 30.00 23.00
QCCL] 120.00 120.00 120.00 120.00 92.00 572.00
US 120.65 120.63 t20.a2 121.05 93.01 576.19
100.73 '% IN^ S»*>L£04.19 "TOTflL LPn OELTfl !)•
SHWLIHS T 2.38 HOURS 143 41 MUTTS M0TE:O«a< TOTAL «BSS/16.7LP»«I»1000
PCDEflO BHTTEuq/tQDBTE SPL TPti FILTER 1 DELTH OSSFLOH RT <lCOHC<US«'>Q<10urfin«*<2.S Fip» aWRSE<10ui 6 >2.5 26-J»>-39
26-J»>-89 S/H144-C T31M2 1389 713.31 710.99 <ICH0T>2. S.'8144-C 97.05
26-J>n-89 S/ni44-F T3IJ31 1679 783.85 1497.156 733.85 713.31 S/K144-F 96.53
26-Jan-89 5/B547-C T3033 1909 724.22756.68 -OICH0K2. s/H54r-<: 97.71
26-J1C.-89 3/nS47-F T3Q54 1634 762.84 1487.054 762.84 724.22 S/B547-F 99.19
26-j4r>-89 S/B411-C T3003 1831 695.46iH411-C 102.41
26-j4n-89 s/mu-F T30S0 1725 723.34 1418.301 723.34 695.46 1452.93 <1ICH0T<10 S-IMll-F 104.61
MUnBER OF KIN mx STD OEV neflH
26-Jan-89 rcniou«l T3032 2219 10 1S53.92 3.00 1501.40 1553.92 23.41 1521.01 rcniouti 97.88
26-J«n-89 refilOu«2 T1074 2144 10 1501.40fEnl0uf2 101.31
26-J»i-89 (CNlOufB T3021 2153 10 1507.70NUeER OF HIM HHX STD OEV HEHN
ICI110u*3 100.38
26-Jjri-e9 fE«2.5»t TI034 1226 to 858.54 3.00 838.24 858.54 9.26 845.47 ICH2.381 98.48
26-J«i-89 I«I12.5«2 T3012 1197 10 838.24FCH2.5«2 ion.36
26-j4r.-39 refB.5i3 T1072 1199 10 839.64HUBEP OF RIH mx STD OEV nEW
ICK2.3»3 100.70
26-Jir-69 PPHOutl T3030 978 4 1712.18 3.00 1624.65 1712.18 39.36 1630.09 inirt for» PEBlOutl 90.13
26-j4r>-89 PEH10ui2 T1062 973 4 1703.43f>E)110ut2 98.63
26-JW-89 PEI110u«3 T1070 928 4 1624.65PE)llOu«3 103.41
26-Jjr.-89 peniOuM T3016 896 4 1568.63 2.00 1368.63 1600.14 15.76 1594.38 Brrsen PEI110U44 107.11
26-Jjn-89 re«i0ui5 T3010 914 4 1600.14HUtSER OF HIN t*K STD DEW nEBH
PEH10u«5 105.00
26-J»>-89 ppe.jti T1026 4S1 4 842.09 3.00 745.80 842.09 41.88 804.15 «ftirt for* PEI12.5«1 95.50
26-J«r.-89 Ptn2.5»2 T1029 471 4 824.59PE«2.5t2 97.52
26-J*<-e9 Pei12.5«3 T1002 426 4 745.80PEH2.3t3 107.82
2fr-J».-89 rei12.5»4 T3019 484 4 847.34 2.00 843.84 847.34 1.75 845.59 PE)t2.5t4 94.90
2t-J».-89 PEH2.583 T3014 482 4 843.84l«»«R OF NIN mx STD DEV HEm
PEII2.5B5 95.30
26-J«l-89 nn-cF »-29 995 4 1741.95 2.00 I69e. 18 1741.93 21.88 1720.06 aOSED FBC flR-CF 98.74
26-J».-89 f»-CF R-30 970 4 1698.13(W-CF 101.29
26-Jv<-89 fW-OF ft-15 993 4 1738.45OPEN FRCE m-OF 98.94
0.00 0.00 0.00 0 4 0.00HB-CF ERR
STSBE I nnSS FRflCTEFFECT.CUTSIZE RflNOECUWI. HBSS XIrwvrs
2t-J»i-89 Cl-0-1 K-O-l 1180 23.3 291.99 1 18. B5 7.0 >7.0 100.00 CI-O-l 810
2fr-J.n-e9 CI-0-2 K-0-2 910 23.3 225.19 2 14.54 4.7 4.7-7.0 31.13 CI-O-2 1360
2t-Jjri-89 CI-0-3 K-0-3 980 29.3 242.50 3 15.65 3.3 3.3-4.7 66.61 CI-J-3 1020
2fr-J«n-89 CI-C-4 K-0-4 1020 23.3 232.40 4 16.29 2.1 2.1-3.3 50.96 CI-0-4 980
26-J»i-e9 CI-0-5 K-0-5 1360 28.3 336.53 5 21.73 1.1 1.1-2.1 34.66 CI-0-3 910
2»-J<r<-89 ci-o-e B-IS 810
6260.0023.3 200.43
1549.03FILTER 12.94 0.0 O.O-l.l 12.94 CI-O-B 1180
26-Jan-89 CI-X-0 L-O-1 1040 28.3 237.35 0 15.93 tl.o >11.0 lOO.OO ei-!w» 900
2*-J»i-e9 CI-X-1 L-0-2 330 23.3 81.66 1 S.05 7.0 7.0-11.0 84.07 Cl-x-i 1360
Zfrlm-Bi CI-X-2 L-0-3 760 28.3 iaa.06 2 11.64 4.7 4.7-7.0 79.02 CI-X-21100
26-4V1-S9 Cl-X-3 L-O-4 1040 23.3 257.35 3 15.93 3.3 3.3-4.7 67.38 ei-x-31040
2*-J«i-e9 CI-X-4 L-O-5 1100 ii.3 272.19 4 16.83 Z.l 2.1-3.3 51.43 ei-x-4 760
26-Jan-S9 CI-X-5 L-O-6 1360 28.3 336.53 5 20.83 1.1 1.1-2.1 »4.61 Cl-X-S 330
26-JX-C9 CI-X-B 8-17 900 28.3 222.70 FILTER 13.78 0.0 O.O-l.l 13.78 Cl-x-« 1040

C-7
Table C-6. Data from collocation test - February 16, 1989OBTE FILT 1 SHP.TYP IKT.ZERO IHT.nRSS BDJ.IHT.KT FIN.:XPO FIN.MRSS "OJ.FIM.UT OCLTA H.' nq>
16-F«>-99 T3033 vm44-c 0.004 16.359 1I8.5SS 0.002 99.997 9e.»»5 0.440
l«-F«>-39 T>X4 V<1144-F 0.003 110.14* 110.146 o.ooi 110.630 110.629 0.483
U-F«>-«9 T30?I VH547-C 0.003 108.134 108.131 o.oot 108.605 108.604 0.473
li-ffO-39 T1070 VR54r-F 0.002 102. &i9 102.667 0.303 103.123 103.122 0.435
16-F*-99 T3069 VB411-C 0.002 105.833 103.833 0.003 106.348 106.345 0.492
16-Frt-e9 TM37 S/'Mll-f 0.004 109.452 109.448 0.003 109.911 109.908 0.460
I&-Frt-»9lS-Fet>-*9 T3062 pcnioui) 0.003 104.407 104.4>34 0.004 104.934 104.980 0.576
l*-F.b-89 T30fc3 >cniOu«2 0.004 102.724 102.720 0.003 103.311 103.308 0.388
l6-F.t.-99 TBOe't nEmQu«3 0.003 103.180 105.177 0.002 105.769 105.767 0.390
l&-Frt>-»516-Fe&-99 r3065 fE«2.5«l 0.003 100.695 100.692 0.003 101.039 101.036 0.344
l«-F»o-89 TTO55 i«re.3i2 0.003 106.351 106.548 0.0O2 106.876 106.874 0.326
!6-F«>-99 T3061 l«M2.5t3 0.005 104.670 104.665 0.0O2 103.027 105.023 0.360
16-Frf>-»916-F.«>-89 T4014 PEMlOuil 0.003 94.243 94.240 0.002 94.568 94.366 0.326
16-f.*,-89 T4013 PE-tlOuM 0.304 89.790 89.736 0.003 90.123 90.120 0.334
16-F«>-89 T4012 PjniOutS 0.004 92.645 92.641 0.002 92.962 92.960 0.319
IS-ffb-f} T4013 PEniOuM 0.003 92.445 92.442 0.002 92.845 92.843 0.401 VISIBLE flHOUHT flP-10 HROtlHS STUCK TO FILTERl6-F»fr-89 T4019 PEdlOuW 0.004 92.738 92.r!4 0.003 93.041 93.038 0.284
16-F«t,-99 T4020 PtBlOutt 0.004 92.7-36 32.792 0.0O4 93.068 93.064 0.272
16-F«,-3916-F»-W T4011 PtrO.Sil 0.0O4 ''2.0S3 92.049 0.003 92.239 92.236 0.187
16-F«to-89 T4010 PE?e.3i2 0.0O5 92.5*54 92.939 0.002 93.124 93.122 0.163
16-fet>-39 T4009 PER2.5t3 0.004 92.264 92.260 0.0O4 92.449 92.445 0.18S
16-<;«-89 T4015 renz.sM 0.003 92.818 92.313 0.001 92.935 92.934 0.169
1&-Fet>-S9 T4016 PE.12.5t3 0.004 92.176 92.172 0.002 92.336 92.354 0.182
16-Fal>-89 T4017 PEH2.3tt 0.004 97.395 97.391 0.002 97.560 97.538 0.167
it-rtb-9916-F.*-89 S-48 SB-or 0.004 30.679 50.673 0.003 30.991 50.988 0.313
16-frt-99 ft-69 WWF 0.002 47.719 47.717 O.OOI 47.975 47.974 0.237
16-«:»t>-890.000
!6-F*t>-990.000
16-fee-8916-Feti-« M-0-4 CI-0-1 0.000 394.330 394.390 O.OOO 394.840 394.840 0.460
16-feb-99 ft-.>2 CH3-2 0.000 383.360 333.360 o.o^w 333.670 333.670 0.310
l6-Fet>-« n-0-3 CI-0-3 0.000 379.310 379.310 0.000 379.660 379.660 0.330
16-Feb-« I»-3-4 CI-0-4 o.ooo 385.790 3S3.7-XI o.ooo 383.930 335.930 0.190
16-F«e-I39 fl-0-5 CI-0-5 0.000 332.470 382.470 o.0i» 382.730 332.730 0.310
16-Fefc-e9 6-22 ci-o-e 0.002 63.643 63.641 0.001 65.976 63.975 0.334
16-Fe6-3916-Fee-89 P-0-6 CI-X-0 0.000 387.000 387.000 0.000 337.320 337.320 0.320
16-F»b-99 n-X-6 CI-X-1 0.000 377.960 377.960 0.000 378.000 378.000 0.040
16-F»b-W I1-X-2 CI-X-2 0.000 379.450 379.450 o.ooo 379.630 379.630 0.230
16-Fsb-a9 H-K-3 Cl-X-3 0.000 382.330 382.330 0.000 332.640 332.640 0.310
16-Fe6-99 I1-X-4 CI-X-4 o.ooo 378.030 378.030 0.000 378.350 378.330 0.320
16-F»t>-99 H'X-? CI-X-5 o.ooo 379.270 379.270 0.000 379.530 379.330 0.310 DROPPED iJPSIOe OOW OH TBBLE DID MOT STia16-Frt>-a9 B-23 ci-x-e 0.003 65.228 65.223 0.004 63.390 63.396 0.361
PSES3URETE1*>TIft(HIN>aCILJ<}S
766.00 766.50 767.00 767.0021.5030.00120.00121,19
22.0030.00120.00121.12
20.5030.00120.00121.47
20.0013.0060.0060.79
360.00363.78
101.03 ' /. OVER S(»*>LEO3.78 "TOTAL LP« OELTB
•6 2/16/89
3»W>LIH6 r 2.23 HOIJKS 135 NIHUTES HOTElOCCX T0T8L HflSV16.7LPmT»100O
PCO-1 ' 59.iM0 ugflSOBTE SPL TPM FILTER t OELTB mSSFLOH RT (lC0HC(US/n3<10urfine»<2.5 Fine C0flRSE<10u. 6 >2.5 16-F«tr-89
16-F*-39 S^'fl!44-C T3056 440 171.31 184.72 >OICH0T>2. S.-B144-C 92.74
16-Feb-89 S/R144-F T3.D66 483 238.52 409.832 238.52 171.31 S/H144-F 103.63
16-F*-89 S/R547-C T3071 473 137.33 230.12 >OICH0T<2. S.'B547-C 101.41
16-Frt-89 S/n547-F t3070 433 224.69 412.023 224.69 187.33 S/B547-F 97.64
16-f»b-B9 3/B411-C r3069 492 195.31S.fMll-C 103.84
16-F«b-89 S/fl4U-F T3057 460 227.16 422.675 227.16 195.51 417.35 *ICHOT<10 S.'B411-F 98.71
NUreER OF niH BflX STD 0E« HEBN
16-Feb-89 (CniOud T3062 576 10 426.67 3.00 426.67 437.04 4.38 433.09 ^CBlCkjIl 101.30
16-Fs«>-e9 nEI110u«2 T3063 388 10 435.56 MEM10>jt2 99.43
16-Frt-89 nEiiiouts T3064 390 10 437.04HUeEF OF niH ItflX STD OEU BEBN
icniojts 99.10
16-f»b-89 PC«2.5»1 T3065 344 10 234.81 3.00 241.49 266.67 10.29 254.32 >eR2.5«l 99.31
l6-f»tj-89 rc«2.5»2 T31353 326 10 241.43«E«2.5«2 105.32
16-F*-89 rtP12.5»3 T3061 360 10 266.67NUCER OF tllN HIW STO DEV (1EBH
MEK2.3«3 93.37
16-F.*-89 PEHlOutl T4014 326 603.70 3.00 390.74 618.32 11.33 604.32 ihirt for. PEBlOmi 100.10
16-F»b-89 PE'110u«2 T4013 334 618.32PE)110u«2 97.70
16-Ft<)-e9 PEm0ut3 T4012 319 590.74PE>110u*3 1(12.30
16-F»t)-89 PEMlOuM T4019 401 742.59 3.00 503.70 742.39 107.76 S90.74 fr»« Itmd PE)110u«4 79.35
16-Feb-89 PEnl0ut3 T4019 284 525.93PE«10l1«3 112.32
16-Fet>-89 PE1110u«6 T4020 272 303.70NUeER OF BIN BBX STD OEV icm
ta PEt110u«3 117.28
16-f.b-89 PEn2.5tl T40U 187 346.30 3.00 301.35 346.30 20.14 330.25 .hirt For* PEK2.5*! 95.37
16-F*-89 PE«2.!t2 T4010 163 301.83ta PEfG.3«2 109.41
16-F*-e9 PEH2.5«3 T4009 185 342.39PEICS«3 96.40
16-Frt-89 PEn2.3i4 T4013 169 313.32 3.00 309.26 336.83 12.13 319.88 F/S <ta> PEn2.3«4 102.03
16-f«b-89 PErc.sts T4016 182 336.83PE»12.3«3 94.96
16-f'4b-S9 PEK2.sk T40I7 167 309.26ta PEie.sw 103.43
HUTBER OF BIN nflx STO DEVI icm
16-Frt-89 BB-OF B-68 313 579.63 2.00 473.93 579.63 51.83 527.78 flft-CF 91.05
16-F-e-S9 BB-OF B-69 257 475.93BB-CF 110.39
I6-*»b-89 0.00 0.00 0 0.00
16-F*-89 0.00 0.00 0 0.00STBBE 1 '•BS FRBCTEFFECT.CUTSI2E RBMBeCUll. nflSS X inuers4
16-Frt-89 CI-O-1 n-0-6 460 28.3 120.40 23.54 7.0 >7.0 100.00 Cl-0-1 334
I6-F»b-e9 CIHD-2 H-O-2 310 28.3 81.14 13.86 4.7 4.7-7.0 76.45 CI-O-2 310
16-F*-e9 CI-0-3 B-0-3 350 29.3 91.61 17.91 3.3 3.3-4.7 60.59 CI-0-3 190
16-F^«b-89 CI-0-4 H-0-4 190 28.3 49.73 9.72 2.1 2.1-3.3 42.68 Cl-O-4 350
16-Frt-89 CI-0-5 n~0-i 310 28.3 81.14 15.86 1.1 1.1-2.1 32.96 CI-0-5 310
16-Ftb-89 CI-0-8 B-22 33419^.00
28.3 87.42ERR
FILTER 17.09 0.0 0.0-1.1 17.09 ci-o-e 460
16-F«*-89 CI-X-0 P-0-6 320 2S.3 33.76 0 16.92 11.0 >ll.O 100.00 CI-X-0 361
16-F«ti-e9 CI-X-1 W-X-6 40 28.3 10.47 1 2.12 7.0 7.0-11.0 83.08 CI-X-1 310
lt-F»(j-B9 Cl-X-2 ,*-X-2 230 28.3 60.20 2 12.16 4.7 4.7-7.0 80.96 CI-X-2 320
16-^«>-89 CI-x-3 It-H-i 310 29.3 91.14 3 16.39 3.3 3.3-4.7 68.80 Cl-X-3 310
16-F.b-89 CI-X-4 r4-X-4 320 28.3 83.76 4 16.92 2.1 2.1-3.3 52.41 CI-X-4 230
16-Frt-e9 CI-X-3 n-x-5 310' 28.3 81.14 5 16.39 1.1 1.1-2.1 35.48 CI-X-3 40
l6-F«(>-89 ci-x-e B-a 361 28.3 94.49 FILtER 19.09 0.0 0.0-1.1 19.09 CI-X-B 320
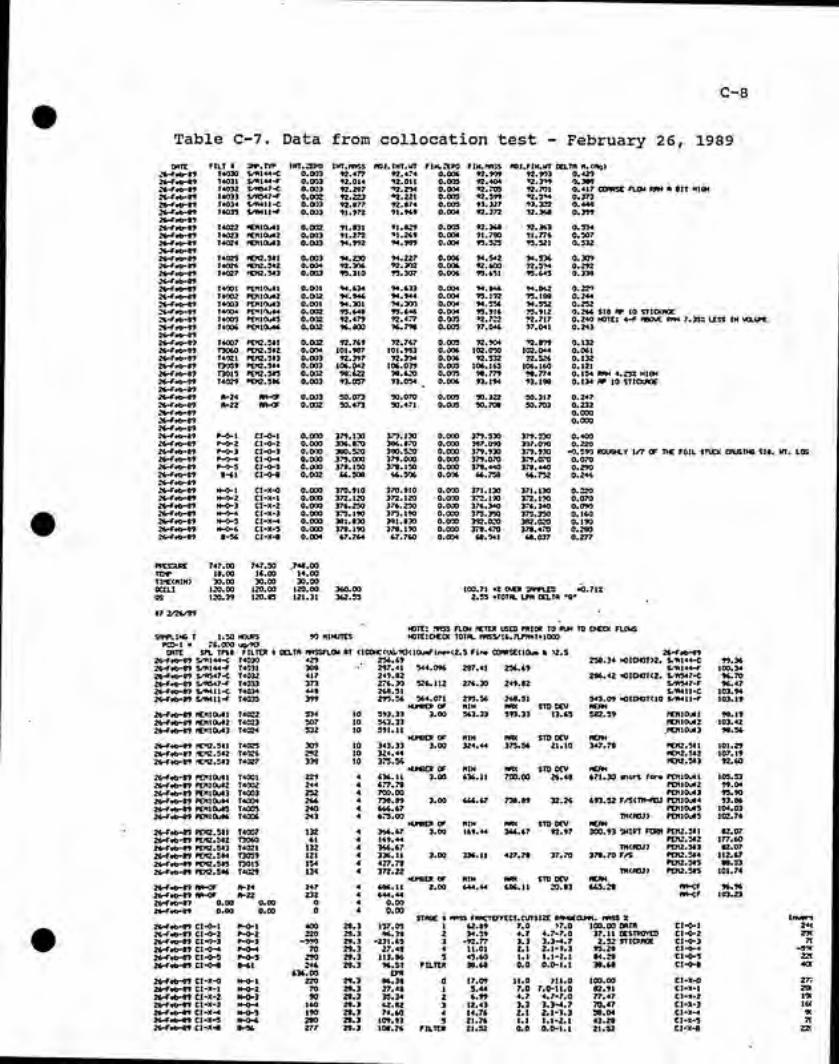
C-8
Table C-7. Data from collocation test - February 26, 1989OBTE FILT • SHP.riT' IKI.CERO IMT.NRSS ADJ.IHT.UT FIM.2EP0 FIN.IW3S VI.FIH.WT DELTR H. (Hq)
J»-F«-89 T4030 5.^144-C 0.003 92.477 92.474 O.0O6 92.909 92.903 0.429
»-F*-e9 T«03l S/fll44-F 0.0O3 92.014 92.011 0.005 92.404 ^2.3*9 0.388
»-F«fr-e9 T4r)32 3/T047-C 0.003 92.297 v.z^ 0.004 92.705 92.701 0.417 CORRSE FLOU RAH R BIT HI6H
Jt-F«b-89 T4033 s/re47-F 0.002 92.223 «2.221 0.005 92.599 92.594 0.373
26-Frt-a9 T4034 V»411-C 0.003 92.877 92.874 0.005 93.327 93.322 0.44B
26-F.b-e9 T40n S/Wll-F 0.003 91.972 91.969 0.004 92.372 92.368 0.399
26 rH) 8926-Ft«>-89 T4022 •cniouti 0.002 91,831 91.829 o.oos 92.368 92.363 0.534
2*-»t«>-e9 T40Z3 icniomz 0.0ID3 91.272 91.269 0.004 91.780 91.776 0.507
2fr-F.to-89 T4a24 «Eni0u«3 0.003 94.992 94.989 0.004 95.525 95.521 0.532
»-f*-89iO r^ 89 T40M lere.sti 0.003 94.230 94.227 0.006 94.542 94.536 0.309
36 Frt 89 T4026 reC3«S 0.0O4 92.304 92.302 0.006 92.600 72.394 0.292
2*-F»t,-99 T40S7 ICM2.S«3 0.003 95.310 95.307 0.0O6 95.651 95.645 0.338
i«-rrt,-9926-Feft-89 T4001 PEMlOutl 0.001 94.634 94.633 0.004 94.366 94.862 0.229
26-F*-89 T4no2 PEmOij«2 o.oa 94.946 94.944 0.004 95.192 95.138 0.244
:;6-Frt>-89 T4003 POIlOuiS 0.001 94.»1 94.300 0.004 94.556 94.552 0.252
2t-F»6-S9 T4ri04 Pt^lOuM 0.002 95.648 95.646 0.(U4 95.916 95.912 0.266 SI6 fP 10 STIOCfloe
26-Feb-99 T4IXfl PEHUXitS o.a?2 92.479 92.477 O.OiK 92.732 92.717 0.240 MOTE: 4-F RBOWE RflK 7.35!: LESS IH UOLUrC
24-Frt)-99 T4006 PENlOuK 0.002 96.800 96.799 0.005 97.046 97.041 0.243
2t-Feb-892t-P*t>-39 T4007 PPC.Sil 0.0O2 92.769 92.767 0.005 92.904 "2.899 0.132
?6-F««l-99 T3060 pva.uz 0.0O4 101.907 101.983 0.006 102.050 102.044 0.061
24-F*-89 T4CI21 PEn2.5i3 0.003 92.397 92.394 a.0i]6 92.532 92.326 0.132
2fr-f»-89 T313S9 PEfC.SM 0.003 106.042 106.039 0.005 106.165 106.160 0.121
26-Fsb-89 T30I5 PEn2.5« O.OH 99.622 38.620 0.0O5 98.779 98.774 0.154 RRN 4.25K HI6H
26-F«b-99 T4a29 PCT2.5H 0.003 93.057 93.054 0.006 93.194 93.138 0.134 flp 10 STiQcnoe
26-Feb-8926-F-*-89 R-24 HR-OF 0.003 50.073 50.070 0.005 50.322 50.317 0.247
3«-F(*-89 0-22 HR-OF 0.002 50.473 50.471 0.005 50.706 50.703 0.232
26-F»b-890.000
26-F«b-99O.OOO
2&-F«b-8926-f»(>-39 P-O-t CI-O-l 0.000 379.130 379.130 0.000 379.530 379.530 0.400
»-Frt>-89 P-0-2 CI-0-2 0.000 336.870 386.370 0.000 387.090 S37.090 0.220
26-F»b-39 P-0-3 CI-0-3 O.OiX 380.520 380.520 o.ooo 379.930 379.930 -0.590 R0OSH.Y 1/7 OF THE FOIL STUOC CflUSIHB 518. UT
26-F«>-89 P-0-4 Cl-0-4 o.o» 379.000 379. OiM 0.000 379.070 379.070 0.070
26-Fet>-e9 P-0-5 CI-0-5 O.OlM 378.150 378.150 0.000 379.440 378.440 0.290
3«-F<*-89 B-61 Cl-O-fi 0.002 66.508 66.506 0.006 66.758 66.?5i 0.246
at rrb 8926-F«b-89 (�-0-1 ci-x-0 0.000 370.910 370.910 0.000 371.130 371.130 0.220
2i-Fi*-89 ft-O-i ci-x-1 0.000 372.120 372.120 0.000 372.190 372.190 0.070
26-Frt>-89 H-0-3 CI-X-2 0.000 376.250 376.250 0.000 376.340 376.340 0.090
?6-Frti-89 M-0-4 CI-X-3 0.000 375.190 37^.190 0.000 375.350 375.350 0.160
26-Frt-89 H-O-5 CI-X-4 0.000 381.830 331.830 0.000 382.020 332.020 0.190
2A-Frt)-89 H-0-6 CI-X-5 o.ooo 378.190 378.190 o.ooo 378.470 378.470 0.280
»-Frt-89 B-56 CI-X-B 0.004 67.764 67.760 0.004 68.041 68.037 0.277
PtESSURE 747.00 747.50 748.00
TO*" 18.00 16.00 14.00
Tlrt<mH) 30.00 30.00 30.00
QCtLJ 120.00 120.00 120.00 360.00 100.71 .X OUEK smPLEO -0.71X
OS 120.39 120.85 121.31 362.55 2.55 -TOTAL LPH D6LTR "0-
•7 2/2&.'89
NOTE: rnss flow icter used prior to run to check flousSBTLIHB T 1.50 HOURS 90 niHUiES mote:CHECK TOTAL I1RSS/16.7LP»T*1000
PCO-1 • 76.000 j9/n3drte SPL TP»8 FILTER 1 DELTR MH3SFL0H RT <IC0HCti«.K3<10u«Fir>«.<2.5 Fin. CaoRSEitOiM h >2.S 26-Frt>-89
26-Fet)-89 5^ni44-C T4030 429 256.69258.34 •0ICHDT>2. S.'R144-C 99.36
26-Feb-89 S/R144-F T4031 338 287.41 544.096 287.41 256,69 S,-fil44-F 100.34
26-F*-89 S/S547-C T4032 417 249.82286.42 '0ICH0T<2. S,-R54?-C 96.70
26-F.b-89 S/flS47-F T4033 373 276.30 526.112 276.30 249.82 S/B547-F 96.47
26-F««)-89 S^H41I-C T4034 448 263.513-1(411-C 103.94
26-f*-89 S/H4I1-F T4035 399 295.56 564.071
Mjmer of295.36HIH
268.51STD DEU
545.09HEHH
"<1ICH0T<10 S-^41l-F 103.19
26-FA-89 tcniouti T4022 534 10 593.33 3.00 563.33 593.33 13.65 582.59 HEHlOjtl 98.19
26-f«b-89 Id110ut2 T4023 507 10 563.33neniouta 103.42
26-F.b-89 rEMiooiS T4024 532 10 591.11HUWER OF MIH nm STB 0E« HERN
.HEH10UI3 98.56
26^.F«b-89 rtie.Stl T4025 309 10 343.33 3.00 324.44 375.36 21.10 347.79 HEM2.5»1 101.29
26-F»b-89 ?tK2.5i2 T4026 292 10 324.44nE»2.5t2 107.19
26-feto-89 *l12.5t3 T4027 339 10 375.56HUieER OF HIN IWK STO oev BERH
HEJ12.543 92.60
26-F«t-89 PEHlOutl T400I 229 4 636.11 3.00 636.11 7ro.oo 26.48 671.30 jrtirt for» PCTlOutl 105.53
26-F»ti-89 PEN10ui2 T4QD2 244 4 677.73PEH10U42 99.04
26-F.b-89 PEm0ut3 T4003 252 4 700.00PEniom3 9S.90
2«rT-t>-89 PEHlQuM T4004 266 4 738,89 3.00 666.67 738.89 32.26 693,52 F/S<T»l-flDJ PEII10u»4 93.86
26-F«t>-e9 PEHlOutS T4005 240 4 666.67PEnl0u<5 104.03
26-FA-89 PE1110U86 T4006 243 4 675,00TIKROJ) PEni0u«5 102.74
HUWER OF niN nPK STD OEV NERH
26-F<b-a9 PEHZ.Sil T4007 132 4 366.67 3.00 169.44 366.67 92.97 300,93 WIRI FOWl PEn2.311 82.07
26-F46-89 PE'C582 T3060 61 4 169.44PEn2.3«2 177.60
26-Frt>-99 PEM2.5t3 T4021 132 4 366.67T«<HW) PEn2.5t3 82.07
26-f«b-89 PER2.5t4 T3059 121 4 336.11 3.00 336.11 427.78 37.70 378.70 F/S P012.5«4 112.57
26-f«6-89 PEN2.5t5 T3015 154 4 427.78PEI12.5»5 88.53
26-F««>-89 PEK2.St6 T4029 134 4 372.22MUt«ER OF NIH HflX STD DEU NERM
W<flOJ) PEM2.5i5 101.74
26-F«t>-89 nfi-OF R-24 247 4 686.11 2.00 644.44 636.11 20.83 665.29 flfi-CF 96.96
26-F.b-39 RR-OF R-22 232 4 644.44flfi-CF 103.23
Ifrftb-m 0.00 O.OO 0 4 0.00
26-FM>-89 0.00 0.00 0 4 0.00STRee • "WSS FRBCTEFFtCT.CUTSIZE RRHSECWtl. rWSS X
tnutr?
2«-F*-e9 CI-O-l P-O-I 400 28.3 137.05 I 62.89 7.0 >7.0 100.00 OBTR CI-O-l 24«
26-F*-89 CI-0-2 P-0-2 220 23.3 86.38 2 34.59 4.7 4.7-7.0 37.11 OeSTROYED CI-0-2 29C
26-F»t>-89 CI-O-3 P-O-3 -590 28.3 -231.65 3 -92.77 3.3 3.3-4.7 2.32 STICKHGE CI-0-3 n
26-ff*>-89 CI-0-4 P-0-4 70 29.3 27.48 4 11.01 2.1 2.1-3.3 95.28 Cl-0-4 -59(
26-f««>-89 CI-0-5 P-O-S 290 28,3 113.86 5 45.60 1.1 1.1-2.1 84.28 CI-0-5 22<
26-F«t-e9 Cl-O-fl B-tl 246 28.3 96.53 FaTER 38.68 0.0 0.0-1.1 38.68 CI-O-B 40(
636.00 EPR
26-f«6-89 CI-X-0 M-0-1 220 29.3 96.38 0 17.09 11.0 >11.0 100.00 CI-X-0 ZT.
26-Ftt>-89 CI-X-1 H-0-2 70 29.3 27.49 1 S.44 7.0 7.0-11.0 82.91 CI-X-l 28(
26-frti-99 CI-X-2 M-0-3 V) 28.3 3S.34 2 6.99 4.7 4,7-7.0 77.47 CI-X-2 !•*
26-FHJ-89 CI-X-3 H-0-4 160 28.3 62.82 3 12.43 3.3 3,3-4.7 70.47 CI-X-3 \tt
26-F.t>-89 CI-X-4 H-0-5 190 28.3 74.60 4 14.76 2.1 2.1-3.3 58.04 CI-X-4 9
2«-F«b-e9 CI-X-5 t*-0-6 280 28.3 109.93 5 21.76 1.1 1.1-2.1 43.28 CI-X-5 71
26-F«b-89 CI-X-B B-56 277 28.3 108.76 FILTER 21.52 0.0 0,0-1,1 21.52 CI-K-8 ZZ(

C-9
Table C-8. Data from collocation test - March 6, 1989D«TE FILT I SMP.TVP IKT.rERO IMT.nHSS lOJ. INT.UT FlN.2Ero eiH.ttKS IWJ.FIH.UT OELTft H.<r*j>
06-IHr-91' T*>il Vm44-C 0.0O4 95.604 95.600 0.003 96.111 96.108 0.508
06-««-3« T*>4J V«144-f 0.003 94.383 94.J50 0.004 94.846 94.842 0.*42
06-«3r-8-» T40<3 iT047-C 0.003 93.078 93.075 0.004 93.592 93.598 0.513
r)6-n<r-eil T4t"H4 VH547-F O.0O3 92.878 92.875 0.0O4 93.334 93.330 0.455
06-flar-eo TVH'i 3/B411-C 0.004 95.933 95.829 0.0O4 96.318 96.314 0.485
06-«jr-r« T40«6 5/»4U-f 0.005 93.852 93.847 0.004 94.346 94.342 0.495
«-«»—9?06-M»-99 T4058 «ni0u41 0.003 103.469 105.446 0.005 106.114 106.109 0.643
»-«»—93 r<059 icni0u«2 0.004 91.130 91.126 0.004 91.729 91.725 0.599
06-flar-89 T4O60 «BlCk.i3 0.004 107.396 107.892 0.005 108.520 108.515 0.623
06-fl»-B906-««—99 T4055 i«n2.3ii 0.003 92.043 92.040 0.005 92.397 92.392 0.352
06-fHr-8? T4034 l«!C!42 0.003 109.133 109.130 0.004 109.467 109.4*3 0.333
06-tt«r-89 T4057 tm.ui 0.003 110.159 110.156 0.003 110.513 110.510 0.354
06-fljr-9906-War-89 T4102 PEBlOjil 0.0O4 106.498 106.4'H 0.002 106.765 106.763 0.269
06-«ir-8? T4103 <'EniiXj»2 0.OO4 109.434 109.430 0.002 109.719 109.717 0.2S7
06-K«—38 T4I04 PEm0u«3 0.0O3 110.533 110.530 0.003 110.3138 110.305 0.275
06-fl»--83 T410S >tni0u44 0.003 109.221 109.218 0.003 109.522 109.519 0.301
06-fl«—39 T4106 °EntiXj45 O.OM 113.221 113.217 0.003 113.478 113.475 0.258 SLISHT (*>-10 ^TICKRBE
06-«ir-89 T4107 PEH10lj»6 0.O54 109.782 109.778 O.OiM 110.030 110.076 Q.29S
%-«»—8906-nar-39 T406*, PEfG.Sil O.OOl 111.387 111.336 0.001 111.316 111.515 0.129
06-njr-39 T4067 PEn2.5i2 0.003 108.SOS 108.505 0.002 108.637 108.635 0. 130
06-««r-a9 T4n6a 9EfI2.S«3 0.003 90.164 90.161 0.0132 90.304 90.302 0.141
06-nar-89 T4069 PEIG.TM 0.003 110.266 110.263 0.002 110.420 110.418 0.153
06-)1«—89 T4ri7t) PE«2.5« 0.002 114.161 114.159 0.003 114.360 114.357 0.198
06-t1ar-89 T4071 ^ElC.St* 0.002 114.031 114.029 0.004 114.181 114.177 0.148 lEFLCM EDOE JWfBE TCRt
'»-«*—89«-Hir-89 ft-« flB-OF 0.003 49.119 49.116 0.0O4 49.462 49.458 0.342
06-flar-89 R-67 Wt-OF 0.003 48.915 48.912 0.003 49.265 49.262 0.350
06-flar-890.1300
06-Mar-890.000
06-t1ir-8906-»1»r-89 M-X-1 CI-O-l o.ooo 372.000 372.000 0.000 372.500 372.500 0.500
06-flar-99 l-X-2 CI-0-2 0.000 375.2O0 375.200 O.OiX 375.410 375.410 0.210
06-fl»r-99 M-<-3 CI-0-3 0.000 376.130 376.130 0.000 376.420 376. 420 0.290
06-n»—89 H-X-4 CI-O-4 0.000 375.370 375.370 0.000 375.670 375,670 0.300
06->1»-89 N-X-^ CI-0-5 0.000 374.360 374.360 0.000 374.730 374.730 0.42O
06-«»—89 8-W ci-o-e 0.003 66.342 66.339 0.003 67.117 67.114 0.275
06-l1«--8906-l1ar-89 P-X-1 ci-x-0 0.000 383.330 383.330 0.000 383.610 333.610 0.280
05-fl*—89 P-<-2 ci-x-1 0.000 379.660 379.660 0.000 379.750 379.750 0.090
06-njr-89 P-X-3 CI-x-2 0.000 380.290 380.290 0.000 330.450 380.450 0.160
06-<1»-89 P-X-4 CI-X-3 o.ooo 382.380 332.eso 0.000 333.200 383.200 0.320
06-Har-89 P-:<-5 ci-x-i 0.000 383.150 333.150 0.000 383.470 333.470 0.320
06-fla.—89 P-x-4 CI-X-5 0.000 374.200 374.200 0.000 374.550 374.550 0.350
06-nar-89 B-M Cl-x-fl 0.002 65.782 65.780 0.004 66.034 66.080 0.300
PRESSURE 747.50 747. so 747.50
TEf«> 14.00 11,50 9.00
TIrtCI1IN> 30.00 30.00 15.00
actLT 120.00 120.00 60.00 300.00 01.41 • /. 0(CR «»f>LED •I.41-,!
as 121.27 121.80 61.1? 304,244.24 .TOTAL LPn DELTA -0-
n 3/06/89
NOTE: PBSS FLOU rCTER IJSED PRIOR TO HUH TO SPOT CHECK FL0U3 QH.Y-MITHIM3;;3<»»>LINB T 1.25 HOi.es 75 HIHUTES hote:check total flRS >.-16.7LPI» T»iooe
PCD-1 93.000 UC1.-K3OBTE SPL TPil FILTER t DELTR HBSSFLOM RT <lCOHC(US^T13<10urfir»» .2.5 Fiiw COPRSEClOm It >2.5
06-«ar-89 i'flI44< T4041 508 . 364.52338.96
06-fl*—39 S/fll44-f T4042 462 410.67 775.189 410.67 364.52
06-««-89 VB547-C T4043 513 369.14418.37
0b-H«-89 S^fl547-F T4044 455 404.44 773.581 404.44 369.14
06-«4r-89 i-8411-C T4045 485 343.23
06-«»-89 S/S411-F T4046 495 440.00 733.226MUWER OF
440.00NIH
343.23STO DEV
778.40nEPH
06-rUr-89 fcnioufi T4058 643 10 857.33 3.00 798.67 857.33 23.98 828.89
06-«»-39 nElll0ul2 T4a59 599 10 798.67
06-rnr-e9 rCMiOuts T4060 623 10 830.67NUMBER OF niN IKK STD DEV ICAN
06-Mar-89 HEIC.SIl T4055 352 10 469.33 3.00 444.00 472.00 12.62 461.78
06-M«~-e9 re«2.Si2 T4056 333 10 444.00
06-nar-89 1CH2.50 T4057 354 10 472.00HLreER OF niH xnt STD OEV »esn
06-fl»-89 PEPllOull T4102 269 4 896.67 3.00 896.67 936.67 24.94 923.33
06-n»-89 PEftl»Jt2 T4103 287 4 956.67
06-flir-39 PEniOut3 T4104 275 4 916.67
06-t1ar-89 PEHlOuM T4105 301 4 1003.33 3.00 860.00 1003.33 65.34 952.22
06-*1jr-89 PEB10u»5 T4t06 2M 4 860.00
06-fln—89 PEH10u»6 T4107 298 4 993.33HUreER OF niN WK STD OEV resH
06-««-89 PEHa.Stl T4066 129 4 430.00 3.00 430.00 470.00 18.12 444.44
06-fl«r-89 l>EB2.5»2 T4067 130 4 433.33
06-fl»-89 PEIC.5«3 T4068 141 4 470.00
06-«»-e9 PEn2.5i4 T4069 J53 4 516.67 3.00 493.33 66O.0Q 73.69 536.67
06-««-89 PE«2.5«5 T407O 198 4 660.00
06-fl»-89 PErG.386 T4071 148 4 493.33NU«ER OF niN nm STD OEV ICRH
06-tla—89 m-OF lt-66 342 4 1140.00 2.00 1140.00 1166.67 13.33 tlS3.33
«-t1»-89 HB-OF «-*? 350 4 1166.67
06-««r-89 0.00 0.00 0 4 0.00
06-fHr-89 0.00 0.00 0 4 0.00STB6E • imSS FRBCTEITECT.CUTSIZE PBHeECUtl, nOSS
06-««—89 Cl-O-1 H-X-1 500 28.3 196.31 1 23.06 7.0 >7.0 100.00
06-«*-89 CI-0-2 H-X-J 210 28.3 82.45 2 10.53 4.7 4.7-7.0 74.94
06-««—89 CI-0-3 (t-X-3 290 28.3 113.86 3 14.54 3.3 3.3-4.7 64.41
06-»i*-e9 CI-0-4 M-X-4 300 28.3 117.79 4 15.04 2.1 2.1-3.3 49.87
06-l1«r-89 CI-0-5 t4-X-3 420 28.3 164.90 5 21.05 1.1 1.1-2.1 34.84
06-««r-89 ci-o-e 9-59 2751OT5.00
28.3 107.97ERR
FILTER 13.78 0.0 0.0-1.1 13.78
06-n«—89 CI-X-0 P-X-l 280 28.3 109.93 0 15.38 n.o >II.O 100.00
06-»Ur-89 CI-X-l -X-2 90 29.3 35.34 I 4.95 7.0 7.0-11.0 94.62
06-«»-89 CI-X-2 P-X-3 160 28.3 62.82 2 8.79 4.7 4.7-7.0 79.67
06-n«r-89 CI-X-3 P-X-4 320 28.3 125.64 3 17.58 3.3 3.3-4.7 70.88
06-«.r-89 CI-X-4 P-X-5 320- 28.3 125.64 4 17.58 2.1 2.1-3.3 53.30
06-n«r-89 CI-X-5 l>-X-< 350 28.3 137.42 S 19.23 1.1 1.1-2.1 35.71
06-H«r-S9 Cl-X-e »-so 300 28.3 117.79 FILTER 16.48 0.0 0.0-1.1 16.48
06-fl»-89OICH0T>2. S/BIM-C
S/«144-FOICH0T<2. S/fl547-C
S/^547-FS/B411-C
>OICH0T<10 S/fi411-F
)CK10uiltcnic>j«2teB10u«3
ME«2.5»1HE«2.5«2
FLOUS OCED nEH2.5»3NOT RDJSHIRT F PEMlOutl
PEt110u42peiiou#3
F/S<TO> PE«10u*4PEHlOuiS
m PEHiOutft
SHIRT FORn PE«2.5»IPEI12.542
T« PEri2.5»3F/S PEJI2.544
PEH2.5«5TB PEI12.5»6
HB-CFBft-CF
CI-O-lCI-0-3CI-0-3CI-0-4CI-0-5ci-o-e
Cl-X-flCI-X-1CI-X-2CI-X-3CI-X-4ei-X-5ei-x-e
101.5598.16102.8396.6795.62
105.17
96.68103.7899.79
98.39104.0097.83
102.9796.52100.7394.91110.7295.86
103.36102,5694.56107.7484.34112.84
101.1798.86
Inuersff275.420.
300.
290.210.500.
300.350.320.320.
160.90.
280.

C-10
Table C-9. Data from collocation test - March 11, 1989OBTE FILT • SflP.TVP IHT.JSRO IHT.nRM IWJ.INT.UT FIH.2ER0 FiM.nn-iS noj.FiN.uT acLTn n. in,)
ll-l1»-99 T4037 VH144-C 0.001 91.433 91.434 0.003 92.103 92.100 0.666
n-fta-a? r4n39 S,'fll44-F 0.002 91.419 91.416 0.004 91.962 91.958 0.342
llHta-W T*i39 ViW47-C 0..>13 95.335 95.332 0.040 »3.933 »5.913 0.381
li-nai—ao T4O40 t/BS4r-F 0.003 93.332 93.379 0.0O4 93.397 93.893 0.514
il-ii»-*) T4IJ6; 3^«4U-C o.om 96.6'J3 96.601 0.004 97.231 97.227 0.626
ii-««—»9 T4IJ61 iAMU-F 0.0O3 96.8o7 96.864 0.003 97.413 97.410 0.346
ii-n,-a»ll-ltar-aS r4i09 MEniOu*! O.OM 114.13S 114.134 0.003 114.900 114.897 0.763
U-flal-ao T4109 MEni0u«2 0.004 111.906 111.902 0.003 112.632 112.649 0.747
U-n>r-»9 T4U0 nEni0u«3 0.004 93.172 93.168 o.tyM 93.922 93.918 0.750
ll-tUr—8911-I1.-89 T41U nE«2.Stl 0.003 110.215 110.212 O.OiM 110.639 110.633 0.423
ll-«a>—89 T4112 f1EfC.3»2 O.I»4 110.358 110.354 0.001 110.931 110.930 0.376
ll-«»-89 T4113 rtn2.3t3 0.003 11S.4<^ 115.459 0.002 115.830 115.848 0,389
ll-fU»-«ll-«»r-9o T4r»49 PEf1I0u«l o.cni 92.618 92.617 0.003 92.965 92.962 0.345 3HIRT F0IW3IS. KPIO STICKHX
ll-«ar-3? T*»9 PEf1ll>j«2 0.001 88.735 88.734 0.0O4 99.073 99.071 0.337 SHIRT FORM
ll-ll«-99 T4050 PEnlOu»3 0.OJ3 93.714 "3.711 0.002 94.034 94.032 0.321 FREE STBHD
ll-na—99 T4051 PEnl0.jM 0.0O4 103.738 103.734 0.001 104.051 104.050 0.316 FREE STBHO
ii-n«-99 r4cr52 PEnlOutS 0.003 04.115 94.112 0.003 94.441 M.438 0.326 PEOPLE JP
ll-fta—99 r4053 f>EM10u»6 0.003 <13.3;J3 93.347 0,»33 93.668 93.6'>5 0.319 POEPLE Rfl
n-fl*-89 106.10
ll-«l«-99 T4064 PEM2.3«1 O.OOl 112.441 112.440 0.004 112.612 112.608 0.168 SHIRT FORn
ll-n«<—39 T4065 PEM2.5t2 0.002 103.9el 105.959 0.003 106.115 106.112 0.153 SHIRT FORM
11-n*—99 T4081 PEN2.5»3 0.005 111.337 111.332 0.003 111.496 lll.4->3 0.161 FREE STfKC
ll-lta-99 T4032 PEM2.3M 0.0D6 108.379 108.572 0.003 108. 749 103.746 0.174 FREE STRtO
Il-lar-9^ T4IJ99 PETC.srs 0.004 110.604 110.600 0.0O4 110.780 110.776 0.176 PEOPLE JP
ll-1»-e9 T4084 f^n2.5t6 0.006 109.560 109.354 0.004 109.714 109.710 0.156 POEPLE Rfl
11-<1«—89ll-Ma.—89 »-23 m^-i-r 0.003 50.446 30.443 0.003 30.913 30.810 0.367
!!-««—99 ft-25 m-oF 0.003 50.423 30.420 0.0O4 30.810 30.806 0.386
ll-nar-990.000
U-««—39O.OOO
ll-tl»~-99ll-K»-«9 R-x-2 CI-O-l O.OIO 374.270 374.270 0.0i» 374.920 374.920 0.650
ll-tlar-99 R-<-3 CI-O-2 O.OOO 385.630 395.630 O.OOO 336.000 336.0'X 0.320
ll-H«-99 R-X-J ;i-o-3 0.000 378.740 378.740 0.000 379.030 379.030 0.340
ll-H^r-ao R-.-(-5 CI-0-4 O.OM 3S6.330 336.8T0 0.0130 397.140 397.140 0.260
lI-Hjr-99 R-J<-6 CI-0-3 0.000 391.300 391.3>X3 O.OOO 391.670 3->1.670 0.370
11-IUr-99 B-53 Cl-O-fi 0.001 07.887 67.836 0.004 68.240 68.236 0.350
ll-»lar-99tl-n»-99 O-X-l CI-X-0 O.OOO 378.990 378.890 0.0.M 379.390 379.590 0.700
!!-««—99 O-X-2 CI-X-1 0.000 380.930 330.930 O.OiM 331.160 331.160 0.230
ii-n«—99 a-x-3 CI-X-2 0.000 376.100 376. 100 O.OiM 376.290 376.290 0.190
U-««r-S9 a-.<-* CI-X-3 0.000 384.020 394.020 0.000 394.260 394.260 0.240
11-Bjr-99 a-:<-5 CI-X-4 0.000 373.290 373.290 0.000 373.640 373.640 0.35.5
ll-«ar-99 a-:<-4 CI-X-3 0.000 378.860 378.860 0.000 379.260 379.260 0.400
Il-«ar-S9 8-53 CI-X-B 0.003 67.561 67.558 0.003 67.933 67.932 0.394
PRFS3URE 760.00 7«0.00 760.00
TtfP 24.50 28.00 29.50
Tlrt<HIH) 30.00 30.00 38.00
accLi I2O.0O 120.00 132.00 392.00 99.58 •;; OVER ?»»f>LEO •o.tzx
as 120.10 U9.40 130.87 390.37 -1.63 •TOTAL LPM DEUTft O"
19 3/H/S9
NOTE: mSS FLOW METER iJSED PRIOR TO RUN TO CWCK FLOWSSflnPLIMB T 1.63 HOUR? 98 niHUTES HOIElCHECx; rOTB, nBSS/16.7U>mT»1000
PCO-1 ' 90.000 JQ.'»13DBTE SPL TPr,i FILTER 1 OELTR nftSSFLOM RT <lC<>C(UG/113<10urfin»»<-2.5 Fit» C0nRSE<10u. h >2.5 !!-««—89
U-nar-89 Vfll44-C T4037 666 370.07345.16 *ICH0T>2. s^'ni44-.: 107.22
ll-fl3r-89 S/^144-F T4039 542 368.71 738.778 368.71 370.07 S/B144-F 101.50
11-nar-89 S/'n547-C T4039 381 320.04 363.27 -0ICH0T<2. S.'K547-C 92.72
ll-fl«~89 S/nS47-F T4040 514 349.66 669.698 349.66 320.04 S/«547-F 9^.25
ll-«»-89 S/H411-C T4062 62« 345.36s/iMu--; 100.06
II-nar-89 S/-n4ii-F T4061 546 371.43 716.736 371.43 345.36 693.24 ^3ICH0T<10 S.1M11-F 102.25
HUteER OF nIN WK STD OEV rCHH
Il-li«~89 lOiiomi T4108 763 778.57 3.00 762.25 779.37 7.09 768.71 tt»110ij«l 99.73
U-«ar-89 ICniOut2 T4109 747 762.23»cm0u«2 100.85
ll-«»-89 fCHlOutS T4110 730 765.31HUeER OF HIN IWX STD DEV fCflN
nEH10u«3 100.44
ll-««r-B9 I«ri2.3ii T4111 423 431.63 3.00 383.67 431.63 20.22 404.08 ICn2.3»l 93.62
ll-flar-89 npc.itz T4U2 376 393.67itnj.3»2 105.32
ll-llar-89 l*IC.5t3 T4113 383 396.94HUWER OF niH MBX STD DEV HERN
ALLRDJ
FLOMS-4Um
rcrt2.5«3 101.30
ll-Hw—89 PENlOutl T4048 343 880.10 2.00 839.69 980.10 10.30 869.90 F.-S PEJIlOu*! 98.84
ll-fl»—89 PO110ui2 T4049 337 »59.69PEnl0ij«2 101.19
lI-fHr-89 PEniOut3 T4I350 321 818.89 2.00 806.12 818.88 6.38 812.30 SHIRT FORIi PEfll0u«3 106.23
ll-n«r-89 PCnl0u«4 T4051 316 906.12PEW10J44 0.00
Il-*1«f—89 PEM10u«S T405a 32« 831.63 2.00 811.22 831.63 10.20 821.43 PEOPLE pemckj«5 0.00
ll-t(ir-e9 PEN10u»6 T4053 318 811.22ALL FUOUS PEM10u*i 0.00
NureeR OF niH nRX STO OEV HERN noj -4LPt1
ll-««-«9 REna.sti T4064 168 428.37 2.00 390.31 428.57 19.13 409.44 F/S PEIC5«1 9S.54
U-fljr-89 PEn2.5t2 T4063 133 390.31PE?e.342 104.90
lI-««-e9 PEn2.3«3 T408t 161 410.71 2.00 410.71 443.88 16.58 427.30 SHIRI FCRJ1 PEIC.3«3 99.69
1I-R»~«9 PEnZ.SM T4082 174 443.88PE»C.5»4 0.00
ll-fl»-89 PEIC.SK T4099 176 448.98 2.00 397.96 448.98 25.31 423.47 PEOPLE PEie.5«S 0.00
11-«»—89 PCn2.SK T4084 156 397.96ALL FUOHS PEfG.5*5 0.00
HUIWER OF niN HftX STO OEV HERN
ll-««—99 Bft-OF A-23 367 936.22 2.00 936.22 984.69 24.23 960.46 BR-CF 102.59
ll-ttjr-89 HB-OF ft-25 386 994.69SH-CF 97.54
ll-«jr-89 0.00 0.00 0 ERR
ll-««-e9 0.00 0.00 0 ERRSTIWE t •tSS FRBCTEFFECT.CUTSIZE RflMeECUT. nHSS X
InMvrs^
ii-HBT—e? CI-O-l R-x-2 650 2S.3 234.37 1 28.38 7.0 >7.0 100. OO CI-O-l 350.
Il-Har-99 CI-O-2 B-X-3 320 28.3 113.38 2 13.97 4.7 4.7-7.0 71.62 CI-0-2 370.
n-(i»-89 Cl-0-3 R-X-4 340 28 .3 122.59 3 14.35 3.3 3.3-4.7 S7.64 CI-0-3 260.
ll-nar-99 CI-0-4 R-X-3 260 29 .3 93.75 4 11.33 2.1 2.1-3.3 42,79 CI-0-4 340.
It-n»—99 CI-0-3 R-X-« 370 28.3 133,41 5 16.16 1.1 1.1-2.1 31.44 CI-O-5 320.
ll-41ar-99 ci-o-e B-53 3S02290.00
28.3 126.20EFR
FILTER 15.28 0.0 0.0-1.1 15.28 ci-o-e 650.
ll-«»—99 CI-X-O 0-x-l 700 23.3 252.40 0 27.96 11.0 >11.0 100.00 CI-X-0 394.
ll-Mar-99 ci-x-i O-X-2 230 28.3 82.93 1 9.19 7.0 7,0-11.0 72.04 CI-X-1 400.
ll-««r-e9 CI-X-2 8-X-3 190 28.3 68.31 2 7.59 4.7 4.7-7.0 62.S6 CI-X-2 330.
ll-«4>—89 Cl-X-3 O-X-4 240 28.3 96.34 3 9.58 3.3 3.3-4.7 55.27 Cl-X-3 240,
U-«»-89 CI-X-4 B-X-5 350, 28.3 126.20 4 13.99 2.1 2.1-3.3 45.69 Cl-X-4 190.
ll-ll«—89 CI-X-3 O-X-6 400 28.3 144.23 5 15.97 l.I 1.1-2.1 31.7t CI-X-5 230.
lt-«1«r-e9 CI-X-B 8-35 394 28.3 142.06 FILTER 15.73 0.0 0.0-1.1 15.73 CI-X-B TOO.

C-11
Table C-10. Data from collocation test - March 14, 1989ORTE FILT • jrr.ivp INT.iTSO iMT.mss nOJ. INT.WT fim.;ero FIM.n«KS <OJ.FIN.UT nn-Tfl B. CI
l*-nx~9^ T4115 3/^144-C 0.004 ioe.901 108.997 0.003 109.620 109.617 0.720
l4-tta—» r4ii6 3^144-F 0.004 10&.472 106.468 0.004 107.098 107.094 0.626
1«-(1»^8S t4117 S/S547-C 0.003 116.463 116.458 0.004 117.203 117.199 0.,-41
14-«ar-9^ T4113 S^«547-F o.oos iae.964 108.359 0.006 109.440 109.434 0.573
I4-nji—9S T4119 S^-B411-C o.oos 111.210 111.205 0.006 111.948 111.942 0. .-37
l4-»U.-9914-«ar-Wl4-na.-W
T4I20 S/n411-F 0.0O4 1U.499 111.695 0.003 112.323 112.320 0.625
T4096 fcniouii O.OiM 111.220 111.216 0.005 112.069 112.064 0.948
l4-n«-« T4I390 ieiiiou»2 0.002 110.667 110.665 0.003 111.476 111.471 o.ao*
14-lUr-99 T40e9 rcni0u*3 0.002 110.32* 110.524 0.004 111.329 111.325 0.301
I4-nj.-8914-«a^« T408* foc.sn 0.005 114.323 114.823 0.001 115.278 115.277 0.454
l4-nar-99 T4077 rcra.^K 0.003 114.992 114.987 0.003 115.421 113.416 0.429
14-Mjr—»9 r4075 ICIC.5t3 0.004 94.199 94.193 0.006 94.632 94.646 0.451
14-«a~?9I4-n«~*9 T4085 PEniOu«l 0.006 110.344 110.838 0.000 111.191 111.191 0.353
14-fl»—W T4083 l>Eni0ui2 0.007 112.851 112.844 0.003 U3.192 113.189 0.545
M-nar-W T40?4 PEHlOu«3 0.O32 109.493 109.491 0.006 109.399 109.893 0.402
14-n»—8S r40r5 f>EniOij*4 0.0O4 113.6)4 115.610 0.005 114.0157 114.012 0.392
14-«jr-r> r4iD93 P£BliXit3 0.0O4 108.259 I'M. 255 0.0O3 108.356 108.331 0.296
14-«ar-*9 T4093 PEniOu** 0.003 107.043 107.040 0.005 107.414 107.409 0.369
M-lt»—«l4-nir-J* T4074 PEfG.Stl 0.004 88.035 98.031 0.005 38.204 38.199 0.163
l4-nar-B^ T40r6 pere;.5«2 0.005 90.390 90.535 0.0135 90.747 90.742 0.157
H-n3r-9i T4r)r9 PErG. 5i3 0.004 111.698 .11.694 a.aoi 111.379 111.374 0.18O
l4-tt«—OT T4091 PEn2.5«4 0.002 112.093 112.091 0.005 112.267 112.262 0.171
14-«ii—8S T4092 PE«:.5f5 0.004 112.488 112.484 0.0O3 112.674 112.669 0.185
l4-llar-39 T4097 PEn2.5« 0.003 115.723 115.720 0.0O6 113.896 115.890 0.170
14-fljf—W14-Mar-OT H-&3 flR-OF 0.0O2 48.443 48.441 0.003 48.863 48.360 0.419
l4-«ai—99 «-64 f¥*-<r 0.002 47.773 47.773 0.003 48.179 48.176 0.403
l4-n3r-990.000
14-n*—wO.OOO
14-Kar-9914-nji—39 B-0-2 CI-0-1 0.000 380.380 390.830 0.000 381.730 381.790 0.9OO
14-n3r—39 P->3 CI-0-2 0.0i» 377.320 377.820 0.000 378.260 378.260 0.440
14-»1»—89 R-T-4 CI-0-3 O.OOiD 371.350 371.530 0.000 372. OiX 372.000 0.450
l4-nar-39 R-.>? CI-0-4 0.»M 331.^:50 3S1.550 O.OiM 331.900 3S1.900 0.350
14-r1jr-39 R-0-^ C I -0-'5 0.000 386.080 396.090 0.000 336.590 336.590 0.510
l4-«ar—^7 B-«7 ci-o-e 0.004 66.341 66.337 0.003 66.773 66.770 0.433
14->t»-99l4-nar-39 '>-0-l CI-X-0 0.000 382. ?90 392.990 0.000 383.650 393.650 0.660
l4-njr-39 3-0-2 CI-S-1 O.WM 386.740 3:S6.740 O.OiM 386.920 396.920 0.180
H-Hil~»? 0-6-3 CI-X-2 0.000 382.260 382.2<i0 0.000 382.610 382.610 0.350
14-»1ar-99 0-0-4 Cl-X-3 0.000 380.730 390.730 O.OOO 381.190 391.190 0.4613
14-nar-ff9 I3-IJ-5 CI-X-4 o.ooo 388.300 388.800 0.000 389.230 399.250 0.450
14-fl»-3-? 0-0-4 CI-X-3 0.000 383.030 383.030 0.000 383.460 3S3.460 0.430
l4-»ljr-89 B-68 CI-X-8 0.004 66.346 66.342 0.006 66.800 66.794 0.452
TEWTinE<niH>SCtLl
754.0021.0030.00120.00120.34
754.00 754.00 754.0024.0030.00120.00119.73
26.0030.00120.00119.33
27.5030.00120.00119.03
480.00478.41
99.67 .X UMOB! 3BHPLE0-1.59 •TOTAL LRU OELTft '
"0.33X
S«>LIH$ r 2.00 HOiJI?? 120 NIMUTES moie: CHECK TOTAL WBVie.TUPmTHOOOPCO-1 • 86.000 JO-'KSORTE SFL TP»t FILTER • OELTB NB3SFL0N RT <lCaHC(U&'K3<10uaFin*«2.3 Fine course;i0u« 4 >2.3 14-tv»—99
t4-»tar-e9 S.^144-C T4115 720 324.30 331.79 4ICH0T>2 3.'fll44-C 97.80
I4-ltar-89 S/R144-F T4116 626 347.78 672.281 347.78 324.50 S.--ni44-F 102.85
14-ll4r-89 S/1047-C T4U7 741 337.82 333.15 <ICH0T<2 SXS547-C 101.82
14-»lar-e9 S/S347-F T4118 573 319.44 657.260 319.44 337.32 S.fl547-F 94.47
14-n«—89 S^«411-C T4119 737 333.04 S/B411-C 100.38
14-n«-89 S/B4I1-F T4120 625 347.22 680.264 347.22 333.04 668.76 H)ICH0T<10 S,-fl411-F 102.68
l««ER OF KIN BBX STO OEV HERN
14-tljr-89 teniouti T4096 348 10 706.67 3.00 667.30 706.67 17.56 681.94 ItKlOj*! 96.30
14-flar-e9 !Cni0u42 T4090 806 10 671.67 icniojts 101.53
14-»1«-89 tcmout3 T40e9 301 10 647.50MUSER OF NIN imx STO OEV HERN
mii>ji3 102.16
H-tttr-n rE)C3ll T4086 454 10 378.33 3.00 357.50 378.33 9.29 370.56 l«)i2.3«l 97.94
14-«ar-89 Itn2.3t2 T4077 429 10 357.50 IC»e.3»2 103.63
14-(1«—89 Itn2,5t3 T4075 451 10 375.83NUVER OF niN nm STO OEV flERH
ICR2.583 98.60
14-n»-89 PEHlOutl T4085 353 733.42 2.00 718.75 735.42 3.33 727.08 SHIRT FOm PEniOutl 98.87
M-ftar-e? PEnl0u«2 T4088 343 718.75 PEI11(>J«2 101.16
14-fljr-89 PEKlOutS T4094 402 837.50 2.00 816.67 837.30 10.42 827.08 F/S PEH10u»3 36.82
14-«»—89 PEniOuM T4093 392 816.67PEmOiji4 0.00
i4-fi«-e9 PEni0ut3 T4098 296 616.67 2.00 616.67 763.75 76.04 692.71 PEOPLE PEWlOuiS 0.00
i4-iiir-e9 PEniOuw T4093 369 768.75HUraER OF niN WK STD OEV HERN
PEniOutS 0.00
I4-I1V-89 PEtC.Stl T4074 168 350.00 2.00 327. re 350.00 11.46 333.54 SHIRT FCRB PEKJ.Stl 96.73
l4-tl«—89 REB2.3t2 T4076 157 327.03 PEK2.Si2 103.30
14-fla~89 PETE.513 T4079 180 373.00 2.00 356.25 373.00 9.3S 36S.63 F/S PEIG.543 90.28
I4-«jr-89 PEn2.3t4 T4091 171 356.25PEn2.5»4 0.00
14-«jr-e9 PEfC.StS T4092 183 385.42 2.00 354.17 335.42 15.63 369.79 REOPU PEJG.SiS 0.00
14-««-S9 PPC.5I6 T4097 170 354.17PEIC.StS 0.00
tUSEK OF niH imK STD OEV HERH
l4-fl«—89 flR-OF B-43 419 372.92 2.00 839. S8 372.92 16.67 856.25 flIV-CF 98.09
l4-flar-89 m-OF A-«4 403 839.53fll»-CF 101.99
14-fl«—89 0.00 0.00 0 ERR
I«-ltar-e9 0.00 0.00 0 ERRSTBSE • >K»SS FRnOEFFECT.CUT SIZE RHNGECUWI. BBSS t
immerse
14-fl»-e9 CI-O-I R-0-2 300 28.3 263.02 I 29.19 7.0 >7.0 100.00 CI-O-1 433. C
;4-fl>t-89 CI-0-2 R-0-3 440 28 .3 129.56 2 14.27 4.7 4.7-7.0 70.81 Cl-0-2 510.(
l4-n»-89 Cl-O-3 R-0-4 450 28.3 132.51 3 14.60 3.3 3.3-4.7 36.54 CI-O-3 350.1
l4-tl4r-e9 CI-0-4 R-0-5 350 28.3 103.06 4 11.33 2.1 2.1-3.3 41.94 CI-0-4 430.!
14-«»—09 CI-0-3 R-0-6 510 23.3 150.13 5 16.54 1.1 1.1-2.1 30.59 CI-0-5 440.V
14-n«—67 CI-O-B e-67 4333083.00
28.3 127.50ERR
FILTER 14.04 0.0 0.0-1.1 14.04 ci-o-e 900.C
14-«»r-89 CI-X-0 0-0-1 660 23 194.35 0 22.13 11.0 >11.0 100.00 CI-X-0 452.t
l4-n«--a9 CI-X-1 0-O-2 ISO 23 53.00 6.04 7.0 7.0-11.0 77.37 CI-X-1 430.1
14-«1«—89 CI-X-2 0-0-3 350 28 103.06 2 11.74 4.7 4.7-7,0 71.83 Cl-X-2 450.1
14-flar-89 CI-X-3 e-o-4 440 23 133.45 3 15.43 3.3 3.3-4,7 60.09 CI-X-3 460.1
»4-l1«-«9 CI-X-4 0-0-3 450- 28 132.51 4 15.09 2.1 2.1-3,3 44.67 Cl-X-4 350.(
l4-l«»-»9 CI-X-5 0-0-6 430 28 I2t.&2 5 14.42 1.1 1.1-2,1 29.58 CI-X-5 130.1
M-IKr-e? ci-x-e S-«8 452 23.3 133.10 FILTHR 15.16 0.0 0.0-1,1 15.16 CI-X-9 660.1

D-1
APPENDIX D
CONSENT FORM
PROJECT: "Indoor and Outdoor Aerosols - Characterization Studies"
PRINCIPAL INVESTIGATOR: Richard M. Kamens, Research Associate Professor,University of North Carolina at Chapel Hill, School of PublicHealth, Department of Environmental Sciences and Engineering
The purpose of this study is to compare the particle exposures obtainedfrom small particle samplers (PEMs) worn by a person and fixed particle moni¬tors. These personal environmental exposure monitors (PEMs) will be used byEPA to sample workplace and home indoor environments and EPA needs to knowhow effective they are. While participating in this project, you will beexposed to cigarette smoke for a period of one to two weeks for six to eighthours per day. (The periods are for as long as one day.) The particle con¬centration in the chambers, due to cigarette smoke, plus road dust, will notexceed the EPA ambient air quality standard of 150 ug/m^ which is supposed tobe protective of human health.
The purpose of having you wear the samplers is to determine if air flowaround you results in any particle collection differences. We do have plansto use samplers fixed to stationery figures (dummies), but sampling with realpeople is essential for comparison information on the performance of thesebefore EPA goes into the field. Between six and nine of these exposures willbe undertaken, and a variety of particle sampling instruments will also be inthe chambers.
This project will be conducted in Chatham County, located at the UNC Am¬bient Air Research facility, three miles from the town of Pittsboro.
1. I agree to spend four to six hours in a ISOm^ Teflon outdoor chamberwhich contains clean rural air.
2. I understand that I will wear a respirator.3. I understand that six to nine exposures will be undertaken and that
a variety of particle sampling instruments will be in the chambers.4. I realize I will wear small round particle samplers which are about
one inch thick and the size of a silver dollar. I will also wearsmall sampling pumps which will draw air through collection filtersin the particle samplers.
5. I know cigarette smoke will be dispersed into the chambers and usedto characterize the sampling efficiency of small particles and thatthe concentration of this smoke will not exceed that which is norm¬ally expected by having a moderate smoker (one pack/day) in a typicalhousehold.
6. I am aware that larger particles will be dispersed into the chamber inthe form of fine road dust, the concentration not to exceed that norm¬ally found 200 feet from the dirt roadsides in North Carolina (<50 ug/m^).

D-2
7. I understand that I am obligated, as a participant, to discuss myprocedures of this project with the Principal Investigator and/orother involved interviewers.
8. I am free to withdraw consent and to discontinue participation inthis project or activity at any time, without prejudice to thesubject.
9. I have read all of the above statements and agree to participatein the above described chamber experiments.
PARTICIPANT ______________________________________________________PRINCIPAL INVESTIGATOR___________________________________________DATE