robert j. marzano jennifer s. norford mike ruyle
TRANSCRIPT

ROBERT J. MARZANO JENNIFER S. NORFORD MIKE RUYLE
SAMPLE CONTENT - NOT FOR DISTRIBUTION
A joint publication
SAMPLE CONTENT - NOT FOR DISTRIBUTION
Copyright © 2019 by Solution Tree Press
All rights reserved, including the right of reproduction of this book in whole or in part in any form.
555 North Morton Street Bloomington, IN 47404 800.733.6786 (toll free) / 812.336.7700 FAX: 812.336.7790
email: [email protected] SolutionTree.com
Printed in the United States of America
Library of Congress Cataloging-in-Publication Data
Names: Marzano, Robert J., author. | Norford, Jennifer S., author. | Ruyle, Mike, author.Title: The new art and science of classroom assessment / Robert J. Marzano, Jennifer S. Norford, Mike Ruyle.Description: Bloomington, IN : Solution Tree Press, [2018] | Includes bibliographical references and index.Identifiers: LCCN 2018009980 | ISBN 9781945349157 (perfect bound)Subjects: LCSH: Educational tests and measurements. | Students--Rating of. | Classroom management. | Educational change.Classification: LCC LB3051 .M37 2018 | DDC 371.26--dc23 LC record available at https://lccn.loc.gov/2018009980
Solution Tree Jeffrey C. Jones, CEO Edmund M. Ackerman, President
Solution Tree Press President and Publisher: Douglas M. Rife Editorial Director: Sarah Payne-Mills Art Director: Rian Anderson Managing Production Editor: Kendra Slayton Senior Production Editor: Christine Hood Senior Editor: Amy Rubenstein Copy Editor: Miranda Addonizio Proofreader: Elisabeth Abrams Text and Cover Designer: Laura Cox Editorial Assistant: Sarah Ludwig
SAMPLE CONTENT - NOT FOR DISTRIBUTION

iii
Table of Contents
About the Authors v
Preface vii
Introduction: The New Paradigm for Classroom Assessment 1
The Precision of Externally Designed Assessments 2Multiple Assessments 5The New View of Summative Scores 6The Need for Proficiency Scales 6This Book 8
1 The Assessment-Friendly Curriculum 11The Problem With Standards 11Standards as Inconsequential 17The Assessment Focus of Standards 19A Small List of Measurement Topics 22The New Art and Science of Classroom Assessment in Practice 23
2 Proficiency Scales 25Dysfunctional Variations of a Proficiency Scale 27Proficiency Scales for Declarative Knowledge 30Proficiency Scales for Mental Procedural Knowledge 36Proficiency Scales for Psychomotor Procedural Knowledge 39The New Art and Science of Classroom Assessment in Practice 41
3 Parallel Assessments 43A Brief History of Parallel Assessments 43Taxonomies 48Proficiency Scale Use for Scoring Traditional Tests 53Aberrant Patterns 56Proficiency Scale Use for Scoring Essays 57Proficiency Scale Use for Scoring Performance Assessments 58The Role of Collaborative Teams in Designing Parallel Assessments 59The New Art and Science of Classroom Assessment in Practice 60
4 The Measurement Process and Different Types of Assessments 61Assessment for Declarative and Procedural Knowledge 62Types of Classroom Assessments 67Student-Led Assessments 70Measurement With Only One Level of the Scale 72
SAMPLE CONTENT - NOT FOR DISTRIBUTION

THE NEW ART AND SCIENCE OF CLASSROOM ASSESSMENTiv
Proficiency Scales With Multiple Score 3 0 Elements 73Supplemental Topics 74Quarter-Point Intervals 75Instructional Feedback 76The New Art and Science of Classroom Assessment in Practice 76
5 Summative Scores 79A Brief History of Formative and Summative Assessments 79The Method of Mounting Evidence 80The Method of Mathematical Models 83The Best-Fit Model 85The Decaying Average and Other Mathematical Models 86The New Art and Science of Classroom Assessment in Practice 89
6 Non-Subject-Specific Skills 91Cognitive Analysis Skills 91Knowledge-Application Skills 93Metacognitive Skills 94General Behavior Skills 97The New Art and Science of Classroom Assessment in Practice 98
7 Record Keeping and Reporting 101Keeping a Record 101Keeping a Record Using Technology 102Reporting the Overall Grade 103Revisiting the System of Assessments 105The New Art and Science of Classroom Assessment in Practice 106
Epilogue: School Change and Classroom Change 107
Appendix A: Types of Declarative Content 109
Specific People or Types of People 109Specific Organizations and Groups or Types of Organizations and Groups 110Specific Intellectual or Artistic Products or Types of Intellectual or Artistic Products 112Naturally Occurring Objects 113Naturally Occurring Places 114Specific Animals or Types of Animals 115Manmade Objects 116Manmade Places 117Naturally Occurring Phenomena or Events 118Manmade Phenomena or Events 119
Appendix B: Types of Test-Response Items 121
Selected-Response Items 121Constructed-Response Items 127
References and Resources 129
Index 133
SAMPLE CONTENT - NOT FOR DISTRIBUTION

v
About the Authors
Robert J. Marzano, PhD, is the cofounder and chief academic officer of Marzano Research in Denver, Colorado. During his fifty years in the field of education, he has worked with educa tors as a speaker and trainer and has authored more than forty books and two hundred articles on topics such as instruction, assessment, writing and implementing standards, cognition, effective leadership, and school interven-tion. His books include The New Art and Science of Teaching, Leaders of Learning, Making Classroom Assessments Reliable and Valid, A Handbook for Personalized Competency-Based Education, and Leading a High Reliability School. His practical translations of the most current research and theory into classroom strategies are known internationally and are widely practiced by both teachers and administrators.
Dr. Marzano received a bachelor’s degree from Iona College in New York, a mas-ter’s degree from Seattle University, and a doctorate from the University of Washington.
To learn more about Robert J. Marzano’s work, visit marzanoresearch.com.
Jennifer S. Norford, MA, is the chief program officer at Marzano Research in Denver, Colorado. She has more than twenty years of experience as a teacher, instructional materials developer, technical assistance provider, research and devel-opment specialist, and development director in preK–12 and postsecondary set-tings. She has coauthored books and journal articles, contributed to numerous product development and research projects, and developed online courses. She has extensive experience developing new lines of sponsored program work, cultivating and maintaining productive partnerships, and managing large-scale projects. At Marzano Research, she provides leadership for the research division, setting pro-grammatic vision and strategic direction, developing new lines of program work, and building new partnerships. She also oversees the Reinventing Schools Division
and the development and delivery of services related to personalized, competency-based teaching and learn-ing. She earned three degrees from Virginia Tech: a master of arts in English, a bachelor of arts in English, and a bachelor of science in civil engineering.
To learn more about Jennifer S. Norford’s work, follow @JenniferNorford on Twitter.
SAMPLE CONTENT - NOT FOR DISTRIBUTION
THE NEW ART AND SCIENCE OF CLASSROOM ASSESSMENTvi
Mike Ruyle, EdD, served as a teacher, athletic coach, adjunct professor, and school leader in the San Francisco Bay Area and Bozeman, Montana, for twenty-eight years. He is a professional development associate with Marzano Research and the author of Leading the Evolution: How to Make Personalized Competency-Based Education a Reality. He led the creation and implementation of the first fully functional, performance-based school in Montana and is a recognized authority in the areas of social justice, educational equity, mindfulness, and trauma-informed care in schools. His leadership experience in personalized, competency-based education has made him a sought-after national and international presenter for numerous schools, dis-tricts, state agencies, and conferences.
Dr. Ruyle earned bachelor of arts degrees in history and English from the University of San Francisco, as well as master’s and doctoral degrees in educational leadership from Montana State University.
To learn more about Mike Ruyle’s work, visit www.linkedin.com/in/mike-ruyle-070118119 or follow @MikeRuyle on Twitter.
To book Robert J. Marzano, Jennifer S. Norford, or Mike Ruyle for professional development, contact [email protected].
SAMPLE CONTENT - NOT FOR DISTRIBUTION

vii
Preface
This book is part of a series of books that focus on the The New Art and Science of Teaching framework (Marzano, 2017). That framework presents current research, theory, and practice regarding classroom ped-agogy across various subject areas such as writing, reading, mathematics, and science within three general categories: content, context, and feedback.
A major aspect of effective classroom pedagogy is assessment. More specifically, within The New Art and Science of Teaching framework, classroom assessment falls within the general category of feedback. By its very nature, assessment is a form of feedback to students, teachers, and parents. As such, effective classroom assessment must go well beyond traditional uses which simply assign scores to students on specific tests and then average all those scores to compute a grade for an individual student. Rather, classroom assessment must be viewed from a new paradigm that allows it to be used to its full potential as a tool for feedback. That is precisely what this book, The New Art and Science of Classroom Assessment, is designed to do.
Starting in the first chapter, the book challenges many assumptions on which traditional classroom assess-ment practices are based. These challenges are designed to expose the sometimes illogical assumptions and lack of utility of many current assessment practices based on the traditional paradigm of assessment, such as averaging scores from all assessments to come up with an overall grade. However, the central purpose of the book is not to cause havoc with current classroom assessment practices, but rather to improve and augment those practices with techniques that result in more precise information about students’ status and growth on specific topics.
One major theme in the book is that effective assessment begins with clarity regarding the content that will be the focus of instruction and assessment. To this end, we strongly recommend the use of proficiency scales to define specific learning goals (also known as learning targets) and various levels of proficiency relative to those goals. Another theme in the book is that classroom teachers should never rely on a single assessment to determine a student’s status at any point in time. Rather, teachers should consider the pattern of scores on specific topics for individual students across multiple assessments. A third theme is that teachers should expand what they consider to be viable forms of assessments. Indeed, we make the case that anything a teacher does that provides information about a particular student’s status relative to a particular topic should be considered an assessment. The traditional test, then, is one form of assessment among many other forms including observations, conversations with students, short written responses, and student-generated assess-ments. In effect, teachers should test less (use pencil-and-paper tests less) but assess more (use a variety of
SAMPLE CONTENT - NOT FOR DISTRIBUTION

THE NEW ART AND SCIENCE OF CLASSROOM ASSESSMENTviii
ways to collect assessment information). Still another theme is that the process of assessment should be intimately tied to the process of instruction. Finally, assessment should be experienced by students as one of the most useful tools they have to increase their learning.
This book is not your ordinary classroom assessment textbook. We recommend that teams of teachers use it to systematically examine and change their assessment practices. We firmly believe that adherence to the suggestions and principles articulated in this book will create a paradigm shift in classroom assessment whose time has definitely come.
SAMPLE CONTENT - NOT FOR DISTRIBUTION

1
I N T R O D U C T I O N
The New Paradigm for Classroom Assessment
This book is about a paradigm shift in the way teachers use and interpret assessments in the classroom. It is also about increasing the rigor and utility of classroom assessments to a point where educators view them as a vital part of a system of assessments that they can use to judge the status and growth of individual students. This is a critical point. If we are to assess students in the most accurate and useful ways, then we must think in terms of merging the information from classroom assessments with other types of assessments. Figure I.1 shows the complete system of assessments a school should use.
Classroom Assessments Standards
Interim Assessments
Year-End Assessments
Source: Marzano, 2018, p. 6.
Figure I.1: The three systems of assessment.
Perhaps the most visible of the three types of assessments in figure I.1 is year-end assessments. M. Christine Schneider, Karla L. Egan, and Marc W. Julian (2013) describe year-end assessments as follows:
States administer year-end assessments to gauge how well schools and districts are per-forming with respect to the state standards. These tests are broad in scope because test content is cumulative and sampled across the state-level content standards to support inferences regarding how much a student can do in relation to all of the state standards. Simply stated, these are summative tests. The term year-end assessment can be a misno-mer because these assessments are sometimes administered toward the end of the year, usually March or April and sometimes during the first semester of the school year. (p. 59)
SAMPLE CONTENT - NOT FOR DISTRIBUTION

THE NEW ART AND SCIENCE OF CLASSROOM ASSESSMENT2
The next level of assessment in the model in figure I.1 is interim assessments. Schneider and colleagues (2013) describe them as follows: “Interim assessments (sometimes referred to as benchmark assessments) are standardized, periodic assessments of students throughout a school year or subject course” (p. 58).
Professional test makers typically design both types of assessments, and they include the psychometric properties educators associate with high reliability and validity, as defined in large-scale assessment theory. As its name indicates, large-scale assessment theory focuses on tests that are administered to large groups of students like year-end state tests. As we indicate in figure I.1, the most frequent type of assessment is classroom assessment. Unfortunately, some educators assume they can’t use classroom assessments to make decisions about individual students because the assessments do not exhibit the same psychometric properties as the externally designed assessments. While this observation has intuitive appeal, it is actually misleading; in this book we assert that classroom assessments can actually be more precise than external assessments when it comes to examining the performance of individual students.
This chapter outlines the facts supporting our position. In the remaining chapters, we fill in the details about how educators can design and use classroom assessments to fulfill their considerable promise.
It is important to remember that all three types of assessment we depict in figure I.1 have important roles in the overall process of assessing students. To be clear, we are not arguing that educators should discontinue or discount year-end and interim assessments in lieu of classroom assessments. We are asserting that of the three types of assessment, classroom assessments should be the most important source of information regarding the status and growth of individual students.
We begin by discussing the precision of externally designed assessments.
The Precision of Externally Designed AssessmentsExternally designed assessments, like year-end and interim assessments, typically follow the tenets of clas-
sical test theory (CTT), which dates back at least to the early 1900s (see Thorndike, 1904). At its core, CTT proposes that all assessments contain a certain degree of error, as the following equation shows.
Observed Score = True Score + Error Score
This equation indicates that the score a test taker receives (the observed score) on any type of assessment comprises two components—a true component and an error component. The true component (the true score) is what a test taker would receive under ideal conditions—the test is perfectly designed and the situ-ation in which students take the test is optimal. The error component (the error score) is also a part of the observed score. This component represents factors that can artificially inflate or deflate the observed score. For example, the test taker might guess correctly on a number of items that would artificially inflate the observed score, or the test taker might misinterpret a few items for which he or she actually knows the correct answers, which would artificially deflate the observed score.
Probably the most important aspect of error is that it makes observed scores imprecise to at least some degree. Stated differently, the scores that any assessment generates will always contain some amount of error. Test makers report the amount of error one can expect in the scores on a specific test as a reliability coefficient. Such coefficients range from a low of 0.00 to a high of 1.00. A reliability of 0.00 indicates that the scores that a specific assessment produces are nothing but error. If students took the same test again sometime after they had completed it the first time, they would receive completely different scores. A reliability of 1.00 indicates that scores on the test are perfectly accurate for each student. This means that the scores contain no errors. If students took the same test right after they had completed it the first time, they would receive precisely
SAMPLE CONTENT - NOT FOR DISTRIBUTION
3Introduction
the same scores. Fortunately, no externally designed assessments have a reliability of 0.00. Unfortunately, no externally designed assessments have a reliability of 1.00—simply because it is impossible to construct such a test.
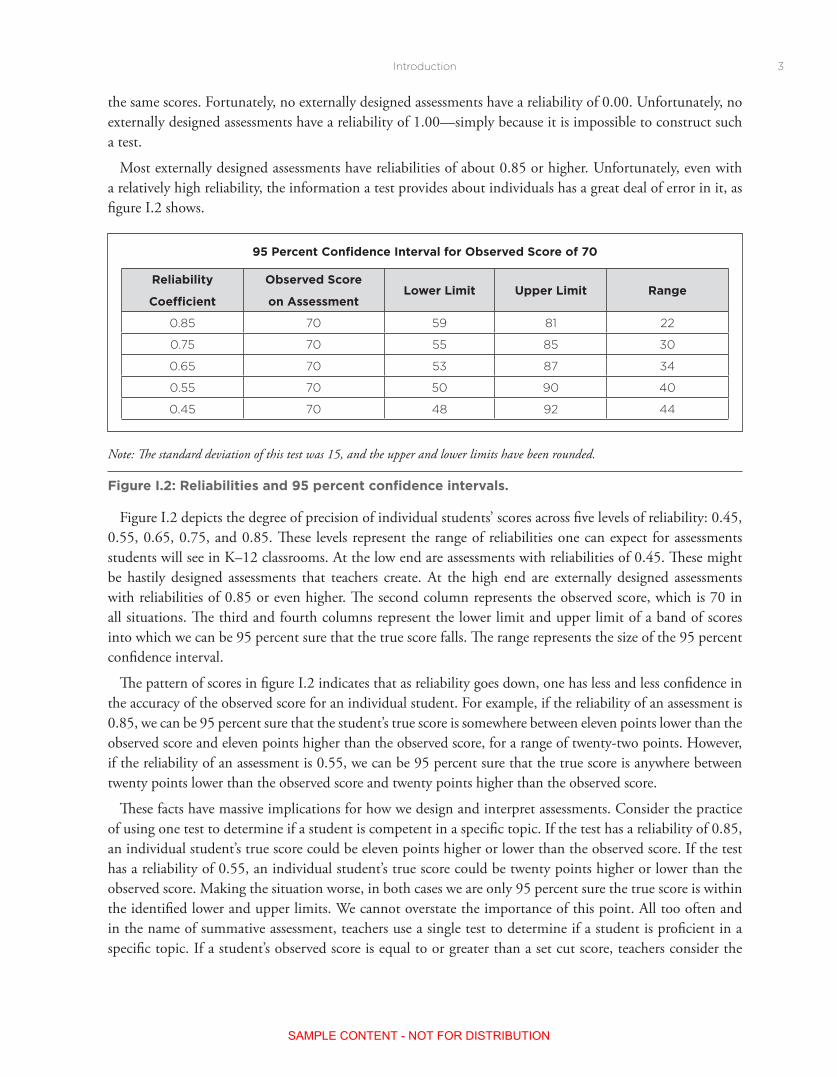
Most externally designed assessments have reliabilities of about 0.85 or higher. Unfortunately, even with a relatively high reliability, the information a test provides about individuals has a great deal of error in it, as figure I.2 shows.
95 Percent Confidence Interval for Observed Score of 70
Reliability
Coefficient
Observed Score
on AssessmentLower Limit Upper Limit Range
0 85 70 59 81 22
0 75 70 55 85 30
0 65 70 53 87 34
0 55 70 50 90 40
0 45 70 48 92 44
Note: The standard deviation of this test was 15, and the upper and lower limits have been rounded.
Figure I.2: Reliabilities and 95 percent confidence intervals.
Figure I.2 depicts the degree of precision of individual students’ scores across five levels of reliability: 0.45, 0.55, 0.65, 0.75, and 0.85. These levels represent the range of reliabilities one can expect for assessments students will see in K–12 classrooms. At the low end are assessments with reliabilities of 0.45. These might be hastily designed assessments that teachers create. At the high end are externally designed assessments with reliabilities of 0.85 or even higher. The second column represents the observed score, which is 70 in all situations. The third and fourth columns represent the lower limit and upper limit of a band of scores into which we can be 95 percent sure that the true score falls. The range represents the size of the 95 percent confidence interval.
The pattern of scores in figure I.2 indicates that as reliability goes down, one has less and less confidence in the accuracy of the observed score for an individual student. For example, if the reliability of an assessment is 0.85, we can be 95 percent sure that the student’s true score is somewhere between eleven points lower than the observed score and eleven points higher than the observed score, for a range of twenty-two points. However, if the reliability of an assessment is 0.55, we can be 95 percent sure that the true score is anywhere between twenty points lower than the observed score and twenty points higher than the observed score.
These facts have massive implications for how we design and interpret assessments. Consider the practice of using one test to determine if a student is competent in a specific topic. If the test has a reliability of 0.85, an individual student’s true score could be eleven points higher or lower than the observed score. If the test has a reliability of 0.55, an individual student’s true score could be twenty points higher or lower than the observed score. Making the situation worse, in both cases we are only 95 percent sure the true score is within the identified lower and upper limits. We cannot overstate the importance of this point. All too often and in the name of summative assessment, teachers use a single test to determine if a student is proficient in a specific topic. If a student’s observed score is equal to or greater than a set cut score, teachers consider the
SAMPLE CONTENT - NOT FOR DISTRIBUTION
THE NEW ART AND SCIENCE OF CLASSROOM ASSESSMENT4
student to be proficient. If a student’s score is below the set cut score, even by a single point, teachers consider the student not to be proficient.
Examining figure I.2 commonly prompts the question, Why are assessments so imprecise regarding the scores for individual students even if they have relatively high reliabilities? The answer to this question is simple. Test makers designed and developed CTT with the purpose of scoring groups of students as opposed to scoring individual students. Reliability coefficients, then, tell us how similar or different groups of scores would be if students retook a test. They cannot tell us about the variation in scores for individuals. Lee J. Cronbach (the creator of coefficient alpha, one of the most popular reliability indices) and his colleague Richard J. Shavelson (2004) strongly emphasize this point when they refer to reliability coefficients as “crude devices” (p. 394) that really don’t tell us much about individual test takers.
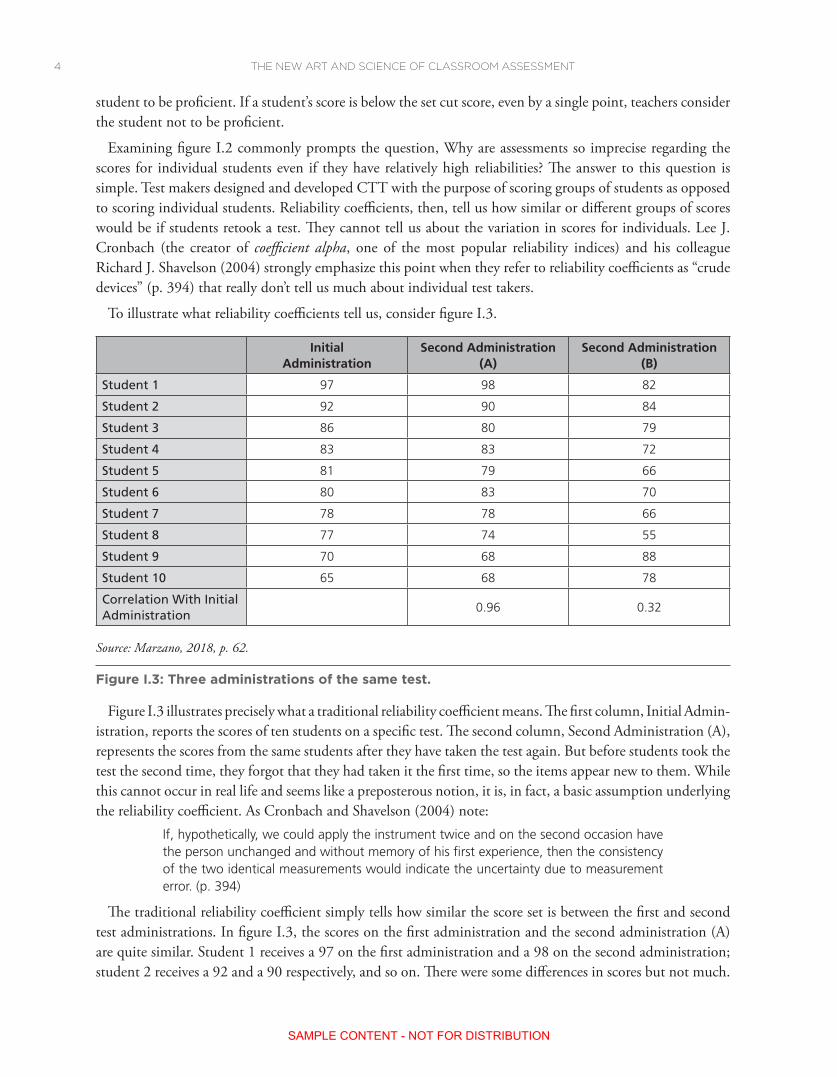
To illustrate what reliability coefficients tell us, consider figure I.3.
Initial Administration
Second Administration (A)
Second Administration (B)
Student 1 97 98 82
Student 2 92 90 84
Student 3 86 80 79
Student 4 83 83 72
Student 5 81 79 66
Student 6 80 83 70
Student 7 78 78 66
Student 8 77 74 55
Student 9 70 68 88
Student 10 65 68 78
Correlation With Initial Administration
0.96 0.32
Source: Marzano, 2018, p. 62.
Figure I.3: Three administrations of the same test.
Figure I.3 illustrates precisely what a traditional reliability coefficient means. The first column, Initial Admin-istration, reports the scores of ten students on a specific test. The second column, Second Administration (A), represents the scores from the same students after they have taken the test again. But before students took the test the second time, they forgot that they had taken it the first time, so the items appear new to them. While this cannot occur in real life and seems like a preposterous notion, it is, in fact, a basic assumption underlying the reliability coefficient. As Cronbach and Shavelson (2004) note:
If, hypothetically, we could apply the instrument twice and on the second occasion have the person unchanged and without memory of his first experience, then the consistency of the two identical measurements would indicate the uncertainty due to measurement error. (p. 394)
The traditional reliability coefficient simply tells how similar the score set is between the first and second test administrations. In figure I.3, the scores on the first administration and the second administration (A) are quite similar. Student 1 receives a 97 on the first administration and a 98 on the second administration; student 2 receives a 92 and a 90 respectively, and so on. There were some differences in scores but not much.
SAMPLE CONTENT - NOT FOR DISTRIBUTION
5Introduction
The last row of the table shows the correlation between the initial administration and the second administra-tion. That correlation (0.96) is, in fact, the reliability coefficient, and it is quite high.
But let’s now consider another scenario, as we depict in the last column of figure I.3, Second Administration (B). In this scenario, students receive very different scores on the second administration. Student 1 receives a score of 97 on the first administration and a score of 82 on the second; student 2 receives a 92 and 84 respectively. If the second administration of the test produces a vastly different pattern of scores, we would expect the correlation between the two administrations (or the reliability coefficient) to be quite low, which it is. The last row of the table indicates that the reliability coefficient is 0.32.
So how can educators obtain precise scores for individual students using classroom assessments? The answer to this question is that they can design multiple assessments and administer them over time.
Multiple AssessmentsThe preceding discussion indicates that as long as we think of tests as independent events, the scores from
which educators must interpret in isolation, there is little hope for precision at the individual student level. However, if one changes the perspective from a single assessment to multiple assessments administered and interpreted over time, then it becomes not only possible but relatively straightforward to generate a relatively precise summary score for individuals. Multiple assessments are designed in specific ways and referred to as parallel assessments, which we discuss in chapter 2 (page 25).
To illustrate, consider the following five scores for an individual student on a specific topic gathered over the course of a grading period.
70, 72, 75, 77, 81
We have already discussed that any one of these scores in isolation probably does not provide a great deal of accuracy. Recall from figure I.2 (page 3) that even if all test reliabilities were 0.85, we would have to add and subtract about eleven points to compute an interval score into which we are 95 percent sure the true score actually falls. But if we consider the pattern of these scores, we can have a relatively high degree of confidence in the scores, particularly as more time passes and we collect more scores.
This pattern is clear that over time, the student’s scores have been gradually increasing. This makes intuitive sense. If the student is learning and the assessments are accurate, we would expect to see the scores continu-ally go up. The more scores that precede any given score, the more one can judge the accuracy of that score. In the previous series, the first score is 70. In judging its accuracy, we would have to treat it like an individual assessment—we wouldn’t have much confidence in its accuracy. But with the second score of 72, we now have two data points. Since we can reasonably assume that the student is learning, it makes sense that his or her score would increase. We now have more confidence in the score of 72 than we did with the single score of 70. By the time we have the fifth score of 81, we have amassed a good deal of antecedent information with which to judge its accuracy. Although we can’t say that 81 is precisely accurate, we can say the student’s true score is probably close to it. In subsequent chapters, we present techniques for specifying the accuracy of this final score of 81.
It’s important to note that some data patterns would indicate a lack of accuracy in the test scores. To illus-trate, consider the following pattern of scores.
70, 76, 65, 82, 71
Assuming that the student who exhibited these scores is learning over time, the pattern doesn’t make much sense. The student began and ended the grading period with about the same score. In between, the
SAMPLE CONTENT - NOT FOR DISTRIBUTION

THE NEW ART AND SCIENCE OF CLASSROOM ASSESSMENT6
student exhibited some scores that were significantly higher and some scores that were significantly lower. This pattern implies that there was probably a great deal of error in the assessments. (Again, we discuss how to interpret such aberrant patterns in subsequent chapters.) This scenario illustrates the need for a new view of summative scores.
The New View of Summative ScoresThe practice of examining the mounting evidence that multiple assessments provide is a veritable sea
change in the way we think of summative assessments for individual students. More specifically, we have seen school leaders initiate policies in which they make a sharp distinction between formative assessments and summative assessments. Within these policies, educators consider formative assessments as practice only, and they do not record scores from these assessments. They consider summative tests as the “real” assessments, and the scores from them play a substantive role in a student’s final grade.
As the previous discussion illustrates, this makes little sense for at least two reasons. First, the single score educators derive from the summative assessment is not precise enough to support absolute decisions about individual students. Second, not recording formative scores is tantamount to ignoring all the historical assess-ment information that teachers can use to estimate a student’s current status. We take the position that edu-cators should use the terms formative and summative scores, as opposed to formative and summative assessments, to meld the two types of assessments into a unified continuum.
Also, teachers should periodically estimate students’ current summative scores by examining the pattern of the antecedent scores. We describe this process in depth in chapter 5 (page 80). Briefly, though, consider the pattern of five scores we described previously: 70, 72, 75, 77, 81. A teacher could use this pattern to assign a current summative score without administering another assessment. The pattern clearly indicates steady growth for the student and makes the last score of 81 appear quite reasonable.
The process of estimating a summative score as opposed to relying only on the score from a single summa-tive test works best if the teacher uses a scale that automatically communicates what students already know and what they still have to learn. A single score of 81 (or 77 or pretty much any score on a one hundred–point scale) doesn’t communicate much about a student’s knowledge of specific content. However, a score on a proficiency scale does and greatly increases the precision with which a teacher can estimate an individual student’s summative score.
The Need for Proficiency ScalesWe discuss the nature and function of proficiency scales in depth in chapter 3. For now, figure I.4 provides
an example of a proficiency scale.
4.0 In addition to score 3 0 performance, the student will demonstrate in-depth inferences and applica-tions that go beyond what was taught For example, the student will:
• Explain how distorted light impacts vision (for example, explain why a fish in clear water appearsdistorted due to light refraction)
3.5 In addition to score 3 0 performance, partial success at score 4 0 content
3.0 The student will:
• Explain how vision (sight) is a product of light reflecting off objects and entering the eye (forexample, the student can describe how light reflects off an object, then travels through the eyeto the retina, then how the information is processed by the brain to create an image)
SAMPLE CONTENT - NOT FOR DISTRIBUTION

7Introduction
2.5 No major errors or omissions regarding score 2 0 content and partial success at score 3 0 content
2.0 The student will recognize or recall specific vocabulary (for example, brain, cone, cornea, image, iris, lens, light, optic nerve, perpendicular angle, pupil, reflection, retina, rod, sight, dilate) and perform basic processes, such as:
• Describe physical changes that happen in the eye as a reaction to light (for example, the pupildilates and contracts)
• Trace the movement of light as it moves from a source, reflects off an object, and enters the eye• Diagram the human eye and label its parts (cornea, iris, pupil, lens, retina, optic nerve)• Describe the function of rods and cones in the eye• Recognize that the optic nerve carries information from both eyes to the brain, which processes
the information to create an image
1.5 Partial success at score 2 0 content and major errors or omissions regarding score 3 0 content
1.0 With help, partial success at score 2 0 content and score 3 0 content
0.5 With help, partial success at score 2 0 content but not at score 3 0 content
0.0 Even with help, no success
Figure I.4: Sample proficiency scale for fourth-grade science.
Notice that the proficiency scale in figure I.4 has three levels of explicit content. It is easiest to understand the nature of a proficiency scale if we start with the content at the score 3.0 level. It reads, The student will explain how vision (sight) is a product of light reflecting off objects and entering the eye. This is the desired level of expertise for students. When students can demonstrate this level of competence, teachers consider them to be proficient.
Understanding the score 2.0 content is necessary to demonstrate competency on the score 3.0 content, which teachers will directly teach to students. In the proficiency scale, score 2.0 content reads, The student will recognize or recall specific vocabulary (for example, brain, cone, cornea, image, iris, lens, light, optic nerve, perpendicular angle, pupil, reflection, retina, rod, sight, dilate) and perform basic processes, such as:
• Describe physical changes that happen in the eye as a reaction to light (for example, the pupil dilatesand contracts)
• Trace the movement of light as it moves from a source, reflects off an object, and enters the eye• Diagram the human eye and label its parts (cornea, iris, pupil, lens, retina, optic nerve)• Describe the function of rods and cones in the eye• Recognize that the optic nerve carries information from both eyes to the brain, which processes the
information to create an image
The score 4.0 content requires students to make inferences and applications that go above and beyond the score 3.0 content. In the proficiency scale, it reads, In addition to score 3.0 performance, the student will demonstrate in-depth inferences and applications that go beyond what was taught. For example, the student will explain how distorted light impacts vision (for example, explain why a fish in clear water appears distorted due to light refraction). The example provides one way in which the student might demonstrate score 4.0 performance.
The other scores in the scale do not contain new content but do represent different levels of understanding relative to the content. For example, score 1.0 means that with help, the student has partial understanding of some of the simpler details and processes and some of the more complex ideas and processes. And score 0.0 means that even with help, the student demonstrates no understanding or skill. The scale also contains
SAMPLE CONTENT - NOT FOR DISTRIBUTION

THE NEW ART AND SCIENCE OF CLASSROOM ASSESSMENT8
half-point scores, which signify achievement between two whole-point scores. Again, we address proficiency scales in depth in chapter 2 (page 25).
With a series of scores on a proficiency scale as opposed to a one hundred–point scale, a teacher can more accurately estimate a summative score using antecedent formative scores. This is because we can reference a score on a proficiency scale to a continuum of knowledge, regardless of the test format. A score of 3.0 on a test means that the student has demonstrated competence regardless of the type of test. This is not the case with the one hundred–point scale. For example, a teacher can only interpret a score of 85 in terms of levels of knowledge if he or she examines the items on the test. This characteristic of proficiency scales suits them well for examining trends in learning. To illustrate, consider the following pattern of proficiency scale scores for a student on a specific topic.
1.0, 2.0, 2.0, 3.0, 2.5
The first score of 1.0 indicates that in the beginning of the grading period, the student demonstrates little knowledge of the topic on his or her own but with help, should have some understanding of the score 2.0 and 3.0 content. By the time the next assessment occurs, the student seems to have a solid knowledge of the score 2.0 content, which carries on into the third assessment. Such content involves basic information the teacher directly teaches. The fourth assessment sees a big jump in understanding, indicating that the student knows the score 2.0 and 3.0 content. However, on the final assessment, the student score of 2.5 indicates a solid understanding of the score 2.0 content but only partial understanding of the score 3.0 content. Even though this student’s pattern does not show growth across every assessment, it still provides enough evidence for the teacher to assign a summative score of at least 2.5. Proficiency scales make the new paradigm for classroom assessments concrete and viable.
This BookChapter 1, “The Assessment-Friendly Curriculum,” provides evidence for the claim that virtually every
state’s standards simply contain too much content to effectively assess, let alone teach. Consequently, class-room educators must identify the critical content within the standards to explicitly teach and measure in order to determine students’ current status as well as their growth. Chapter 2, “Proficiency Scales,” points out that it’s not enough to identify specific learning targets for students relative to each topic. To measure student growth, teachers must develop well-defined continua of knowledge for each topic. These continua form the basis for designing scales teachers can use to develop assessments and plan instruction. Chapter 3, “Parallel Assessments,” not only describes the defining characteristics of parallel assessments in detail but also provides specific guidelines about how to create such assessments. In addition, it describes how to score parallel assess-ments. Chapter 4, “The Measurement Process and Different Types of Assessments,” presents a way of viewing classroom assessment and scoring as a seamless and united endeavor that represents the new paradigm of classroom assessment. Chapter 5, “Summative Scores,” describes techniques that allow teachers to determine the level of precision they can assign to scores for individual students. Some of these techniques require the aid of technology, and some do not. Chapter 6, “Non-Subject-Specific Skills,” addresses subject areas such as cognitive skills and metacognitive skills. These skills are commonly mentioned in standards documents but do not fit into any one subject area. Chapter 7, “Record Keeping and Reporting,” addresses not only how teachers can efficiently keep records of scores from classroom assessments but also how to transform those scores into report cards that demonstrate each student’s status and growth.
SAMPLE CONTENT - NOT FOR DISTRIBUTION

9Introduction
Finally, note that this book does not address the technical and psychometric issues that accompany the rec-ommendations that we make. For a thorough discussion of these matters, the reader should consult Making Classroom Assessments Reliable and Valid (Marzano, 2018).
If classroom assessments are to fulfill their bright promise, educators must recognize that large-scale assessment theory is not the appropriate tool for designing and administering teacher-designed assessments. Rather, educators must employ a new theory base specific to the classroom. This book presents that theory.
SAMPLE CONTENT - NOT FOR DISTRIBUTION

SAMPLE CONTENT - NOT FOR DISTRIBUTION

11
C H A P T E R 1
The Assessment-Friendly Curriculum
The starting place for a new assessment paradigm is a curriculum that provides teachers with clear guidance in terms of what they should assess and how they should assess it. At first, this might sound like a very simple undertaking. After all, don’t schools and districts already have standards that teachers are supposed to follow when designing assessments? While the answer to this question is yes, the standards themselves do not provide much assessment guidance. That is one of the primary messages of this chapter. In fact, national, provincial, state, and local standards as currently written actually muddy the waters in terms of classroom assessments. More pointedly, we believe that the standards movement has unwittingly hurt classroom assessment practices as much as it has helped.
In this chapter, we discuss the problem with standards and practices that render them inconsequential. We describe the limited assessment focus of standards and the need to create supplemental measurement topics.
The Problem With StandardsThere are at least three reasons why standards do not provide classroom teachers with adequate guidance in
using classroom assessments: (1) too much content, (2) redundancy, and (3) equivocal descriptions of content.
Too Much Content
To illustrate the problem of too much content, consider the following mathematics standard: “Understands the properties of operations with rational numbers (for example, distributive property, commutative and associative properties of addition and multiplication, inverse properties, identity properties)” (standard 3, grades 6–8; Mid-continent Research for Education and Learning [McREL], 2014a).
If we unpack the content in this standard, it becomes clear that it contains at least five elements. The student:
1. Understands the distributive property with rational numbers2. Understands the commutative property of addition with rational numbers3. Understands the commutative property of multiplication with rational numbers4. Understands the inverse property of rational numbers5. Understands the identity properties of rational numbers
SAMPLE CONTENT - NOT FOR DISTRIBUTION

THE NEW ART AND SCIENCE OF CLASSROOM ASSESSMENT12
While this standard is for mathematics, the same problem holds true for other subject areas. This is the crux of the problem that standards documents have created for classroom teachers who wish to design highly focused classroom assessments. For example, consider the following middle school science standard.
MS-LS1–4. Use argument based on empirical evidence and scientific reasoning to support an explanation for how characteristic animal behaviors and specialized plant structures affect the probability of successful reproduction of animals and plants respectively. (NGSS Lead States, 2013)
This standard appears relatively straightforward and fairly focused until we consider the clarification state-ment that accompanies it:
Examples of behaviors that affect the probability of animal reproduction could include nest building to protect young from cold, herding of animals to protect young from predators, and vocalization of animals and colorful plumage to attract mates for breed-ing. Examples of animal behaviors that affect the probability of plant reproduction could include transferring pollen or seeds, and creating conditions for seed germination and growth. Examples of plant structures could include bright flowers attracting butterflies that transfer pollen, flower nectar and odors that attract insects that transfer pollen, and hard shells on nuts that squirrels bury. (NGSS Lead States, 2013)
If we unpack the content in this standard and its clarification statement, a number of topics rise to the surface. The student:
• Understands how to identify empirical evidence and how to use it in an argument• Understands scientific reasoning and how to use it in an argument• Understands examples of animal behaviors• Understands how specific animal behaviors affect successful reproduction• Uses empirical evidence and scientific reasoning to explain how and why specific animal
behaviors affect successful reproduction• Understands examples of plant behaviors• Understands how specific plant behaviors affect successful reproduction• Uses empirical evidence and scientific reasoning to explain how and why specific plant behaviors
affect successful reproduction
In effect, standards documents typically embed so much content in a single statement that it would be impossible to assess (or teach) all those topics in the amount of time available to teachers. To illustrate, Robert J. Marzano, David C. Yanoski, Jan K. Hoegh, and Julia A. Simms (2013) identify seventy-three standards statements (which they refer to as elements) for eighth-grade English language arts (ELA) within the Common Core State Standards (CCSS; NGA & CCSSO, n.d.a, n.d.b, 2010a, 2010b, 2010c). If we assume an average of five topics embedded in each element, which seems reasonable given the previous example, then we can conclude that eighth-grade ELA teachers must assess and teach 365 topics in a single school year.
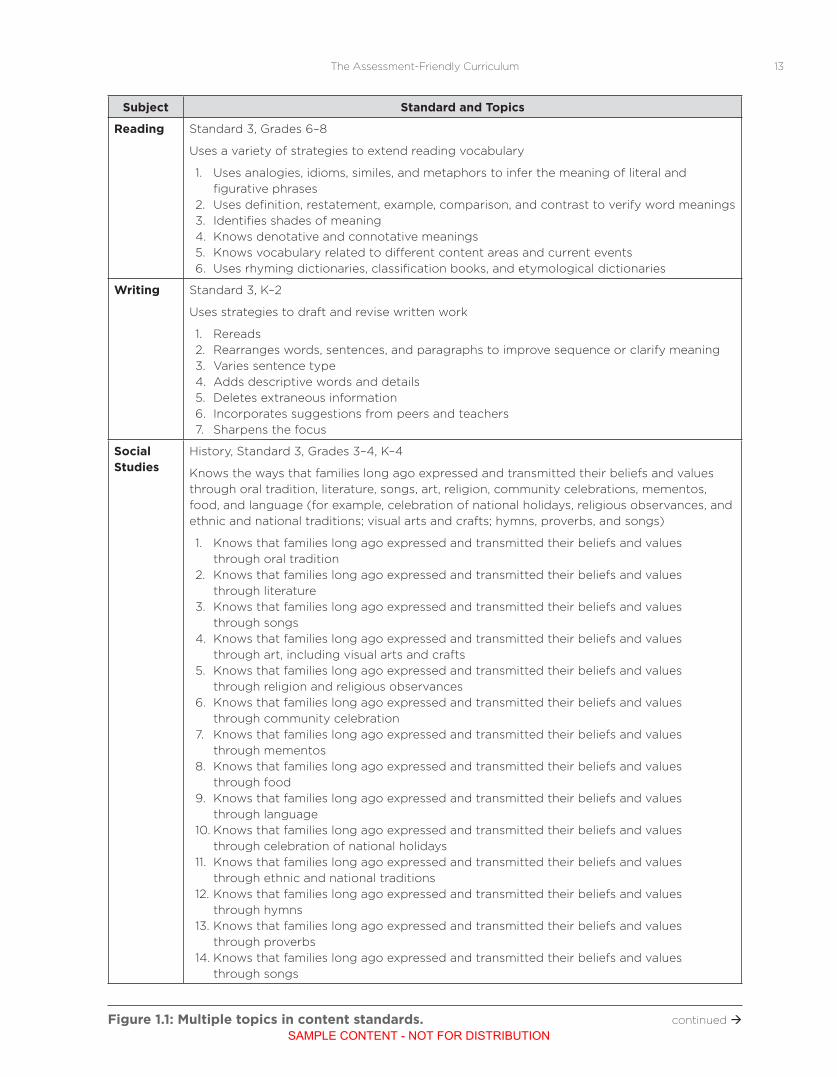
This problem is prevalent in every subject area. Figure 1.1 provides a few more examples of standards with embedded topics.
SAMPLE CONTENT - NOT FOR DISTRIBUTION
13The Assessment-Friendly Curriculum
Subject Standard and Topics
Reading Standard 3, Grades 6–8
Uses a variety of strategies to extend reading vocabulary
1 Uses analogies, idioms, similes, and metaphors to infer the meaning of literal and figurative phrases
2 Uses definition, restatement, example, comparison, and contrast to verify word meanings3 Identifies shades of meaning4 Knows denotative and connotative meanings5 Knows vocabulary related to different content areas and current events6 Uses rhyming dictionaries, classification books, and etymological dictionaries
Writing Standard 3, K–2
Uses strategies to draft and revise written work
1 Rereads2 Rearranges words, sentences, and paragraphs to improve sequence or clarify meaning3 Varies sentence type4 Adds descriptive words and details5 Deletes extraneous information6 Incorporates suggestions from peers and teachers7 Sharpens the focus
Social Studies
History, Standard 3, Grades 3–4, K–4
Knows the ways that families long ago expressed and transmitted their beliefs and values through oral tradition, literature, songs, art, religion, community celebrations, mementos, food, and language (for example, celebration of national holidays, religious observances, and ethnic and national traditions; visual arts and crafts; hymns, proverbs, and songs)
1 Knows that families long ago expressed and transmitted their beliefs and values through oral tradition
2 Knows that families long ago expressed and transmitted their beliefs and values through literature
3 Knows that families long ago expressed and transmitted their beliefs and values through songs
4 Knows that families long ago expressed and transmitted their beliefs and values through art, including visual arts and crafts
5 Knows that families long ago expressed and transmitted their beliefs and values through religion and religious observances
6 Knows that families long ago expressed and transmitted their beliefs and values through community celebration
7 Knows that families long ago expressed and transmitted their beliefs and values through mementos
8 Knows that families long ago expressed and transmitted their beliefs and values through food
9 Knows that families long ago expressed and transmitted their beliefs and values through language
10 Knows that families long ago expressed and transmitted their beliefs and values through celebration of national holidays
11 Knows that families long ago expressed and transmitted their beliefs and values through ethnic and national traditions
12 Knows that families long ago expressed and transmitted their beliefs and values through hymns
13 Knows that families long ago expressed and transmitted their beliefs and values through proverbs
14 Knows that families long ago expressed and transmitted their beliefs and values through songs
Figure 1.1: Multiple topics in content standards. continued SAMPLE CONTENT - NOT FOR DISTRIBUTION

THE NEW ART AND SCIENCE OF CLASSROOM ASSESSMENT14
Subject Standard and Topics
Physical Education
Standard 3, Grades 3–6
Understands detrimental effects of physical activity (for example, muscle soreness, overuse injuries, over-training, temporary tiredness, and discovering inability)
1 Understands that physical activity can have detrimental effects2 Understands that one detrimental effect of physical activity can be muscle soreness3 Understands that one detrimental effect of physical activity can be overuse injuries4 Understands that one detrimental effect of physical activity can be over-training5 Understands that one detrimental effect of physical activity can be temporary tiredness6 Understands that one detrimental effect of physical activity can be discovering inability
Arts Standard 3, Grades 5–8
Understands how lighting and costuming can contribute to the meaning of a dance
1 Understands how lighting can contribute to the meaning of a dance2 Understands how costuming can contribute to the meaning of a dance3 Understands the various ways dance can communicate meaning
Source for standards: McREL, 2014a.
Redundancy
The second problem with standards is that they include a great amount of redundant content. This was one of the findings of Julia A. Simms (2016) in her analysis of the CCSS. To illustrate, consider the topic of “examining claims and evidence.” When examining the eighth-grade CCSS for ELA standards and bench-marks, Simms (2016) finds overlapping aspects of this in six different standards or benchmark statements. See figure 1.2, which depicts six unpacked ELA standards at the eighth-grade level: RI.8.8, W.8.1b, W.8.1a, W.8.1, SL.8.3, and SL.8.1d.
Unpacked Component Part Standard
Assess whether the evidence is relevant in an argument RI 8 8
Assess whether the evidence is sufficient in an argument
Assess whether the evidence is relevant in a specific claim
Assess whether the evidence is sufficient in a specific claim
Recognize when irrelevant evidence is introduced
Support claims with logical reasoning W 8 1b
Support claims with relevant evidence
Acknowledge the claim from alternative claims W 8 1a
Acknowledge the claim from opposing claims
Distinguish the claim from alternate claims
Distinguish the claim from opposing claims
Write arguments to support claims with clear reasons W 8 1
Write arguments to support claims with relevant evidence
Evaluate the relevance of the evidence for a speaker’s arguments
SAMPLE CONTENT - NOT FOR DISTRIBUTION

15The Assessment-Friendly Curriculum
Unpacked Component Part Standard
Evaluate the sufficiency of the evidence for a speaker’s argument SL 8 3
Identify when relevant evidence is introduced in a speaker’s argument
Evaluate the relevance of the evidence in a speaker’s specific claims
Evaluate the sufficiency of the evidence for a speaker’s specific claims
Identify when irrelevant evidence is introduced in a speaker’s specific claims
Acknowledge new information expressed by others SL 8 1d
When warranted, justify their own views in light of the evidence
When warranted, qualify their own views in light of the evidence presented by others
Source for standards: NGA & CCSSO, 2010a.
Figure 1.2: Overlapping components in ELA standards at the eighth-grade level.
When unpacked, the Common Core standard RI.8.8 has five statements, standard W.8.1b has two state-ments, and so on. In all, there are twenty-two statements embedded in six standards. Even though these state-ments employ different phrasing, they pretty much all deal with claims, evidence, and reasoning. While the problem of redundancy might seem to mitigate the problem of too much content, it still adds to the teacher’s workload by requiring him or her to analyze standards in the manner that Simms (2016) exemplifies.
Equivocal Descriptions of Content
The final problem with current standards statements is that many of them are highly equivocal—they are open to a number of possible interpretations. To illustrate, consider the following standard from grade 4 mathematics:
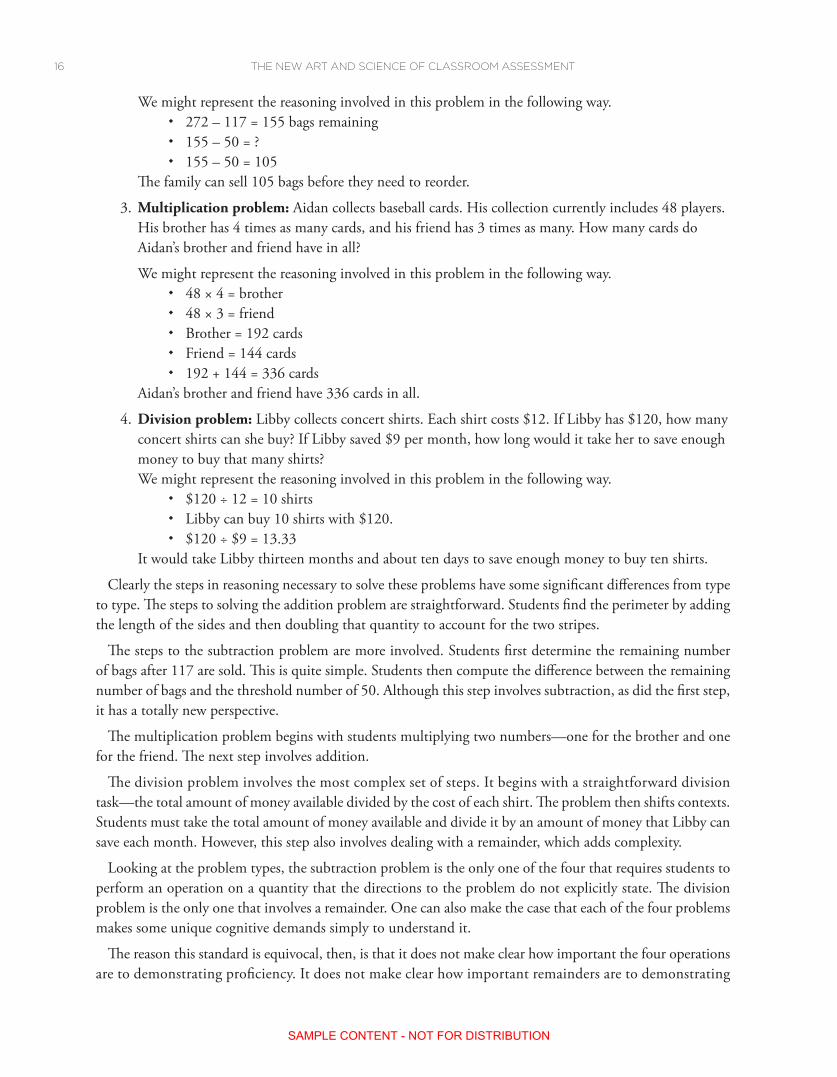
Solve multistep word problems with whole numbers and have whole number answers using the four operations (addition, subtraction, multiplication and division) including division word problems in which remainders must be interpreted. (4.0A.A.3, NGA & CCSSO, 2010b)
While it is clear that the standard’s overall focus is multistep problems with whole numbers and whole- number answers, such problems are very different across the operations for addition, subtraction, multiplica-tion, and division. Consider the following four problems that would appear to fulfill this standard.
1. Addition problem: James wants to paint racing stripes around his room. His room is 11 feet longand 10 feet wide. If James paints a stripe to go around the top and bottom of his room, how manylinear feet of racing stripes will he need?
We might represent the reasoning involved in this problem in the following way. � 10 + 10 + 11 + 11 = 42 feet � Top of room = 42 feet � Bottom of room = 42 feet � 42 + 42 = 84 feet
James will need to paint 84 feet of racing stripes.
2. Subtraction problem: Kelly works at her family’s pet store. She put 272 bags of dog food on theshelf. Last week, customers bought 117 bags. How many bags were left? Her parents also need toplace an order to buy more dog food when they reach 50 bags. How many more bags can they sellbefore they need to place a new order?
SAMPLE CONTENT - NOT FOR DISTRIBUTION
THE NEW ART AND SCIENCE OF CLASSROOM ASSESSMENT16
We might represent the reasoning involved in this problem in the following way. � 272 – 117 = 155 bags remaining � 155 – 50 = ? � 155 – 50 = 105
The family can sell 105 bags before they need to reorder.
3. Multiplication problem: Aidan collects baseball cards. His collection currently includes 48 players.His brother has 4 times as many cards, and his friend has 3 times as many. How many cards doAidan’s brother and friend have in all?
We might represent the reasoning involved in this problem in the following way. � 48 × 4 = brother � 48 × 3 = friend � Brother = 192 cards � Friend = 144 cards � 192 + 144 = 336 cards
Aidan’s brother and friend have 336 cards in all.
4. Division problem: Libby collects concert shirts. Each shirt costs $12. If Libby has $120, how manyconcert shirts can she buy? If Libby saved $9 per month, how long would it take her to save enoughmoney to buy that many shirts?We might represent the reasoning involved in this problem in the following way.
� $120 ÷ 12 = 10 shirts � Libby can buy 10 shirts with $120. � $120 ÷ $9 = 13.33
It would take Libby thirteen months and about ten days to save enough money to buy ten shirts.
Clearly the steps in reasoning necessary to solve these problems have some significant differences from type to type. The steps to solving the addition problem are straightforward. Students find the perimeter by adding the length of the sides and then doubling that quantity to account for the two stripes.
The steps to the subtraction problem are more involved. Students first determine the remaining number of bags after 117 are sold. This is quite simple. Students then compute the difference between the remaining number of bags and the threshold number of 50. Although this step involves subtraction, as did the first step, it has a totally new perspective.
The multiplication problem begins with students multiplying two numbers—one for the brother and one for the friend. The next step involves addition.
The division problem involves the most complex set of steps. It begins with a straightforward division task—the total amount of money available divided by the cost of each shirt. The problem then shifts contexts. Students must take the total amount of money available and divide it by an amount of money that Libby can save each month. However, this step also involves dealing with a remainder, which adds complexity.
Looking at the problem types, the subtraction problem is the only one of the four that requires students to perform an operation on a quantity that the directions to the problem do not explicitly state. The division problem is the only one that involves a remainder. One can also make the case that each of the four problems makes some unique cognitive demands simply to understand it.
The reason this standard is equivocal, then, is that it does not make clear how important the four operations are to demonstrating proficiency. It does not make clear how important remainders are to demonstrating
SAMPLE CONTENT - NOT FOR DISTRIBUTION
17The Assessment-Friendly Curriculum
proficiency, and it seems to treat four operations equally, although they have significant differences in their execution.
As another example of equivocality in standards, consider the following high school ELA standard and the upper elementary civics standards.
ELA (high school): Analyze multiple interpretations of a story, drama, or poem (e.g., recorded or live production of a play or recorded novel or poetry), evaluating how each version interprets the source text (RL.11–12.7; NGA & CCSSO, 2010a)
Civics (grades 3–5): Identify the major duties, powers, privileges, and limitations of a position of leadership (e.g., class president, mayor, state senator, tribal chairperson, pres-ident of the United States) . . . evaluate the strengths and weaknesses of candidates in terms of the qualifications of a particular leadership role. (section H, standard 1; Center for Civic Education, 2014)
In both of these examples, assessments would be quite different depending on a teacher’s selection of avail-able options. For example, in the ELA standard, comparing the treatment of the same content in a story and a poem is a quite different task from comparing a story and a play. In the civics standard, knowing the duties, powers, and privileges of a class president is a quite different task from knowing the duties of a state senator.
Standards as InconsequentialWe have observed two practices that appear to address the problems associated with standards but, in fact,
render standards inconsequential: (1) tagging multiple standards and (2) relying on sampling across standards.
Tagging Multiple Standards
One common practice is for teachers to assess standards by simply tagging multiple standards in the tests they give. For example, assume that a teacher has created the following assessment in a seventh-grade ELA class.
We have been reading Roll of Thunder, Hear My Cry by Mildred D. Taylor, which tells the story of Cassie Logan and her family who live in rural Mississippi. In the novel, Taylor develops several themes. Describe how the author develops the theme of the importance of family through characters, setting, and plot. Compare the importance of family theme with one other theme from the book. Write a short essay that explains which of the two themes you think is the most important to the development of the novel. Justify your choice with logical reasoning and provide textual evidence.
Because the teacher must cover all the seventh-grade ELA standards, he or she simply identifies all those standards directly or tangentially associated with this assessment. For example, the teacher might assert that this assessment addresses the following Common Core standards to one degree or another:
RL.7.1
Cite several pieces of textual evidence to support analysis of what the text says explicitly as well as inferences drawn from the text.
RL.7.2
Determine a theme or central idea of a text and analyze its development over the course of the text; provide an objective summary of the text.
RL.7.10
By the end of the year, read and comprehend literature, including stories, dramas, and poems, in the grades 6–8 text complexity band proficiently, with scaffolding as needed at the high end of the range.
SAMPLE CONTENT - NOT FOR DISTRIBUTION

THE NEW ART AND SCIENCE OF CLASSROOM ASSESSMENT18
WHST.6–8.1.B
Support claim(s) with logical reasoning and relevant, accurate data and evidence that demonstrate an understanding of the topic or text, using credible sources.
WHST.6–8.10
Write routinely over extended time frames (time for reflection and revision) and shorter time frames (a single sitting or a day or two) for a range of discipline-specific tasks, pur-poses, and audiences. (NGA & CCSSO, 2010a)
In effect, then, the teacher uses the score on one test to represent a student’s standing on five separate standards. Such an approach gives the perception that teachers are addressing standards but in reality, it constitutes a record-keeping convention that wastes teachers’ time and renders the standards inconsequential. In fact, we believe that this approach is actually the antithesis of using standards meaningfully.
Relying on Sampling Across Standards
At first glance, it might appear that designing assessments that sample content from multiple standards solves the problem of too much content. If a teacher has seventy-three standards statements to cover in a year, he or she can design assessments that include items from multiple statements. One assessment might have items from three or more statements. If a teacher systematically samples across the standards in such a way to equally emphasize all topics, then in the aggregate, the test scores for a particular student should paint an accurate picture of the student’s standing within the subject area. This is different from and better than tagging because the teacher designs assessments by starting with the standards. With tagging, the teacher designs assessments and then looks for standards that appear to be related.
Even though sampling has an intuitive logic to it, it still doesn’t work well with classroom assessments. Indeed, sampling was designed for large-scale assessments, but even there it doesn’t work very well. To illus-trate, consider the following example:
You are tasked with creating a test of science knowledge and skills for grade 5 students. The school will report test results at both the individual and school levels to help students, parents, teachers, and leaders understand how well students are learning the curriculum. The test must address a variety of topics such as X, Y, Z and, in order to effectively assess their knowledge, many of the items require students to construct and justify responses. Some of the items are multiple choice.
Pilot testing of items indicates that students require about 10 minutes to complete a constructed response item and about two minutes to complete a multiple-choice item. Your team has created 32 constructed response items and 16 multiple choice items that you feel cover all topics in the grade 5 science curriculum. Based on your estimates of how much time a student needs to complete items, the test will require approximately 6 hours to complete, not including time for set up and instructions, and breaks. And that’s just one content area test. (Childs & Jaciw, 2003, p. 8)
We can infer from the comments of Ruth A. Childs and Andrew P. Jaciw (2003) that adequate sampling, even for three topics, requires a very long assessment. As a side note, Childs and Jaciw (2003) imply that fifth-grade science involves three topics only (for example, X, Y, and Z). In fact, Simms (2016) has determined that fifth-grade science involves at least twelve topics, four times the amount of content that Childs and Jaciw’s (2003) example implies.
Finally, even with a relatively slim version of the content involved in fifth-grade science (three topics as opposed to twelve), and a test that requires six hours to complete, the sampling process might not be robust enough to justify reporting scores for individual students. Childs and Jaciw (2003) describe the following concern for any test that purports to provide accurate scores for individual students:
SAMPLE CONTENT - NOT FOR DISTRIBUTION

19The Assessment-Friendly Curriculum
Whether there is enough information at the student level to report subscores may be a concern. For example, research by Gao, Shavelson, and Baxter (1994) suggests that each student must answer at least nine or ten performance tasks to avoid very large effects of person-by-item interactions. To produce reliable subscores, even more items may have to be administered. Given that there are limits in test administration time, it may not be fea-sible to administer enough items to support student-level subscores. Instead, only overall scores might be reported at the student level, while both overall scores and subscores are reported at the school level. (p. 8)
Despite these clear flaws in sampling procedures as the basis for test design, educators do it all the time. Everyone in the system (students, teachers, leaders, parents) relies on the resulting information to make important decisions that influence student grades, placement in classes and coursework, and advancement to the next grade or course.
As we mention in the introduction, using proficiency scales solves a variety of assessment problems, sam-pling being one of those. In a system that uses proficiency scales as a measurement tool, one might lose the ability to generalize across a content area using a single test but gain immense clarity in particular slices of the target domain (for example, fifth-grade science).
The Assessment Focus of StandardsClearly, it is the case that standards statements as currently written are not effective vehicles to drive class-
room assessment. We recommend that educators rewrite standards statements so they provide a clear and unequivocal focus for classroom assessments. We call these rewritten standards statements focus statements. Focus statements translate into measurement topics. As the name implies, these measurement topics are con-sidered important enough to assess multiple times at the school level or district level in an effort to determine the most accurate scores for individual students. To illustrate, we present figure 1.3.
Subject StandardFocus
StatementMeasurement
Topic
Mathematics (Standard 6, Grades 3–5)
Understands the basic concept of a sample (for example, a large sample leads to more reliable information; a small part of something may have unique characteristics but not be an accurate representation of the whole)
Knows character-istics of a sample
Samples
Language Arts (Standard 7, Grades 9–12)
Uses reading strategies and skills to understand a variety of information texts (for example, textbooks, biographical sketches, letters, diaries, directions, procedures, magazines, essays, primary sources)
Executes specific reading strategies and skills
Reading strategies
Science (Standard 9, Grades K–2)
Understands that the Sun supplies heat and light to Earth
Knows the relationship between the Sun and the Earth
The Sun and the Earth
U.S. History (Standard 14, Grades 7–8)
Understands the circumstances that shaped the Civil War and its outcome (for example, differ-ences between the economic, technological, and human resources of both sides; impact of the Emancipation Proclamation on the outcome of the war)
Knows events that helped cause the Civil War and the outcome of that war
Causes and outcomes of the Civil War
Figure 1.3: Standards with focus statements. continued
SAMPLE CONTENT - NOT FOR DISTRIBUTION

THE NEW ART AND SCIENCE OF CLASSROOM ASSESSMENT20
Subject StandardFocus
StatementMeasurement
Topic
Physical Education (Standard 1, Grades K–2)
Uses control in travel activities on a variety of body parts (for example, travels in backward directions and changes directions quickly and safely, without falling; changes speeds and direc-tions in response to various rhythms; combines traveling patterns to music)
Executes control of various body parts while engaging in different bodily activities
Body control
Arts—Dance (Standard 1, Grades 5–8)
Executes technical dance skills (for example, alignment, coordination, balance, core support, kinesthetic awareness, clarity of movement) to accurately perform a variety of movements (for example, changes of direction, levels, facings, pathways, elevations and landings, extensions of limbs, and movement transitions) (National Core Arts Standards, State Education Agency Directors of Arts Education, 2014)
Executes techni-cal dance skills to perform various movements
Dance movements
Civics (Standard 8, Grades 9–12)
Knows the major ideas of republicanism (for example, government of a republic seeks the public or common good rather than the good of a particular group or class of society; civic virtue of citizens is essential, which means citizens put the public or common good above their private interests)
Knows char-acteristics of republicanism
Republicanism
Economics (Standard 6, Grades 9–12)
Understands that most federal tax revenue comes from personal income and payroll taxes, and these taxes are used to fund social security payments, the costs of national defense, medical expendi-tures, and interest payments on the national debt
Knows the source and use of federal taxes
Federal taxes
Geography (Standard 7, Grades 3–5)
Understands how physical processes help to shape features and patterns on Earth’s surface (for example, the effects of climate and weather on vegetation; erosion and deposition on land forms; mud slides on hills)
Understands how physical processes (for example, the drainage basin of a river system, the ridge-and-valley pattern of the Appalachians; vegetation on the windward and leeward sides of a mountain range) produce patterns on the landscape
Knows specific types of land-scape patterns
Landscape patterns
Health (Standard 7, Grades 3–5)
Sets a personal health goal and makes progress toward its achievement
Executes the process of setting goals regarding personal health
Personal health goals
Technology (Standard 1, Grades 3–5)
Uses proper keyboard techniques, beginning from the home row and maintaining proper posture
Executes the process of keyboarding
Keyboarding
Foreign Language (Standard 1, Grades 9–12)
Uses the target language and its idioms to demonstrate appropriate cultural responses (for example, expressing gratefulness; extending and receiving invitations; apologizing; communicating preferences; making an appointment; closing a conversation; negotiating solutions to problems)
Executes the process of using idioms and lan-guage to demon-strate appropriate cultural responses
Using idioms
Source for standards: Adapted from McREL, 2014a.
SAMPLE CONTENT - NOT FOR DISTRIBUTION

21The Assessment-Friendly Curriculum
The focus statements in figure 1.3 contain the essence of the content in the full standards statement with enough detail to provide guidance for assessment, but not so much as to add unnecessary complexity. As we demonstrate in chapter 2, proficiency scales add even more detail, but focus statements are a useful step in the process of identifying critical content. As we indicate in the last column of figure 1.3, once educators articulate focus statements, it is easy to translate them into measurement topics.
The wording of the focus statements in figure 1.3 highlights the type of knowledge they represent. Those that begin with the word knows or understands are examples of declarative knowledge. Those that begin with the word executes are examples of procedural knowledge. It is important to note that we did this to make a point—namely, that the content embedded in standards statements comes in two different forms— declarative and procedural knowledge. We believe this distinction is critical simply because assessments should reflect the type of knowledge on which they focus. We describe how to do this in chapter 3 (page 43).
For now, suffice it to say that different subject areas have differing proportions of declarative and procedural knowledge. To illustrate, we consider a McREL (2014b) study in which researchers analyze the standards in fourteen different subject areas and determine the distributions of declarative and procedural knowledge in those subject areas. They updated their analysis in 2008, producing the results we depict in table 1.1.
Table 1.1: Standards Relating to Percentages of Declarative Versus Procedural Knowledge
Subject Declarative Procedural
Mathematics 139 84
ELA 86 254
Science 253 8
History 1,240 41
Geography 230 8
Arts 147 122
Civics 426 1
Economics 159 0
Foreign Language 52 56
Health 121 15
Physical Education 47 58
Behavioral Studies 100 0
Technology 106 38
Life Skills 67 241
Total 3,173 (77.41 percent) 926 (22.59 percent)
Note: Procedural and contextual have been combined.
Source: McREL, 2014b.
Notice that, in general, there are far more declarative standards than procedural standards. More specifi-cally, 77 percent of the standards in this study involve declarative content, and 23 percent involve procedural content. That noted, there is some significant variation from subject area to subject area. For example, physi-cal education, life skills, arts, and foreign language are about equal in terms of their distribution of declarative and procedural content, whereas behavioral studies and economics have no procedural content.
SAMPLE CONTENT - NOT FOR DISTRIBUTION

THE NEW ART AND SCIENCE OF CLASSROOM ASSESSMENT22
A Small List of Measurement TopicsUltimately, the purpose of analyzing and restating standards is to identify a relatively small set of measure-
ment topics as the subject of classroom assessment and instruction. This list constitutes the assessment-friendly curriculum that is essential for a new paradigm of classroom assessment.
Developing the assessment-friendly curriculum is somewhat of a value-driven decision, but research guid-ance does exist. Specifically, Simms (2016) finds that if one removes the redundancy in standards and con-siders only those that national assessments typically contain, then the list of essential measurement topics is quite small. Table 1.2 reports the number of essential topics in mathematics, science, and ELA.
Table 1.2: Essential Topics in Mathematics, Science, and ELA
Subject K 1 2 3 4 5 6 7 8 9 10 11 12
Mathematics 10 9 14 14 15 14 16 15 16 64 187
Science 9 11 11 13 15 10 31 36 136
ELA 18 20 19 19 18 15 15 14 15 14 14 181
Source: Simms, 2016.
The list of essential measurement topics is available in The Critical Concepts (Simms, 2016). Educators can use this list as a starting place as they translate their local or state standards into measurement topics. As we indicate in table 1.2, there are a relatively small number of measurement topics at each grade level or grade-level span. For example, consider fifth grade. There are fourteen essential measurement topics in mathemat-ics, ten in science, and fifteen in ELA. Contrast this with the seventy-three topics from the Common Core State Standards for ELA at the eighth-grade level, which we discussed previously.
Narrowing down all the content in state and national standards into a small set means that the measure-ment topics will not include all content. What, then, do we do with all this leftover content? There are two basic approaches to answering this question: (1) relying on incidental learning and (2) creating a supplemen-tal measurement topic.
Relying on Incidental Learning
Incidental learning is a largely untapped resource that teachers can leverage to enhance content coverage in a classroom that focuses on standards. To understand how this works, assume that a teacher was working with the following ten measurement topics in fourth-grade science.
1. Energy2. Motion3. Light and vision4. Waves5. Geographic features
6. Earth changes7. Natural hazards8. Natural resources9. Plant needs
10. Animal needs
As we have discussed, national, provincial, state, and local standards documents would surely contain many other topics like Earth’s history, human impacts on resource use, and scientific contributions throughout history. Even though the measurement topics do not specifically include these topics, the teacher might integrate the content into instruction formally or informally. Formally means that the teacher actually plans for direct instruction in the supplemental content. Informally means that the teacher does not plan for direct instruction in the content but addresses it if it comes up naturally during class. For example, while discussing
SAMPLE CONTENT - NOT FOR DISTRIBUTION

23The Assessment-Friendly Curriculum
the topic of different methods of energy production, which is part of the measurement topic energy, the teacher might remember that the supplemental topic of human impact on resource use also applies to the example he or she is providing. This approach inserts additional content into the instructional process but doesn’t necessarily assess that content.
Relying on incidental learning mitigates the common misconception that if a teacher doesn’t test on it, then students don’t learn it. While it is true that students stand a better chance of remembering content they’ve taken tests on, it is also true that brief exposure to content gives them a good chance of remembering it. Some educators refer to this as fast mapping (Carey, 1978).
Creating a Supplemental Measurement Topic
In this approach, teachers formally teach and assess supplemental content. Specifically, they assign all the content they don’t find in a specific measurement topic to a supplemental measurement topic for assessment purposes. We discuss the specifics of how to assess and report a supplemental measurement topic in chapter 4 (page 61). Briefly, though, assume that a school or district has identified twenty measurement topics for an entire year in seventh-grade social studies. During the first grading period, a teacher addresses six of these official measurement topics. This means that every student has a final score on each of these topics, and these scores come from assessments that the teacher specifically designed for these topics. However, a particular teacher also covers three social studies topics that the list of measurement topics did not include. The teacher assigns a score to students on each one of these supplemental topics, but for reporting purposes, the teacher combines the scores on these three topics into one. Therefore, at the end of the grading period, each student would have a score on each of the six official measurement topics and one score that represents all the supple-mental topics the class covered during the grading period.
The New Art and Science of Classroom Assessment in PracticeAs the title of this book implies, effective classroom assessment is both an art and a science. There are some
things educators should do and other practices they should avoid. In each chapter, we address both as a summary of the important content in the chapter. The focus of this chapter was the assessment-friendly curriculum. Guidelines for teachers include the following.
• Do not try to teach and assess all standards in your state or local documents.• Identify a relatively small set of topics (for example, about ten to twenty-five) by restating
standards to highlight their assessment focus.• Create a name for each selected focus statement and refer to these names as measurement topics.• Rely on incidental learning or a supplemental measurement topic for all the content you do not
select for a measurement topic.
SAMPLE CONTENT - NOT FOR DISTRIBUTION