robinson lee january - university digital conservancy home
TRANSCRIPT
Fatty Acid Metabolic Engineering: Insights for Bacterial Hydrocarbon Production
A THESIS
SUBMITTED TO THE FACULTY OF THE GRADUATE SCHOOL
OF THE UNIVERSITY OF MINNESOTA
BY
Lee T. Robinson
IN PARTIAL FULFILLMENT OF THE REQUIREMENTS
FOR THE DEGREE OF
MASTER OF SCIENCE
Advisor: Dr. Jeffrey A. Gralnick
January 2012

© Lee T. Robinson 2012

i
Acknowledgements
First off, I would like to thank my lab mates for keeping the lab a fun, sometimes
unusual, but always supportive environment. Your help in designing experiments and
analyzing results was integral to my success. Much gratitude goes to Jeffrey Gralnick, as
a mentor your guidance and support throughout my master’s project was invaluable.
I would not have any of these people to thank if it wasn’t for my parents who
have extended to me every opportunity in life to succeed, thank you Mom and Dad.
Lastly, and most importantly, I thank Brittany for supporting me when I told her I was
going back to school and unknowingly agreeing to years of late night time points and
“quick stops to the lab”.

ii
Table of Contents
List of Tables ..................................................................................................................... iv
List of Figures ......................................................................................................................v
Chapter 1: Introduction ........................................................................................................1
Chapter 2: Elimination of a competing pathways for acyl-CoA substrates: fatty acid β-
oxidation ..............................................................................................................................3
Introduction ...................................................................................................................3
Materials and Methods ..................................................................................................5
Reagents .....................................................................................................................5
FadE-1, FadE-2, and OleA expression vector design ................................................5
fadE-1 and fadE-2 deletion construct design .............................................................6
Conjugal transfer of plasmids .....................................................................................8
Targeted gene disruption in S. oneidensis...................................................................8
Culturing of strains in minimal media with fatty acid carbon sources .......................8
Chloroform and methanol extraction of nonpolar compounds ...................................9
Direct esterification of fatty acids ...............................................................................9
Analysis of hydrocarbons and FAME products by GC-MS-FID .............................10
Results .........................................................................................................................10
Discussion ...................................................................................................................13
Chapter 3: Identification of optimal fadD gene(s) necessary for substrate formation .......16
Introduction .................................................................................................................16
Materials and Methods ................................................................................................17
Reagents ...................................................................................................................17
FadD-1 and FadD-2 expression vector design .........................................................17
fadD-1 and fadD-2 deletion construct design ..........................................................17
Conjugal transfer of plasmids ..................................................................................18
Targeted gene disruption in S. oneidensis................................................................18
fadD targeted gene disruption in E. coli ..................................................................18
Culturing of strains in minimal media with fatty acid carbon sources ....................20

iii
Chloroform and methanol extraction of nonpolar compounds ................................20
Direct esterification of fatty acids ............................................................................20
Analysis of hydrocarbons and FAME products by GC-MS-FID ............................20
Results .........................................................................................................................20
Discussion ...................................................................................................................25
Chapter 4: Increasing the production of precursors and hydrocarbons .............................29
Introduction .................................................................................................................29
Materials and Methods ................................................................................................30
Reagents ...................................................................................................................30
BioBrick™ expression system .................................................................................30
Bacterial culturing and growth.................................................................................31
Acc expression vector design...................................................................................32
'TesA expression vector design ................................................................................33
Conjugal transfer of plasmids ..................................................................................33
fadE targeted gene disruption in E. coli ...................................................................33
'TesA activity assay .................................................................................................33
Culturing of strains in minimal media with fatty acid carbon sources ....................34
Chloroform and methanol extraction of nonpolar compounds ................................34
Extraction of fatty acids from culture medium ........................................................34
Direct esterification of fatty acids ............................................................................34
Analysis of hydrocarbons and FAME products by GC-MS-FID ............................34
Results .........................................................................................................................34
Discussion ...................................................................................................................43
Chapter 5: Conclusions and future directions ....................................................................46
Works cited ........................................................................................................................48

iv
List of Tables
Table 2.1 Primers. ................................................................................................................6
Table 2.2 Plasmids and strains .............................................................................................7
Table 3.1 Primers ...............................................................................................................17
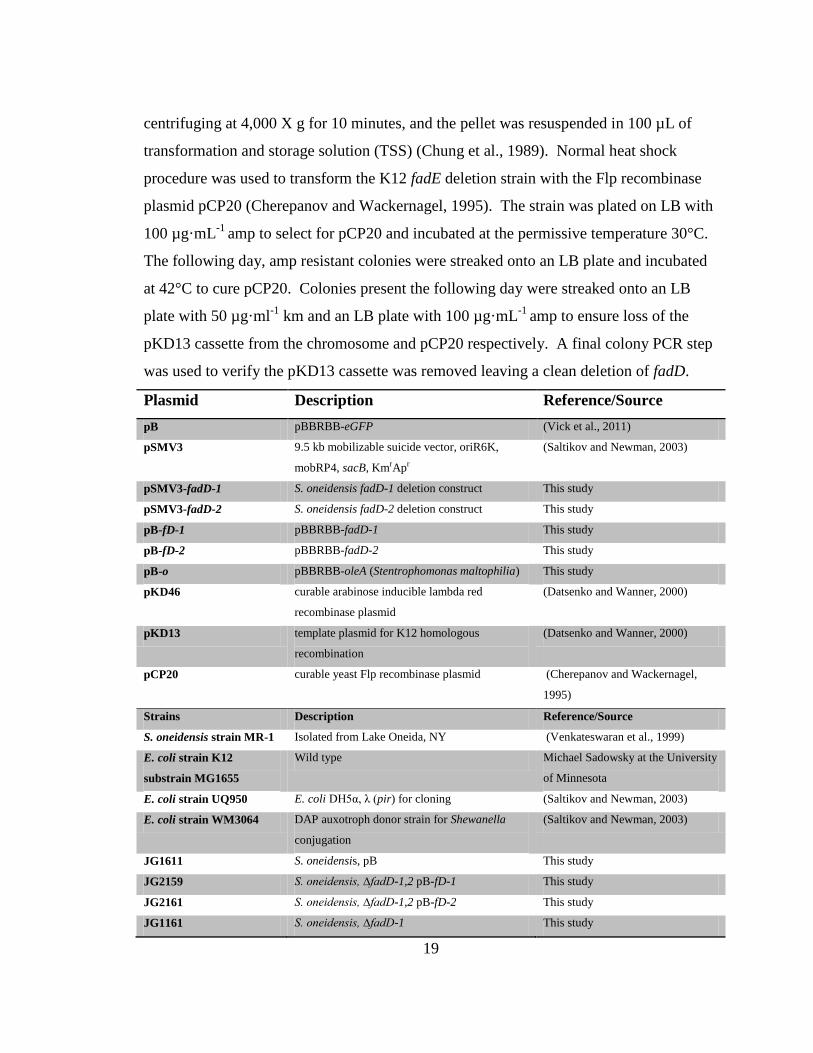
Table 3.2 Plasmids and strains ...........................................................................................19
Table 4.1 Primers ...............................................................................................................31
Table 4.2 Plasmids and strains ...........................................................................................31
Table 4.3 'tesA mutations ...................................................................................................35
Table 4.4 Fatty acid overproduction in E. coli strain expressing 'TesA ............................42

v
List of Figures
Figure 2.1 Proposed hydrocarbon pathway engineered into S. oneidensis ..........................5
Figure 2.2 Growth curves of S. oneidensis fadE mutants on fatty acids ...........................11
Figure 2.3 Growth curves of S. oneidensis fadE mutants complemented with fadE
homologues ........................................................................................................................12
Figure 2.4 Fatty acid and hydrocarbon profile of fadE double mutant ..............................13
Figure 3.1 Growth curves of S. oneidensis fadD mutants on fatty acids ...........................21
Figure 3.2 Growth curves of S. oneidensis fadD mutants complemented with fadD
homologues ........................................................................................................................22
Figure 3.3 Growth curves of E. coli fadD mutants on fatty acids .....................................23
Figure 3.4 Growth curves of E. coli fadD mutants complemented with MR-1 fadD
homologues ........................................................................................................................24
Figure 3.5 Fatty acid and hydrocarbon profiles of S. oneidensis fadE double mutant ......25
Figure 4.1 S. oneidensis 'TesA growth curve, thioesterase activity, fatty acid profile ......36
Figure 4.2 Growth curves of E. coli fadE mutants on fatty acids ......................................37
Figure 4.3 E. coli 'TesA growth curve, thioesterase activity, fatty acid profile ................39
Figure 4.4 Secreted fatty acid comparison of E. coli and S. oneidensis strains expressing
'TesA ..................................................................................................................................40
Figure 4.5 Fatty acid profile of 'TesA and Acc co-expressed in E. coli ............................41
Figure 4.6 Hydrocarbon production in S. oneidensis and E. coli strains engineered to
overproduce hydrocarbons .................................................................................................43

1
Chapter 1
Introduction
Energy use in United States has been dominated by non-renewable fossil-based
fuels for a little over a century. Over that same time span, these energy sources were
both cheap and abundant, and a vast infrastructure was built around them. Currently, the
United States generates approximately eighty-six percent of its energy from non-
renewable fossil fuels (Perlack et al., 2005). Forty percent of the energy is derived from
petroleum-based fuels, of which two-thirds is used as a liquid transportation fuel (Perlack
et al., 2005). Petroleum is a fuel with an increasingly limited supply due to its non-
renewable nature and increased global demands. Coupled with awareness of the
environmental impacts of using fossil fuels and a desire to achieve energy independence
for greater national and economic security, there is increased interest in developing
renewable, sustainable, and domestic supplies of fuel that can be integrated into the
current infrastructure.
Bioethanol and biodiesel represent current generation alternative fuels that are
both renewable and can be utilized in the already established infrastructure. The largest
drawback to these fuels is that the biomass feed stocks for fuel production are also human
food crops. Sustainability is also an issue, in that if all the corn grown in the United
States was used for bioethanol production and all the soybeans for biodiesel production,
this would only offset 12% of total gasoline use and 6% of total diesel use (Hill et al.,
2006). Additional deficiencies include cost of production and the lack of certain desired
fuel quality characteristics such as high energy density and stability. These deficiencies
leave the door open for development of additional alternative biofuels. A wave of second
generation alternative fuels is on the horizon, but issues must be addressed with the
biomass feedstock, biotechnology, scalability, fuel quality, and economic relevance.
Shewanella oneidensis strain MR-1 is an example of a microorganism that
synthesizes a second generation fuel-type compound. MR-1 naturally synthesizes a 31
carbon poly-unsaturated compound from a poly-unsaturated fatty acid precursor
(Sukovich et al., 2010). These poly-unsaturated hydrocarbons could theoretically be
refined using traditional petroleum based techniques to make high quality fuels such as

2
gasoline or diesel. For this fuel to be a viable alternative to petroleum based fuels,
increased production of this or similar hydrocarbons from MR-1 is necessary at a lower
cost. This can be achieved by coupling the hydrocarbon producing Shewanella to a
phototroph to generate energy and carbon precursors that can be assimilated into
hydrocarbons by MR-1, resulting in lower production cost, smaller carbon footprint, and
elimination of land competition with food crops. MR-1 is an ideal host organism for this
engineering because it naturally synthesizes hydrocarbons, it is genetically amenable, and
the genome has been sequenced and is available. Additionally, MR-1 and E. coli share
homologues and general pathway features for both fatty acid synthesis and degradation,
providing a framework for engineering an S. oneidensis strain capable of producing
relevant quantities of hydrocarbons as an alternative fuel.
The aim of this research was to engineer a pathway into S. oneidensis that
synthesizes high amounts of hydrocarbons. This pathway involves engineering strategies
with the end goals of increasing production of fatty acids, deregulating fatty acid
synthesis, and disruption of competing pathways for the hydrocarbon precursors. The
proposed pathway is outlined in figure 2.1 and lays out the engineering strategies for the
following studies. These goals employed several microbial engineering strategies.
Chapter two focuses on disruption of a competing pathway by engineering an S.
oneidensis strain incapable of degrading hydrocarbon precursors. Chapter three focuses
on identifying the necessary and optimal gene(s) for substrate formation in S. oneidensis.
The fourth chapter explores heterologous expression of a protein targeted to deregulate
synthesis of precursors, allowing for increased production of fatty acids and
overexpression of native genes considered rate-limiting steps in precursor synthesis.
Leveraging the broad wealth of knowledge of fatty acid metabolism in E. coli,
hydrocarbon production in MR-1, and engineering capabilities of MR-1, generating an S.
oneidensis strain capable of producing relevant quantities of fuel is a possibility.

3
Chapter 2
Elimination of a competing pathway for acyl-CoA substrates: fatty acid β-oxidation
Introduction
MR-1 is a facultative anaerobe, gram-negative rod, γ-proteobacterium well known
for the ability to respire a variety of soluble and insoluble terminal extracellular electron
acceptors (Hau and Gralnick, 2007). Hydrocarbons are synthesized in MR-1 by a head-
to-head condensation reaction of two polyunsaturated fatty acids by the enzyme OleA
(Sukovich et al., 2010). For this reaction to occur, the fatty acids must be in an activated
form. Most commonly, activated fatty acids are found in bacteria thioesterified either to
acyl carrier protein (ACP) or coenzyme A (CoA) groups. Using OleA from MR-1 as a
query subject, homologues are identified in various bacteria. In particular, when one of
these OleA homologues from Stenotrophomonas maltophilia is heterologously expressed
in MR-1, it produces over 17 different long chain fatty acid (LCFA) derived hydrocarbon
products (Sukovich et al., 2010). The ability of this recombinant strain to use multiple
products from fatty acid synthesis as substrates when OleA from S. maltophilia is
heterologously expressed provides an opportunity to increase hydrocarbon production.
To further explore the fatty acid substrate requirements for hydrocarbon production,
experiments were carried out by (Frias et al., 2011) using a purified OleA homologue
from another organism, Xanthomonas campestris, and results indicated that in vitro, this
homologue specifically condenses CoA activated long chain fatty acids (LCFA-CoAs)
(Frias et al., 2011). Based on the homology between X. campestris and S. maltophilia
OleA, it is likely that S. maltophilia OleA also has substrate specificity for LCFA-CoAs,
and it was the aim of this research to eliminate competing pathways for LCFA-CoA’s in
our S. oneidensis hydrocarbon overproducing strain.
Fatty acids are energy-rich molecules that can be degraded by the β-oxidation
pathway in bacteria to generate energy and carbon for the cell. β-oxidation is an iterative
cycle involving the oxidation of the β carbon of the fatty acid with the end result of each
cycle being the release of the two-carbon molecule acetyl-CoA along with generation of
the reducing equivalents FADH2 and NADH. At this point, the fatty acid is reduced by
two carbons and re-enters the β-oxidation cycle to be oxidized again until the fatty acid

4
chain is reduced to acetyl-CoA. The β-oxidation cycle reviewed in (DiRusso et al., 1999)
shows the first committed step in this pathway is the oxidation of the LCFA-CoAs
catalyzed an acyl-CoA dehydrogenase (FadE). FadE catalyzes the dehydrogenation of
the LCFA-CoA chain and subsequent transfer of two electrons to FAD, resulting in the
formation of 2-enoyl-CoA. In the next step, the FadBA multienzyme complex catalyzes
a hydration reaction at the double bond, forming a 3-hydroxyacyl-CoA followed by a
second dehydrogenation step yielding a 3-ketoacyl-CoA and NADH. In the final step,
the FadBA complex functions as a 3-ketoacyl-CoA thiolase that cleaves the β-ketoacyl-
CoA from the acyl chain and transfers it to the thiol group of a free CoA (CoASH),
resulting in the release of acetyl-CoA. In a strain engineered to overproduce fatty acids
for hydrocarbon production, it is imperative to block fatty acid degradation so LCFA-
CoA substrates for hydrocarbon synthesis are not immediately degraded. Since FadE is
the first committed step in fatty acid degradation and a direct competitor for LCFA-
CoAs, disruption of fadE in MR-1 should effectively eliminate degradation of the
substrate for hydrocarbon synthesis. Disruption of fadE has already been characterized in
E. coli, and this has been shown to effectively eliminate β-oxidation. The phenotypic
effect on β-oxidation of the disruption of fadE can be assessed by culturing S. oneidensis
strains in minimal medium with fatty acids as the sole carbon source.

5
Figure 2.1 Proposed hydrocarbon pathway to be engineered in MR-1. Targeted
reaction for overexpression: Acc (acetyl-CoA carboxylase, ‘TesA (thioesterase),
FadD (acyl-CoA ligase), OleA (3-oxoacyl-ACP synthase III). Targeted reaction for
disruption: FadE (acyl-CoA dehydrogenase).
Materials and Methods
Reagents
Restriction enzymes, Antarctic phosphatase, and T4 ligase were from New
England Biolabs. GoTaq Green Master Mix was used to amplify DNA and was obtained
from Promega. For PCR cleanup and gel extraction, the IBI Gel/PCR DNA fragment
extraction kit was used. For plasmid isolation and purification, the Invitrogen PureLink
Quick Miniprep Plasmid Kit was used.
FadE-1, FadE-2, and OleA expression vector design
Primers used are listed in Table 2.2. The fadE-1 (locus tag SO2536) and fadE-2
(locus tag SO2492) genes were amplified by PCR using an MR-1 colony as template
DNA resulting in a 2.5 kb band for fadE-1 and a 2.2 kb band for fadE-2. Primers for
oleA (locus tag Smlt0205) from Table 2.2 were used to amplify oleA from

6
Stenotrophomonas maltophilia R551-3 genomic DNA and resulted in a 1 kb band. All
three genes were digested with BamHI and XhoI restriction enzymes and purified on a
1% w/v agarose gel. The digested genes were excised and purified with the IBI gel
extraction kit. The purified genes were then ligated with T4 ligase into pB that had been
digested with the same enzymes and purified in the same manner as the genes. The
ligation reaction was used to transform UQ950 competent cells and were plated on LB
with 50 µg·ml-1
kanamycin (km) to select for transformed cells. Colonies formed on the
transformation plate were screened using colony PCR and primers originating within the
pBBRBB backbone that amplified across the multiple cloning site of the vector.
Colonies with the appropriate length PCR product were inoculated into 5 mL LB with 50
µg·ml-1
km and grown overnight. These cultures were pelleted, and the plasmid was
isolated and purified. Plasmids were then sent to ACGT Inc. to verify correct nucleotide
sequence.
Primer ID Sequence
PBBRBB_FADE-1_F 58190016 NNNGGATCCGTGACTACCCTACTTTGGCTCATC
PBBRBB_FADE-1_R 58190017 NNNCTCGAGTTAAGCGGCGCGTTCC
PBBRBB_FADE-2_F 58190018 NNNGGATCCATGTTGACGATTATAATTATTGCCCTGATTG
PBBRBB_FADE-2_R 58190019 NNNCTCGAGTTATAAAGCTTCGAAATCATTCACATTGATGG
PBBRBB_OLEA_F 56337226 NNGGATCCATGCTCTTCAAGAATGTCTCGATCGCCGGC
PBBRBB_OLEA_R 52915779 NNNCTCGAGTTACCAGACCACTTCAGCCATCGAGCAGT
PSMV3_FADE-2_UF 55583305 GGGCCCACCGCGACCCAAATGATG
PSMV3_FADE-2_UR 55583306 GGAATTCATCGTATTGGTTGAAATGAGTTAACTCAG
PSMV3_FADE-2_DF 55583307 GGAATTCAATCAAGACCTTTTATTTAGAAGCCACG
PSMV3_FADE-2_DR 55583308 CGGGATCCGTACTTGTACTAGCAGGTATAGAAGTCTTAG
PSMV3_FADE-1_UF 49846461 GGGCCCAATTCAGCGTAATTTCAAAAGTAAGGCCAAAC
PSMV3_FADE-1_UR 49846462 GAATTCGTATTTCTCCTTAATCATGACCGAGTGCC
PSMV3_FADE-1_DF 49846463 GAATTCTAGCGAAGCTGTACTAGCTAAGCC
PSMV3_FADE-1_DR 49846464 GGATCCGGCCCAAGGTTTGTTAATTTTCGG
Table 2.2 Primers used in this study.
fadE-1 and fadE-2 deletion construct design
Primers for fadE-1 and fadE-2 listed in table 2.2 were designed to amplify
approximately 1 kb upstream and 1 kb downstream of the target gene. Primers were
designed to disrupt the entire gene, including the start and stop codon. The upstream and
7
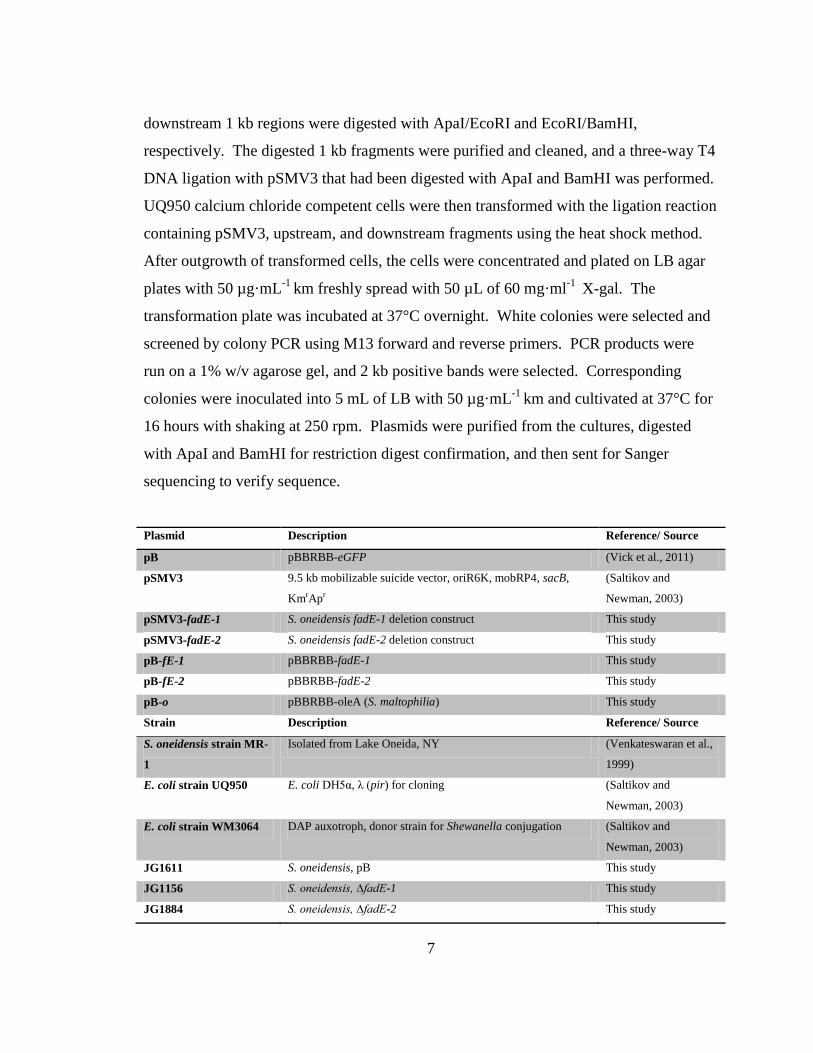
downstream 1 kb regions were digested with ApaI/EcoRI and EcoRI/BamHI,
respectively. The digested 1 kb fragments were purified and cleaned, and a three-way T4
DNA ligation with pSMV3 that had been digested with ApaI and BamHI was performed.
UQ950 calcium chloride competent cells were then transformed with the ligation reaction
containing pSMV3, upstream, and downstream fragments using the heat shock method.
After outgrowth of transformed cells, the cells were concentrated and plated on LB agar
plates with 50 µg·mL-1
km freshly spread with 50 µL of 60 mg·ml-1
X-gal. The
transformation plate was incubated at 37°C overnight. White colonies were selected and
screened by colony PCR using M13 forward and reverse primers. PCR products were
run on a 1% w/v agarose gel, and 2 kb positive bands were selected. Corresponding
colonies were inoculated into 5 mL of LB with 50 µg·mL-1
km and cultivated at 37°C for
16 hours with shaking at 250 rpm. Plasmids were purified from the cultures, digested
with ApaI and BamHI for restriction digest confirmation, and then sent for Sanger
sequencing to verify sequence.
Plasmid Description Reference/ Source
pB pBBRBB-eGFP (Vick et al., 2011)
pSMV3 9.5 kb mobilizable suicide vector, oriR6K, mobRP4, sacB,
KmrApr
(Saltikov and
Newman, 2003)
pSMV3-fadE-1 S. oneidensis fadE-1 deletion construct This study
pSMV3-fadE-2 S. oneidensis fadE-2 deletion construct This study
pB-fE-1 pBBRBB-fadE-1 This study
pB-fE-2 pBBRBB-fadE-2 This study
pB-o pBBRBB-oleA (S. maltophilia) This study
Strain Description Reference/ Source
S. oneidensis strain MR-
1
Isolated from Lake Oneida, NY (Venkateswaran et al.,
1999)
E. coli strain UQ950 E. coli DH5α, λ (pir) for cloning (Saltikov and
Newman, 2003)
E. coli strain WM3064 DAP auxotroph, donor strain for Shewanella conjugation (Saltikov and
Newman, 2003)
JG1611 S. oneidensis, pB This study
JG1156 S. oneidensis, ∆fadE-1 This study
JG1884 S. oneidensis, ∆fadE-2 This study

8
JG1885 S. oneidensis, ∆fadE-1,2 This study
JG1991 S. oneidensis, ∆fadE-1,2 pB-fE-2 This study
JG1994 S. oneidensis, ∆fadE-1,2 pB-fE-1 This study
JG1883 S. oneidensis, pB-o This study
JG1892 S. oneidensis, ∆fadE-1,2 pB-o This study
Table 2.3 Plasmids and strains used in this study.
Conjugal transfer of plasmids
S. oneidensis strains selected for gene disruption were streaked onto an LB agar
plate spread with 50 µL of 60 mM diaminopimelic acid (DAP). The E. coli donor strain
WM3064 carrying the desired plasmid for transformation was streaked over the S.
oneidensis strain and incubated at 30°C for 5-12 hours for conjugal transfer of plasmid to
strain. S. oneidensis and WM3064 cells were collected from the plate and streaked for
isolation onto an LB plate with 50 ug·ml-1
km for selection of the plasmid followed by
incubation at 30°C for 16 hours.
Targeted gene disruption in S. oneidensis
The technique above was used to transfer suicide deletion constructs into the
strain designated for gene disruption. In the last step, selection on an LB plate with 50
ug·ml-1
km was used to select for integration of the suicide vector construct into the S.
oneidensis strain. Colonies that formed on the plate were then restreaked onto an LB
plate with 50 ug·ml-1
km and incubated at 30°C for 16 hours to ensure plasmid
integration. Colonies from this plate were then streaked onto an LB and 5% w/v sucrose
plate and incubated at room temperature for two days or until colonies were visible.
Counter-selection on the sucrose plate resulted in the second recombination step,
resulting in reversion back to wild type or deletion of the targeted gene. Colonies on the
sucrose plate were screened with colony PCR using an upstream fragment forward primer
and downstream fragment reverse primer to identify colonies with the desired deletion.
Colonies with the desired disruption resulted in a 2 kb fragment. Colonies that were
positive for the deletion were streaked onto an LB plate with 50 ug·ml-1
km to ensure km
sensitivity.
Culturing of strains in minimal medium with fatty acid carbon sources

9
Single colonies from an LB plate (supplemented with 50 µg·ml-1
km when strains
carried plasmids) were used to inoculate LB liquid medium (supplemented with 50
µg·ml-1
km when strains carried plasmids) and shaken at 250 rpm for 16 hours at 30°C.
Overnight cultures were back-diluted to an OD600nm of 0.05 into Shewanella basal
medium (SBM) as defined previously defined (Hau et al., 2008) with 20 mM sodium
lactate (Sigma) (supplemented with 10 µg·ml-1
km when strains carried plasmids) and
shaken at 250 rpm for 16 hours at 30°C. Overnight SBM lactate cultures were back-
diluted to an OD600nm of 0.05 into SBM medium with 1.5% w/v Brij 58 (Sigma)
containing 5 mM hexanoic acid, 5 mM sodium decanoate, 4 mM sodium dodecanoate, 3
mM sodium tetradecanoate, 1.5 mM sodium hexadecanoate, and 1 mM sodium
octadecanoate (Sigma).
Chloroform/methanol extraction of nonpolar molecules
Single colonies were inoculated into 2 mL LB (supplemented with 50 µg·mL-1
km when strains carried plasmids). Cultures were incubated at 30°C with shaking at 250
rpm overnight. Cultures were back-diluted to an OD600nm of approximately 0.05 in 3 mL
LB medium and incubated at 30°C with shaking at 250 rpm for 48 hours. After 48 hours,
50 µL of culture was collected for BCA protein assay normalization.
Chloroform/methanol extraction of hydrocarbons was adapted from the method by Bligh
and Dyer (BLIGH and DYER, 1959). An internal standard consisting of 25 µL of 0.45
mM 12-tricosanone (C23) in toluene standard was added to the remaining culture tube.
3.75 mL of Chromosolv plus high purity chloroform (Sigma) was added to the culture
and vortexed briefly to mix. The mixture was then poured into a glass extraction tube
(18x2 cm). 7.5 mL of spectrophotometric grade methanol (Sigma) was added to the
extraction tube and vortexed for 15 seconds. An additional 3.75 mL of chloroform was
added to the extraction tube and vortexed for 15 seconds. 3 mL of deionized H2O was
added to the extraction tube and vortexed for 15 seconds. Phase separation of the organic
layers was allowed for 20 minutes. The lowest layer, containing chloroform was
removed with a glass pipette and dispensed into a twice chloroform rinsed vial. Once
chloroform had evaporated, the extract was resuspended in 100-200 µL of toluene and
dispensed into a GC vial. Hydrocarbons were analyzed by GC-FID-MS.

10
Direct esterification of fatty Acids
The methyl esterification procedure was adapted from (Griffiths et al., 2010).
Fatty acid extracts were resuspended in 500 µL toluene and dispensed in fluorinated
ethylene propylene (FEP) tubes. Either 15 µL of 0.5 mM methyl decanoate in toluene or
25 µL of 28 mM heptadecane in toluene was added to resuspended extract as an internal
standard. 1 mL of 0.5 N sodium methoxide (Sigma) was then added to the FEP tube and
vortexed briefly to mix. The FEP tube was then placed in a stirring 80°C H2O bath for 20
minutes. FAME samples were then removed from the H2O bath and cooled for 5 minutes
at room temperature. 1 mL of boron trifluoride in 14% methanol (Sigma) was then added
to the FAME sample, and the heating and cooling steps were repeated. 400 µL of
deionized H2O and 400 µL hexanes were added to the culture, vortexed on high to mix,
then on low for 1 minute. The reaction was centrifuged at 2,000 X g for 5 minutes to
facilitate phase separation. The upper hexane layer was removed with a glass pipette and
dispensed into GC vial. FAMEs were analyzed by using by GC-FID-MS.
Analysis of hydrocarbons and FAME products by GC-FID-MS
Hydrocarbons and FAME products were analyzed using a gas chromatograph
(GC) with a flame ionization detector (FID) HP 7890A (Hewlett Packard, Palo Alto, CA)
and mass spectrometer (MS) HP 5975C. Operating conditions for the GC were as
follows: helium gas, 1.75ml/min; HP-1ms column (100% dimethylsiloxane capillary; 30
m 250m 0.25 m); temperature ramp, 100-320°C for 5 min., 250°C injection port, and split
at the outlet between MS and FID. MS parameters were: electron impact at 70eV and
35A. The FID was set at 250°C with hydrogen flow set at 30 ml/min., air set at 400
ml/min., and helium make up gas set at 25 ml/min.
Results
To eliminate a competing pathway for the fatty acyl-CoA substrate used by OleA,
FadE was selected to disrupt oxidation of fatty acyl-CoA chains in the β-oxidation
pathway. E. coli strain K12 substrain MG1655 FadE (locus tag b0221) was used as a
query subject for NCBI protein blast to identify the FadE homologue in MR-1. This blast
search identified two potential homologues: FadE-1 (locus tag SO2536, 66% amino acid
identity) and FadE-2 (locus tag SO2492, 52% amino acid identity). In order to determine

11
if either or both homologues are necessary for β-oxidation in MR-1, deletion constructs
were designed, and in-frame chromosomal disruptions of both fadE-1 and fadE-2
individually and together were created.
Figure 2.2. Growth analysis of S. oneidensis fadE mutants. Growth on saturated
fatty acids: C6, C10, C12, C14, C16, C18. (●) S. oneidensis, (■) S. oneidensis ∆fadE-
1, (▲) S. oneidensis ∆fadE-2, (▼) S. oneidensis ∆fadE-1,2.
Phenotypes for fadE mutants in β-oxidation were determined by aerobic culturing of fadE
mutants in SBM supplemented with varying chain lengths of saturated fatty acids (C6,
C10, C12, C14, C16, C18) and a fatty acid solubilizing non-ionic detergent, Brij 58
(Kang et al., 2010). Using C8 (octanoic acid) as a carbon source is not possible for MR-1
since it is toxic to the organism (Dan Coursolle, personal communication). Disruption of
fadE-1 and fadE-2 individually had marginal effects on growth on all fatty acids tested
(figure 2.2). When both homologues are disrupted in the same strain, growth on all fatty
acids is inhibited except for C6 and marginally on C10 (figure 2.2). Complementation of
the fadE double knockout with either fadE homologue restored growth to wild type levels
except for C10 where fadE-2 was unable to fully restore growth (figure 2.3). With

12
growth on long chain fatty acids inhibited, the fatty acid profile of the fadE double
knockout was analyzed using the FAME protocol to esterify the fatty acids extracted
from cultures and quantified by GC-FID-MS. This procedure will identify both free and
phospholipids derived fatty acids in the culture. In figure 2.4a, the FAME profile of both
MR-1 and the fadE double knockout shows no changes in fatty acid profile.
Figure 2.3. Growth analysis of S. oneidensis fadE mutants complemented with fadE
homologues. Growth on saturated fatty acids: C6, C10, C12, C14, C16, C18. (●) S.
oneidensis E.V., (■) S. oneidensis ∆fadE-1,2 pB-fE-1 (▲)S. oneidensis ∆fadE-1,2 pB-
fE-2

13
Figure 2.4 FAME profile and hydrocarbon production of MR-1 and S. oneidensis
fadE double knockout. FAME results are reported as FID abundance normalized to
an internal standard of heptadecane normalized per gram of protein in the culture.
Hydrocarbon production is reported as FID abundance normalized to 12-
tricosanone (C23) standard normalized per mg protein in culture and amounts are
displayed relative to MR-1.
Discussion
Initial experiments to eliminate fatty acid degradation targeted FadE-1, the
homologue with the highest shared amino acid identity (66%) to E. coli FadE. The fadE-
1 mutant was tested for its ability to grow on fatty acids (C6, C10, C12, C14, C16, C18),
and results showed that strains grew equally well as MR-1 on all fatty acids tested. This
result suggested that additional FadE homologues were present in MR-1. The blast
search revealed a second homologue, FadE-2, with 52% amino acid identity to E. coli
FadE. When fadE-2 was disrupted in combination with fadE-1, the strain was unable to
grow on all fatty acids tested except C6 and marginally on C10. The growth observed on
C6 and C10 with the fadE double knockout is most likely associated with a medium
chain acyl-CoA dehydrogenase yet to be identified. Blast searches do not suggest an
additional homologue based on the 30% shared amino acid identity estimate for
homologues. The next likely candidate is annotated as an isovaleryl-CoA dehydrogenase
(SO1897), an enzyme involved in branched chain amino acid metabolism with 23%
amino acid identity and 40% gene coverage to FadE in E. coli. Blast searches reveal

14
several other putative acyl-CoA dehydrogenases with low amino acid identity present in
MR-1 that may be responsible for β-oxidation of the medium chain length fatty acids C6
and C10.
The ability of each FadE homologue to essentially maintain wild type MR-1 β-
oxidation levels (assumed by correlation to growth) in the absence of the other
homologue suggests a redundant specificity for the enzymes under the experimental
conditions tested. It is possible that each enzyme exhibits different specificities for fatty
acid substrates based on chain length but the acyl-CoA dehydrogenase reaction catalyzed
by FadE may not be a rate limiting step in the MR-1 β-oxidation pathway. It is also
possible that naturally, expression of each homologue is differentially regulated by
factors yet to be identified. Interestingly, the gene immediately upstream of fadE-2 in
MR-1 is annotated as psrA. The product of this gene is a known transcriptional regulator
of genes involved in the transition to stationary phase and recently has been shown to
repress β-oxidation in Pseudomonas aeruginosa (Kang et al., 2008). PsrA has been
shown to bind LCFAs as opposed to LCFA-CoAs, as done by the E. coli transcriptional
regulator FadR. In P. aeruginosa, binding of LCFAs to PsrA relieves transcriptional
repression of fadBA, thereby inducing β-oxidation (Kang et al., 2008). This represents a
novel transcriptional regulation of β-oxidation yet to be thoroughly explored. Discovery
of the second and potentially third acyl-CoA dehydrogenase represents a difference in β-
oxidation when compared to E. coli. The reason for expression of two or potentially
three FadE homologues remains unknown and could be the subject of additional
experiments to determine under what conditions these genes are naturally transcribed and
expressed and substrate specificities for each. The ability of MR-1 to degrade and grow
on fatty acids that are 6 and 10 carbons long does not occur in E. coli. In E. coli, β-
oxidation is negatively regulated by the transcriptional regulator FadR, and inhibition is
released only when LCFA-CoAs 12 carbons or longer bind FadR, allowing the
transcription of genes involved in β-oxidation. This leads to the possibility that FadR in
MR-1 is capable of binding shorter chain fatty acyl-CoAs or that additional or different
transcriptional regulators exist in the MR-1 genome for regulating β-oxidation.

15
In order to determine if the double deletion of fadE-1 and fadE-2 causes changes
in fatty acid abundance or profile, cultures of MR-1 and the β-oxidation deficient strain
were subjected to FAME analysis. By esterifying the fatty acids with methanol the fatty
acids present in a culture can be easily identified. The FAME profiles and corresponding
abundance of fatty acids for both strains were compared and determined that there were
no significant changes (figure 2.4a). This was not an unexpected result since fatty acid
synthesis is a tightly regulated pathway controlled by long chain acyl-ACP feedback
inhibition and fatty acids are effectively recycled for use in phospholipid membrane
homeostasis (Zhang and Rock, 2008). Hydrocarbon production was also determined for
the fadE-1,2 mutant expressing S. maltophilia OleA on a multicopy plasmid. As
expected, hydrocarbon production for the MR-1 control strain and the β-oxidation mutant
showed no significant differences as well, since fatty acid precursors remained
unchanged (figure 2.4b).
In this study, the disruption of the β-oxidation pathway in MR-1was successful
for long chain fatty acids (C12, C14, C16 and C18) by disrupting the two fadE
homologues. This effectively eliminates degradation of the longer chain fatty acids
(C12-C18) used as substrates by OleA. No increase in fatty acid or hydrocarbon
production was detected, but as the strain is further engineered to over-produce fatty
acids, the β-oxidation deficiency should be essential.
16
Chapter 3
Identification of optimal fadD gene(s) necessary for substrate formation
Introduction
In order for OleA to condense LCFAs into hydrocarbons, the fatty acid substrates
need to be activated with CoA as discussed in chapter 2. This activation is accomplished
by FadD, an acyl-CoA ligase that ligates CoA onto free fatty acid chains. The FadD
polypeptide has two signature domains: an ATP/AMP binding domain and a LCFA
binding domain. The ATP/AMP binding domain is essential for catalyzing the ligation of
CoA onto the fatty acid chain using the energy from the cleavage of pyrophosphate from
ATP. FadD is an essential gene for bacterial growth on fatty acids. Fatty acid transport
into the cell and activation is reviewed in (Kunau et al., 1995) and briefly described
below. In E. coli, exogenous fatty acids shorter than 12 carbons diffuse through the outer
membrane, but those larger than 12 carbons are transported across the outer membrane by
a fatty acid transport protein FadL. Once fatty acids enter the periplasm, they can flip
and diffuse across the inner membrane into the cytoplasm. The transport of fatty acids
across these membranes is thought to be facilitated by vectorial thioesterification in
which CoA is thioesterified to fatty acids near the cytoplasmic side of the inner
membrane by FadD providing unidirectional transport of fatty acids by trapping LCFA-
CoAs in the cytoplasm. Following activation with CoA, fatty acids can then enter β-
oxidation for degradation or be assimilated into phospholipids.
By overexpressing the acyl-CoA ligase FadD in MR-1, it should be possible to
convert free fatty acid chains being overproduced from fatty acid synthesis to the
corresponding CoA derivatives that can then be condensed by OleA to form hydrocarbon
products. Two methods were employed to determine which fadD gene(s) should be
overexpressed in the hydrocarbon producing strain. First, growth of S. oneidensis fadD
mutant strains in minimal medium with fatty acids as the sole carbon source should
indicate which fadD gene(s) are essential for β-oxidation of exogenous fatty acids.
Secondly, by taking those same fadD mutants and expressing OleA on a multicopy
plasmid, and quantifying hydrocarbon production, it should be apparent which fadD

17
gene(s) are essential for hydrocarbon production. This study explored the fadD genes in
MR-1 and the role played in β-oxidation as well as hydrocarbon production.
Materials and Methods
Reagents
Previously described in Chapter 2.
FadD-1 and FadD-2 expression vector design
Primers used are listed in Table 3.1. The fadD-1 (locus tag SO2581) and fadD-2
(locus tag SO3664) genes were amplified by PCR using an MR-1 colony as template
DNA resulting in a 1.6 kb band for both fadD-1 and fadD-2. Both genes were digested
with BamHI and XhoI restriction enzymes, and the cloning protocol was followed as
previously described in chapter 2.
fadD-1 and fadD-2 deletion construct design
Primers for fadD-1 and fadD-2 deletion constructs are found in table 3.1.
Deletion construct design was completed as previously described in chapter 2.
Primer ID Sequence
PBBRBB_FADD-1_F 57237172 CGGGATCCGTGGATCAGCCTTGGATTAGACATTTACCAAAAGA
TG
PBBRBB_FADD-1_R 52457104 CCGCTCGAGTTACGCACGCTTAACTTCGTCTCTAAGTTCTCG
PBBRBB_FADD-2_F 57237173 CGGGATCCATGGCATACGATCAAGAGTCACAACTCGAAC
PBBRBB_FADD-2_R 52457106 CCGCTCGAGCTAGTTTTTAAGCTCTCTGCGCAAAATTTTACCCA
CG
PBBRBB_OLEA_F 56337226 NNGGATCCATGCTCTTCAAGAATGTCTCGATCGCCGGC
PBBRBB_OLEA_R 52915779 NNNCTCGAGTTACCAGACCACTTCAGCCATCGAGCAGT
PSMV3_FADD-1_UF 49604679 GGGCCCGTTTATCCCAACGCCATTGTAAATACTC
PSMV3_FADD-1_UR 49604680 GAATTCGATTGAAGCCGGCAATAAGCC
PSMV3_FADD-1_DF 49604681 GAATTCTACTTTCTCCTAAATCCCCACAACTG
PSMV3_FADD-1_DR 49604682 GGATCCGGTCGATTATGGGGGACGAAAG
PSMV3_FADD-2_UF 52457107 NNNGGGCCCCGGGGATTGTGTCGATTGC
PSMV3_FADD-2_UR 52457108 NGAATTCGCCTAACTACCTCAAATAGGTTTAGTCG
PSMV3_FADD-2_DF 52457109 NGAATTCGTTTAATAAACCAGACAAACCCCAGAATC
PSMV3_FADD-2_DR 52457110 CGGGATCCGGGCGGCGAACTCTC
K12 PKD13 FADD_F 78153348 TGCGATGACGACGAACACGCATTTTAGAGGTGAAGAAGTGTAG
GCTGGAGCTGCTTC
K12 PKD13 FADD_R 78153349 CGCCGGATTAACCGGCGTCTGACGACTGACTTAACGCATTCCG
18
GGGATCCGTCGACC
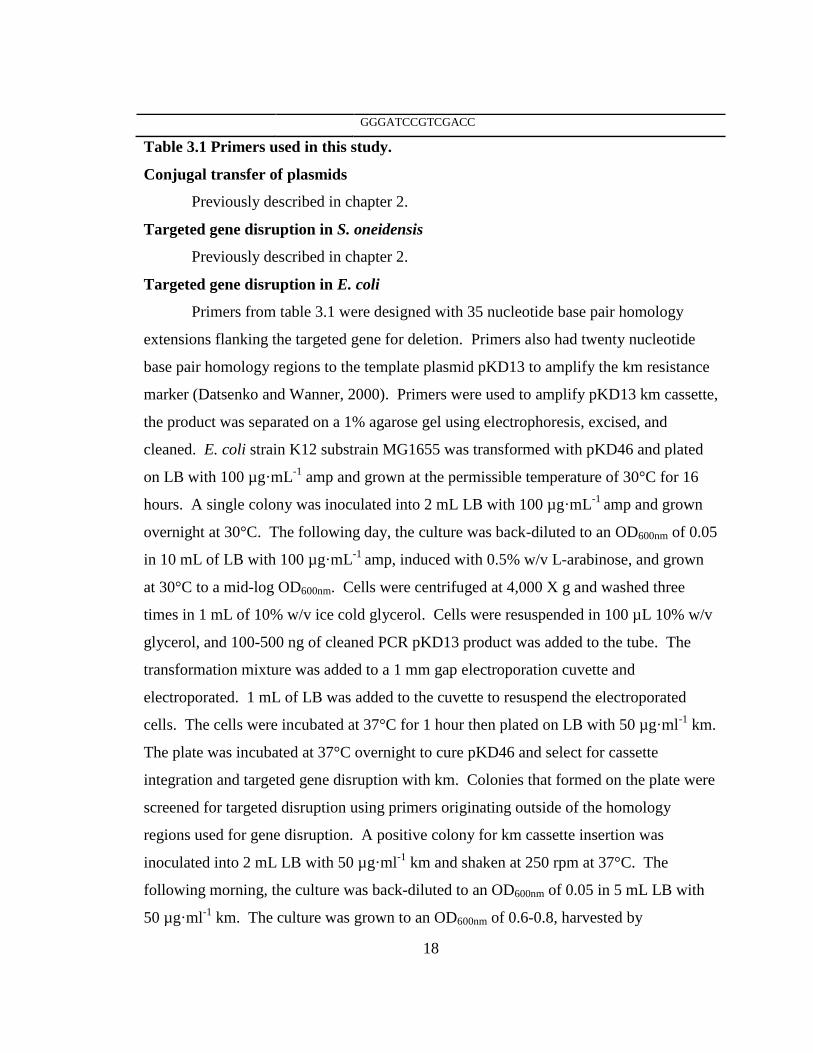
Table 3.1 Primers used in this study.
Conjugal transfer of plasmids
Previously described in chapter 2.
Targeted gene disruption in S. oneidensis
Previously described in chapter 2.
Targeted gene disruption in E. coli
Primers from table 3.1 were designed with 35 nucleotide base pair homology
extensions flanking the targeted gene for deletion. Primers also had twenty nucleotide
base pair homology regions to the template plasmid pKD13 to amplify the km resistance
marker (Datsenko and Wanner, 2000). Primers were used to amplify pKD13 km cassette,
the product was separated on a 1% agarose gel using electrophoresis, excised, and
cleaned. E. coli strain K12 substrain MG1655 was transformed with pKD46 and plated
on LB with 100 µg·mL-1
amp and grown at the permissible temperature of 30°C for 16
hours. A single colony was inoculated into 2 mL LB with 100 µg·mL-1
amp and grown
overnight at 30°C. The following day, the culture was back-diluted to an OD600nm of 0.05
in 10 mL of LB with 100 µg·mL-1
amp, induced with 0.5% w/v L-arabinose, and grown
at 30°C to a mid-log OD600nm. Cells were centrifuged at 4,000 X g and washed three
times in 1 mL of 10% w/v ice cold glycerol. Cells were resuspended in 100 µL 10% w/v
glycerol, and 100-500 ng of cleaned PCR pKD13 product was added to the tube. The
transformation mixture was added to a 1 mm gap electroporation cuvette and
electroporated. 1 mL of LB was added to the cuvette to resuspend the electroporated
cells. The cells were incubated at 37°C for 1 hour then plated on LB with 50 µg·ml-1
km.
The plate was incubated at 37°C overnight to cure pKD46 and select for cassette
integration and targeted gene disruption with km. Colonies that formed on the plate were
screened for targeted disruption using primers originating outside of the homology
regions used for gene disruption. A positive colony for km cassette insertion was
inoculated into 2 mL LB with 50 µg·ml-1
km and shaken at 250 rpm at 37°C. The
following morning, the culture was back-diluted to an OD600nm of 0.05 in 5 mL LB with
50 µg·ml-1
km. The culture was grown to an OD600nm of 0.6-0.8, harvested by
19
centrifuging at 4,000 X g for 10 minutes, and the pellet was resuspended in 100 µL of
transformation and storage solution (TSS) (Chung et al., 1989). Normal heat shock
procedure was used to transform the K12 fadE deletion strain with the Flp recombinase
plasmid pCP20 (Cherepanov and Wackernagel, 1995). The strain was plated on LB with
100 µg·mL-1
amp to select for pCP20 and incubated at the permissive temperature 30°C.
The following day, amp resistant colonies were streaked onto an LB plate and incubated
at 42°C to cure pCP20. Colonies present the following day were streaked onto an LB
plate with 50 µg·ml-1
km and an LB plate with 100 µg·mL-1
amp to ensure loss of the
pKD13 cassette from the chromosome and pCP20 respectively. A final colony PCR step
was used to verify the pKD13 cassette was removed leaving a clean deletion of fadD.
Plasmid Description Reference/Source
pB pBBRBB-eGFP (Vick et al., 2011)
pSMV3 9.5 kb mobilizable suicide vector, oriR6K,
mobRP4, sacB, KmrApr
(Saltikov and Newman, 2003)
pSMV3-fadD-1 S. oneidensis fadD-1 deletion construct This study
pSMV3-fadD-2 S. oneidensis fadD-2 deletion construct This study
pB-fD-1 pBBRBB-fadD-1 This study
pB-fD-2 pBBRBB-fadD-2 This study
pB-o pBBRBB-oleA (Stentrophomonas maltophilia) This study
pKD46 curable arabinose inducible lambda red
recombinase plasmid
(Datsenko and Wanner, 2000)
pKD13 template plasmid for K12 homologous
recombination
(Datsenko and Wanner, 2000)
pCP20 curable yeast Flp recombinase plasmid (Cherepanov and Wackernagel,
1995)
Strains Description Reference/Source
S. oneidensis strain MR-1 Isolated from Lake Oneida, NY (Venkateswaran et al., 1999)
E. coli strain K12
substrain MG1655
Wild type Michael Sadowsky at the University
of Minnesota
E. coli strain UQ950 E. coli DH5α, λ (pir) for cloning (Saltikov and Newman, 2003)
E. coli strain WM3064 DAP auxotroph donor strain for Shewanella
conjugation
(Saltikov and Newman, 2003)
JG1611 S. oneidensis, pB This study
JG2159 S. oneidensis, ∆fadD-1,2 pB-fD-1 This study
JG2161 S. oneidensis, ∆fadD-1,2 pB-fD-2 This study
JG1161 S. oneidensis, ∆fadD-1 This study

20
JG1850 S. oneidensis, ∆fadD-2 This study
JG1851 S. oneidensis, ∆fadD-1,2 This study
JG2258 E. coli K12 ∆fadD This study
JG2297 E. coli K12 ∆fadD pBBRBB-fadD-1 (MR-1) This study
JG2296 E. coli K12 ∆fadD pBBRBB-fadD-2 (MR-1) This study
JG2304 E. coli K12 pB This study
JG1883 S. oneidensis, pB-o This study
JG1851 S. oneidensis, ∆fadD-1,2 pB-o This study
Table 3.2 Plasmids and strains used in this study.
Growth of strains in minimal medium with fatty acid carbon sources
Previously described in Chapter 2.
Chloroform and methanol extraction of nonpolar molecules
Previously described in Chapter 2.
Direct esterification of fatty Acids
Previously described in Chapter 2.
Analysis of hydrocarbons and FAME products by GC-FID-MS
Previously described in Chapter 2.
Results
Utilizing FadD (locus tag b1805) from E. coli K12 MG1655 as the query subject,
2 homologues were identified in S. oneidensis MR-1: FadD-1 (locus tag SO2581, 69%
amino acid identity) and FadD-2 (locus tag SO3664, 48% amino acid identity). Deletion
constructs were designed to disrupt both of the fadD homologues in MR-1. Each fadD
mutant was grown aerobically in minimal media containing saturated fatty acids (C6,
C10, C12, C14, C16, C18) to identify substrate specificity in vivo, followed by
expression of OleA in fadD mutants to assess hydrocarbon production. Strains with fadD
disruptions that make less or no hydrocarbons would be a strong indication that it is
essential for hydrocarbon production.
Analysis of fadD mutants by growth in minimal media supplemented with
different length saturated fatty acid chains (C6, C10, C12, C14, C16, C18) indicated that
FadD-1 and FadD-2 have different fatty acid chain length specificity (figure 3.1).

21
Figure 3.1. Growth analysis of S. oneidensis fadD mutants. Growth on saturated
fatty acids: C6, C10, C12, C14, C16, C18. (●) S. oneidensis, (■) S. oneidensis ∆fadD-
1, (▲) S. oneidensis ∆fadD-2, (▼) S. oneidensis ∆fadD-1,2.
When fadD-1 is disrupted, growth on C6 is possible but at a reduced rate compared to
MR-1, growth on C10 is greatly reduced, C12 and C14 growth is minimally effected, and
C16 and C18 growth is severely reduced (figure 3.1). When fadD-2 is disrupted, growth
on C6 and C10 is greatly reduced compared to MR-1 and growth on C12, C14, C16, and
C18 had near wild type growth rates. When both fadD-1 and fadD-2 are disrupted in the
same strain, growth is abolished, when compared to no carbon controls, on all fatty acids
tested (figure 3.1). When the fadD double mutant is complemented with FadD-1 on a
multicopy plasmid, there is no growth on C6, near wild type growth on C10-C16, and
faster growth on C18 (figure 3.2).
22
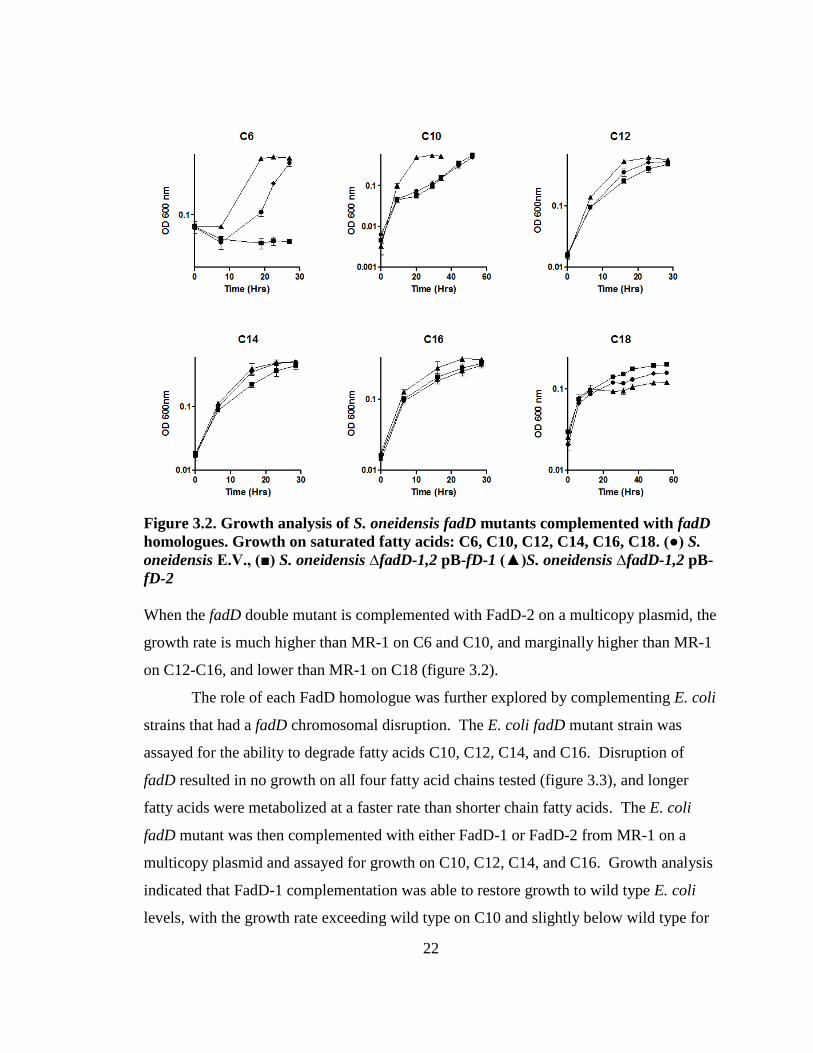
Figure 3.2. Growth analysis of S. oneidensis fadD mutants complemented with fadD
homologues. Growth on saturated fatty acids: C6, C10, C12, C14, C16, C18. (●) S.
oneidensis E.V., (■) S. oneidensis ∆fadD-1,2 pB-fD-1 (▲)S. oneidensis ∆fadD-1,2 pB-
fD-2
When the fadD double mutant is complemented with FadD-2 on a multicopy plasmid, the
growth rate is much higher than MR-1 on C6 and C10, and marginally higher than MR-1
on C12-C16, and lower than MR-1 on C18 (figure 3.2).
The role of each FadD homologue was further explored by complementing E. coli
strains that had a fadD chromosomal disruption. The E. coli fadD mutant strain was
assayed for the ability to degrade fatty acids C10, C12, C14, and C16. Disruption of
fadD resulted in no growth on all four fatty acid chains tested (figure 3.3), and longer
fatty acids were metabolized at a faster rate than shorter chain fatty acids. The E. coli
fadD mutant was then complemented with either FadD-1 or FadD-2 from MR-1 on a
multicopy plasmid and assayed for growth on C10, C12, C14, and C16. Growth analysis
indicated that FadD-1 complementation was able to restore growth to wild type E. coli
levels, with the growth rate exceeding wild type on C10 and slightly below wild type for

23
C12, C14, and C16 (figure 3.4). FadD-2 complementation had a significant lag phase
before growth and there was high variation between replicates for C10, C12, C16 and
never reached cell densities achieved in wild type E. coli or the FadD-1 complemented
strain (figure 3.4). This long lag in growth could be contributed to mutations related to
the fadD-2 gene on the multicopy plasmid since in figure 3.2 the fadD disruption does not
display a similar growth phenotype which would be indicative of a suppressor mutation.
Figure 3.3. Growth analysis of E. coli fadD mutant. Growth on saturated fatty
acids: C10, C12, C14, C16. (●) E. coli WT, (■) E. coli ∆fadD.
To measure the effect of inhibiting β-oxidation on fatty acid profile in the mutant strain,
fatty acids were extracted from S. oneidensis fadD double knockout and wild type MR-
1and methyl esterified. The FAMEs were analyzed by GC-FID-MS, and a fatty acid
profile was generated (figure 3.5a). The profile revealed small increases in fatty acids
24
C13iso, C15iso, C15, in the fadD double knockout when compared to wild type MR-1.
Next, hydrocarbon production was assayed in the fadD double knockout strain
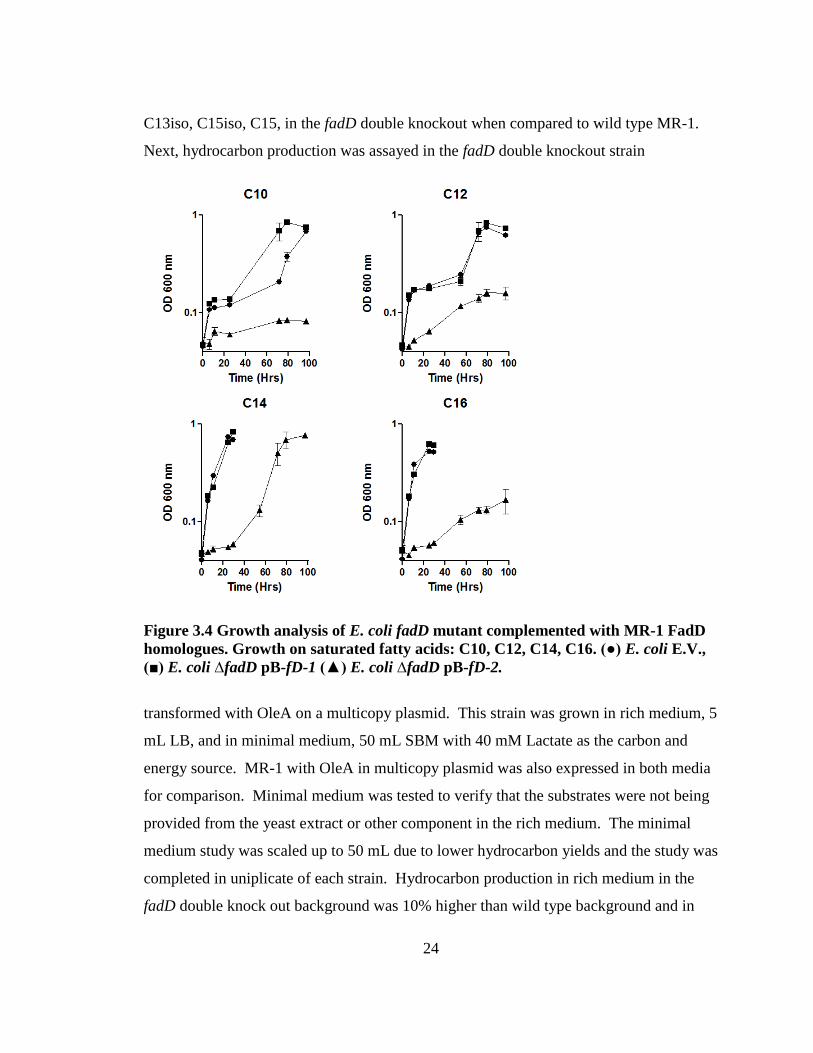
Figure 3.4 Growth analysis of E. coli fadD mutant complemented with MR-1 FadD
homologues. Growth on saturated fatty acids: C10, C12, C14, C16. (●) E. coli E.V.,
(■) E. coli ∆fadD pB-fD-1 (▲) E. coli ∆fadD pB-fD-2.
transformed with OleA on a multicopy plasmid. This strain was grown in rich medium, 5
mL LB, and in minimal medium, 50 mL SBM with 40 mM Lactate as the carbon and
energy source. MR-1 with OleA in multicopy plasmid was also expressed in both media
for comparison. Minimal medium was tested to verify that the substrates were not being
provided from the yeast extract or other component in the rich medium. The minimal
medium study was scaled up to 50 mL due to lower hydrocarbon yields and the study was
completed in uniplicate of each strain. Hydrocarbon production in rich medium in the
fadD double knock out background was 10% higher than wild type background and in

25
minimal medium the fadD double knockout background was 5% lower than wild type
(figure 3.5).
Figure 3.5. FAME profile and hydrocarbon production of fadD double knock out
and MR-1. A) FAME profile is determined as FID abundance as a percent of the
heptadecane standard normalized to gram of protein in culture. B) Hydrocarbon
production in MR-1 and fadD double knockout strains expressing OleA on a
multicopy plasmid. Hydrocarbon quantities reported as FID abundance as a
percent of 12-tricosanone (C23) standard and normalized to total mg protein in the
culture relative to MR-1.
Discussion
Disruption of each fadD homologue and culturing the strains in minimal media
with fatty acids as the sole carbon and energy source provides valuable information as to
the substrate specificity of fadD homologues in vivo. If long chain acyl-CoA ligase
activity is successfully disrupted, this should result in a S. oneidensis strain incapable of
utilizing fatty acids as a carbon and energy source, and this strain should also be unable
to produce hydrocarbons since the LCFA-CoAs are not synthesized. Growth analysis of
S. oneidensis fadD mutants in SBM with fatty acids indicates that in vivo, each
homologue has different but overlapping substrate specificity for varying fatty acid chain
lengths. Disruption of both homologues results in inability to utilize C6, C10, C12, C14,
C16, and C18 fatty acids. When fadD-1 is disrupted, the growth rate on C6 is slightly
reduced compared to wild type and greatly reduced when fadD-2 is disrupted. This

26
suggests that FadD-2 is better able to utilize C6 as a substrate in vivo. Growth on C10 is
greatly impaired for both homologues, but some reduced growth still occurs when fadD-2
is disrupted compared to wild type and no growth is present when fadD-1 is disrupted. If
either fadD-1 or fadD-2 is disrupted individually when grown on C12 or C14 fatty acids,
either homologue is capable of maintaining near wild type growth rates suggesting
similar substrate specificities. Growth on C16 and C18 is severely limited when fadD-1
is disrupted and near wild type when fadD-2 is disrupted. Results from these
experiments show that FadD-1 is responsible for CoA thioesterification of longer chain
fatty acids (C16 and C18). It appears that FadD-2 is responsible for CoA
thioesterification of short chain fatty acids (C6).
To further explore the role of the FadD homologues in β-oxidation, the fadD
double knockout strain was complemented with either FadD homologue and assayed for
the ability to degrade fatty acids as done previously. These experiments should provide
more insight into substrate specificity for each homologue since they are being
constitutively expressed from the same promoter from the same plasmid. FadD-1 was
able to restore growth on all fatty acids tested except for C6, in which it did not grow at
all, agreeing with the results obtained from growth of the fadD-1 disruption strain on C6.
Surprisingly, FadD-2 complementation increased the growth rate above wild type levels
for the shorter chain fatty acids C6 and C10 and restored to wild type levels for C12,
C14, and C16 but was unable to fully complement growth on C18. The high growth rate
of the FadD-2 complementation on C6 and C10 suggests that this step is rate limiting in
the β-oxidation pathway and overexpressing FadD-2 eliminates the rate limiting step,
allowing for faster growth rates. Under normal conditions, it is possible the fadD-2 gene
may be regulated by transcriptional repressor that binds shorter chain fatty acids less
efficiently and when fadD-2 is expressed from a constitutive promoter on a multicopy
plasmid, this is alleviated. For comparison, it is well established in E. coli that β-
oxidation is negatively regulated by FadR, and the longer the acyl-CoA chain, the
stronger the binding to FadR (DiRusso et al., 1992).
To further explore the role of FadD-1 and FadD-2, the multicopy plasmids with
each gene were used to transform the E. coli fadD mutant strain that is deficient in β-

27
oxidation. This phenotype was confirmed by culturing the strain in minimal media with
fatty acids as the sole carbon and energy source as previously described.
Complementation of FadD-1 and FadD-2 was assayed by culturing the strains as
previously described using C10, C12, C14, and C16 fatty acids. Results from growth of
each fadD homologue showed strikingly different results when expressed in E. coli fadD
knockout versus expression in S. oneidensis fadD double knockout. Expression of FadD-
1 resulted in near wild type growth rates on C12, C14, and C16 and on C10 grew faster
than wild type. Expression of FadD-2 was unable to complement the E. coli fadD
disruption like it had in the S. oneidensis fadD double knock out.
By disrupting both fadD homologues in S. oneidensis, a strain is generated that is
deficient in β-oxidation on medium and long chain fatty acids that are 6-18 carbons long.
This strain is unable to activate the fatty acids with CoA and cannot be targeted for β-
oxidation. Based on these results, it was expected that this strain would also be unable to
produce hydrocarbons when OleA from S. maltophilia was heterologously expressed in
the fadD double mutant, since long chain acyl-CoAs have been shown to be substrates for
an OleA homologue from X. campestris using in vitro assays. Surprisingly, expression of
OleA in the fadD double mutant in rich and minimal media resulted in essentially no
change in hydrocarbon production. One conclusion that can be drawn from this result is
that the acyl chains present in the hydrocarbon products are from the condensation of a
different substrate than acyl-CoAs. The most likely alternative substrates are activated
acyl chains in a thioester linkage to ACP, the product of fatty acid synthesis. Fatty acids
can be found esterified to other compounds in the cell, especially in membrane lipids, but
these are not considered activated forms. Time courses of hydrocarbon production in
MR-1 show that hydrocarbon production is maximal in late stationary phase (Sukovich
and Wackett, personal communication). One possibility is that cultures that are in late
stationary phase are undergoing lipid remodeling, and OleA condenses fatty acid
derivatives involved in that remodeling. Stationary phase lipid remodeling is not a novel
mechanism; it has been shown in E. coli that once cultures enter stationary phase, the
cells modify lipids by converting unsaturated fatty acid lipid tails to cyclopropane groups

28
(Chang and Cronan, 1999). The reason for this modification is not fully understood, but
strains that are deficient in this activity have low acid tolerance.
From this study, we better understand the role of the FadD homologues and the
role played in β-oxidation, but questions have been raised about the substrate for OleA
necessary for hydrocarbon production.

29
Chapter 4
Increasing the production of precursors and hydrocarbons
Introduction
Fatty acid synthesis can be carried out by two methods: type I is generally used by
eukaryotes, and a single polypeptide codes for all enzymatic steps; type II is generally
used by bacteria and individual polypeptides catalyze each step. MR-1 utilizes type II
fatty acid synthesis for fatty acid production. Type II fatty acid synthesis in E. coli is
reviewed in (White et al., 2005) and briefly described here. Fatty acid synthesis is
initiated with the formation of malonyl-CoA from acetyl-CoA and CO2, which is
catalyzed by the enzyme acetyl-CoA carboxylase (Acc). This ATP dependent reaction
has been shown to be a key rate-limiting step (Davis et al., 2000) and is the first
committed step in fatty acid synthesis and is required for all chain elongation steps.
FabD, a malonyl-CoA:ACP transacylase, converts malonyl-CoA to malonyl-ACP. Fatty
acid synthesis is initated by β-ketoacyl-ACP synthase III (FabH), which condenses
malonyl-ACP and acetyl-CoA to form acetoacetyl-ACP. Malonyl-ACP is then used to
elongate the chain for each subsequent fatty acid cycle. Either FabB or FabF, which are
3-ketoacyl-ACP synthases, condense malonyl-ACP with the acyl-ACP chain, thereby
elongating the fatty acid chain. After the acyl-ACP chain is condensed with malonyl-
ACP, a series of reduction reactions occur. FabG, a 3-ketoacyl-ACP reductase, reduces
the 3-ketoacyl-ACP chain while oxidizing NADPH. FabZ, a 3-hydroxyacyl-ACP
hydratase, then dehydrates the 3-hydroxyacyl-ACP to enoyl-ACP. FabI, an enoylacyl-
ACP reductase, reduces the enoyl-ACP while oxidizing NADH to form acyl-ACP, which
can then be used again for the elongation cycle. Once the acyl-ACP chain reaches an
appropriate length, it is then transferred to glycerol-3-phosphate by an acyl-transferase
for membrane phospholipid synthesis.
Fatty acid synthesis is an energy intensive pathway, and for that reason, it is also
tightly regulated. Long chain acyl-ACPs (LCFA-ACPs) (C12-C16), the product of fatty
acid synthesis, have an inhibitory effect on several steps in fatty acid synthesis. LCFA-
ACPs exhibit allosteric inhibition on Acc (Davis and Cronan, 2001), FabH (Heath and
Rock, 1996b), and FabI (Heath and Rock, 1996a) effectively blocking precursor
30
formation, fatty acid chain initiation, and chain elongation, respectively. Inhibition of
these 3 enzymes effectively regulates fatty acid synthesis.
A periplasmic thioesterase isolated from Escherichia coli strain K12 substrain
MG1655 identified as thioesterase I (TesA) is an enzyme that cleaves the activated ACP
and CoA groups esterified to LCFA (Cho and Cronan, 1993). A modified TesA, ‘TesA,
with the N-terminal periplasmic leader sequence removed, results in cytoplasmic
localization. Overexpression of ‘TesA effectively catalyzes the removal of ACP from
LCFA-ACPs yielding free fatty acids and eliminating feedback inhibition in E. coli (Cho
and Cronan, 1995).
In order to effectively increase fatty acid synthesis, two engineering strategies will
be employed. First, due to the stringent regulation of fatty acid synthesis, expression of a
thioesterase, ‘TesA that cleaves long chain acyl-ACPs will be expressed on a multicopy
plasmid deregulating key fatty acid synthesis reactions. Expression of ‘TesA will
successfully deregulate fatty acid synthesis, allowing overproduction of free fatty acids.
Deregulation of fatty acid synthesis using ‘TesA has been demonstrated in E. coli (Cho
and Cronan, 1995) and in the cyanobacteria Synechocystis sp. PCC6803 (Liu et al.,
2011). Second, to increase the flux of acetyl-CoA from central metabolism, the rate
limiting step of malonyl-CoA formation catalyzed by Acc will be overexpressed on a
multi-copy plasmid. Prior work in E. coli has shown that increasing expression of Acc
increases fatty acid production in E. coli (Davis et al., 2000). Since expression of ‘TesA
and Acc results in the accumulation of free fatty acids, it is necessary to express an acyl-
CoA ligase (FadD) to reactivate the fatty acids, followed by condensation by OleA to
make hydrocarbons. This study explores first the deregulation of fatty acid synthesis by
‘TesA in S. oneidensis but also as a proof of concept, in E. coli. Secondly, hydrocarbon
production is explored in both S. oneidensis and E. coli strains engineered to overproduce
them.
Materials and Methods
Reagents
Previously described in Chapter 2.
BioBrick™ expression system

31
For construction of the hydrocarbon synthesis pathway in MR-1, a plasmid that
can express multiple genes, each under control of individual constitutive promoters, is
desired. For this reason, the pBBRBB-eGFP BioBrick™ plasmid was selected. Salient
features of this plasmid are a mutated operator region of the lac promoter allowing
constitutive expression of genes, BioBrick™ ability to easily add promoter and gene
“bricks” to constructs, proper mobilization genes and sequence elements to allow for
conjugal transfer of the plasmid to host, and an optimized high affinity ribosomal binding
site for each gene (Vick et al., 2011).
Bacterial culturing and growth
Strains and plasmids used in this study are listed below in Table 4.1. Single
colonies of S. oneidensis were used to inoculate liquid LB medium and cultivated
overnight at 30°C with shaking at 250 rpm. The following day, cultures were back-
diluted to an OD600nm 0.05 and cultivated for the required amount of time depending on
the experiment at 30°C with shaking at 250 rpm. E. coli was cultured as described above
except at a temperature of 37°C.
Primer ID Sequence
PBBRBB_TESA_F 55781876 NNNAGATCTATGGCGGACACGTTATTGATTCTGGG
PBBRBB_TESA_R 55781877 TTTTTCCTTTTGCGGCCGCTTATGAGTCATGATTTACTAAAGGCT
GCAACT
PBBRBB_ACCADC_F 51150622 CGGGATCCTTTTCAGAGGCTAAAGCAGAGGATCTTTTGATGACC
AGC
PBBRBB_ACCADC_R 51150623 TTTTCCTTTTGCGGCCGCTTAATCTTCAACTGGCGATACGACGAA
GAGTAAGTCACCTTG
PBBRBB_ACCB_F 57237175 CGGGATCCATGGCCGTTGACCTGCGGAAAATTAAAAAACTG
PBBRBB_ACCB_R 51150625 CATGCCATGGTTAAGAAATCTCGATTAACGTAAATAGGGGTTGG
TCAAAGGCG
K12 PKD13 FADE_F 78153350 AGTGGTCAGACCTCCTACAAGTAAGGGGCTTTTCGTTGTGTAGG
CTGGAGCTGCTTC
K12 PKD13 FADE_R 78153351 GGATAAAGAAACGGAGCCTTTCGGCTCCGTTATTCATATTCCGG
GGATCCGTCGACC
Table 4.1 Primers used in this study.
Plasmid Description Reference/Source
pB-t pBBRBB-'tesA (cloned from K12) This study

32
pB-t,a pBBRBB-’tesA, accADC, accB This study
pB-t,o,a pBBRBB-'tesA, oleA, accADC, accB This study
pB-t,o,a,fD-2 pBBRBB-'tesA, oleA, accADC, accB, fadD-2 This study
pKD46 curable arabinose inducible lambda red
recombinase plasmid
(Datsenko and Wanner, 2000)
pKD13 template plasmid for K12 homologous
recombination
(Datsenko and Wanner, 2000)
pCP20 curable yeast Flp recombinase plasmid (Cherepanov and Wackernagel, 1995)
Strains Description Reference/Source
S. oneidensis strain MR-1 Isolated from Lake Oneida, NY (Venkateswaran et al., 1999)
E. coli strain K12 substrain
MG1655
Wild type Michael Sadowsky at the University
of Minnesota
E. coli strain UQ950 E. coli DH5α, λ (pir) for cloning (Saltikov and Newman, 2003)
E. coli strain WM3064 DAP auxotroph donor strain for Shewanella
conjugation
(Saltikov and Newman, 2003)
JG1611 S. oneidensis, pB This study
JG1946 S. oneidensis, ∆fadE-1,2 pB This study
JG1892 S. oneidensis, ∆fadE-1,2 pB-o This study
JG1950 S. oneidensis, ∆fadE-1,2 pB-t This study
JG1988 S. oneidensis, ∆fadE-1,2 pB-t,o This study
JG2082 S. oneidensis, ∆fadE-1,2 pB-t,o,a This study
JG2332 S. oneidensis, ∆fadE-1,2 pB-t,o,a,fD-2 This study
JG2304 E. coli K12 pB This study
JG2306 E. coli K12 ∆fadE This study
JG2307 E. coli K12 ∆fadE pB-o This study
JG2308 E. coli K12 ∆fadEpB-t,o This study
JG2314 E. coli K12 ∆fadE pB-t This study
JG2328 E. coli K12 ∆fadE pB-t,a This study
JG2344 E. coli K12 pB-t This study
JG2310 E. coli K12 ∆fadE pB-t,o,a This study
JG2327 E. coli K12 ∆fadE pB-t,o,a, fD-2 This study
Table 4.2 Plasmids and strains used in this study.
Acc expression vector design
Primers used are listed in Table 4.2. Acc subunits AccA (locus tag b0185), AccB
(locus tag b3255), AccC (locus tag b3256), AccD (locus tag b2316) from E. coli strain
K12 substrain MG1655 were used as a query subjects for NCBI protein blast. The Acc
homologue in the MR-1 genome was identified as two gene products, one being a 4.5 kb

33
gene representing subunits AccA, AccD, and AccC (locus tag SO0840), and the second
being a 0.5 kb gene representing subunit AccB (locus tag SO0511). An MR-1 colony
was used as the template for PCR amplification of accADC and accB. BamHI and NotI
were used to digest the accADC PCR product, and BamHI and NcoI were used to digest
the accB PCR product. Techniques for cloning were described previously in chapter 2.
‘TesA expression vector design
An E. coli strain K12 substrain MG1655 colony was used as a PCR template to
amplify ‘tesA (locus tag b0494). Primers were designed to amplify the ‘tesA gene
excluding the nucleotides coding for the N-terminal 26 amino acid leader sequence for
localization to the periplasm. The forward primer contained a BglII restriction site,
followed by atg to introduce a new start codon and the homologous nucleotide sequence
for priming starting at amino acid 27. The ‘tesA PCR product was digested with BglII
and NotI restriction enzymes and cloned as described previously in chapter 2.
Conjugal transfer of plasmids
Previously described in chapter 2.
Targeted gene disruption in E. coli
Primers for disrupting fadE in E. coli are listed in 4.1. Targeted disruption in E.
coli was described previously in chapter 3.
‘TesA activity assay
Single colonies of each strain were inoculated into 2 mL LB supplemented with
50 µg·mL-1
km. Cultures were incubated at 30°C with shaking at 250 rpm overnight.
Cultures were back-diluted to an OD600nm of approximately 0.05 in 5 mL of LB and 50
µg·mL-1
km. Cultures were incubated at 30°C with shaking at 250 rpm until late log
phase (OD600nm 0.6 to 0.9). 50 µL of culture was collected for BCA total protein
analysis. The remaining culture was pelleted at 4,000 X g for 15 minutes at 4°C. The
supernatant was decanted, and the pellet was resuspended in 1 mL of ice cold lysis buffer
(20 mM phosphate buffer pH 7.4, 0.5 M NaCl, EDTA-free protease inhibitor from Roche
Applied Science). Cells were lysed by sonication using the Branson Digital Sonifier, 20
cycles of 1 second pulse and 3 seconds rest at 30% amplitude. Cultures were centrifuged
at 14,000 X g for 10 minutes at 4°C, and the soluble fraction was transferred to a clean

34
1.5-mL microcentrifuge tube. Per reaction volume of 100 µL in a 96 well plate: 1 mM
DTNB, 20 mM phosphate buffer pH 7.4, 40 µM acyl-CoA substrate, and 5 µl of soluble
cell extract. The above reagents were added to the 96-well plate, and the absorbance at
412 nm was measured every 20 seconds to determine the V0 of thioesterases on different
acyl-CoA substrates (C10, C12, C14, C16).
Growth of strains in minimal medium with fatty acid carbon sources
Previously described in Chapter 2.
Chloroform/methanol extraction of nonpolar molecules
Previously described in Chapter 2.
Extraction of fatty acids from culture medium
This method is adapted from (Lalman and Bagley, 2004). After 48 hours of
growth, 50 µL of culture was removed for protein quantification for normalization. 3 mL
of culture was poured into an FEP tube. 6 mL of 1:1 v/v 95% hexane and MTBE was
added to the empty culture tube and vortexed, and then poured into the FEP tube. 510 µL
of 5 M NaCl was added to the tube, followed by 240 µL of 50% w/v H2SO4. The tube
was vigorously mixed by hand for two minutes and centrifuged for 2 minutes at 2,000
rpm to facilitate phase separation. The upper hexane layer was then removed with a glass
pipette and dispensed into a twice chloroform rinsed vial. The direct FAME protocol
then could be carried out to methyl esterify fatty acids.
Direct esterification of fatty acids
Previously described in Chapter 2.
Analysis of hydrocarbons and FAME products by GC-FID-MS
Previously described in Chapter 2.
Results
Attempts to clone a mutation-free ‘tesA gene into expression vectors were not
successful. Multiple clones were isolated and sequenced, revealing deletion and
substitution mutations in different regions of the sequence in every construct assembled
(table 4.3).

35
tesA mutants
Mutant ID Description of Mutation Amino Acid Change
1 287 bp T-->C, 349 bp C-->T 96 V-->A, 117 R-->C
2 226 bp G-->A, 497 bp T-->A 76 G-->S, 166 F-->Y
3 278 bp T deletion NA
4 209 bp A-->G 70 E-->G
5 180 bp A-->G, 224 bp A-->G, 233 bp G-->A
75 D-->G, 78 R-->H
6 500 bp T-->A 167 I-->N
Table 4.3. Various ‘tesA mutations identified from cloning in E. coli UQ50. Both the
nucleotide base mutation is identified and the corresponding amino acid change.
The persistence of mutations at random locations within the ‘tesA sequence suggests that
expression of ‘TesA is toxic to the cell and strong selective pressures resulted in cloning
of mutated, less toxic forms of ‘tesA. An unmutated‘tesA gene was successfully cloned
into an expressionless vector. Efforts to restriction digest this unmutated ‘tesA out of the
expressionless vector and clone it into a vector with expression tightly regulated by the
araBAD promoter resulted in no colonies with the ‘tesA insert most likely due to toxicity
of the gene product. Surprisingly, previously published research accomplished this by
expressed ‘TesA from a multicopy plasmid utilizing an arabinose inducible system to
reduce potential toxicity in cultures in lag and early growth phase (Cho and Cronan,
1995). Upon ‘tesA induction, they showed that these cultures exhibited no adverse
growth defects. The collected‘tesA mutants were tested to identify the most ideal ‘tesA
mutant for overproduction of fatty acids.

36
Figure 4.1 Analysis of ‘TesA expression in S. oneidensis fadE double knockout. A)
Growth of strain expressing ‘TesA. B) Cell lysate thioesterase activity assay using 40
µM C10, C12, C14, C16 CoA substrates normalized to mg of protein. C) FAME
profile of strain expressing ‘TesA reported as FID abundance as a percent of the
methyl decanoate (C10) standard per gram of protein.
These mutants were assayed for growth defects, which would suggest phospholipid
biosynthesis competition and acyl-CoA thioesterase activity. Cellular stress is an
indication that ‘TesA expression causes substrate competition for acyl-ACPs which are
required for phospholipid synthesis. Based on growth experiments in rich medium, TesA
1 had the most extreme phenotype, highlighted by flocculating cells and a long lag before
entering growth phase relative to the other ‘tesA mutants and for all the following
experiments this mutant was used (figure 4.1a). To assay the activity of ‘TesA, a simple
colorimetric thioesterase activity assay using DTNB was employed. This assay takes

37
advantage of the release of CoA from acyl-chains, resulting in free CoASH in the
reaction. The sulfur group of the free CoASH readily reacts with and cleaves the
disulfide bond of DTNB, forming CoA-NTB product and a NTB2-
product that absorbs at
412 nm. As more CoA is released, the increase in absorbance at 412 nm can be measured
to determine the initial velocity and specificity of thioesterases for different length acyl-
CoA substrates. Ideally, the ‘TesA thioesterase activity of interest is on acyl-ACP
substrates to deregulate fatty acid synthesis. Using the DTNB assay for acyl-ACPs
would require purification of native MR-1 ACP and conjugation to acyl-chains before
assaying, making the use of acyl-ACP as substrates expensive and time consuming.
Acyl-CoAs are instead used as an approximation to acyl-ACP thioesterase activity.
‘TesA was assayed for activity against decanoyl (C10), dodecanoyl (C12), tetradecanoyl
(C14), and hexadecanoyl-CoA (C16).

38
Figure 4.2. Growth analysis of E. coli fadE mutant. Growth on saturated fatty
acids: C10, C12, C14, C16. (●) E. coli WT, (■) E. coli ∆fadE.
Previously published literature indicates that ‘TesA has the highest specificity for
hexadecanoyl-CoA (Cho and Cronan, 1995). DTNB-based thioesterase activity assays
indicate that ‘TesA has the highest specificity for hexadecanoyl-CoA, followed by
tetradecanoyl-CoA, dodecanoyl-CoA, and decanoyl-CoA (figure 4.1b). From these
criteria, ‘tesA mutant 1 was selected due to the distinct growth phenotype (figure 4.1a)
and high acyl-CoA thioesterase activity (figure 4.1b) compared to the other ‘tesA
mutants. This strain was then assayed for fatty acid production by extraction from
cultures and subsequent fatty acid methyl esterification of the extract (figure 4.1c). The
resulting fatty acid profile provided evidence that ‘tesA, when expressed in the S.
oneidensis fadE double knockout, produced fewer fatty acids overall. E. coli was
transformed with the ‘TesA expression vector to determine if the mutant ‘tesA still can
deregulate fatty acid synthesis or if it has lost this activity as a result of the mutations. In
order to carry out this experiment, an E. coli strain deficient in β-oxidation was generated
by disrupting fadE and confirmed by culturing the E. coli fadE mutant in SBM with
saturated fatty acids C10, C12, C14, C16 (figure 4.2).
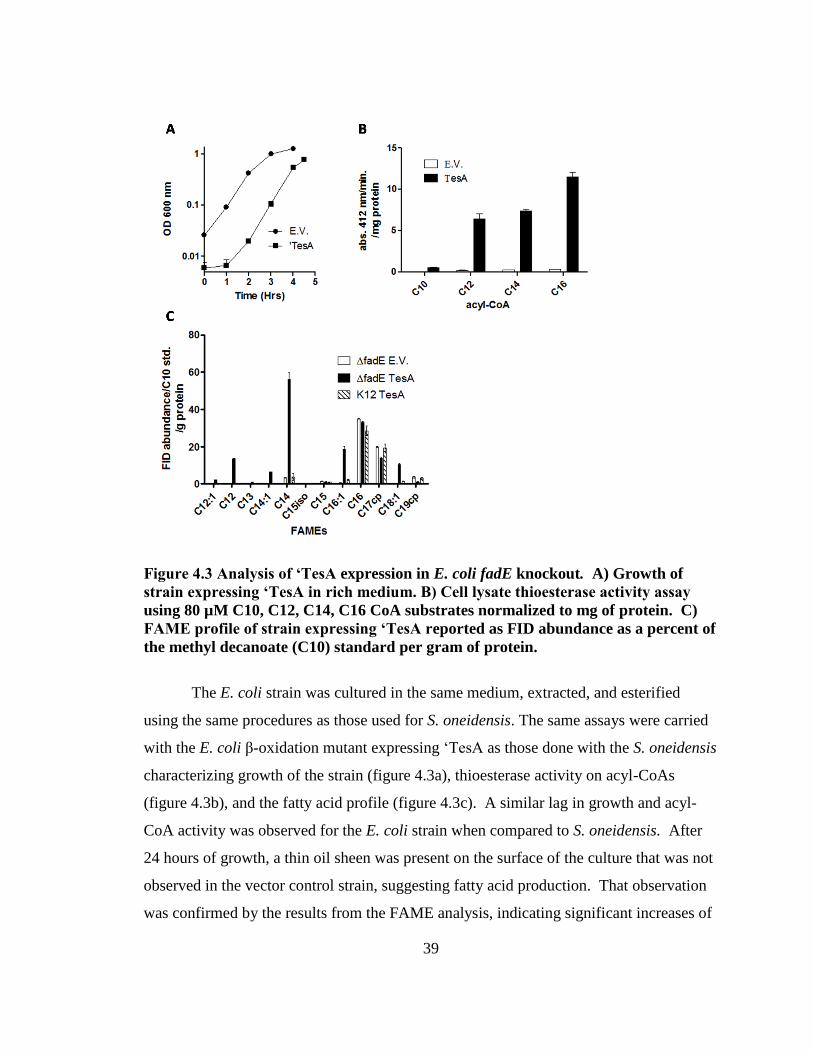
39
Figure 4.3 Analysis of ‘TesA expression in E. coli fadE knockout. A) Growth of
strain expressing ‘TesA in rich medium. B) Cell lysate thioesterase activity assay
using 80 µM C10, C12, C14, C16 CoA substrates normalized to mg of protein. C)
FAME profile of strain expressing ‘TesA reported as FID abundance as a percent of
the methyl decanoate (C10) standard per gram of protein.
The E. coli strain was cultured in the same medium, extracted, and esterified
using the same procedures as those used for S. oneidensis. The same assays were carried
with the E. coli β-oxidation mutant expressing ‘TesA as those done with the S. oneidensis
characterizing growth of the strain (figure 4.3a), thioesterase activity on acyl-CoAs
(figure 4.3b), and the fatty acid profile (figure 4.3c). A similar lag in growth and acyl-
CoA activity was observed for the E. coli strain when compared to S. oneidensis. After
24 hours of growth, a thin oil sheen was present on the surface of the culture that was not
observed in the vector control strain, suggesting fatty acid production. That observation
was confirmed by the results from the FAME analysis, indicating significant increases of

40
fatty acids C12, C14, and C16 not observed in the S. oneidensis strain expressing ‘TesA.
Furthermore, fatty acid production overall was increased approximately 2.5- fold and 15
to70- fold for some individual fatty acids (table 4.4). Additionally, overexpression of
‘TesA in an E. coli strain that has a functional β-oxidation pathway results in a similar
fatty acid profile as the β-oxidation mutant control strain (figure 4.3c). To verify the lack
of fatty acid production observed in S. oneidensis was not due to a mutation in ‘tesA, the
‘TesA expression vectors were isolated from both the E. coli and S. oneidensis strains,
sequenced, and transformed into the corresponding strain and tested. No additional
mutations were identified in either ‘TesA expression vector and the S. oneidensis strain
transformed with the ’TesA expression vector purified from the E. coli β-oxidation
mutant resulted in the same FAME profile and the E. coli strain transformed with the
‘TesA expression vector from S. oneidensis still overproduced fatty acids (data not
shown).
Figure 4.4. Comparison of fatty acids secreted into the medium from S. oneidensis
and E. coli β-oxidation mutants expressing TesA. Results are reported as FID
abundance as a percent of the methyl decanoate (C10) standard per gram of
protein.
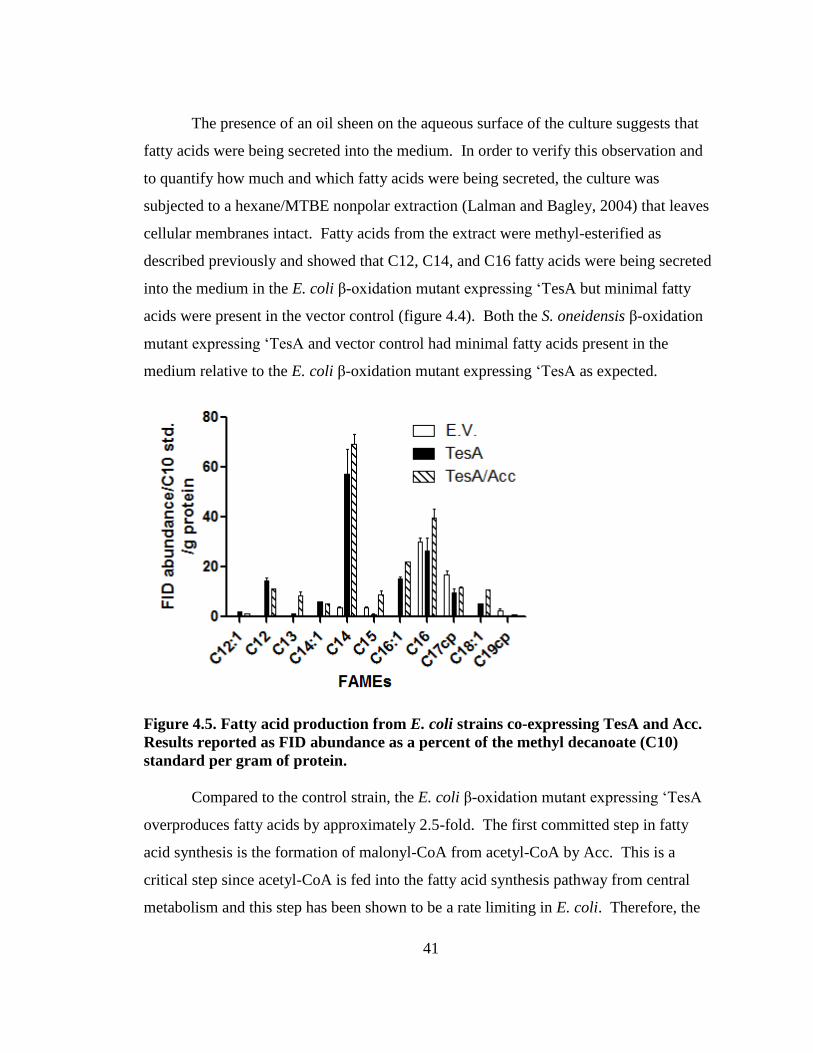
41
The presence of an oil sheen on the aqueous surface of the culture suggests that
fatty acids were being secreted into the medium. In order to verify this observation and
to quantify how much and which fatty acids were being secreted, the culture was
subjected to a hexane/MTBE nonpolar extraction (Lalman and Bagley, 2004) that leaves
cellular membranes intact. Fatty acids from the extract were methyl-esterified as
described previously and showed that C12, C14, and C16 fatty acids were being secreted
into the medium in the E. coli β-oxidation mutant expressing ‘TesA but minimal fatty
acids were present in the vector control (figure 4.4). Both the S. oneidensis β-oxidation
mutant expressing ‘TesA and vector control had minimal fatty acids present in the
medium relative to the E. coli β-oxidation mutant expressing ‘TesA as expected.
Figure 4.5. Fatty acid production from E. coli strains co-expressing TesA and Acc.
Results reported as FID abundance as a percent of the methyl decanoate (C10)
standard per gram of protein.
Compared to the control strain, the E. coli β-oxidation mutant expressing ‘TesA
overproduces fatty acids by approximately 2.5-fold. The first committed step in fatty
acid synthesis is the formation of malonyl-CoA from acetyl-CoA by Acc. This is a
critical step since acetyl-CoA is fed into the fatty acid synthesis pathway from central
metabolism and this step has been shown to be a rate limiting in E. coli. Therefore, the

42
acc genes from S. oneidensis were cloned and added to the BioBrick™ vector already
containing ‘tesA to see if this would increase fatty acid production by funneling more
precursors into the fatty acid synthesis pathway. The fatty acid profile of the ‘TesA and
Acc co-expression vector was determined and compared to the ‘TesA expression vector
in the E. coli β-oxidation mutant background and showed that co-expression of ‘TesA
with Acc resulted in a 3.3-fold increase in fatty acid production over the control strain
(figure 4.5 and table 4.4). Interestingly, the C13 and C15 fatty acids were the most
significant increases compared to the ‘TesA expression strain.
Hydrocarbon production was next assayed by cloning oleA into the BioBrick™
vectors in different combinations with other genes targeted for increasing hydrocarbon
production. The following constructs were then used to transform the S. oneidensis β-
oxidation mutant and were assayed for hydrocarbon production: pB-o, pB-t,o, pB-t,o,a,
pB-t,o,a,fD-2. These results showed that hydrocarbon production was unchanged by
expression of any of the above genes targeted to increase hydrocarbon production (figure
4.6). These same constructs were then used to transform the E. coli β-oxidation mutant
strain in hopes that since ‘TesA deregulated fatty acid synthesis in E. coli that these
targeted genes would increase hydrocarbons in this strain. Results indicated that they did
not, and that expression of additional genes caused a decrease in hydrocarbon production
(figure 4.6). The observation was also made that E. coli and S. oneidensis strains
expressing OleA make approximately the same amount of total hydrocarbons, but E. coli
hydrocarbons consist of fewer hydrocarbon species when compared to S. oneidensis (data
not shown).
Plasmid E.V. TesA TesA, Acc
Fatty Acids Average std. dev. Average std. dev. fold inc./E.V. Average std. dev. fold inc./E.V.
C12:1 0.00 0.00 2.00 0.02 NC 1.22 0.13 NC
C12 0.21 0.05 14.28 2.21 68.23 11.23 0.26 53.67
C13 0.00 0.00 1.29 0.24 NC 8.55 1.99 NC
C14:1 0.18 0.03 5.88 0.29 33.12 5.26 0.24 29.59
C14 3.79 0.20 57.44 13.70 15.15 69.32 5.41 18.28
C15 3.60 0.38 0.99 0.37 0.28 9.02 2.02 2.50
C16:1 0.25 0.10 15.13 1.61 59.81 22.26 0.13 87.62
C16 30.18 2.26 26.54 7.44 0.88 39.86 4.96 1.32

43
C17cp 16.89 2.33 9.59 2.29 0.57 11.47 0.94 0.68
C18:1 0.00 0.00 5.10 0.51 NC 10.76 0.37 NC
C19cp 2.37 1.03 0.00 0.00 0.00 0.77 0.09 0.33
Total FA 57.47 138.24 189.62
Total FA fold
inc/E.V. 1.00 2.41 3.30
Table 4.4. Fatty acid (FA) quantities represented as FID abundance as a percent of
the methyl decanoate (C10) standard per gram of protein. Background strain used
for all experiments was the E. coli fadE mutant. NC=not calculable. Colon and
subsequent number indicate the number of double bonds in fatty acid, cp indicates
cyclopropane group within the fatty acid.
Figure 4.6. Hydrocarbon production in S. oneidensis and E. coli fadE mutants
deficient in β-oxidation of LCFAs. Hydrocarbon production is reported as a
percent of the 12-tricosanone (C23) standard per mg of protein with results
displayed as values relative to pB-o for each strain.
Discussion
Results from the extraction and methyl esterification show that the fatty acid
profile has decreased levels of fatty acids in the strain expressing ‘TesA when compared
to the vector control in S. oneidensis. This result was unexpected when considering the
results obtained from expression of ‘TesA in an E. coli fadE knockout resulting in a
significant increase in fatty acids (2.5-3 fold) (Cho and Cronan, 1995). Cho and Cronan
observed no growth defects upon induction of the arabinose inducible pBAD22 vector

44
expressing 'tesA and there is no mention of mutations within the gene. In order to
determine if the mutation in the gene of ‘tesA rendered it unable to cleave acyl-ACPs and
thereby deregulate fatty acid synthesis, ‘TesA was used to transform an E. coli strain
deficient in β-oxidation by deletion of fadE. FAME analysis indicated approximately a
2.5-fold increase in the amount of fatty acids being produced relative to the control strain
for the mutated ‘tesA. Fatty acid overproduction in the E. coli β-oxidation mutant
expressing ‘TesA confirms that the mutation in ‘tesA is not responsible for the lack of
fatty acid accumulation in S. oneidensis, and in fact, produces nearly the same amount of
fatty acids as compared to published results by Cho and Cronan using the arabinose
inducible pBAD22 expressing the 'tesA. Furthermore, isolation of the plasmid from
both the S. oneidensis and E. coli strains showed the nucleotide sequence for ‘tesA to be
identical. Thioesterase assays using the cell lysate of the S. oneidensis and E. coli strains
expressing ‘TesA support that ‘TesA is active in the cell on acyl-CoA substrates as well.
It is possible that ‘TesA does effectively cleave acyl-ACP substrates, suggested by the
strong growth defect observed from S. oneidensis strains expressing ‘TesA, but unlike E.
coli, fatty acid synthesis is not negatively regulated by the presence of acyl-ACPs. Fatty
acid synthesis is a highly conserved process across bacteria, but one of the few areas of
differentiation is the primers used for fatty acid synthesis. S. oneidensis and E. coli have
very different fatty acid profiles largely due to the expression of FabH homologues that
have different specificity for priming molecules for fatty acid synthesis. FabH from E.
coli almost exclusively uses acetyl-CoA to prime fatty acid synthesis resulting in straight
chain, even numbered fatty acids (Choi et al., 2000) whereas FabH from S. oneidensis
uses short branched chain CoA substrates as primers resulting in the branched chain, odd
numbered fatty acids observed in the fatty acid profile. Gene expression analysis of
FabH homologues might reveal differences in transcription levels when ‘TesA is
expressed in S. oneidensis and E. coli and this may explain why ‘TesA induces fatty acid
overproduction in E. coli but not S. oneidensis.
The presence of an oil sheen on cultures of the E. coli β-oxidation mutants
expressing ‘TesA suggests fatty acids are being secreted into the medium and could pose
a significant problem in a hydrocarbon overproducing strain. It is possible that the fatty

45
acids extracted from the medium in the E. coli β-oxidation mutant expressing ‘TesA are
the result of lysis, although evidence supports secretion based on the data in figure 4.3c,
where an E. coli strain expressing ‘TesA that has a functional β-oxidation pathway does
not have elevated fatty acid levels suggesting the cells are viable and able to degrade the
fatty acids being overproduced. Secreted fatty acids were also observed by Cho and
Cronan, where 90% of the fatty acids were secreted into the medium but the cells
remained intact based on turbidity, colony-forming ability, and metabolic activity (Cho
and Cronan, 1995). To further validate this in a future experiment, enzyme activity of a
normally cytoplasmic enzyme could be assayed and compared between the ‘TesA
expressing strain and vector control to determine if there is significant lysis. If activity is
determined to be due to secretion, fatty acid loss can be minimized by optimizing
expression of FadD and OleA so accumulating free fatty acids are quickly converted to
the activated CoA forms by FadD and subsequently condensed by OleA to hydrocarbons.
Hydrocarbons were produced in both S. oneidensis and E. coli, but expressing
genes targeted to overproduce hydrocarbons yielded no increases, and in the case of E.
coli, actually caused a decrease in hydrocarbons. These results further support that the
substrates for OleA are most likely not LCFA-CoAs.

46
Chapter 5
Conclusions and future directions
The ultimate goal of overproducing hydrocarbons from S. oneidensis proved a
difficult task, but a significant amount of information was gained from this work. S.
oneidensis has two acyl-CoA dehydrogenase homologues that are capable of degrading
long chain fatty acids (C12 and longer), and when both are disrupted, the strain can no
longer oxidize long chain fatty acids. This was an important step in engineering a
hydrocarbon overproducing strain so that the fatty acid precursors being overproduced
and needed for hydrocarbon synthesis were not siphoned off into the β-oxidation
pathway. Disruption of these homologues and subsequent analysis revealed redundant
specificity for fatty acid substrates. This was an interesting finding, and it is possible that
the expression of each homologue is regulated differently. Additionally, a third acyl-
CoA dehydrogenase appears to exist for medium chain fatty acids that has yet to be
identified. Future experiments include determining under what conditions each long
chain acyl-CoA dehydrogenase homologue is upregulated and identifying the third
homologue responsible for medium chain acyl-CoA dehydrogenase activity.
Questions are raised as to the substrate for OleA in the condensation of fatty
acids. Initially, it was believed that long chain acyl-CoAs were the substrate for the OleA
condensation reaction. However, disruption of the two fatty acyl-CoA ligase homologues
responsible for activating fatty acids with CoA still leads to the production of
hydrocarbons. Additionally, the acyl-CoA ligase double knockout strain is incapable of
growing on long chain fatty acids because long chain fatty acids cannot be activated with
CoA and thereby targeted for β-oxidation. It was also found that the two acyl-CoA
ligases have fatty acyl-CoA chain length specificity: FadD-1 was a better activator of
long chain fatty acids (C16 and C18) and FadD-2 of shorter chain fatty acids (C6), but
both homologues are equally capable of degrading C12 and C14 fatty acids. It is most
likely that long chain fatty acyl-ACPs or potentially some other fatty acid derivative are
the preferred substrate. Surprisingly, complementation of the E. coli fadD mutant that is
also unable to oxidize fatty acids with FadD-1 and FadD-2 shows that FadD-2 is unable
to restore growth on fatty acids as it does in the S. oneidensis complementation. The
47
different chain length specificity for the FadD homologues could have potential
biotechnological applications such as in the synthesis of fatty acid ethyl esters of different
chain lengths to make biodiesel and other platform chemicals (Steen et al., 2010).
Deregulating fatty acid synthesis by methods developed in E. coli proved
unsuccessful when applied to S. oneidensis. The method itself was validated by
deregulating fatty acid synthesis in an E. coli fadE mutant deficient in β-oxidation. This
data indicated that the thioesterase 'TesA is active in both S. oneidensis and E. coli, and
both strains exhibit a similar lag in growth, most likely associated with competition for
long chain acyl-ACPs with the phospholipid synthesis pathway. One possible
explanation is that the cytoplasmic concentration of long chain acyl-ACPs in S.
oneidensis does not cause feedback inhibition of enzymes involved in fatty acid synthesis
as occurs in E. coli. By this explanation, when long chain acyl-ACPs are cleaved in S.
oneidnesis, no change in fatty acid synthesis occurs where in E. coli this allows synthesis
to continue unabated because the allosteric inhibitor, long chain acyl-ACPs, has been
removed. Perhaps in S. oneidensis, feedback regulation of fatty acid synthesis occurs
further downstream from intermediates in the phospholipid synthesis pathway.
When plasmids designed to overproduce hydrocarbons are used to transform S.
oneidensis, there is no effect on hydrocarbons, and when those same plasmids are used to
transform E. coli, it results in a decrease in hydrocarbon production. This information
coupled with the result that the S. oneidensis fadD double mutant expressing OleA still
synthesizes hydrocarbons suggests that the substrate for OleA is actually not long chain
acyl-CoAs. Future directions should focus heavily on identifying other fatty acid
derivatives that could be substrates for OleA. It would also be worth exploring the
regulation of genes involved in fatty acid synthesis in S. oneidensis since this seems to
differ from E. coli. A great amount of information was gained in S. oneidensis
physiology pertaining to fatty acid metabolism and the resulting potential
biotechnological applications related to fuel production provide many research
opportunities to explore.

48
Works Cited
BLIGH, E. G. & DYER, W. J. 1959. A rapid method of total lipid extraction and
purification. Can J Biochem Physiol, 37, 911-7.
CHANG, Y. Y. & CRONAN, J. E. 1999. Membrane cyclopropane fatty acid content is a
major factor in acid resistance of Escherichia coli. Mol Microbiol, 33, 249-59.
CHEREPANOV, P. P. & WACKERNAGEL, W. 1995. Gene disruption in Escherichia
coli: TcR and KmR cassettes with the option of Flp-catalyzed excision of the
antibiotic-resistance determinant. Gene, 158, 9-14.
CHO, H. & CRONAN, J. E. 1993. Escherichia coli thioesterase I, molecular cloning and
sequencing of the structural gene and identification as a periplasmic enzyme. J
Biol Chem, 268, 9238-45.
CHO, H. & CRONAN, J. E. 1995. Defective export of a periplasmic enzyme disrupts
regulation of fatty acid synthesis. J Biol Chem, 270, 4216-9.
CHOI, K., HEATH, R. & ROCK, C. 2000. beta-ketoacyl-acyl carrier protein synthase III
(FabH) is a determining factor in branched-chain fatty acid biosynthesis. Journal
of Bacteriology, 182, 365-370.
CHUNG, C. T., NIEMELA, S. L. & MILLER, R. H. 1989. One-step preparation of
competent Escherichia coli: transformation and storage of bacterial cells in the
same solution. Proc Natl Acad Sci U S A, 86, 2172-5.
DATSENKO, K. A. & WANNER, B. L. 2000. One-step inactivation of chromosomal
genes in Escherichia coli K-12 using PCR products. Proc Natl Acad Sci U S A,
97, 6640-5.
DAVIS, M. & CRONAN, J. 2001. Inhibition of Escherichia coli acetyl coenzyme A
carboxylase by acyl-acyl carrier protein. Journal of Bacteriology, 183, 1499-
1503.
DAVIS, M. S., SOLBIATI, J. & CRONAN, J. E. 2000. Overproduction of acetyl-CoA
carboxylase activity increases the rate of fatty acid biosynthesis in Escherichia
coli. Journal of Biological Chemistry, 275, 28593-28598.
DIRUSSO, C., BLACK, P. & WEIMAR, J. 1999. Molecular inroads into the regulation
and metabolism of fatty acids, lessons from bacteria. Progress in Lipid Research,
38, 129-197.
DIRUSSO, C. C., HEIMERT, T. L. & METZGER, A. K. 1992. Characterization of
FadR, a global transcriptional regulator of fatty acid metabolism in Escherichia
coli. Interaction with the fadB promoter is prevented by long chain fatty acyl
coenzyme A. J Biol Chem, 267, 8685-91.
FRIAS, J. A., RICHMAN, J. E., ERICKSON, J. S. & WACKETT, L. P. 2011.
Purification and characterization of OleA from Xanthomonas campestris and
demonstration of a non-decarboxylative Claisen condensation reaction. J Biol
Chem, 286, 10930-8.
GRIFFITHS, M. J., VAN HILLE, R. P. & HARRISON, S. T. 2010. Selection of direct
transesterification as the preferred method for assay of fatty acid content of
microalgae. Lipids, 45, 1053-60.
49
HAU, H., GILBERT, A., COURSOLLE, D. & GRALNICK, J. 2008. Mechanism and
Consequences of Anaerobic Respiration of Cobalt by Shewanella oneidensis
Strain MR-1. Applied and Environmental Microbiology, 74, 6880-6886.
HAU, H. & GRALNICK, J. 2007. Ecology and biotechnology of the genus Shewanella.
Annual Review of Microbiology, 61, 237-258.
HEATH, R. & ROCK, C. 1996a. Regulation of fatty acid elongation and initiation by
acyl acyl carrier protein in Escherichia coli. Journal of Biological Chemistry, 271,
1833-1836.
HEATH, R. J. & ROCK, C. O. 1996b. Inhibition of beta-ketoacyl-acyl carrier protein
synthase III (FabH) by acyl-acyl carrier protein in Escherichia coli. J Biol Chem,
271, 10996-1000.
HILL, J., NELSON, E., TILMAN, D., POLASKY, S. & TIFFANY, D. 2006.
Environmental, economic, and energetic costs and benefits of biodiesel and
ethanol biofuels. Proceedings of the National Academy of Sciences of the United
States of America, 103, 11206-11210.
KANG, Y., NGUYEN, D. T., SON, M. S. & HOANG, T. T. 2008. The Pseudomonas
aeruginosa PsrA responds to long-chain fatty acid signals to regulate the fadBA5
beta-oxidation operon. Microbiology, 154, 1584-98.
KANG, Y., ZARZYCKI-SIEK, J., WALTON, C., NORRIS, M. & HOANG, T. 2010.
Multiple FadD Acyl-CoA Synthetases Contribute to Differential Fatty Acid
Degradation and Virulence in Pseudomonas aeruginosa. Plos One, 5.
KUNAU, W. H., DOMMES, V. & SCHULZ, H. 1995. beta-oxidation of fatty acids in
mitochondria, peroxisomes, and bacteria: a century of continued progress. Prog
Lipid Res, 34, 267-342.
LALMAN, J. & BAGLEY, D. 2004. Extracting long-chain fatty acids from a
fermentation medium. Journal of the American Oil Chemists Society, 81, 105-
110.
LIU, X., SHENG, J. & CURTISS, R. 2011. Fatty acid production in genetically modified
cyanobacteria. Proc Natl Acad Sci U S A, 108, 6899-904.
PERLACK, R. D., WRIGHT, L. L., TURHOLLOW, A. F., GRAHAM, R. L., STOKES,
B. J. & ERBACH, D. C. 2005. Biomass as Feedstock for a Bioenergy and
Bioproducts Industry: The Technical Feasibility of a Billion-Ton Annual Supply.
Department of Energy: Oak Ridge National Laboratory.
SALTIKOV, C. W. & NEWMAN, D. K. 2003. Genetic identification of a respiratory
arsenate reductase. Proc Natl Acad Sci U S A, 100, 10983-8.
STEEN, E., KANG, Y., BOKINSKY, G., HU, Z., SCHIRMER, A., MCCLURE, A.,
DEL CARDAYRE, S. & KEASLING, J. 2010. Microbial production of fatty-
acid-derived fuels and chemicals from plant biomass. Nature, 463, 559-U182.
SUKOVICH, D., SEFFERNICK, J., RICHMAN, J., HUNT, K., GRALNICK, J. &
WACKETT, L. 2010. Structure, Function, and Insights into the Biosynthesis of a
Head-to-Head Hydrocarbon in Shewanella oneidensis Strain MR-1. Applied and
Environmental Microbiology, 76, 3842-3849.
VENKATESWARAN, K., MOSER, D. P., DOLLHOPF, M. E., LIES, D. P.,
SAFFARINI, D. A., MACGREGOR, B. J., RINGELBERG, D. B., WHITE, D.

50
C., NISHIJIMA, M., SANO, H., BURGHARDT, J., STACKEBRANDT, E. &
NEALSON, K. H. 1999. Polyphasic taxonomy of the genus Shewanella and
description of Shewanella oneidensis sp. nov. Int J Syst Bacteriol, 49 Pt 2, 705-
24.
VICK, J. E., JOHNSON, E. T., CHOUDHARY, S., BLOCH, S. E., LOPEZ-GALLEGO,
F., SRIVASTAVA, P., TIKH, I. B., WAWRZYN, G. T. & SCHMIDT-
DANNERT, C. 2011. Optimized compatible set of BioBrick™ vectors for
metabolic pathway engineering. Appl Microbiol Biotechnol, 92, 1275-86.
WHITE, S., ZHENG, J., ZHANG, Y. & ROCK, C. 2005. The structural biology of type
II fatty acid biosynthesis. Annual Review of Biochemistry, 74, 791-831.
ZHANG, Y. M. & ROCK, C. O. 2008. Membrane lipid homeostasis in bacteria. Nat Rev
Microbiol, 6, 222-33.