robotic technologies for automated high-throughput plant · pdf filerobotic technologies for...
TRANSCRIPT
Robotic Technologies for Automated
High-throughput Plant Phenotyping
Lie Tang, PhD
Associate Professor
Agricultural Automation and Robotics Laboratory
Department of Agricultural and Biosystems Engineering
Iowa State University
Email: [email protected]
Tel: 515-294-9778

Agenda
1. Machine Vision Systems
◦ Automated Plant Population and Interplant
Spacing Sensing
◦ Plant 3D Reconstruction and
Characterization under Indoor and Outdoor
Conditions
2. Mobile Robotic Platforms
I. Machine Vision Systems
1) 2D Color Video and Sequential Images
2) Stereo 3D Imaging
3) Time-of-Flight (ToF) of Light 3D Imaging
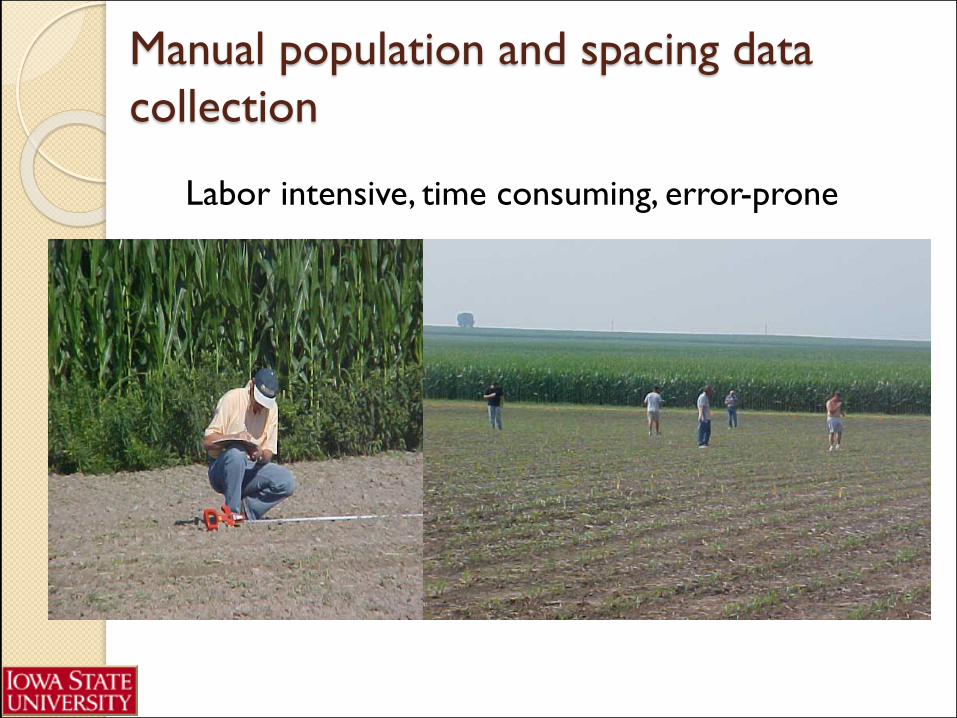
Manual population and spacing data
collection
Labor intensive, time consuming, error-prone
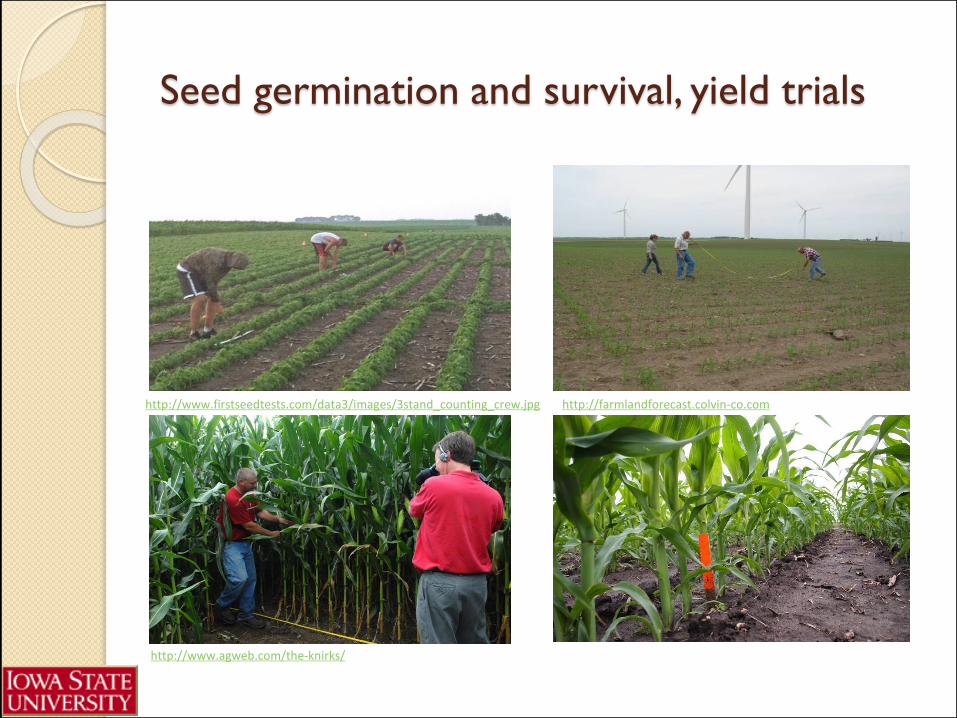
Seed germination and survival, yield trials
http://www.firstseedtests.com/data3/images/3stand_counting_crew.jpg http://farmlandforecast.colvin-co.com
http://www.agweb.com/the-knirks/
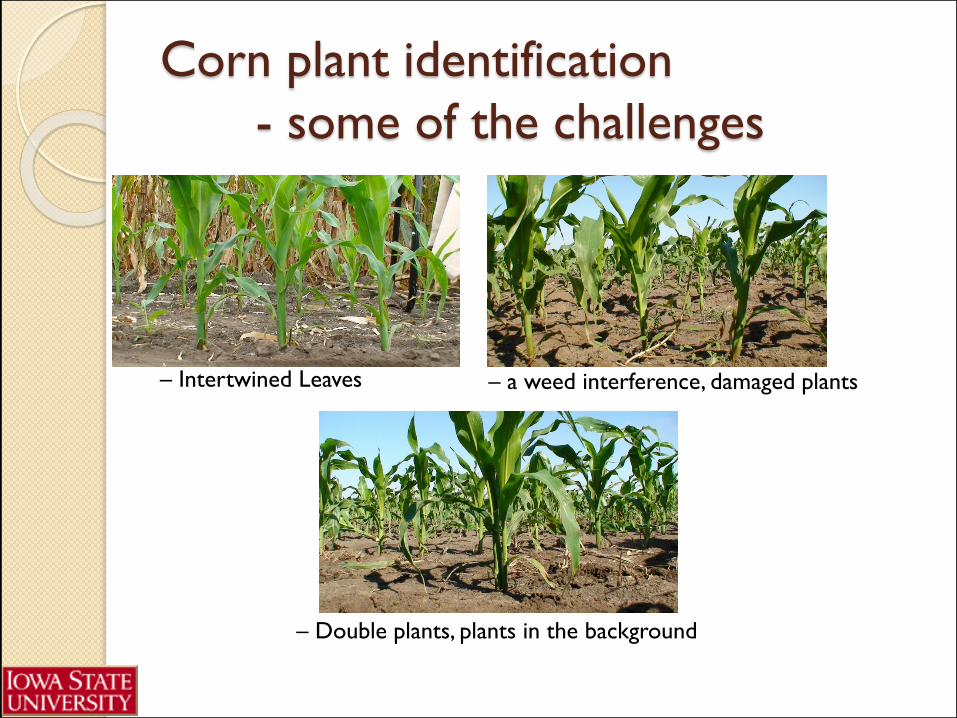
Corn plant identification
- some of the challenges
– Intertwined Leaves – a weed interference, damaged plants
– Double plants, plants in the background
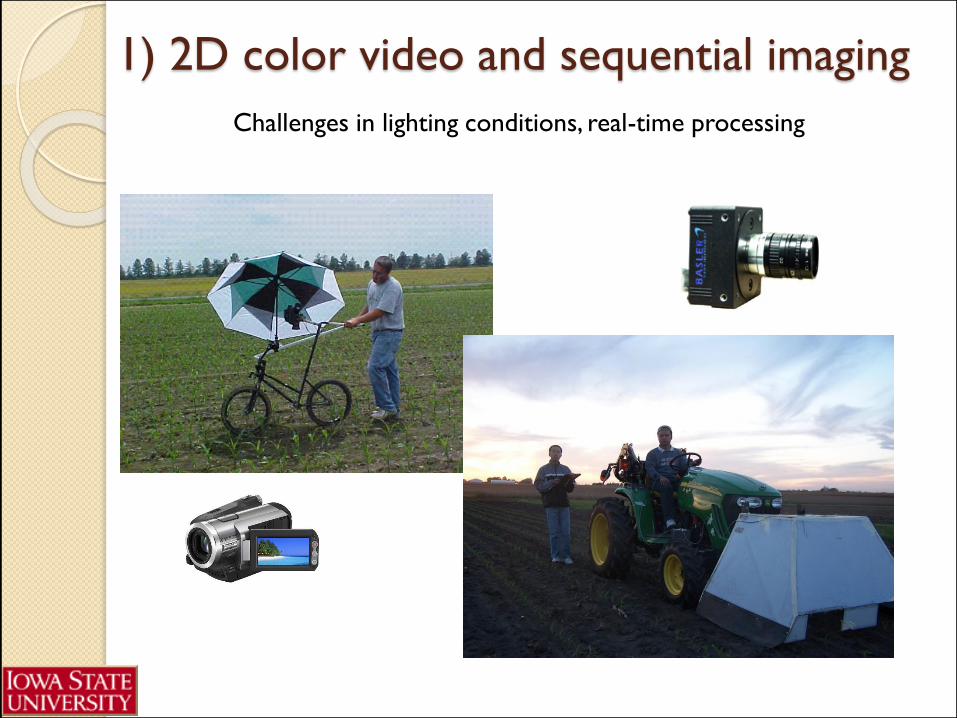
1) 2D color video and sequential imaging
Challenges in lighting conditions, real-time processing
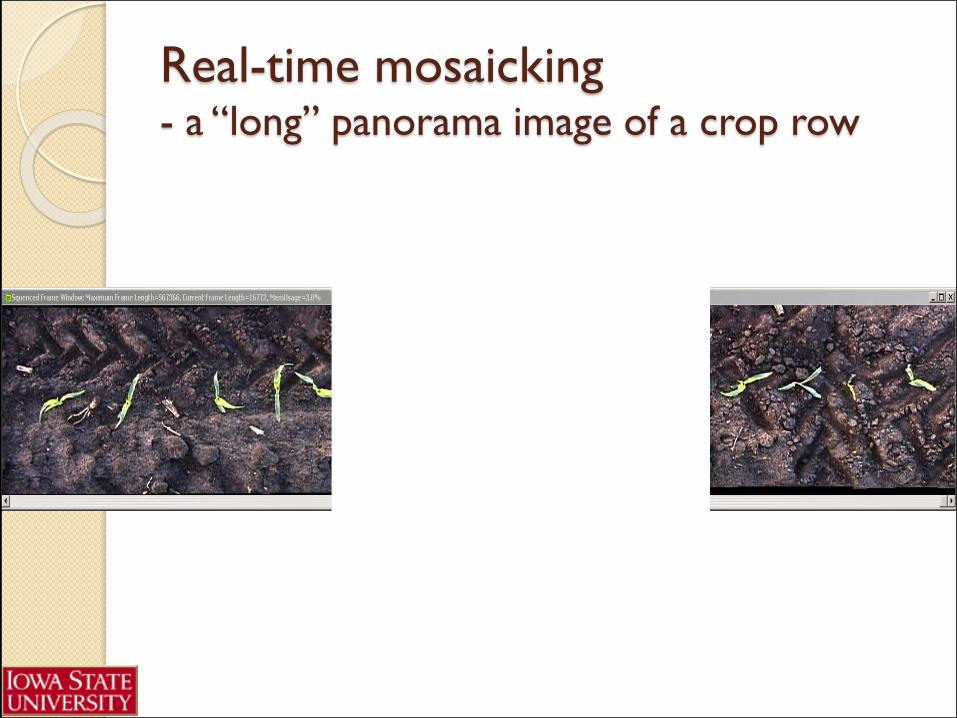
Real-time mosaicking- a “long” panorama image of a crop row
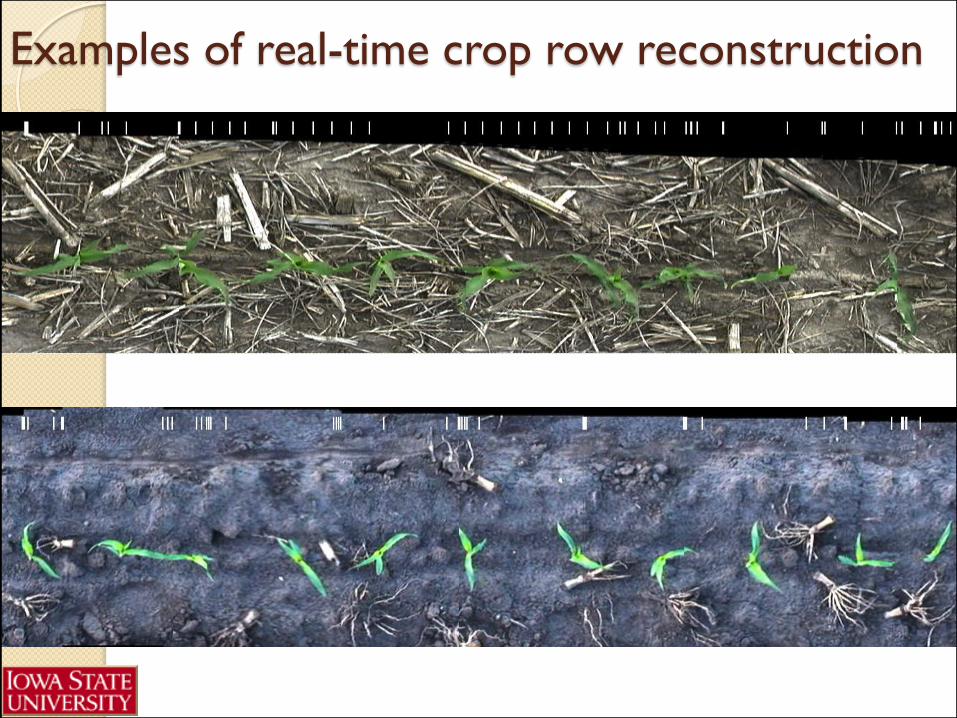
Examples of real-time crop row reconstruction
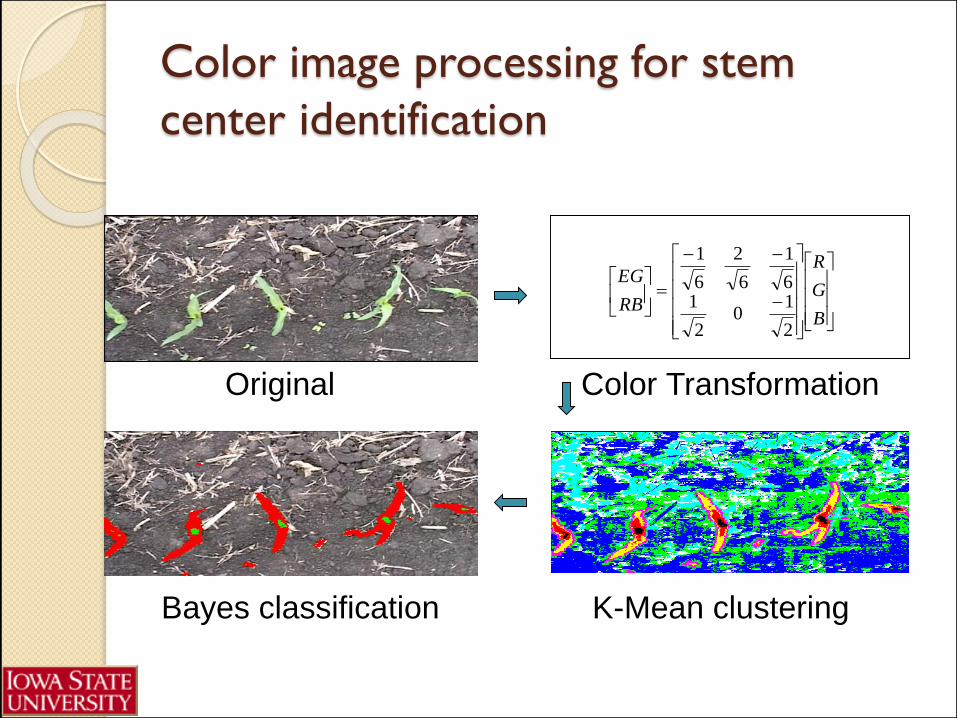
Color image processing for stem
center identification
Original
K-Mean clusteringBayes classification
B
G
R
RB
EG
2
10
2
16
1
6
2
6
1
Color Transformation
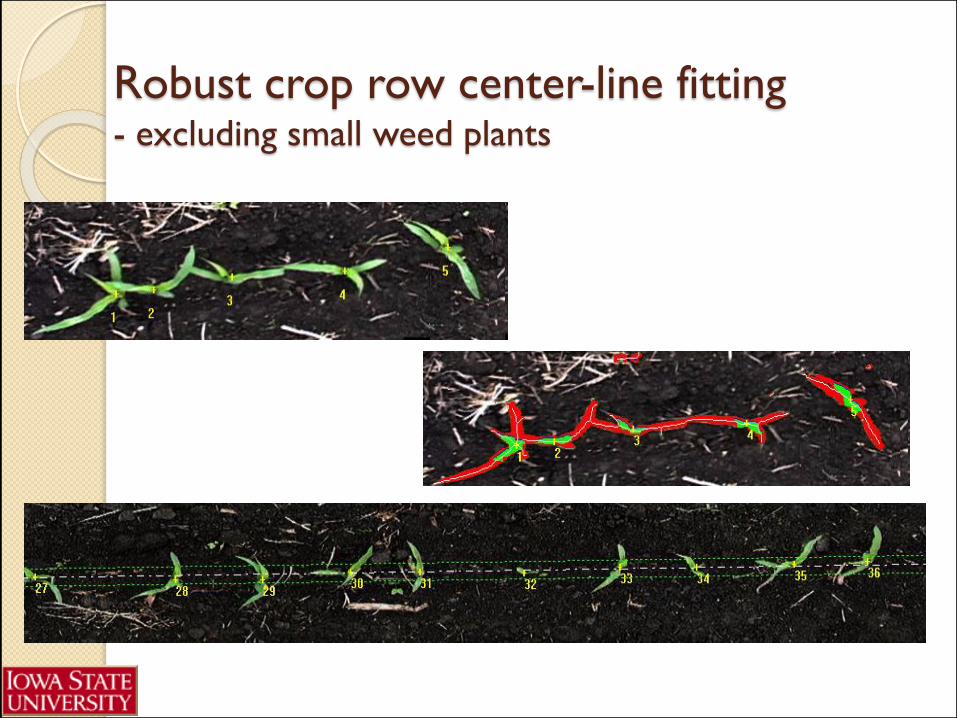
Robust crop row center-line fitting- excluding small weed plants
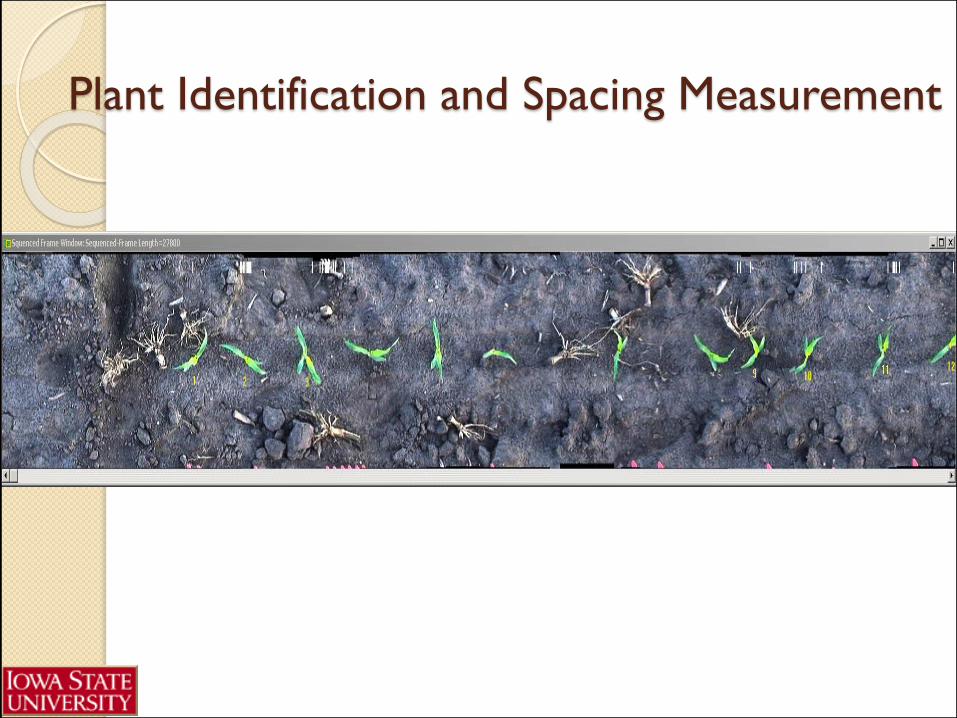
Plant Identification and Spacing Measurement
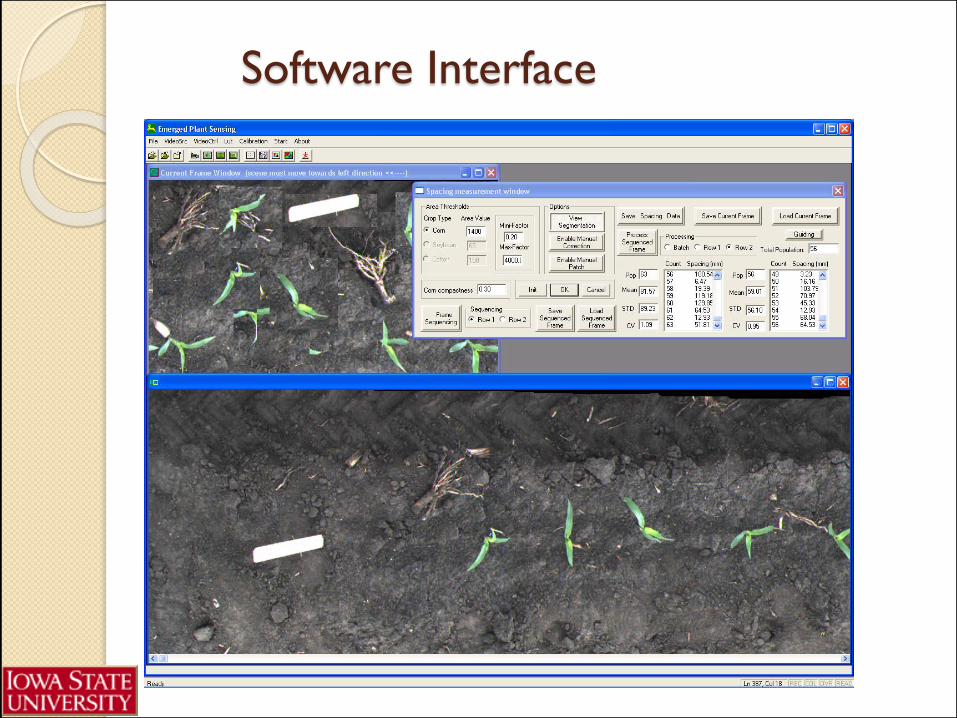
Software Interface
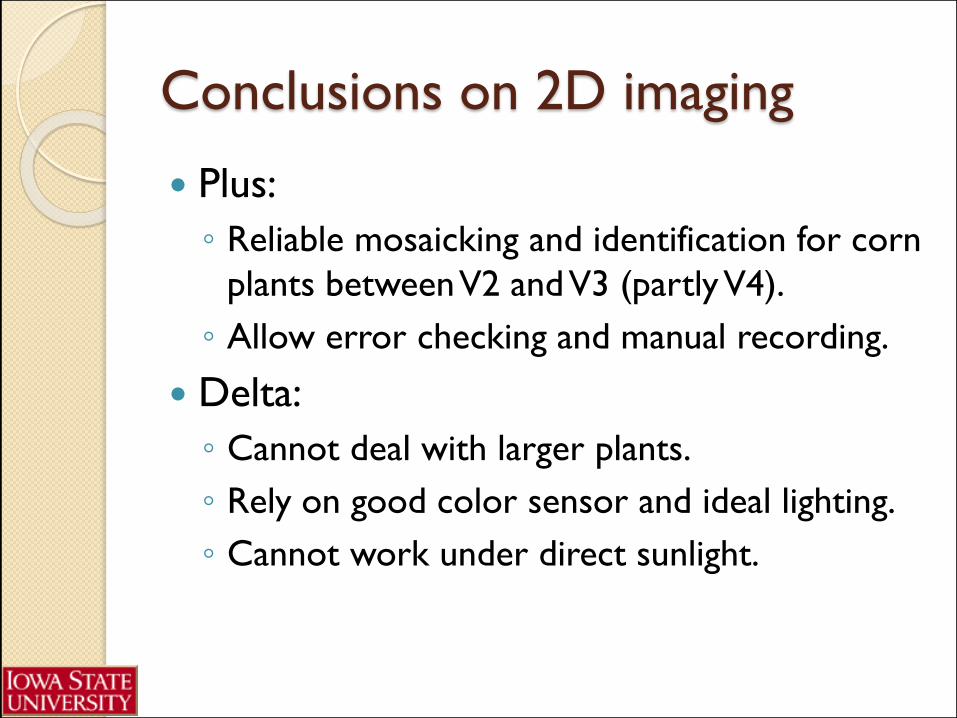
Conclusions on 2D imaging
Plus:
◦ Reliable mosaicking and identification for corn
plants between V2 and V3 (partly V4).
◦ Allow error checking and manual recording.
Delta:
◦ Cannot deal with larger plants.
◦ Rely on good color sensor and ideal lighting.
◦ Cannot work under direct sunlight.
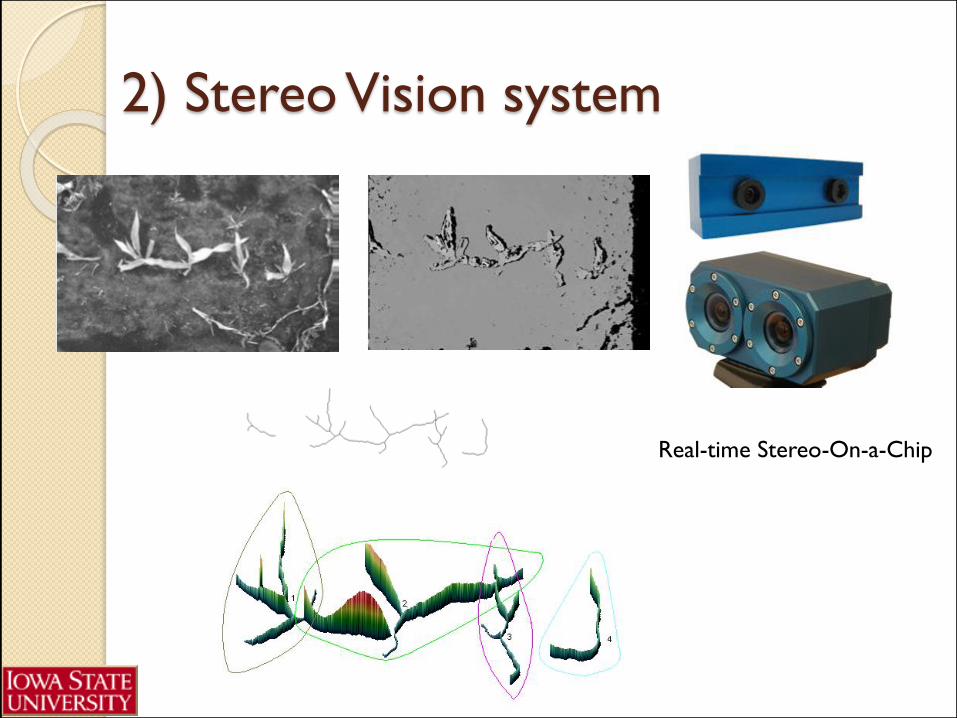
2) Stereo Vision system
Real-time Stereo-On-a-Chip
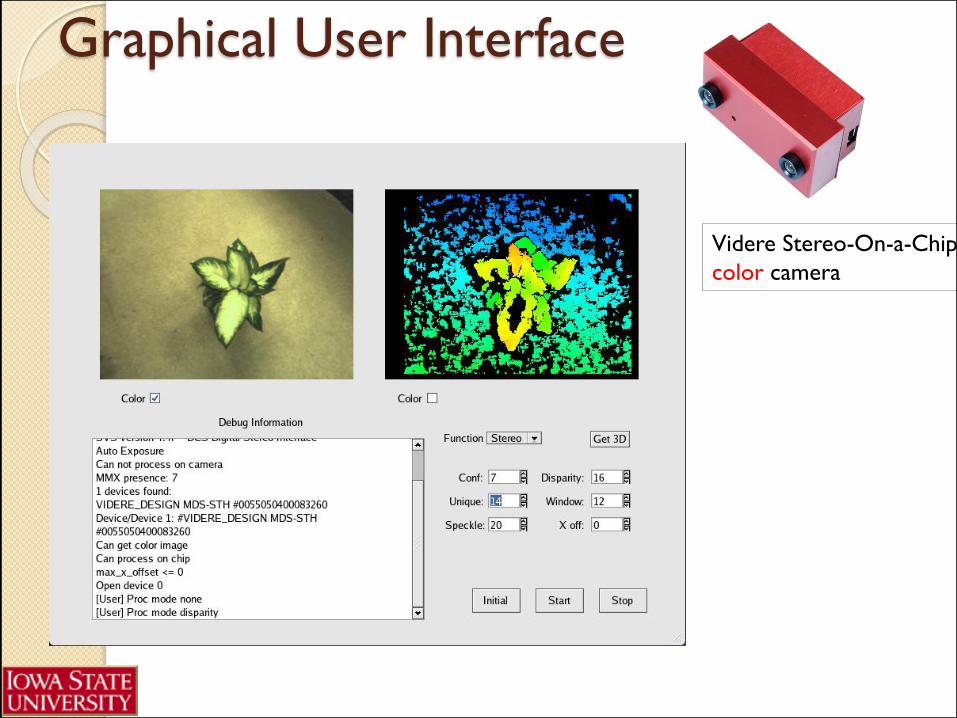
Graphical User Interface
Videre Stereo-On-a-Chip
color camera
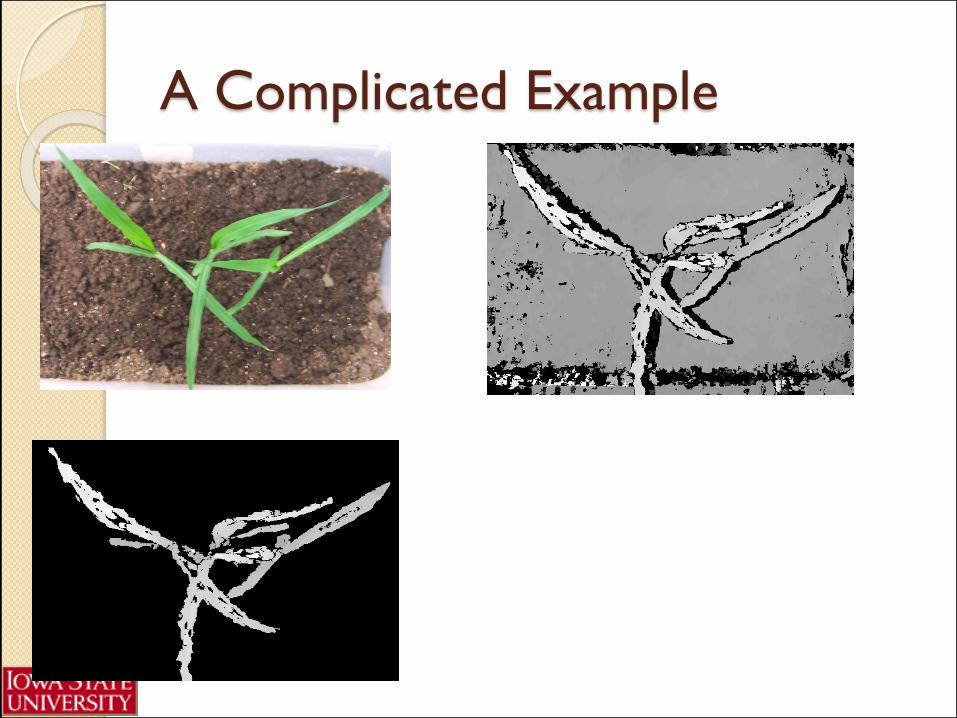
A Complicated Example
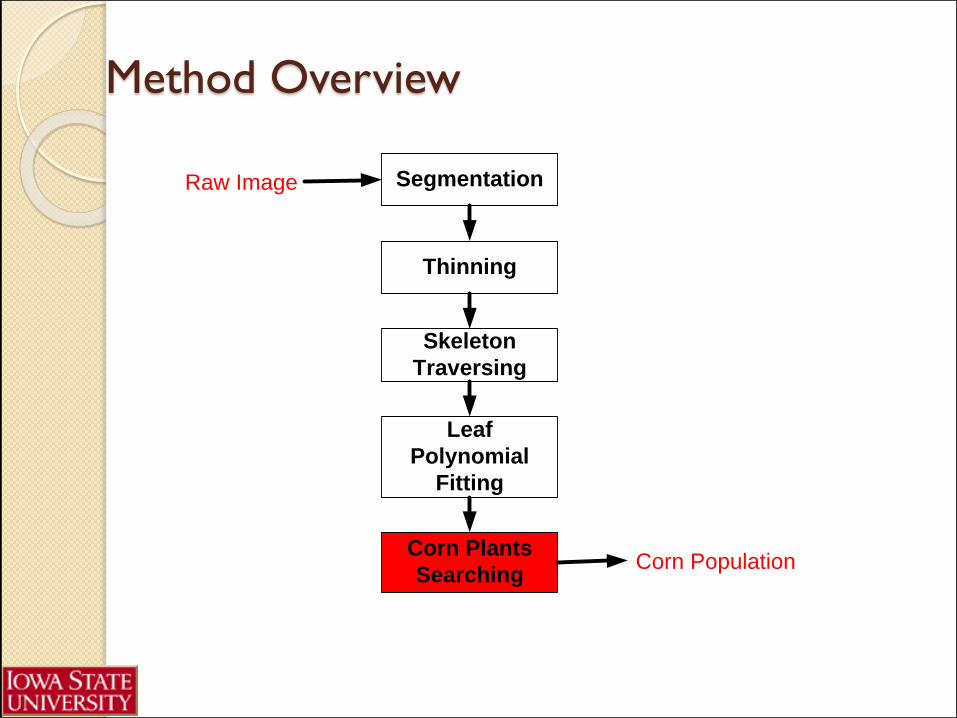
Method Overview
Segmentation
Corn Plants
Searching
Skeleton
Traversing
Leaf
Polynomial
Fitting
Thinning
Raw Image
Corn Population
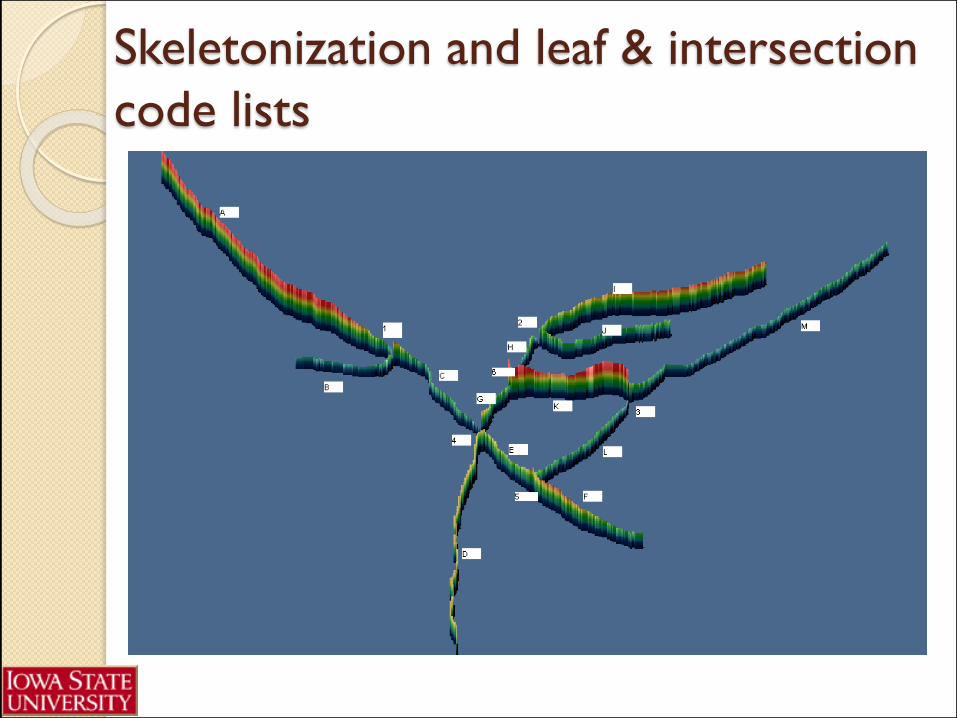
Skeletonization and leaf & intersection
code lists
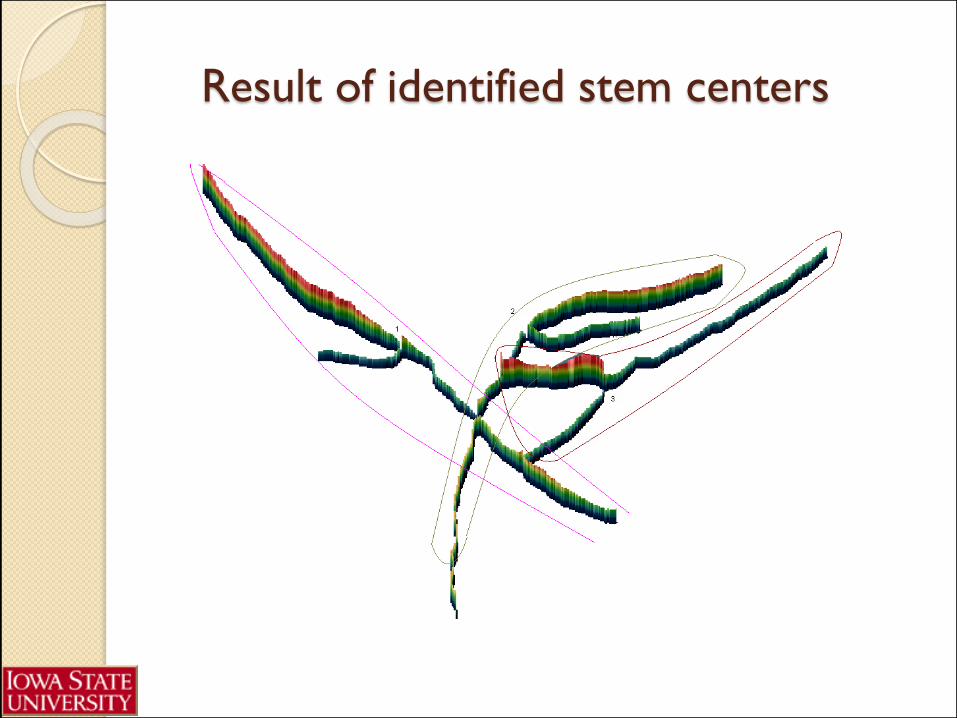
Result of identified stem centers
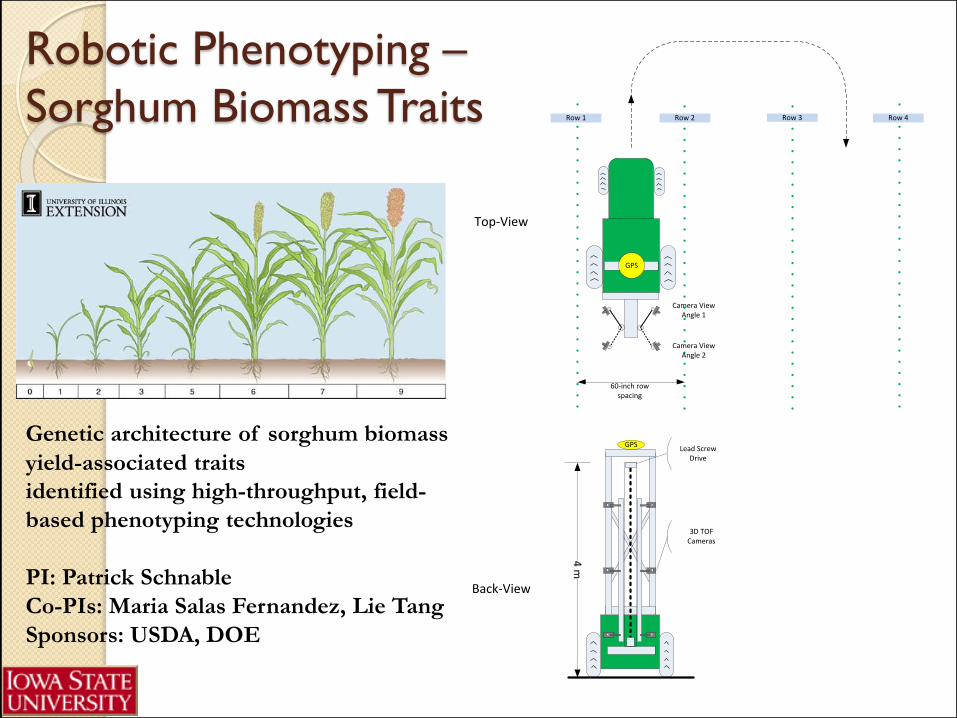
Robotic Phenotyping –
Sorghum Biomass Traits
Camera View Angle 2
Row 3
60-inch row spacing
Row 2Row 1 Row 4
GPS
Camera View Angle 1
GPS
Top-View
Back-View
4 m
Lead Screw Drive
3D TOF Cameras
Genetic architecture of sorghum biomass
yield-associated traits
identified using high-throughput, field-
based phenotyping technologies
PI: Patrick Schnable
Co-PIs: Maria Salas Fernandez, Lie Tang
Sponsors: USDA, DOE
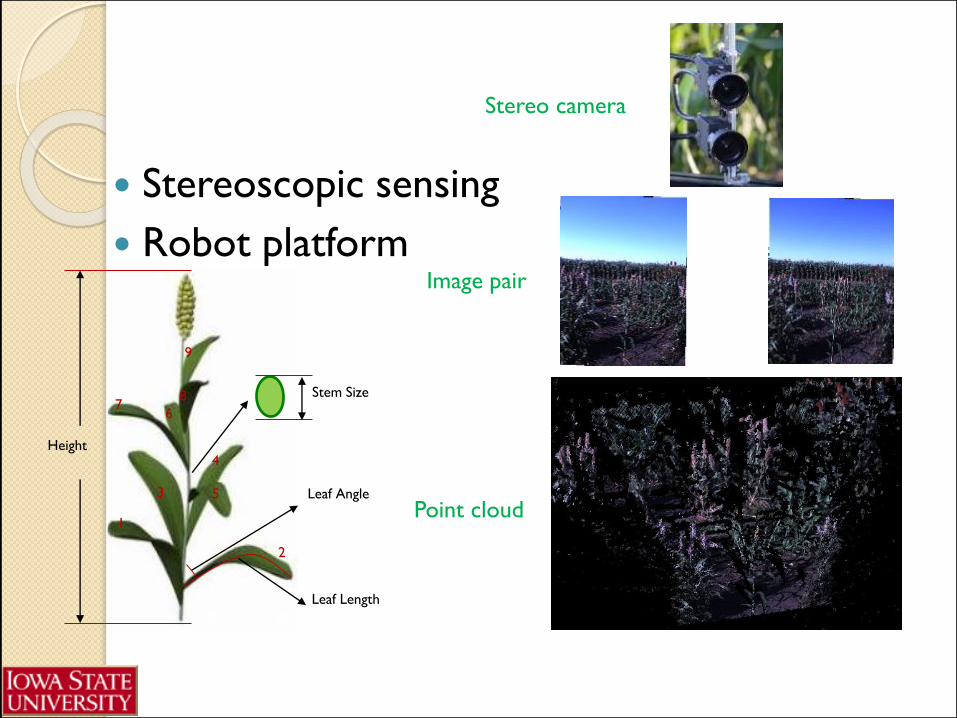
Stereoscopic sensing
Robot platform
Leaf Angle
Height
9
8
67
4
53
1
2
Stem Size
Leaf Length
Stereo camera
Image pair
Point cloud
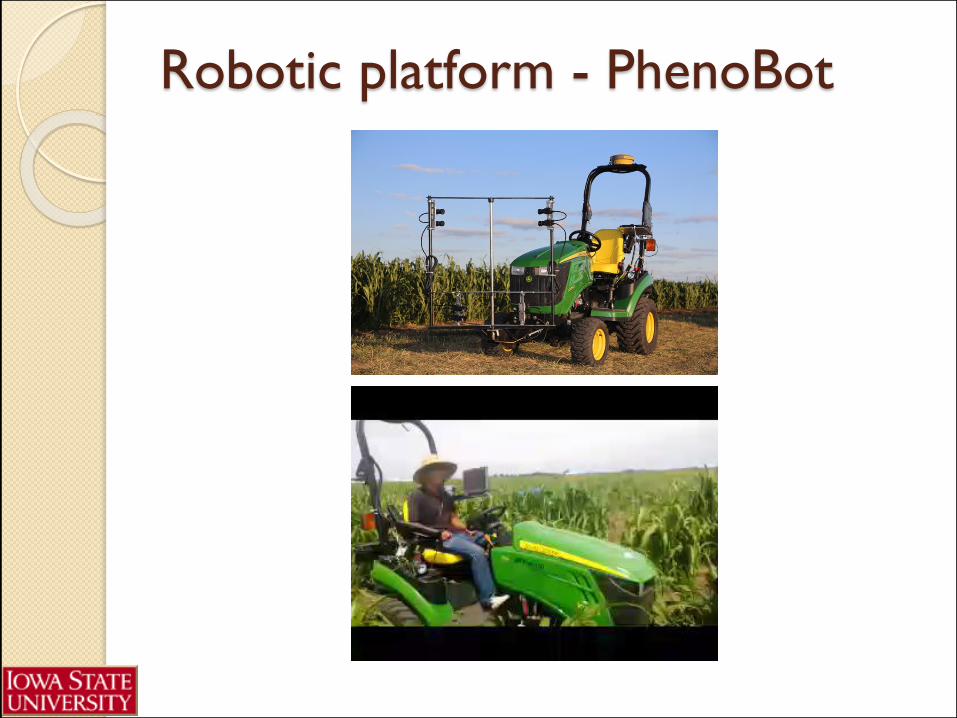
Robotic platform - PhenoBot
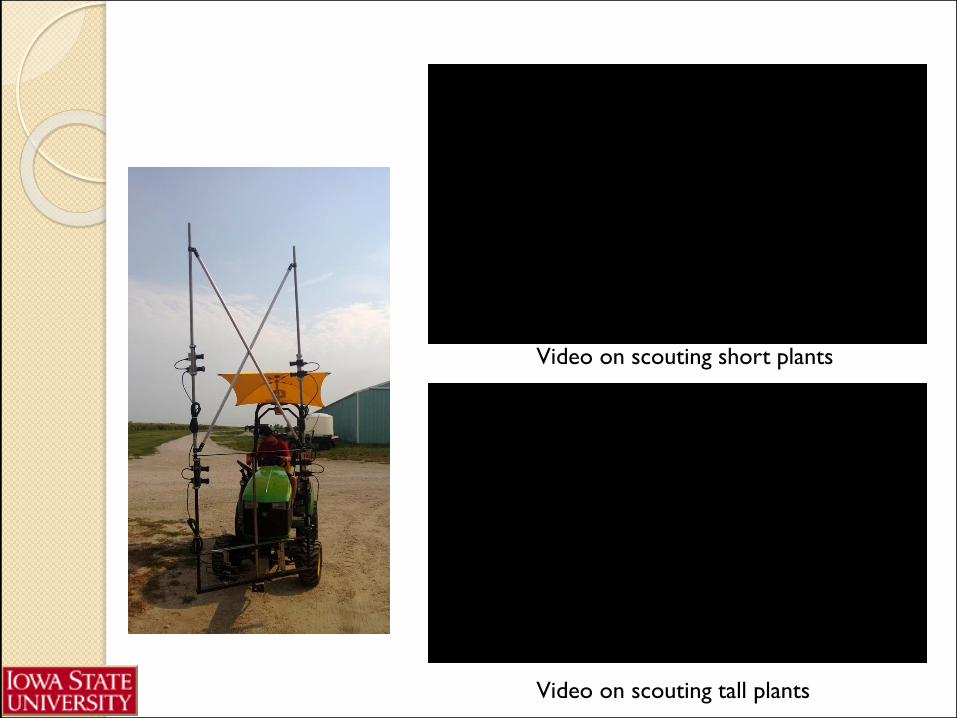
Video on scouting short plants
Video on scouting tall plants
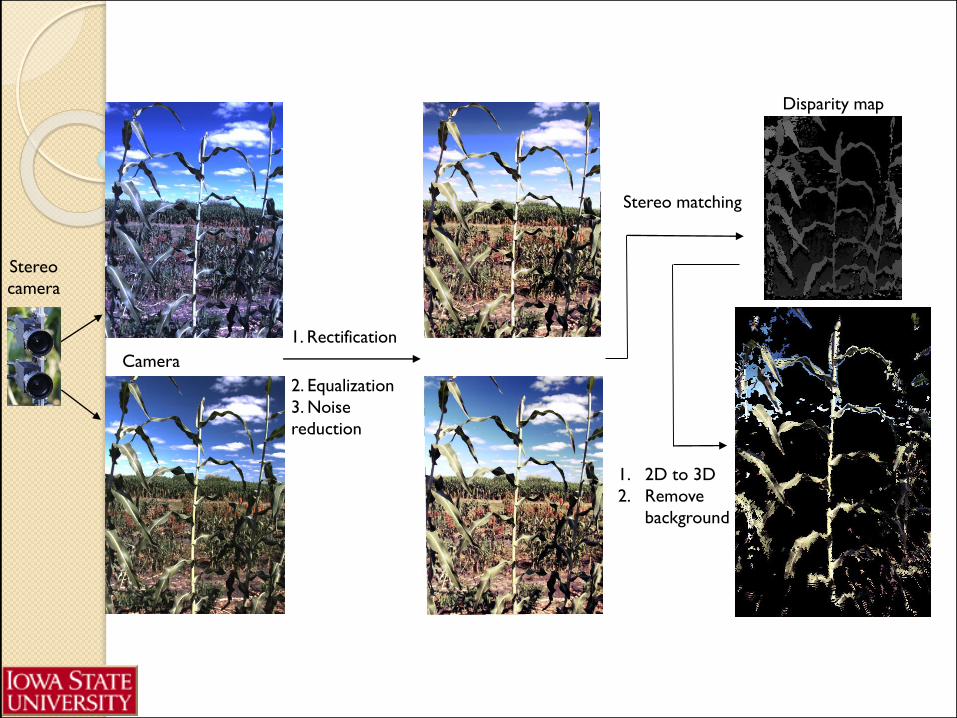
Camera
calibration
1. Rectification
2. Equalization
3. Noise
reduction
Stereo matching
Disparity map
Stereo
camera
1. 2D to 3D
2. Remove
background
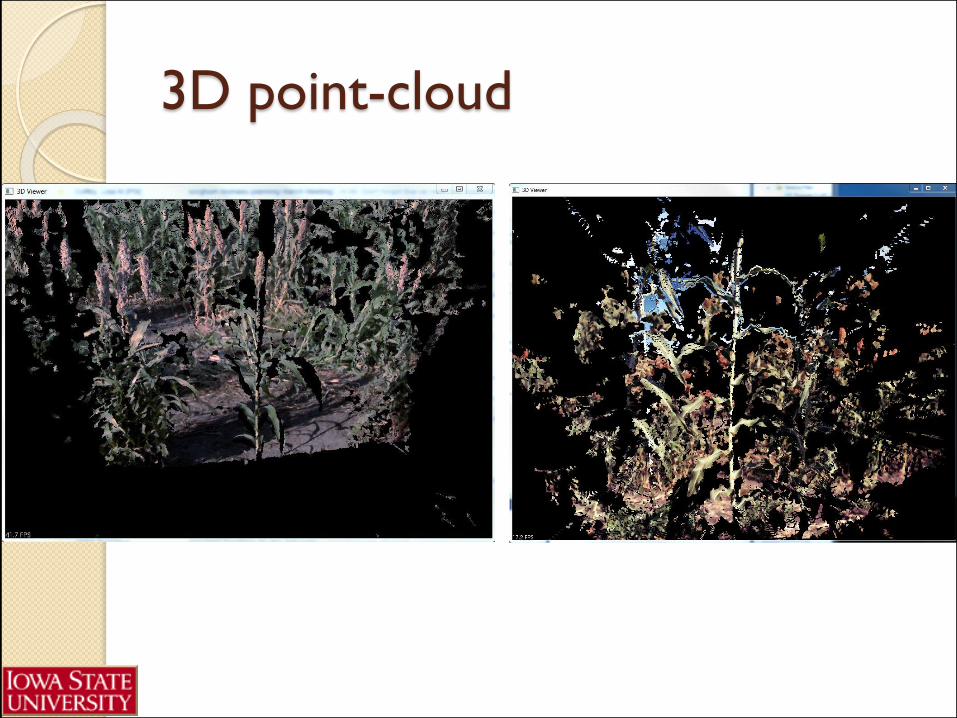
3D point-cloud
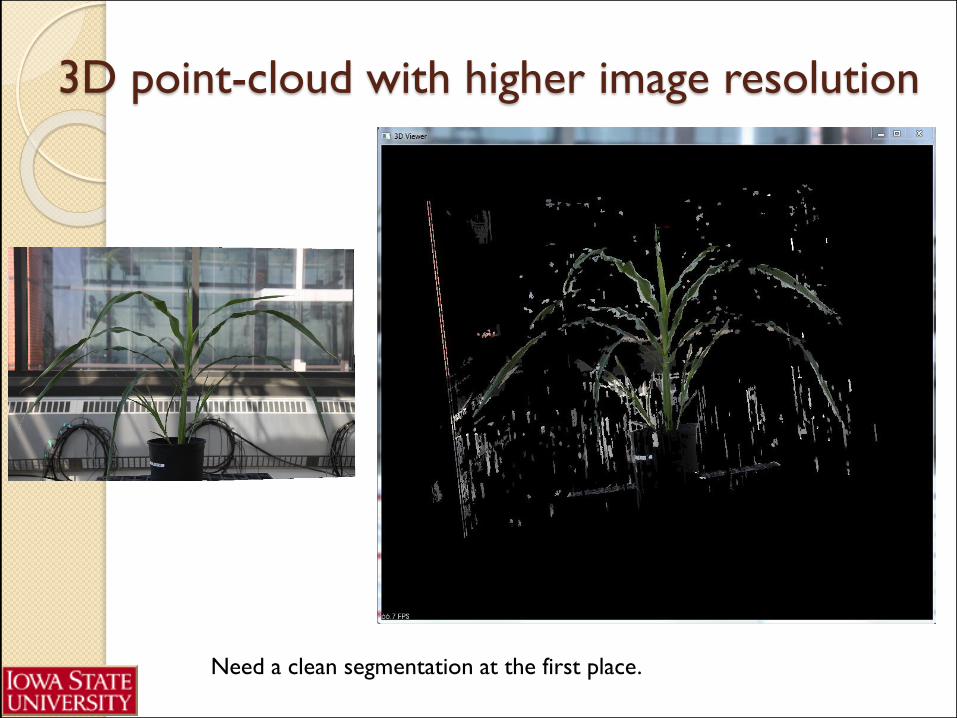
3D point-cloud with higher image resolution
Need a clean segmentation at the first place.
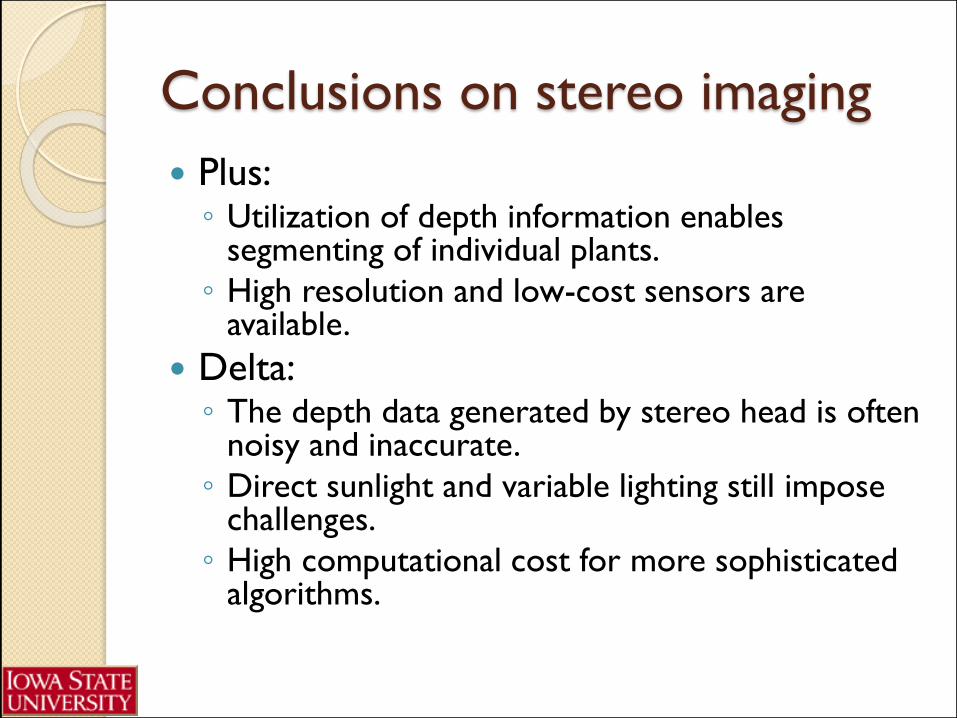
Conclusions on stereo imaging
Plus: ◦ Utilization of depth information enables
segmenting of individual plants.
◦ High resolution and low-cost sensors are available.
Delta:◦ The depth data generated by stereo head is often
noisy and inaccurate.
◦ Direct sunlight and variable lighting still impose challenges.
◦ High computational cost for more sophisticated algorithms.
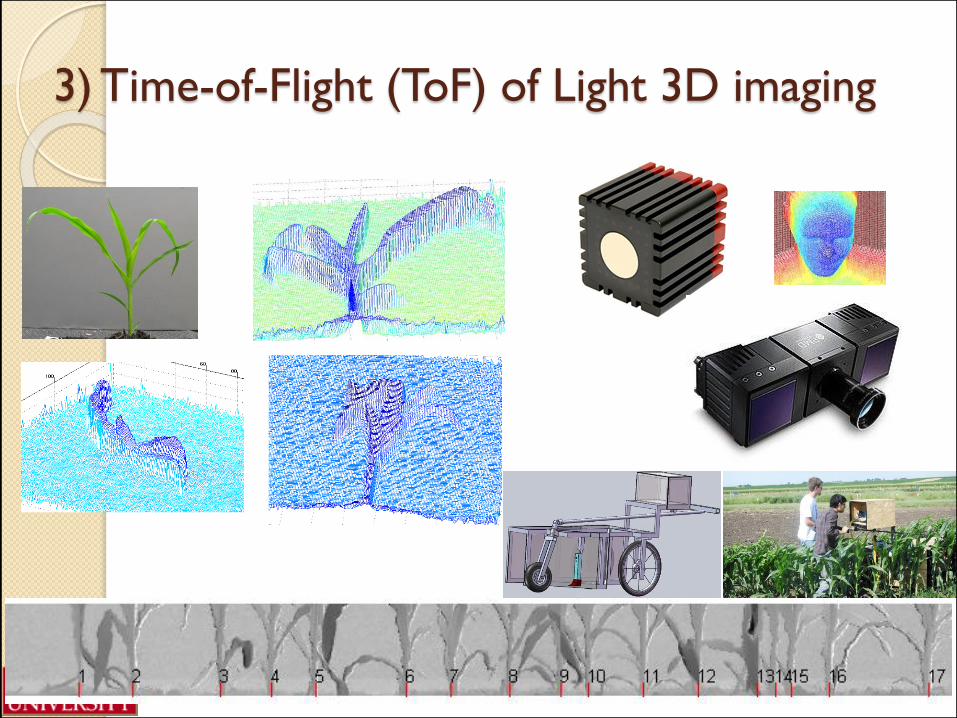
3) Time-of-Flight (ToF) of Light 3D imaging
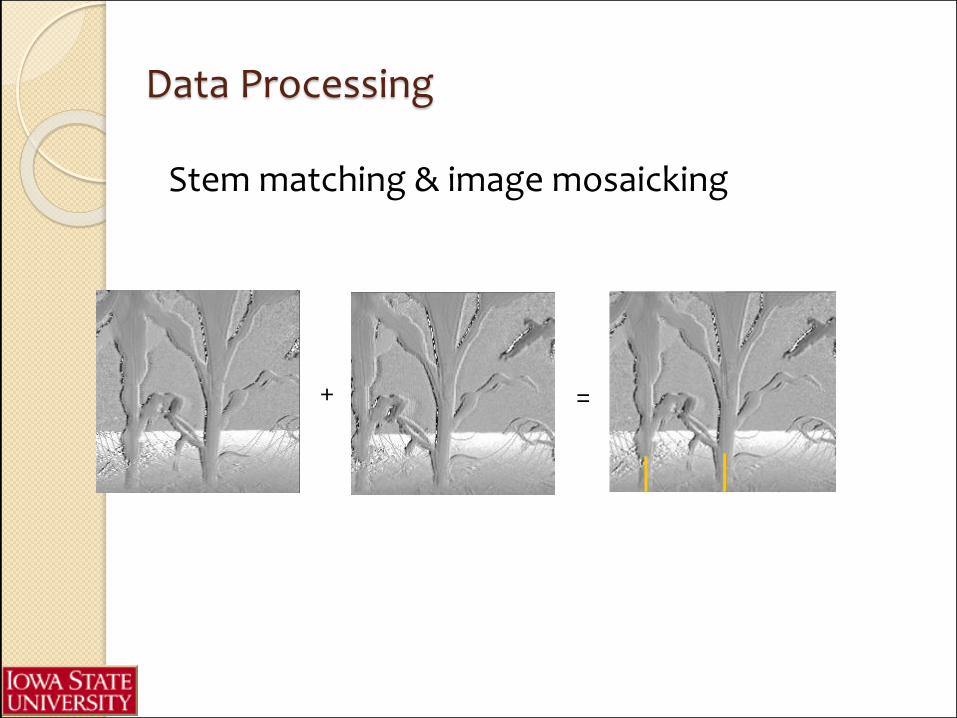
Stem matching & image mosaicking
Data Processing
=+
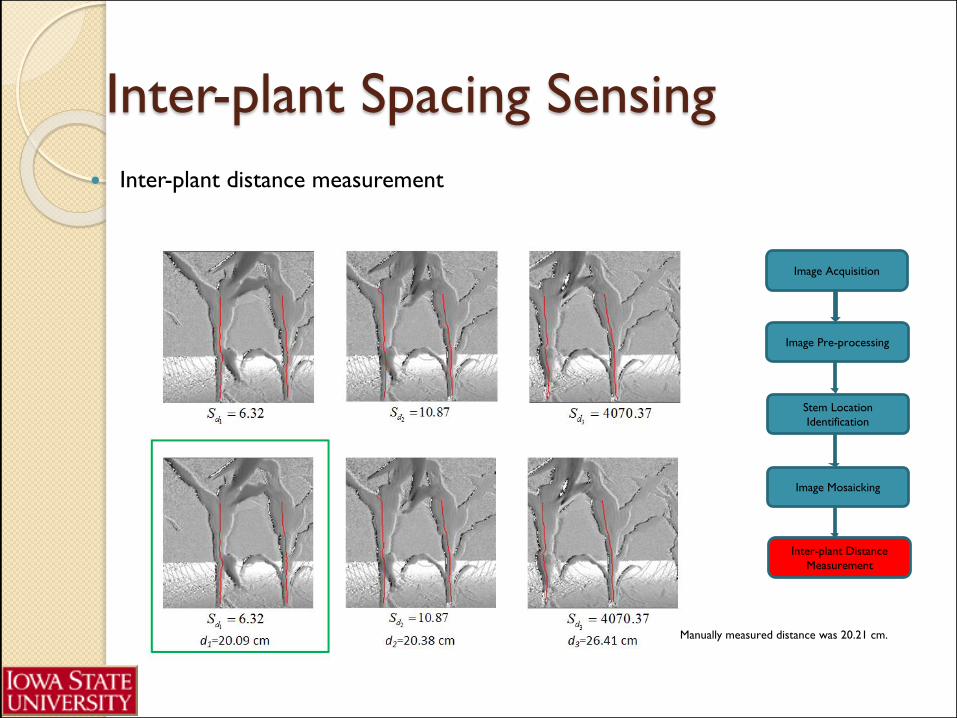
Inter-plant Spacing Sensing
Inter-plant distance measurement
Image Acquisition
Image Pre-processing
Stem Location
Identification
Image Mosaicking
Inter-plant Distance
Measurement
Manually measured distance was 20.21 cm.
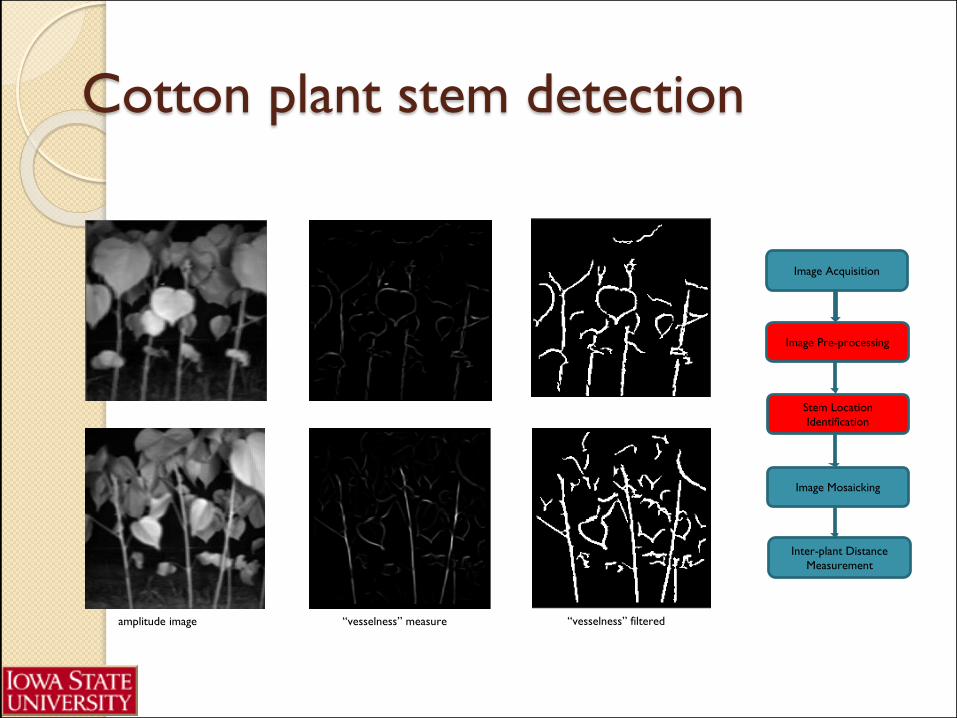
Cotton plant stem detection
Image Acquisition
Image Pre-processing
Stem Location
Identification
Image Mosaicking
Inter-plant Distance
Measurement
amplitude image “vesselness” measure “vesselness” filtered
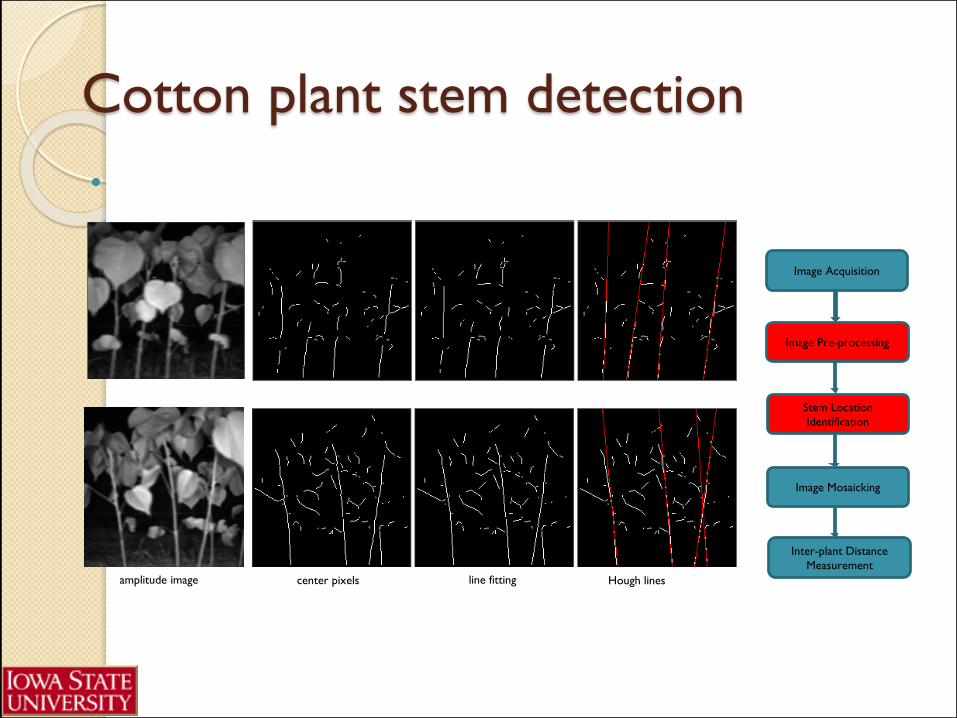
Cotton plant stem detection
Image Acquisition
Image Pre-processing
Stem Location
Identification
Image Mosaicking
Inter-plant Distance
Measurement
amplitude image center pixels line fitting Hough lines
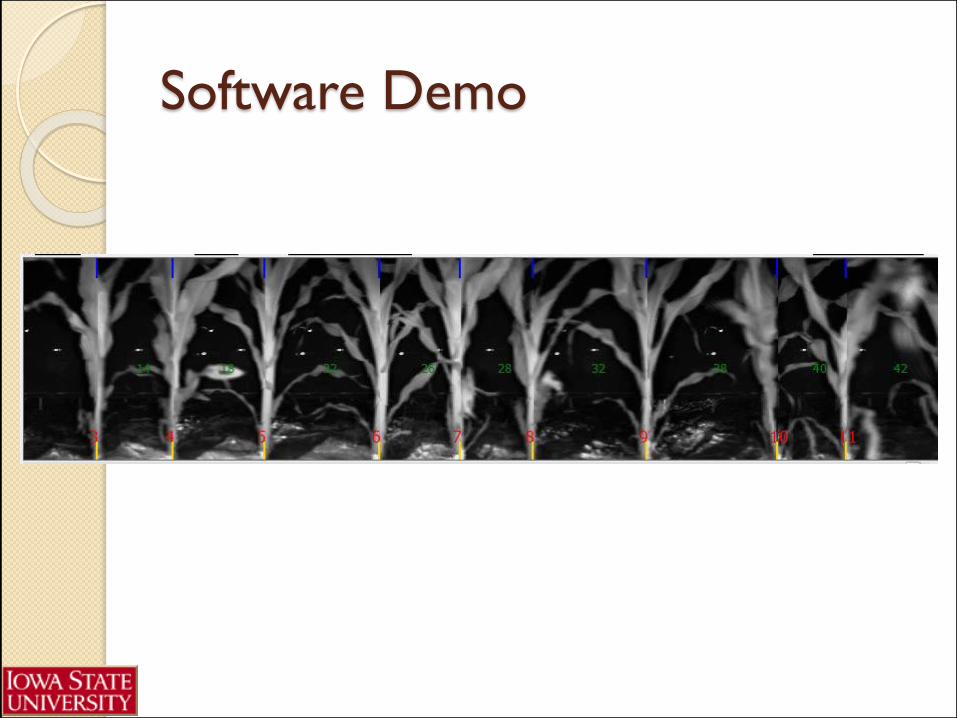
Software Demo
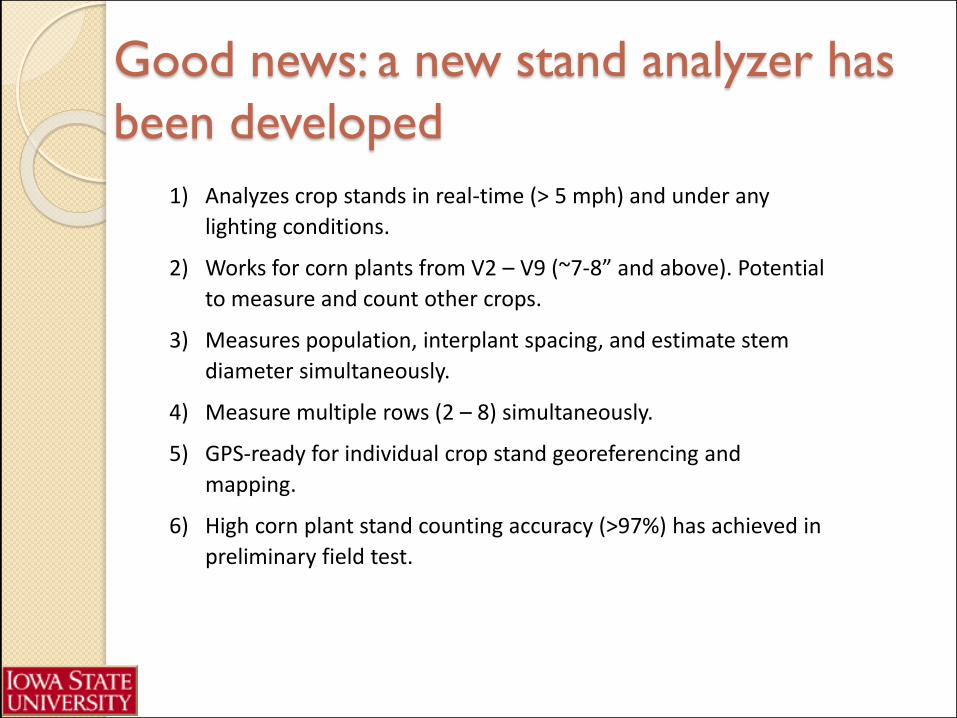
Good news: a new stand analyzer has
been developed
1) Analyzes crop stands in real-time (> 5 mph) and under any
lighting conditions.
2) Works for corn plants from V2 – V9 (~7-8” and above). Potential
to measure and count other crops.
3) Measures population, interplant spacing, and estimate stem
diameter simultaneously.
4) Measure multiple rows (2 – 8) simultaneously.
5) GPS-ready for individual crop stand georeferencing and
mapping.
6) High corn plant stand counting accuracy (>97%) has achieved in
preliminary field test.
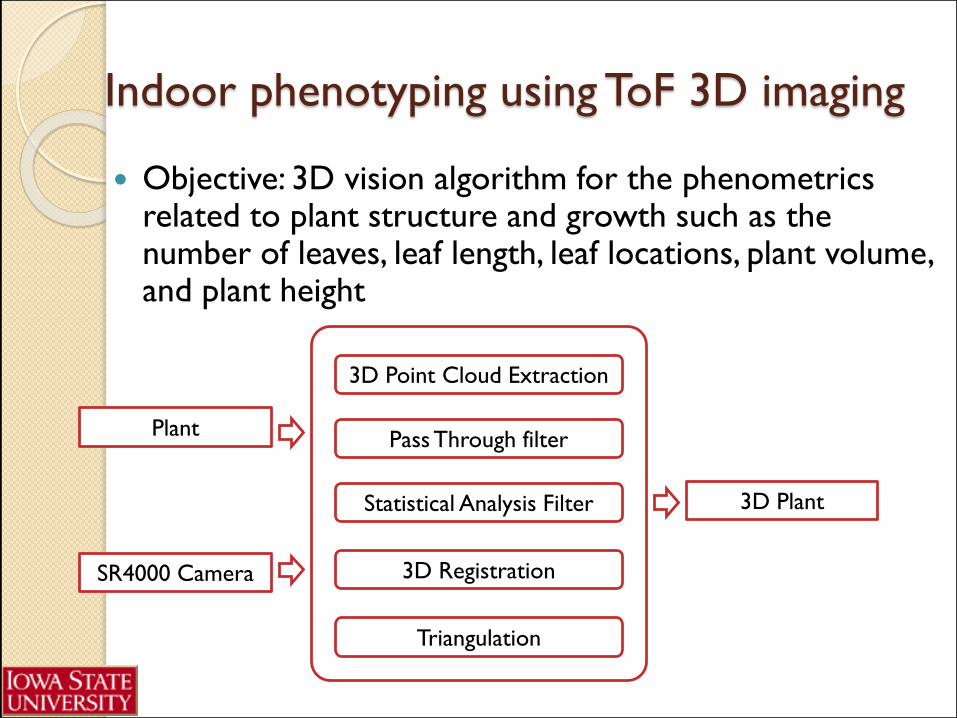
Indoor phenotyping using ToF 3D imaging
Objective: 3D vision algorithm for the phenometricsrelated to plant structure and growth such as the number of leaves, leaf length, leaf locations, plant volume, and plant height
Plant
3D Point Cloud Extraction
SR4000 Camera
Pass Through filter
Statistical Analysis Filter
3D Registration
Triangulation
3D Plant
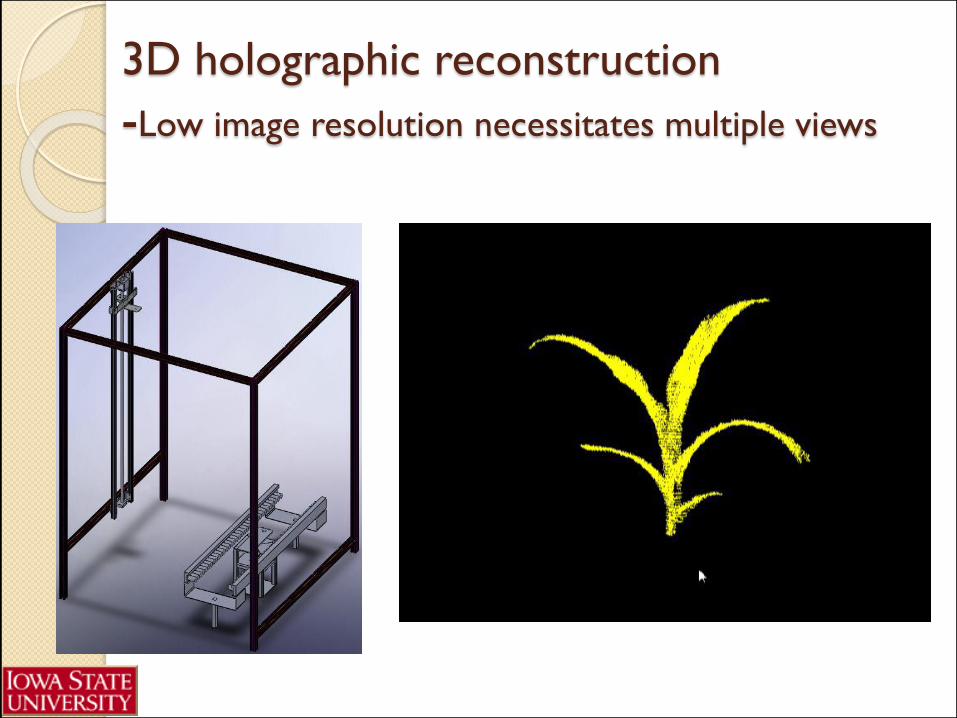
3D holographic reconstruction
-Low image resolution necessitates multiple views
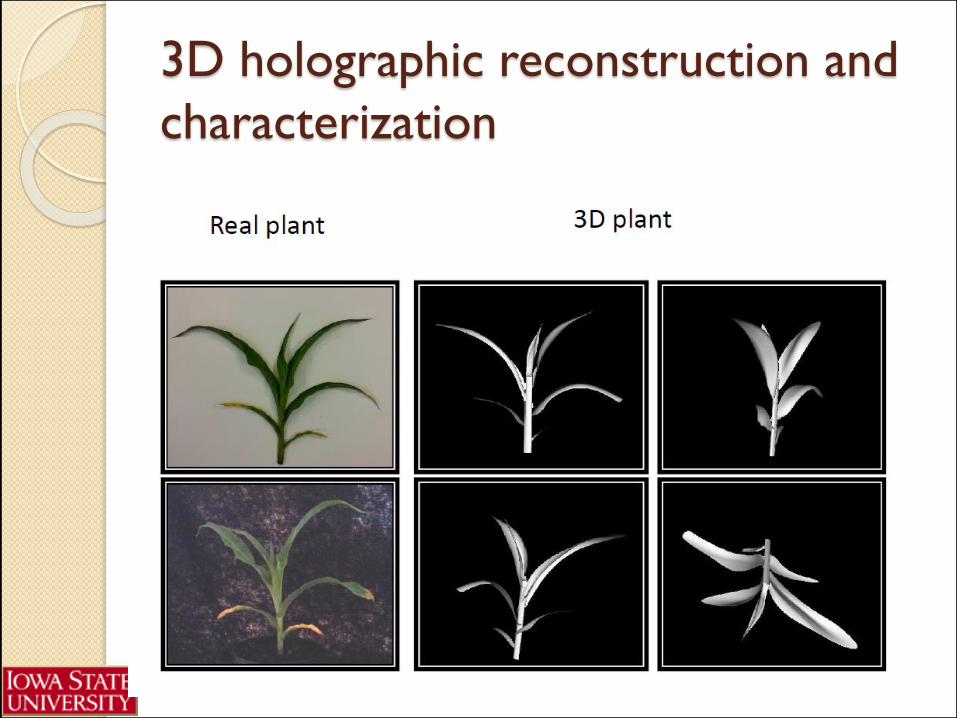
3D holographic reconstruction and
characterization
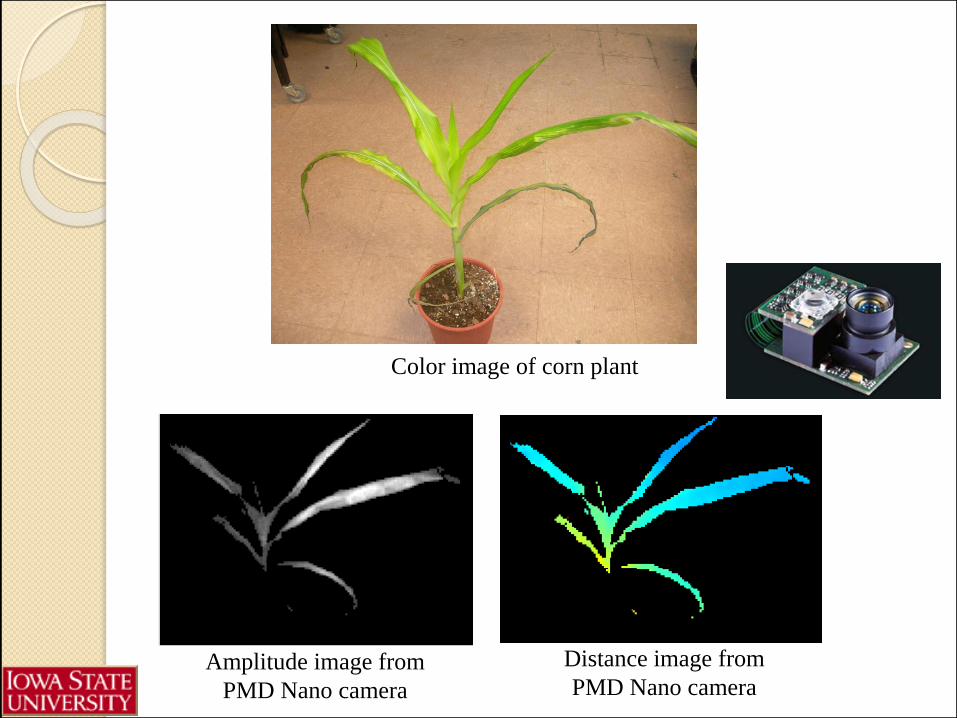
Color image of corn plant
Distance image from
PMD Nano cameraAmplitude image from
PMD Nano camera
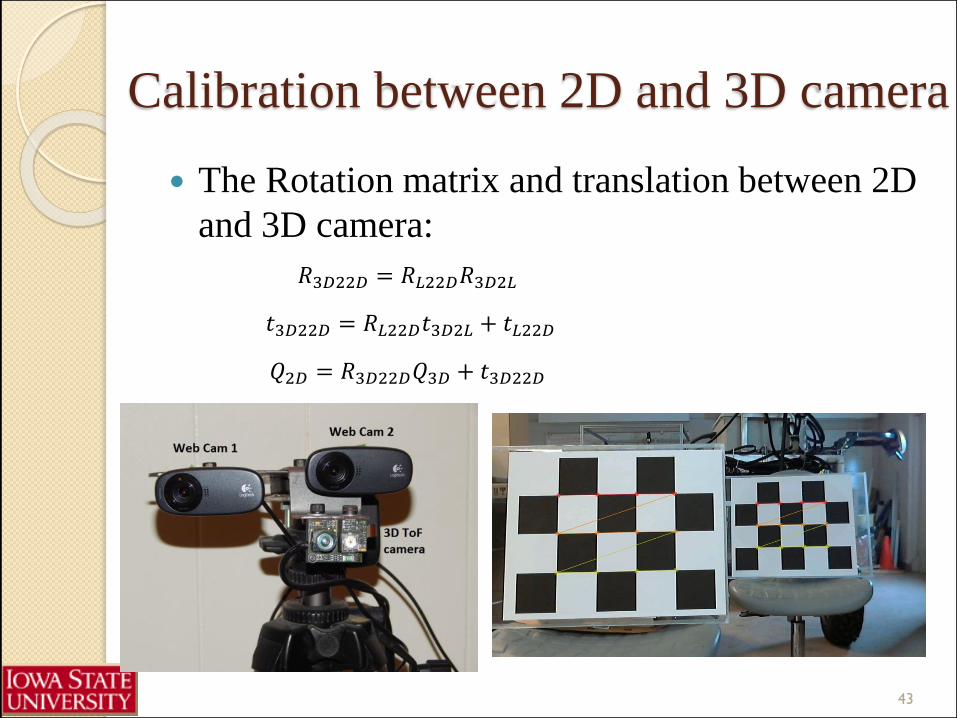
Calibration between 2D and 3D camera
The Rotation matrix and translation between 2D
and 3D camera:
𝑅3𝐷22𝐷 = 𝑅𝐿22𝐷𝑅3𝐷2𝐿
𝑡3𝐷22𝐷 = 𝑅𝐿22𝐷𝑡3𝐷2𝐿 + 𝑡𝐿22𝐷
𝑄2𝐷 = 𝑅3𝐷22𝐷𝑄3𝐷 + 𝑡3𝐷22𝐷
43
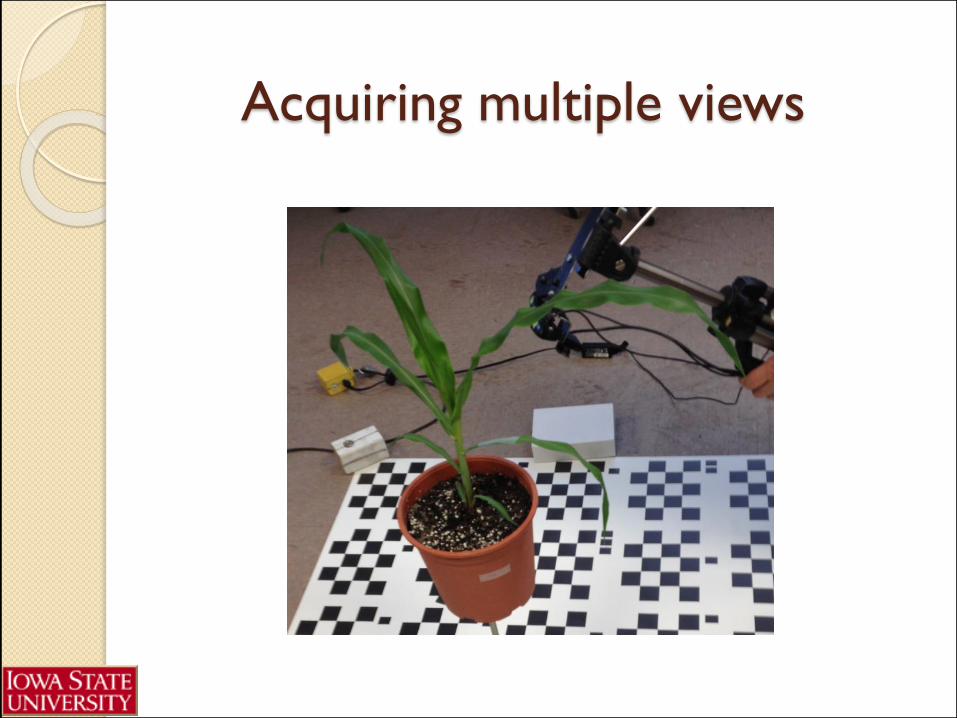
Acquiring multiple views
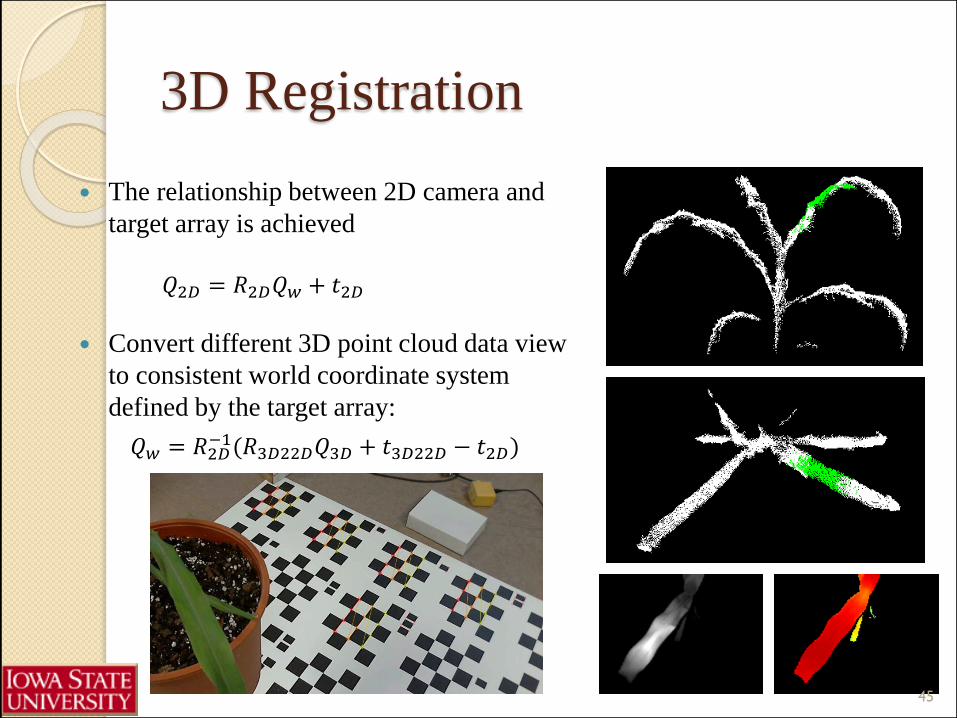
3D Registration
The relationship between 2D camera and
target array is achieved
Convert different 3D point cloud data view
to consistent world coordinate system
defined by the target array:
𝑄2𝐷 = 𝑅2𝐷𝑄𝑤 + 𝑡2𝐷
𝑄𝑤 = 𝑅2𝐷−1(𝑅3𝐷22𝐷𝑄3𝐷 + 𝑡3𝐷22𝐷 − 𝑡2𝐷)
45
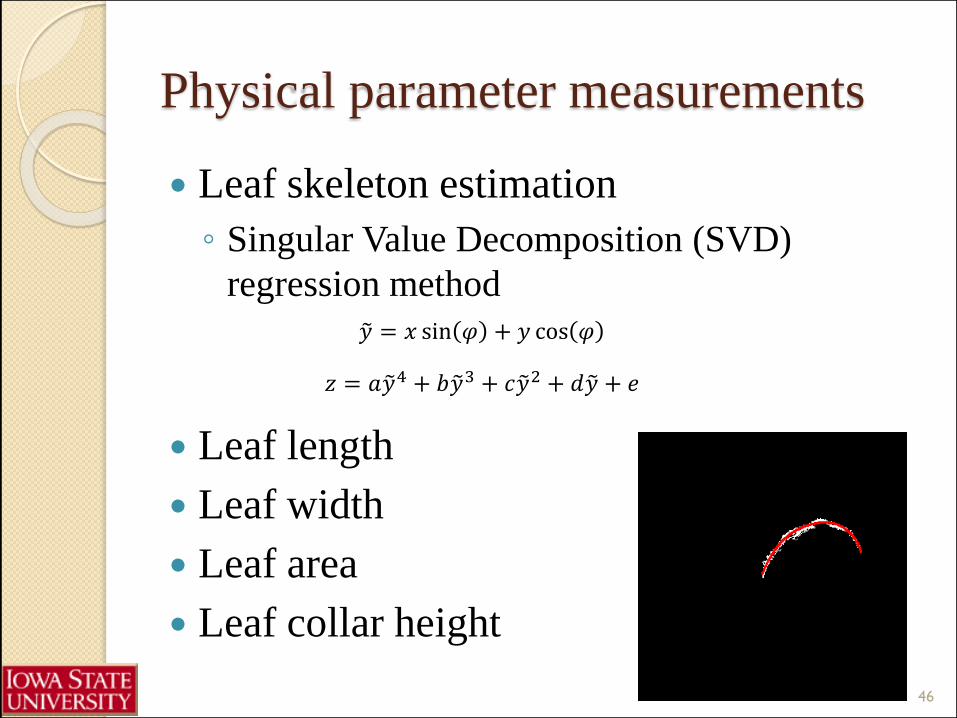
Physical parameter measurements
Leaf skeleton estimation
◦ Singular Value Decomposition (SVD)
regression method
Leaf length
Leaf width
Leaf area
Leaf collar height
𝑦 = 𝑥 sin 𝜑 + 𝑦 cos 𝜑
𝑧 = 𝑎 𝑦4 + 𝑏 𝑦3 + 𝑐 𝑦2 + 𝑑 𝑦 + 𝑒
46
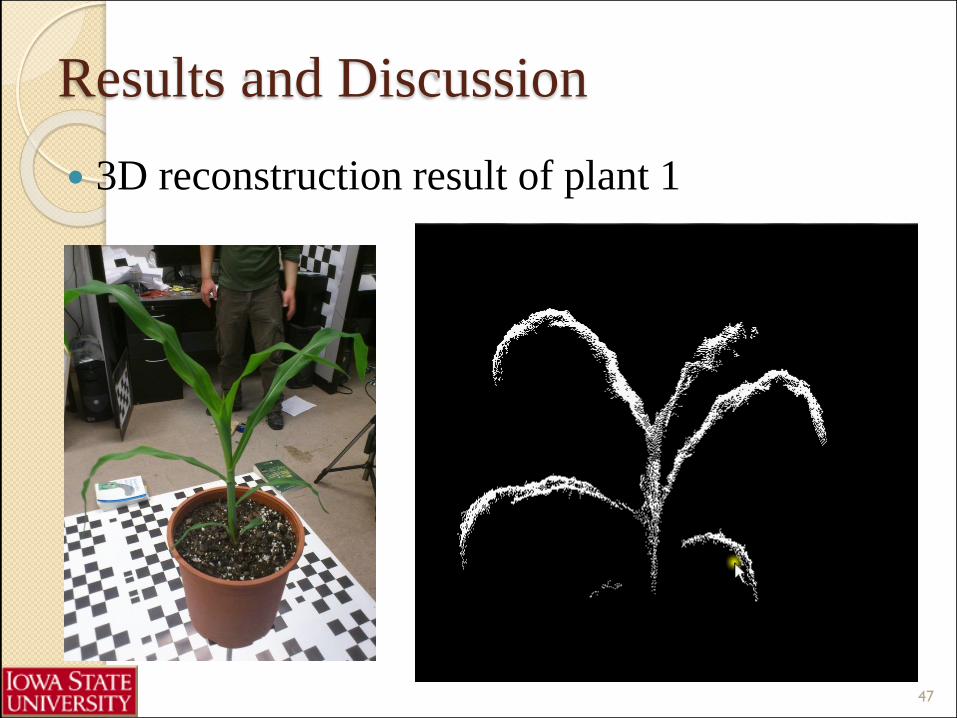
Results and Discussion
3D reconstruction result of plant 1
47
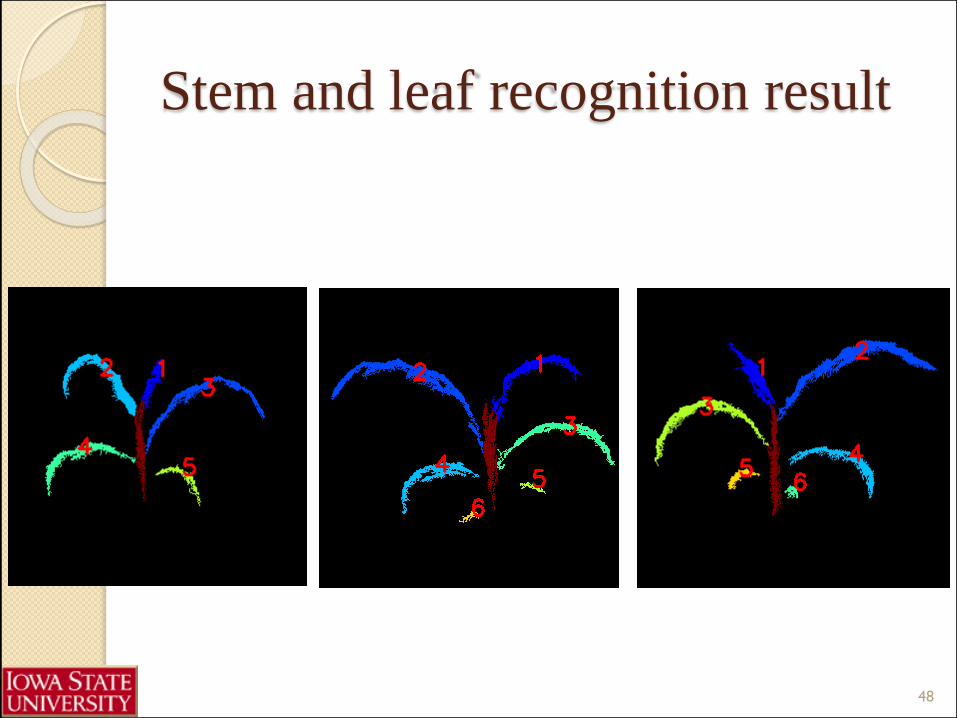
Stem and leaf recognition result
48
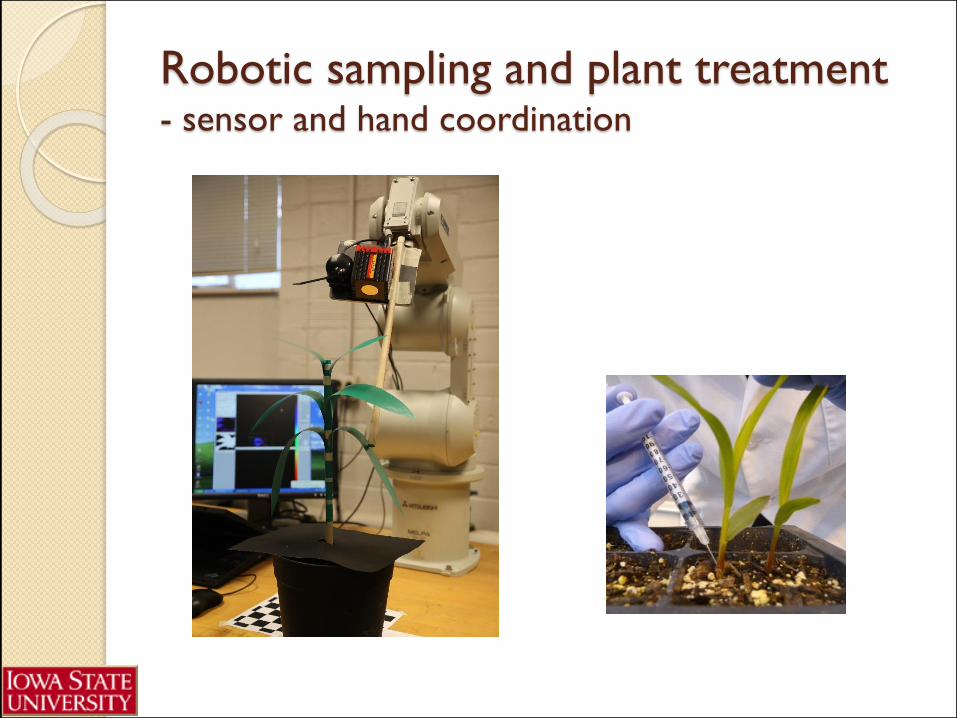
Robotic sampling and plant treatment- sensor and hand coordination
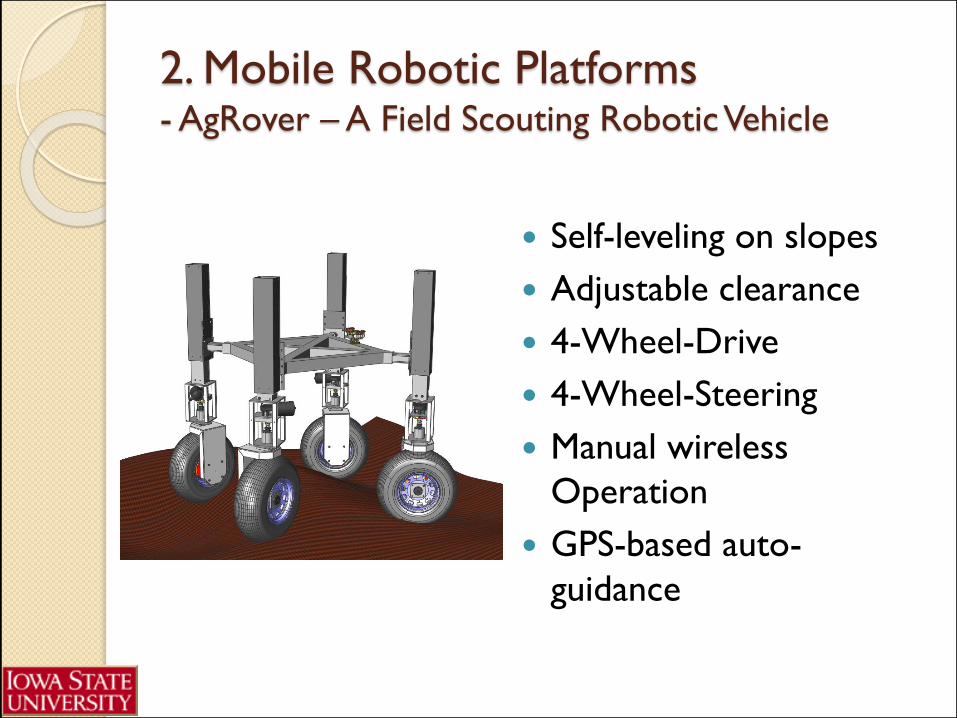
2. Mobile Robotic Platforms- AgRover – A Field Scouting Robotic Vehicle
Self-leveling on slopes
Adjustable clearance
4-Wheel-Drive
4-Wheel-Steering
Manual wireless
Operation
GPS-based auto-
guidance
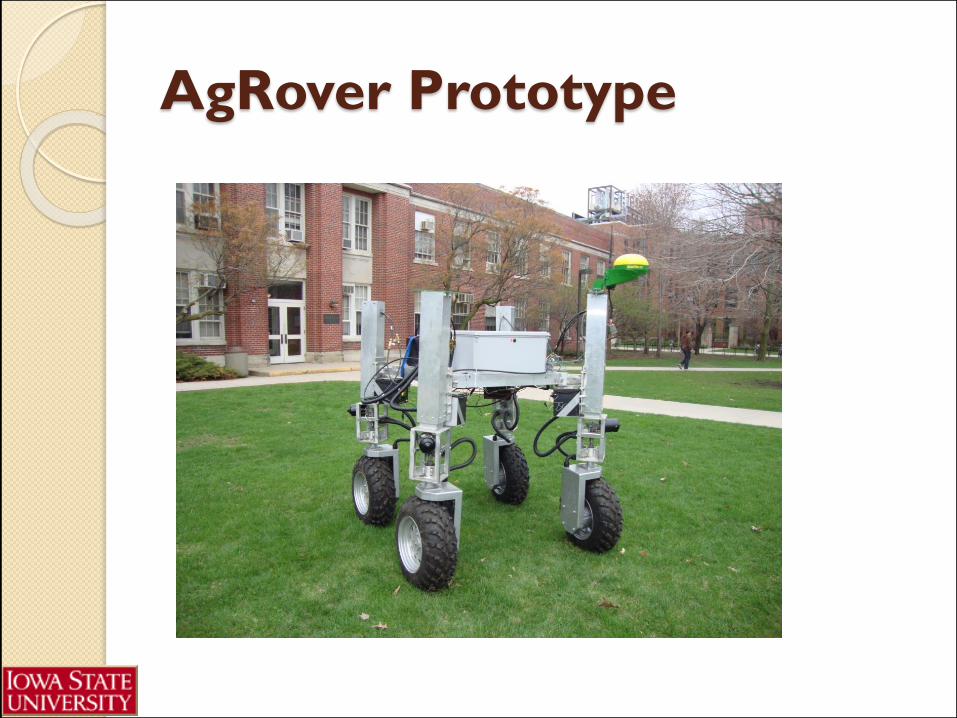
AgRover Prototype
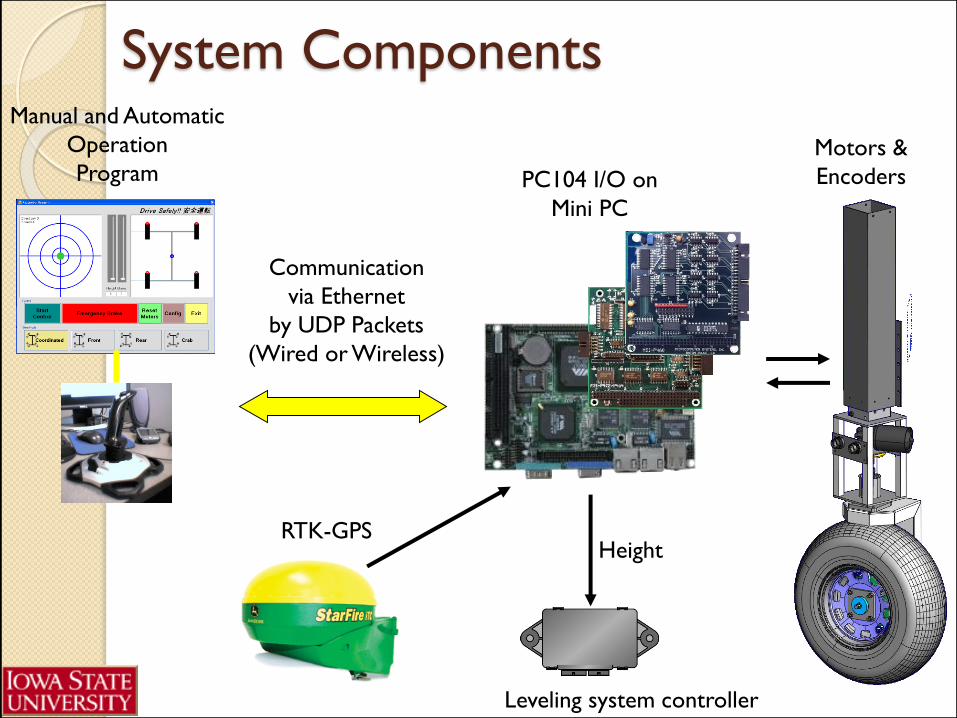
System Components
Communication
via Ethernet
by UDP Packets
(Wired or Wireless)
PC104 I/O on
Mini PC
Manual and Automatic
Operation
ProgramMotors &
Encoders
Height
Leveling system controller
RTK-GPS
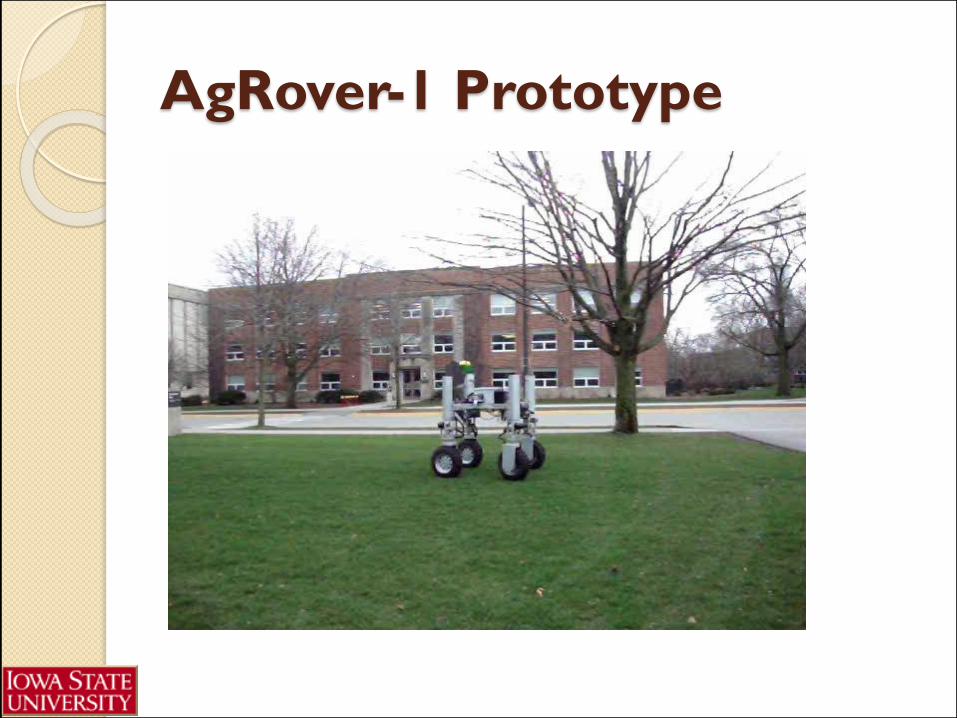
AgRover-1 Prototype
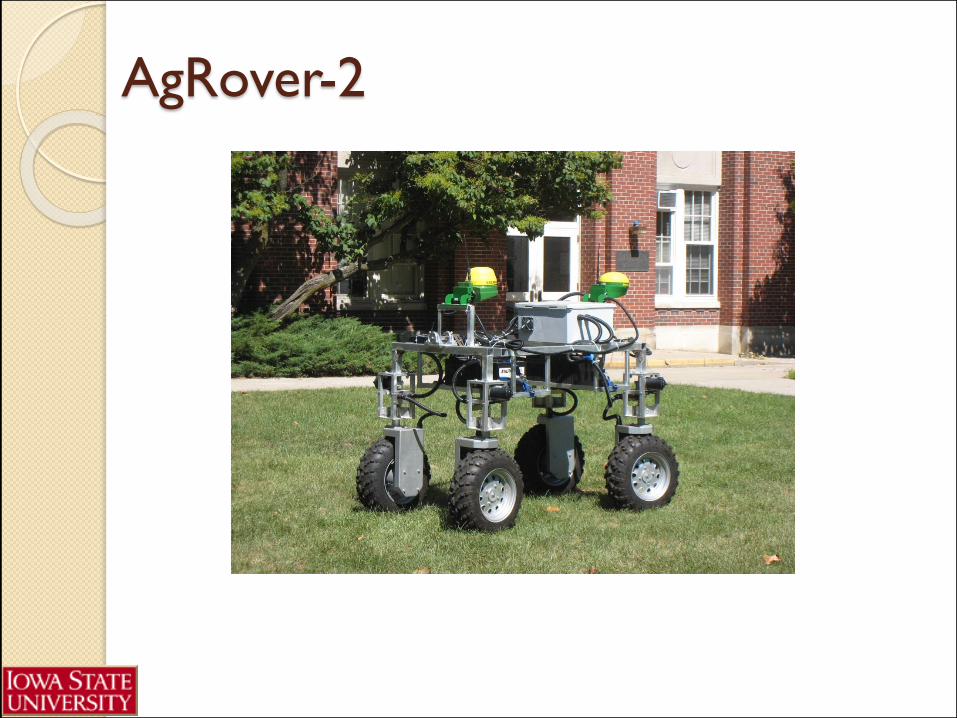
AgRover-2
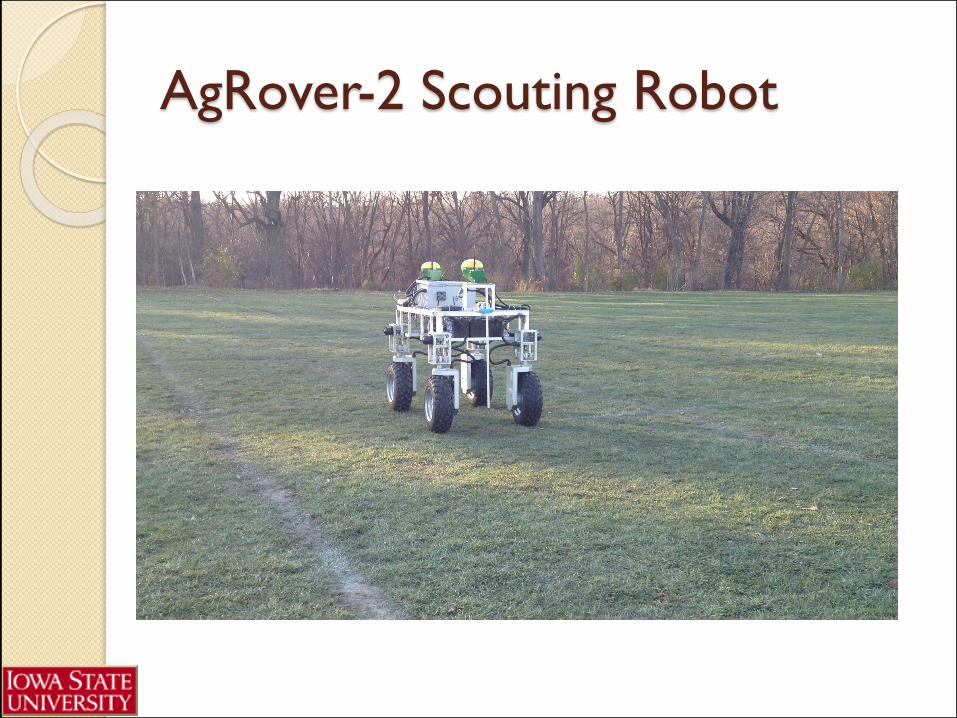
AgRover-2 Scouting Robot

Thank You!