robust design applied to manufacturing analysis
TRANSCRIPT

Purdue UniversityPurdue e-Pubs
International Compressor Engineering Conference School of Mechanical Engineering
2008
Robust Design Applied to Manufacturing AnalysisEduardo Luis GaertnerEmbraco
Follow this and additional works at: https://docs.lib.purdue.edu/icec
This document has been made available through Purdue e-Pubs, a service of the Purdue University Libraries. Please contact [email protected] foradditional information.Complete proceedings may be acquired in print and on CD-ROM directly from the Ray W. Herrick Laboratories at https://engineering.purdue.edu/Herrick/Events/orderlit.html
Gaertner, Eduardo Luis, "Robust Design Applied to Manufacturing Analysis" (2008). International Compressor Engineering Conference.Paper 1845.https://docs.lib.purdue.edu/icec/1845

1297, Page 1
International Compressor Engineering Conference at Purdue, July 14-17, 2008
Eduardo Luís GAERTNER
EMBRACO,Rua Rui Barbosa, 1020
89219-901, Joinville, SC, BrazilE-mail: [email protected]
ABSTRACT
Finite element analysis (FEA) is a common tool used within many areas of engineering to indicate the behavior of acomponent before production. However, results for most analyses only contemplate the nominal geometry, and donot take product variation during manufacturing and assembly into consideration. These differences can have asignificant effect on the structural response and thus not reach the desired performance. To eliminate these doubts, itis possible to exchange the deterministic model for a robust design. Robust design is an analytical method ofevaluating the range of product variation due to the uncertainties in the model. Based on a probabilisticcharacterization, this technique is helpful in determining product quality, predicting its behavior and deviation, notjust when everything is in nominal case. It also indicates the design variables responsible for most of the resultvariations, important for achieving a particular probabilistic level.The present work deals with the case study of a discharge tube structural response, considering the variation of somedimensions. As a result, it will be apparent which dimensions have the greatest influence on the design specificationand which tolerances can be increased in order to reduce manufacturing costs, while maintaining the balancebetween performance and cost.
1. INTRODUCTION
When designing the mechanism, it is common to calculate or simulate component behavior through stressevaluation, displacement, reacting forces, etc. Generally, component nominal dimensions are used but sometimesupper or lower limit dimensions are used. However, in practice, all part dimensions have variations, which arespecified in design and assembly procedures through the tolerance. There are many variables throughout the system:equipment clearance and stiffness, tool wear during machining, variations in raw material, temperature, etc. Thesevariations should be considered during the project as they influence product quality. And to reduce these productresponse variations means an increase in manufacturing costs, see Figure 1. For example, a project requiring acomponent with small structural variations, with narrow tolerances, demands quality manufacturing, meaning highercosts. The project tolerance specification is located in a region that meets project requirements, but also takesprocess costs into consideration.
The compressor contains a lot of parts from various manufacturing processes and tolerances, varying from foundry,injection, stamping, welding, grinding, machining, and bending, with tolerances from micrometers to millimeters.An example is the discharge tube, which is brazed in the connector, bent, inserted into the dumping spring, screwedto the manifold and then brazed to the shell connection. The function of this component is to conduct thecompressed refrigerant from the manifold to the shell. In addition to the thermodynamic characteristics, thecomponent should meet certain other requirements (Puff et al., 2006):- Natural frequencies cannot coincide with the fundamentals and harmonics of the compressor;- Static stiffness cannot be elevated; otherwise the tube transmits excessive vibration from the mechanism to theshell;- The tube cannot touch the shell or mechanical kit during operation, compressor start/stop, and stress in the tubemust be lower than fatigue failure level;
The purpose of this work is to discover the maximum possible structural variation to the discharge tube, according toproject specifications. And, furthermore, to discover which dimension tolerances could be increased to reducemanufacturing costs, with a relatively low impact on structural behavior.

1297, Page 2
International Compressor Engineering Conference at Purdue, July 14-17, 2008
Figure 1: Influence of the geometry tolerance on manufacturing costs and structural response variation.
2. NUMERICAL SIMULATION
Nowadays, engineers perform mechanical component analyses to evaluate properties, such as structural behavior.The geometries applied to those analyses are generally in their nominal values. However, it is known that alldimensions have tolerances specified in the design. Instead of just an exact response, the consideration of thosetolerances creates a range of possible product behaviors. Depending on the value of this range, it can endangerproduct application, and sometimes this evaluation is difficult to predict using traditional methods, such asconsidering all dimensions in the upper or lower limits. The function of the robust design is to determine the feasibleresponse dispersion of the product, assuming the inherent uncertainties of the process. This response is calculatedusing proper software that simulates the behavior of a component using its geometric and material properties. Theinput variables are the property tolerances, or the statistical distribution, that need to be set up.Information can be obtained from manufacturing or supplier material data sheets, the tolerance specified in thedrawing or process, etc. The robust design program then creates ‘n’ models with this set of data, each one with adifferent combination of the variables. It is important to mention that more variables imply more computationaltime. Because of the vast number of models that need to be solved, the simulation program should be integrated intothe computer aided design (CAD) program, which will provide the component geometry. The CAD model needs tobe parameterized, allowing component dimensions to be easily changed along the several automatic iterations, asdescried by Fagotti et al. (2005).
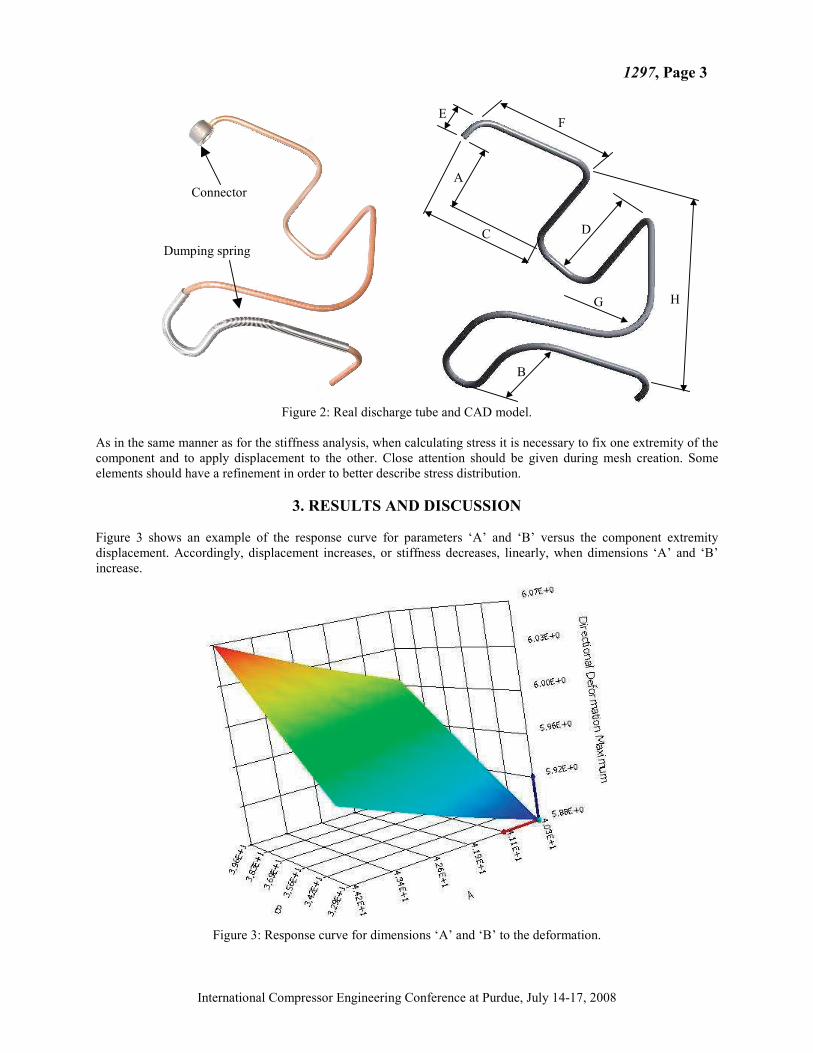
The present work is a study case of the manufacturing variations of a discharge tube, presented in Figure 2. Eightdimensions were selected to be analyzed, named here from ‘A’ to ‘H’, as shown in Figure 2, and are some of thecontrolled dimensions in the manufacturing process. The product response is the structural characteristic of the tube,according to the project requirements: natural frequency, stiffness and stress. All of which are simulated withcommercial software that uses the finite element method (FEM). In the current analysis, just the geometry of thetube is analyzed. Material property variations (density, Young Modulus, Poisson coefficient) were not taken intoconsideration and nor were the raw material dimensions (internal and external diameter). Adding those materialuncertainties, component structural response further increases as there are more variables (Capiez-Lernout et al.,2006), but material property variation is not known here.
For the model analysis, both extremities of the tube are fixed, and the natural frequencies are calculated. To reducecomputer-processing time, there is no dumping spring in the CAD or FEA model, see Figure 2. The reason for this isthat an analysis with two components requires contact elements, becoming non-linear and demanding more time tosolve the numerical model. As the dumping spring serves the effect of concentrated mass, it has been omitted andreplaced by mass elements in the simulation. The element to model the tube used in all simulations is the solid-shell,an eight-node element.
In the stiffness study, a vector force is applied at one tube edge while the other one is fixed. The stiffness iscalculated by dividing the force magnitude by its displacement result. Low stiffness means less vibrationtransmitted to the shell. Here, the dumping spring has no influence and is not considered.
1297, Page 3
International Compressor Engineering Conference at Purdue, July 14-17, 2008
Figure 2: Real discharge tube and CAD model.
As in the same manner as for the stiffness analysis, when calculating stress it is necessary to fix one extremity of thecomponent and to apply displacement to the other. Close attention should be given during mesh creation. Someelements should have a refinement in order to better describe stress distribution.
3. RESULTS AND DISCUSSION
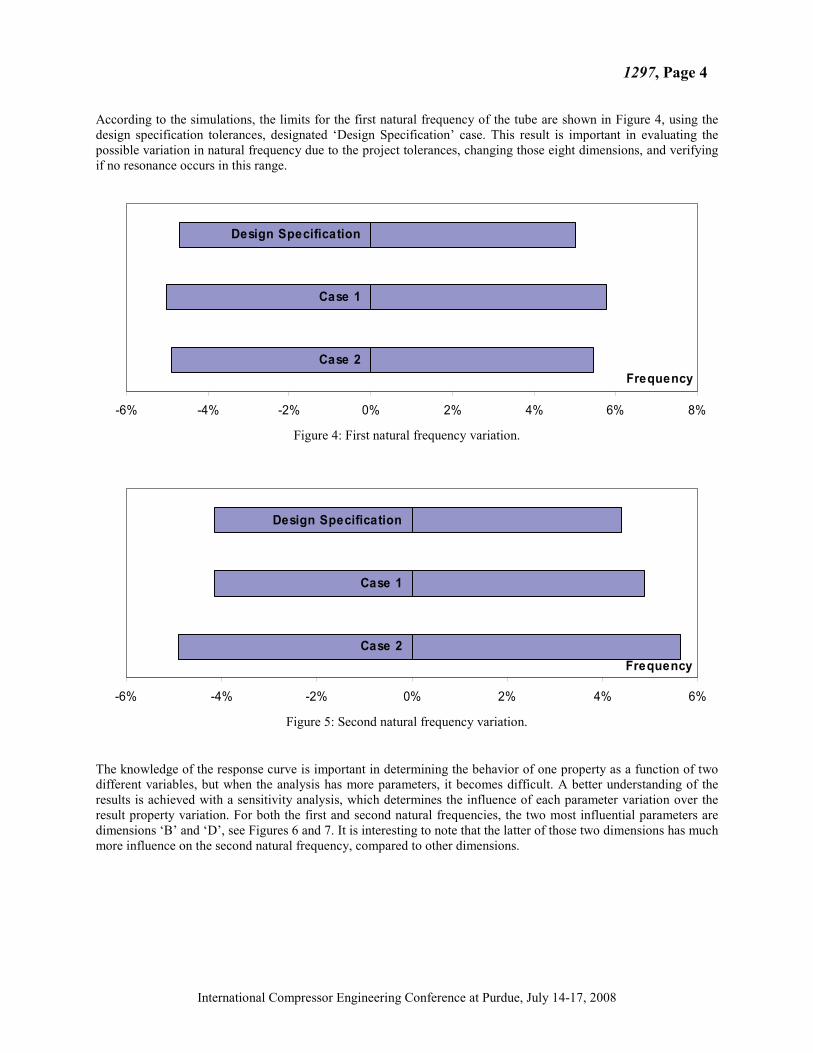
Figure 3 shows an example of the response curve for parameters ‘A’ and ‘B’ versus the component extremitydisplacement. Accordingly, displacement increases, or stiffness decreases, linearly, when dimensions ‘A’ and ‘B’increase.
Figure 3: Response curve for dimensions ‘A’ and ‘B’ to the deformation.
E
A
C
F
D
G
B
H
Connector
Dumping spring
1297, Page 4
International Compressor Engineering Conference at Purdue, July 14-17, 2008
According to the simulations, the limits for the first natural frequency of the tube are shown in Figure 4, using thedesign specification tolerances, designated ‘Design Specification’ case. This result is important in evaluating thepossible variation in natural frequency due to the project tolerances, changing those eight dimensions, and verifyingif no resonance occurs in this range.
-6% -4% -2% 0% 2% 4% 6% 8%
Case 2
Case 1
Design Specification
Frequency
Figure 4: First natural frequency variation.
-6% -4% -2% 0% 2% 4% 6%
Case 2
Case 1
Design Specification
Frequency
Figure 5: Second natural frequency variation.
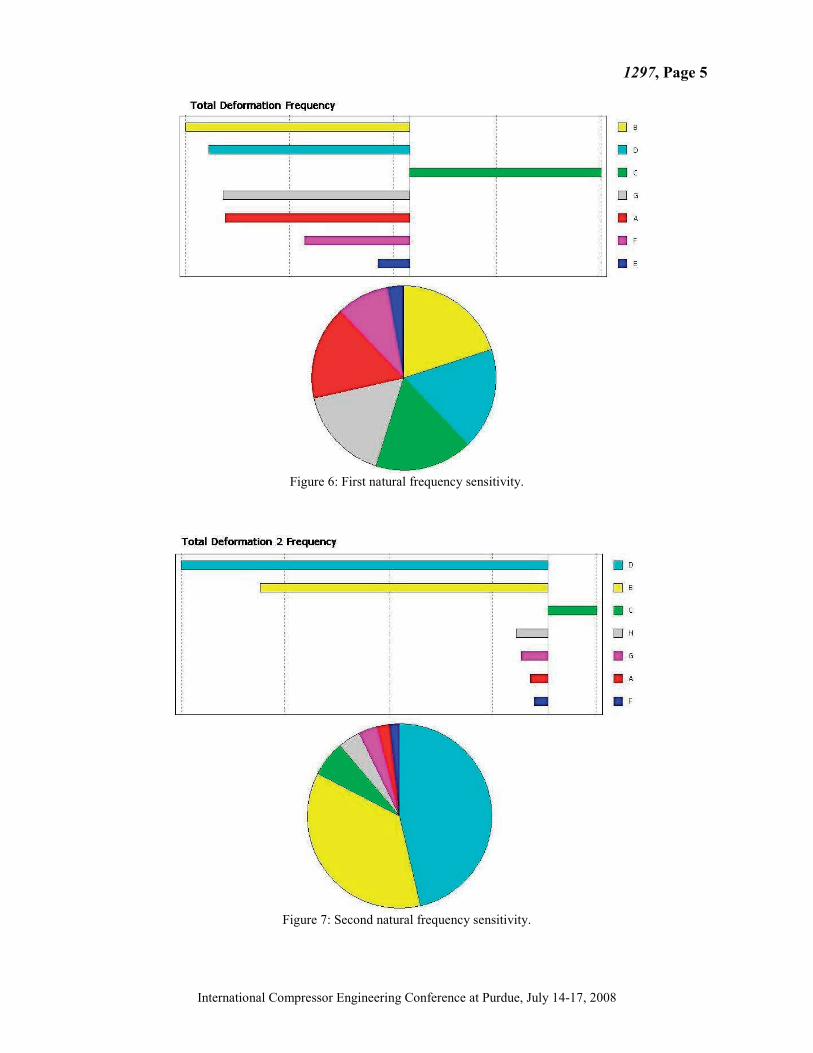
The knowledge of the response curve is important in determining the behavior of one property as a function of twodifferent variables, but when the analysis has more parameters, it becomes difficult. A better understanding of theresults is achieved with a sensitivity analysis, which determines the influence of each parameter variation over theresult property variation. For both the first and second natural frequencies, the two most influential parameters aredimensions ‘B’ and ‘D’, see Figures 6 and 7. It is interesting to note that the latter of those two dimensions has muchmore influence on the second natural frequency, compared to other dimensions.
1297, Page 5
International Compressor Engineering Conference at Purdue, July 14-17, 2008
Figure 6: First natural frequency sensitivity.
Figure 7: Second natural frequency sensitivity.
1297, Page 6
International Compressor Engineering Conference at Purdue, July 14-17, 2008
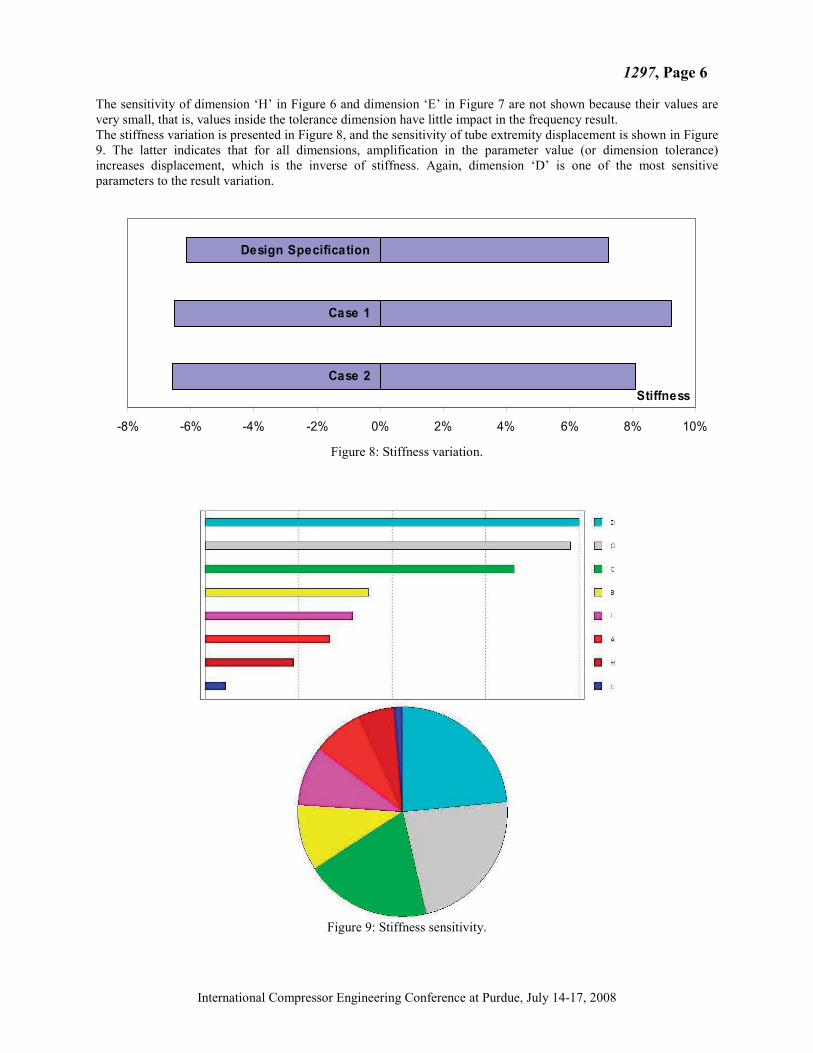
The sensitivity of dimension ‘H’ in Figure 6 and dimension ‘E’ in Figure 7 are not shown because their values arevery small, that is, values inside the tolerance dimension have little impact in the frequency result.The stiffness variation is presented in Figure 8, and the sensitivity of tube extremity displacement is shown in Figure9. The latter indicates that for all dimensions, amplification in the parameter value (or dimension tolerance)increases displacement, which is the inverse of stiffness. Again, dimension ‘D’ is one of the most sensitiveparameters to the result variation.
-8% -6% -4% -2% 0% 2% 4% 6% 8% 10%
Case 2
Case 1
Design Specification
Stiffness
Figure 8: Stiffness variation.
Figure 9: Stiffness sensitivity.

1297, Page 7
International Compressor Engineering Conference at Purdue, July 14-17, 2008
In the stress analysis, the first curve near the manifold connection presents the maximum stress, as shown in Figure10. The stress variation from the robust design method is presented in Figure 11. According to data and other tests,values are low compared to the fatigue limit for this material, and the tube has a good safety factor.
Figure 10: Stress distribution in the maximum value region.
-8% -6% -4% -2% 0% 2% 4% 6% 8%
Design Specification
Stress
Figure 11: Stress variation.
According to the robust design sensitivity graphs, ‘D’ is the tolerance dimension with the greatest influence on theresponse variation in natural frequency and stiffness. Based on this result, one can determine which dimensiontolerances need to have more control in production; in this case it is ‘D’. On the other hand, variables ‘A’, ‘E’, ‘F’and ‘H’ have a lower influence. If a cost reduction activity were applied in the manufacture, and some tolerancesneeded to be enlarged to meet a process demand, dimensions ‘A’, ‘E’, ‘F’ and ‘H’ would be good candidates. Toevaluate this idea, another analysis was performed, denominated ‘Case 1’. The above tolerances were increased by50%, causing an increase in geometry variation. In the same way, another study was created, but this time justdimension ‘D’ was increased by 50%, denominated ‘Case 2’. The results of behavior variation are shown in Figures4, 5 and 8, for first and second natural frequency, and stiffness, respectively.
Comparing Figures 4 and 5, one can see that the second natural frequency range in Case 2 is larger than in Case 1.The opposite is true in the first natural frequency, because the dimension tolerance ‘D’ has more influence on thesecond natural frequency, as shown in Figures 6 and 7. Based on the results, if the project allows a higher level ofstructural variation, it is more convenient to increase tolerances ‘A’, ‘E’, ‘F’ and ‘H’ than just tolerance ‘D’, thusreducing process control and costs.
1297, Page 8
International Compressor Engineering Conference at Purdue, July 14-17, 2008
4. CONCLUSIONS
During the project, deterministic analyses are important in estimating the behavior of a component in nominalgeometry, before prototyping or manufacturing it. But at a certain stage, it is necessary to specify process andassembling tolerances. With a robust design analysis one can determinate the lower and upper structural limits for asingle piece or the whole system. In this work, a compressor discharge tube is analyzed and the feasible extremes fornatural frequency, stiffness and stress are determined, using the design specification tolerances.The most influential dimensions on the structural response are also determined in the current design specification.With this information, one can determine which tolerances could be enlarged in order to reduce manufacturing costs,with low impact on product behavior.
REFERENCES
ANSYS 11.0 User Guide Manual.
Puff, R., de Bortoli, M. G. D., Bosco Jr., R. Gaertner, E., 2006, The Use of CAD/CAE Tools in CompressorDevelopment Focusing Structural Analysis, International Compressor Engineering Conference at Purdue.
Capiez-Lernout, E., Pellissetti, M., Pradlwarter, H., Schueller, G. I., Soize, C., 2006, Data and Model Uncertaintiesin Complex Aerospace Engineering Systems, Journal of Sound and Vibration, vol. 295, no. 3-5: p. 923-938.
Fagotti, F, de Bortoli, M. G. D., Silveira, M., Bosco Jr., R., 2005, The Virtual Compressor and the ConcurrentEngineering Environment, International Conference on Compressors and Their Systems.