robust, high-throughput solution for blood group · pdf filerobust, high-throughput solution...
TRANSCRIPT
Robust, High-Throughput Solution for Blood GroupGenotyping
Gaelle C. Le Goff,† Jean-Charles Bres,‡ Dominique Rigal,‡ Loıc J. Blum,† andChristophe A. Marquette*,†
Equipe Genie Enzymatique, Membranes Biomimetiques et Assemblages Supramoleculaires, Institut de Chimie etBiochimie Moleculaires et Supramoleculaires, CNRS 5246 ICBMS, Universite Lyon 1, Batiment CPE, 43 bd du 11novembre 1918, 69622 Villeurbanne Cedex, and Etablissement Francais du Sang Rhone-Alpes, Lyon, France
With the concomitant increase of blood transfusions andsafety rules, there is a growing need to integrate high-throughput and multiparametric assays within bloodqualification centers. Using a robust and automatedsolution, we describe a new method for extended bloodgroup genotyping (HiFi-Blood 96) bringing together thethroughput possibilities of complete automation and themicroarray multiplexed analysis potential. Our approachprovides a useful resource for upgrading blood qualifica-tion center facilities. A set of six single-nucleotide poly-morphisms (SNPs) associated with clinically importantblood group antigens (Kell, Kidd, Duffy, and MNS sys-tems) were selected and the corresponding genotypingassays developed. A panel of 293 blood samples was usedto validate the approach. The resulting genotypes werecompared to phenotypes previously determined by stan-dard serologic techniques, and excellent correlations werefound for five SNPs out of six. For the Kell, Kidd, Duffy,and MNS3/MNS4 systems, high matching percentages of100%, 98.9%, 97.7%, and 97.4% were obtained, respec-tively, whereas a concordance percentage of 83.3% onlywas attained for the MNS1/MNS2 polymorphism.
Blood bank qualification’s mainspring is to secure and ac-curately characterize donations. Therefore, the highest prioritiesof testing procedures are without doubt safety and reliability.1
However, because the massive amount of incoming samplesbrings blood testing to an industrial scale, safety is not the onlyconcern: cost and throughput are also major factors to take intoaccount. The average numbers of 20 million blood donations peryear in Europe and 14 million in the United States2 illustrate thehigh-throughput demands that blood qualification centers haveto face. The decision to include new testing procedures into theblood qualification chain relies then on a debate between clinicalprevalence and cost-benefit analysis.3 With those expectations,any new technology candidate should not only be scientifically
mature and increase safety, but also be low-cost and perfectlycompatible with existing structures and automated standards.4
Extended blood group typing is a serious candidate forupgrading blood testing procedures in the short term.5 Inproviding a better characterization of a blood bank, it enables abetter matching between donors and patients and increasestransfusion safety. However, extended typing is still an occasionaltesting procedure, and blood donations are currently typed foronly a few (ABO, Rhesus, and Kell) of the 29 known human bloodgroups, although other minor groups are known to be clinicallysignificant.1,6
Routine blood typing is currently processed by blood banksusing serological methods, i.e., the identification of specific surfaceantigens on patient’s red blood cells (phenotype). Nevertheless,these standard agglutination techniques reveal certain limitations:3,7
cost, shortage and weak reactivity of some reagents, and labor-intensive monoparametric assays unsuitable for large-scale auto-mated screening (Figure 1).
Here, molecular biology techniques used in conjunction withmultiparametric microarray technologies were identified as thealternative to serology, which will bring high-throughput extendedblood typing into blood donation testing procedures.8,9 Indeed,genetic-based methods for blood testing are rising10 thanks tothe accumulated knowledge of the molecular basis of human bloodgroups.11,12 Most of the 300 antigens already identified6 resultfrom single-nucleotide polymorphisms (SNPs),13 which providean opportunity to directly identify blood group antigens at the DNA
* To whom correspondence should be addressed. E-mail:[email protected], [email protected].
† Universite Lyon 1.‡ Etablissement Francais du Sang Rhone-Alpes.
(1) Anstee, D. J. Blood 2009, 114, 248–256.(2) WHO Report, 2007. World Health Organization Web Site. http://www.
who.int/mediacentre/factsheets/fs279/en/index.html.(3) Petrik, J. Biologicals 2010, 38, 2–8.
(4) Westhoff, C. M.; Sloan, S. R. Clin. Chem. 2008, 54, 1948–1950.(5) Denomme, G. A.; Flegel, W. A. Transfusion 2008, 48, 2461–2475.(6) Poole, J.; Daniels, G. Transfus. Med. Rev. 2007, 21, 58–71.(7) Avent, N. D. Br. J. Haematol. 2009, 144, 3–13.(8) Veldhuisen, B.; van der Schoot, C. E.; de Haas, M. Vox Sang. 2009, 97,
198–206.(9) van der Schoot, C. E.; de Haas, M.; Engelfriet, C. P.; Reesink, H. W.; Panzer,
S.; Jungbauer, C.; Schwartz, D. M. W.; Mayr, W. R.; Castilho, L.; St-Louis,M.; Long, A.; Denomme, G.; Semple, E.; Fernandes, B.; Flegel, W. A.;Wagner, F.; Doescher, A.; Poli, F.; Villa, M. A.; Paccapelo, C.; Karpasitou,K.; Veldhuisen, B.; Nogues, N.; Muniz-Diaz, E.; Daniels, G.; Martin, P.;Finning, K.; Reid, M. E. Vox Sang. 2009, 96, 167–179.
(10) Wu, Y. Y.; Csako, G. Clin. Chim. Acta 2006, 363, 165–176.(11) Logdberg, L.; Reid, M. E.; Lamont, R. E.; Zelinski, T. Transfus. Med. Rev.
2005, 19, 45–57.(12) Reid, M. E.; Lomas-Francis, C. The Blood Group Antigen FactsBook, 2nd
ed.; Academic Press: New York, 2004.(13) Daniels, G. Transplant Immunol. 2005, 14, 143–153.
Anal. Chem. 2010, 82, 6185–6192
10.1021/ac101008d 2010 American Chemical Society 6185Analytical Chemistry, Vol. 82, No. 14, July 15, 2010Published on Web 06/18/2010

level by targeting the two specific allele sequences associated witheach SNP.14
The emergence of blood group genotyping technologies15-22
confirms the belief of technologists and clinicians that blood groupgenotyping assays shall in the future improve transfusion safety,providing a multiplexed solution compatible with a high-through-put format.7,23 Most reported techniques work on a combinationof a multiplex PCR amplification step of target sequences with adedicated hybridization support to detect specific antigen se-quences and have returned very encouraging results when appliedto mass-scale studies. Several blood group genotyping productsare already commercialized, with two major platforms available:the BLOODChip (Progenika, Spain),24 developed by the EuropeanBLOODGen Consortium, which enables testing of 128 SNPs(including additional human platelet antigens) on a glass slidearray support, and the HEA BeadChip (BioArray Solutions),18,19
developed by the CBGG consortium coordinated by the New YorkBlood Center, targeting 18 SNPs using bead array technology.However, the downside of most of the already developed methodsis a technology often expensive and seldom easy to handle. These
techniques remain then more suitable for research purposes thanfor high-throughput industrial use and integration within bloodsupply processes.
We are proposing here an affordable technological solutionfor multiplexed blood group genotyping, answering the blood bankrequirements in terms of safety, automation, and throughput. Thisanalytical tool displays a nonconventional design combining theformat of a membrane-bottomed 96-well plate with the multipara-metric performance of microarrays (Figure 2a). The systemvalidation conducted on a medium-scale cohort of 293 blooddonation samples for a set of 6 target single-nucleotide polymor-phisms will be presented.
EXPERIMENTAL SECTIONMaterials. Synthetic oligonucleotide probes and primers were
supplied by Eurogentec (Belgium). The sequence and length ofthe six couples of probes and primers (two per SNP) werepreviously optimized by the Etablissement Francais du SangRhone-Alpes (the six associated SNPs are described in Table 1).For intellectual property reasons, probe and primer sequenceswill not be described here. Alkaline phosphatase-labeled strepta-vidin and BCIP/NBT ready-to-use solution were purchased fromSigma-Aldrich (France).
HiFi-Blood 96 Plate Preparation. For HiFi-Blood 96 (AXO-Science, France, http://www.axoscience.com) plate preparation,original membrane-bottomed 96-well plates (Multiscreen HTS-HA)were purchased from Millipore. Twelve oligonucleotide probes(17-mer to 23-mer) specific for the targeted alleles (two probesper SNP, two replicates per probe) and three control probes (forspotting, hybridization, and negative control; four replicates perprobe) were arrayed on the membrane backside surface in a 6 ×6 matrix format with a spot-to-spot pitch of 500 µm (one matrixper well). The spotting (sciFLEXARRAYER S3, SCIENION,Germany) procedure was performed using 2.5 nL drops of 50µmol ·L-1 probe solutions in PBS (100 mmol ·L-1, pH 7.4).Arrayed plates were stored at room temperature and used upto 6 months after spotting.
(14) Quill, E. Science 2008, 319, 1478–1479.(15) Daniels, G.; van der Schoot, C. E.; Gassner, C.; Olsson, M. L. Vox Sang.
2009, 96, 337–343.(16) Denomme, G. A.; Van Oene, M. Transfusion 2005, 45, 660–666.(17) Drago, F.; Karpasitou, K.; Poli, F. Transfus. Med. Hemother. 2009, 36, 157–
160.(18) Hashmi, G.; Shariff, T.; Seul, M.; Vissavajjhala, P.; Hue-Roye, K.; Charles-
Pierre, D.; Lomas-Francis, C.; Chaudhuri, A.; Reid, M. E. Transfusion 2005,45, 680–688.
(19) Hashmi, G.; Shariff, T.; Zhang, Y.; Cristobal, J.; Chau, C.; Seul, M.;Vissavajjhala, P.; Baldwin, C.; Hue-Roye, K.; Charles-Pierre, D.; Lomas-Francis, C.; Reid, M. E. Transfusion 2007, 47, 736–747.
(20) Hopp, K.; Weber, K.; Bellissimo, D.; Johnson, S. T.; Pietz, B. Transfusion2010, 50.
(21) Karpasitou, K.; Drago, F.; Crespiatico, L.; Paccapelo, C.; Truglio, F.; Frison,S.; Scalamogna, M.; Poli, F. Transfusion 2008, 48, 505–512.
(22) Montpetit, A.; Phillips, M. S.; Mongrain, I.; Lemieux, R.; St-Louis, M.Transfusion 2006, 46, 841–848.
(23) Avent, N. D. Transfus. Clin. Biol. 2007, 14, 10–15.(24) Avent, N. D.; Martinez, A.; Flegel, W. A.; Olsson, M. L.; Scott, M. L.; Nogues,
N.; Pisacka, M.; Daniels, G.; van der Schoot, E.; Muniz-Diaz, E.; Madgett,T. E.; Storry, J. R.; Beiboer, S. H.; Maaskant-van Wijk, P. A.; von Zabern, I.;Jimenez, E.; Tejedor, D.; Lopez, M.; Camacho, E.; Cheroutre, G.; Hacker,A.; Jinoch, P.; Svobodova, I.; de Haas, M. Transfusion 2007, 47, 40S–46S.
(25) Daniels, G. L.; Fletcher, A.; Garratty, G.; Henry, s.; Jorgensen, J.; Judd,W. J. Vox Sang. 2004, 87, 304–316.
Figure 1. (Left) Blood donation qualification process. The donor’s bloodsstored in the blood banksand receiver’s blood are typed for a bettermatching to avoid transfusion adverse reactions. (Right) Comparison of blood group phenotyping and extended genotyping strategies.
6186 Analytical Chemistry, Vol. 82, No. 14, July 15, 2010

Sample Selection. Whole blood samples (EDTA anticoagu-lant) were collected (with informed consent) from the Etablisse-ment Francais du Sang Rhone-Alpes. Samples were randomlypicked among the blood bank and belonged in majority to theCaucasian ethnic group.
Selected donors were phenotyped using standard serologichemagglutination techniques at the Etablissement Francais duSang Rhone-Alpes. Complementary extended genotyping for theDuffy system was performed on four samples using a multiplexPCR SNaPshot genotyping method at the Laboratoire d’HematologieMoleculaire of the Etablissement Francais du Sang Alpes-Medi-terranee.
HiFi-Blood 96 Assay. Genomic DNA was extracted from theblood sample using a MagNa Pure LC pure robot and MagNaPure LC DNA Isolation Kit 1 (Roche Diagnostics). Twelvesequences hosting the six target polymorphisms were amplifiedand labeled using a single 96-well format multiplex PCR on aTProfessional thermal cycler (Biometra, Germany). Forwardprimers were labeled with biotin at their 5′ end. PCR productswere controlled using electrophoresis (2% agarose gel with 190V for 20 min).
HiFi-Blood 96 filtration assay was carried out on an EVO75robot (TECAN, Switzerland) equipped with a plate filtration unitand a heater. The 96-well PCR plates were directly transferred tothe robot (without further purification).
The automated protocol took place as follows (60 min perplate): The membranes were washed with 400 µL of PBS (100mmol ·L-1, pH 7.4) and saturated for 10 min at room temper-ature with 200 µL of PBSTA (PBS, Tween 20 0.1% (v/v), BSA1% (w/v)). Meanwhile, the samples were diluted (1:5) in a 20µg ·mL-1 solution of streptavidin-alkaline phosphatase conju-gates in PBSTA and preincubated for 10 min at 50 °C. Thesamples were then transferred to the HiFi-Blood 96 platemicrowells and incubated for 10 min at 50 °C on the membranefor hybridization and labeling. The membranes were washedwith 400 µL of veronal saline buffer (100 mmol ·L-1, pH 8.5),and 200 µL of a BCIP/NBT ready-to-use solution was addedper well followed by incubation for 15 min at room temperature.The original color of the BCIP/NBT solution was yellow. Thepurple product of the enzymatic reaction precipitates on positivespots. The test result has to be read under the plate: themicrotiter plate bottom was then imaged using an ordinaryflatbed scanner (HP Scanjet 3770, Hewlett-Packard) in gray-scale (from 0 to 65535 arbitrary units (AU)), and the imagewas analyzed for genotype determination using GenePix Pro6.0 software (Molecular Devices). The signal intensity per spotwas calculated as the median intensity for all pixels includedin the circular feature defining the spot and corrected using alocal background evaluation (first figure in the SupportingInformation). The resulting net specific intensity I(Ai) of a givenallele Ai was calculated as the mean intensity for all spotreplicates of that allele.
Result Quality Control Points. For the quality control issue,samples were processed twice when one of the following observa-tions occurred: (i) wrong or insufficient response of control spots;(ii) wrong or insufficient response in the PCR control well; (iii)insufficient signal-to-noise ratio (for the SNP associated withMNS1/MNS2 antigens, positive feature signal <1000 AU; for other
SNPs, positive feature signal <5000 AU); (iv) spot homogeneityof less than 80%; (v) replicate spot coefficient of variabilityexceeding 20%.
RESULTS AND DISCUSSION
In the analytical system proposed here, the membrane bottomof the 96-well microtiter plate plays a double role: on one hand, itenables a filtering protocol for processing samples and reagents,and on the other hand, it is the immobilization support foroligonucleotide probe arrays (one 5 mm2 array per well, 6 × 6spots, twelve specific probes, and three controls). Thanks tothis layout, 96 parallel multiparametric high-throughput filteringassays (HiFi assays) can be performed on 96 different pre-treated blood samples (one sample per well), providinginformation on six different parameters (six genotypes) in asingle run (Figure 2a).
The pros of the technology are (i) a multiplex PCR samplepreparation, (ii) an automated and generic platform for multipara-metric high-throughput assays, (iii) a spotting procedure on thebackside of the microtiter plate membrane bottom useful for easyimaging of the arrays, (iv) a cost-efficient colorimetric staining/quantitative detection of the positive results on each spot, and(v) a filtering protocol increasing the interactions between targetsand immobilized probes and lowering the assay background(Figure 2b). The stained result plate is imaged using a simpleflatbed scanner that reduces drastically the detection costs whencompared with the expensive instrumentation required for lumi-nescent techniques (second figure in the Supporting Information).The whole protocol (sample preparation and filtering assay) isfully automated, and 4 h is sufficient to test 96 whole bloodsamples for a set of 6 SNPs.
The probe set was here limited to a medium-size selection ofsix SNPs, to focus on the development and optimization of thesupport and the automated protocol. Those six polymorphismswere selected for their clinical relevancy1,6 toward the Caucasianethnic groupswhich is by far the most represented in Europesand are associated with the four minor blood group systems Kell,Kidd, Duffy, and MNS. The polymorphisms and the notations forthe corresponding antigens and alleles are detailed in Table 1.Twelve oligonucleotide sequences (17-mer to 23-mer) weredesigned as specific probes for those polymorphisms (two probesper SNP, one per allele) and included in the sensing array (Figure2b).
Determination of Cutoff Values for HiFi Genotyping Assay.Ideally, a qualitative test would be sufficient to identify a patient’sgenotype, a positive coloration appearing only in the presence ofthe allele in the patient’s genome. However, because those bloodgroup polymorphisms concern a single nucleotide (SNP), a non-negligible percentage of mismatch occurs, resulting in “falsepositive” signals. The absence of fully negative results (white spotof the probe) in Figure 2b and the second figure in the SupportingInformation illustrates that fact. To optimize the match/mismatchsignal ratio, the operating temperature was brought to 50 °C tofavor matching pairs (third figure in the Supporting Information).Nevertheless, since mismatches cannot be totally avoided, asemiquantitative analysis was still required and performed througha quantitative comparison of the grayscale intensity levels of bothalleles for a given SNP.
6187Analytical Chemistry, Vol. 82, No. 14, July 15, 2010
Indeed, genotype assignment for each SNP (associated withthe two alleles A1 and A2) was evaluated from the calculation ofa Pscore discrimination parameter as explained in the followingequation, where I(A1) and I(A2) refer to the median spotintensity for a given allele corrected with local backgroundsubtraction (see the Experimental Section):
Pscore )I(A2) - I(A1)I(A2) + I(A1)
(1)
Depending on the patient’s genotype, Pscore values range in threedifferent clusters (ideally around -1, 0 and +1). Our strategywas to analyze a first batch of samples of known phenotypesand to use the resulting empiric data set for the determinationof cutoff limit values used in the final analysis device.
A preliminary study on a panel of 96 blood samples was thenconducted to evaluate the microarray reproducibility, the absenceof well to well cross-contamination, the quality control manage-
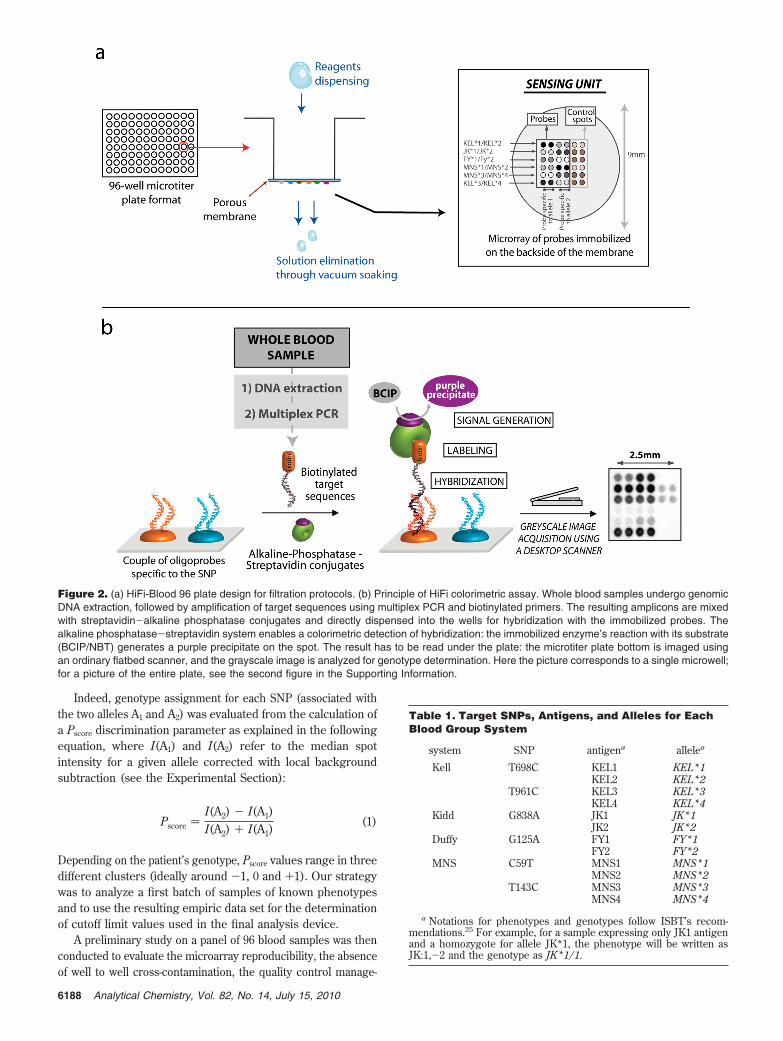
Figure 2. (a) HiFi-Blood 96 plate design for filtration protocols. (b) Principle of HiFi colorimetric assay. Whole blood samples undergo genomicDNA extraction, followed by amplification of target sequences using multiplex PCR and biotinylated primers. The resulting amplicons are mixedwith streptavidin-alkaline phosphatase conjugates and directly dispensed into the wells for hybridization with the immobilized probes. Thealkaline phosphatase-streptavidin system enables a colorimetric detection of hybridization: the immobilized enzyme’s reaction with its substrate(BCIP/NBT) generates a purple precipitate on the spot. The result has to be read under the plate: the microtiter plate bottom is imaged usingan ordinary flatbed scanner, and the grayscale image is analyzed for genotype determination. Here the picture corresponds to a single microwell;for a picture of the entire plate, see the second figure in the Supporting Information.
Table 1. Target SNPs, Antigens, and Alleles for EachBlood Group System
system SNP antigena allelea
Kell T698C KEL1 KEL*1KEL2 KEL*2
T961C KEL3 KEL*3KEL4 KEL*4
Kidd G838A JK1 JK*1JK2 JK*2
Duffy G125A FY1 FY*1FY2 FY*2
MNS C59T MNS1 MNS*1MNS2 MNS*2
T143C MNS3 MNS*3MNS4 MNS*4
a Notations for phenotypes and genotypes follow ISBT’s recom-mendations.25 For example, for a sample expressing only JK1 antigenand a homozygote for allele JK*1, the phenotype will be written asJK:1,-2 and the genotype as JK*1/1.
6188 Analytical Chemistry, Vol. 82, No. 14, July 15, 2010
ment, and the Pscore cutoff values useful for a reliable genotypedetermination.
The 96 blood samples of known phenotype were randomlypicked in French Blood Center Rhone-Alpes’s blood bank and
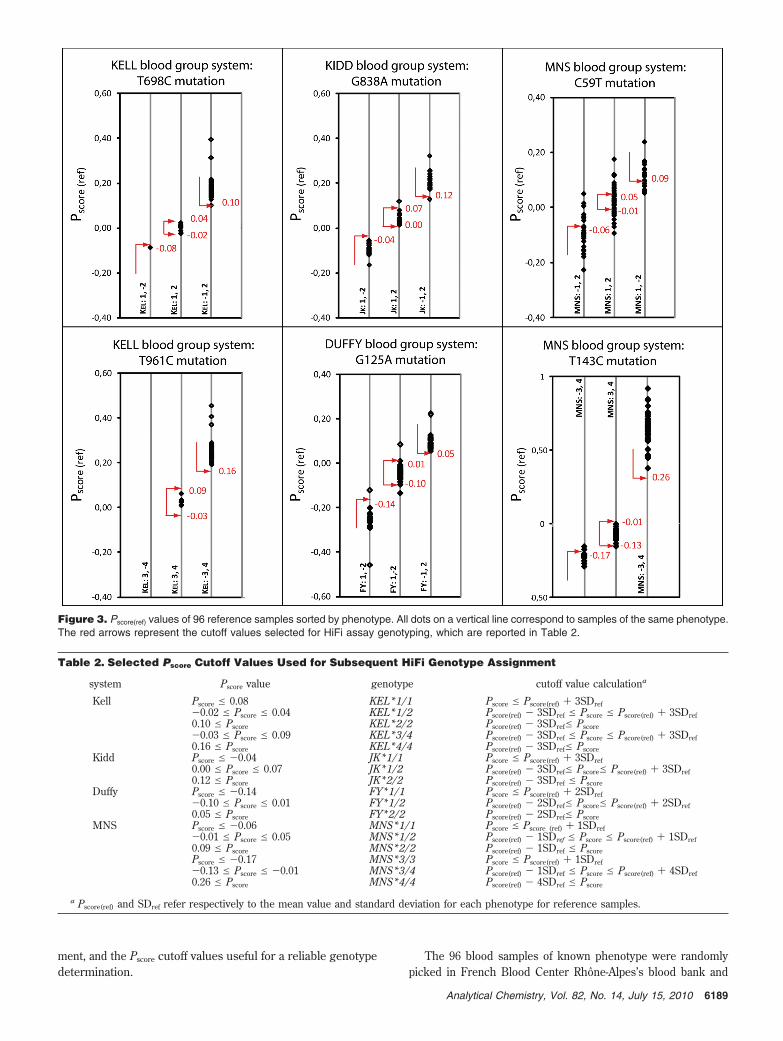
Figure 3. Pscore(ref) values of 96 reference samples sorted by phenotype. All dots on a vertical line correspond to samples of the same phenotype.The red arrows represent the cutoff values selected for HiFi assay genotyping, which are reported in Table 2.
Table 2. Selected Pscore Cutoff Values Used for Subsequent HiFi Genotype Assignment
system Pscore value genotype cutoff value calculationa
Kell Pscore e 0.08 KEL*1/1 Pscore e Pscore(ref) + 3SDref-0.02 e Pscore e 0.04 KEL*1/2 Pscore(ref) - 3SDref e Pscore e Pscore(ref) + 3SDref0.10 e Pscore KEL*2/2 Pscore(ref) - 3SDrefe Pscore-0.03 e Pscore e 0.09 KEL*3/4 Pscore(ref) - 3SDref e Pscore e Pscore(ref) + 3SDref0.16 e Pscore KEL*4/4 Pscore(ref) - 3SDrefe Pscore
Kidd Pscore e -0.04 JK*1/1 Pscore e Pscore(ref) + 3SDref0.00 e Pscore e 0.07 JK*1/2 Pscore(ref) - 3SDrefe Pscoree Pscore(ref) + 3SDref0.12 e Pscore JK*2/2 Pscore(ref) - 3SDref e Pscore
Duffy Pscore e -0.14 FY*1/1 Pscore e Pscore(ref) + 2SDref-0.10 e Pscore e 0.01 FY*1/2 Pscore(ref) - 2SDrefe Pscoree Pscore(ref) + 2SDref0.05 e Pscore FY*2/2 Pscore(ref) - 2SDrefe Pscore
MNS Pscore e -0.06 MNS*1/1 Pscore e Pscore (ref) + 1SDref-0.01 e Pscore e 0.05 MNS*1/2 Pscore(ref) - 1SDref e Pscore e Pscore(ref) + 1SDref0.09 e Pscore MNS*2/2 Pscore(ref) - 1SDref e PscorePscore e -0.17 MNS*3/3 Pscore e Pscore(ref) + 1SDref-0.13 e Pscore e -0.01 MNS*3/4 Pscore(ref) - 1SDref e Pscore e Pscore(ref) + 4SDref0.26 e Pscore MNS*4/4 Pscore(ref) - 4SDref e Pscore
a Pscore(ref) and SDref refer respectively to the mean value and standard deviation for each phenotype for reference samples.
6189Analytical Chemistry, Vol. 82, No. 14, July 15, 2010
processed on a HiFi assay platform (extraction, PCR, and hybrid-ization). The resulting Pscore values are displayed in Figure 3.
Samples fulfilling the two following criteria were included inthe reference panel used for the calculation of cutoff values. First,quality control criteria defined in the Experimental Section hadto be fulfilled. Second, the Pscore value had to be (i) more than1 standard deviation (1SD) for MNS1/MNS2 antigens or (ii)more than 2SD for all the other phenotypes away from thatgiven phenotype mean Pscore value. These selection rules wereapplied to avoid the inclusion of a discordant sample in thereference panel. Restrictions were stronger for MNS1/MNS2antigens due to the overlap of the clusters corresponding tothe three possible phenotypes (Figure 3).
Cluster limits for each subgroup of a given genotype werecalculated using Pscore(ref) mean values and standard deviations(SDref). Final cutoff values are displayed in Table 2. For theKell and Kidd blood group systems, the clusters correspondingto the three possible genotypes were far enough from each otherto set cutoff values at the Pscore(ref) mean value ± 3SDref withoutoverlap. No cluster could be defined for the KEL*3/3 genotypeas none of the references displayed a KEL:3,-4 phenotype.For the Duffy blood group system, the clusters’ width had tobe shrunk to the Pscore(ref) mean value ± 2SDref. For thepolymorphism associated with MNS1/MNS2 antigens, theoverlap observed for the reference values forced the limits tobe set at the Pscore(ref) mean value ± 1SDref.
In the case of the polymorphism associated with MNS3/MNS4antigens, MNS:3,-4 and MNS:3,4 reference subgroups werealmost overlapping whereas MNS:3,4 and MNS:-3,4 reference
subgroups were far from each other. Therefore, cutoff valuesdifferentiating the MNS*3/3 genotype from the MNS*3/4 geno-type were set at the Pscore(ref) mean value ± 1SDref, whereas cutoffvalues differentiating the MNS*3/3 genotype from theMNS*3/4 genotype could be set at the Pscore(ref) mean value ±4SDref.
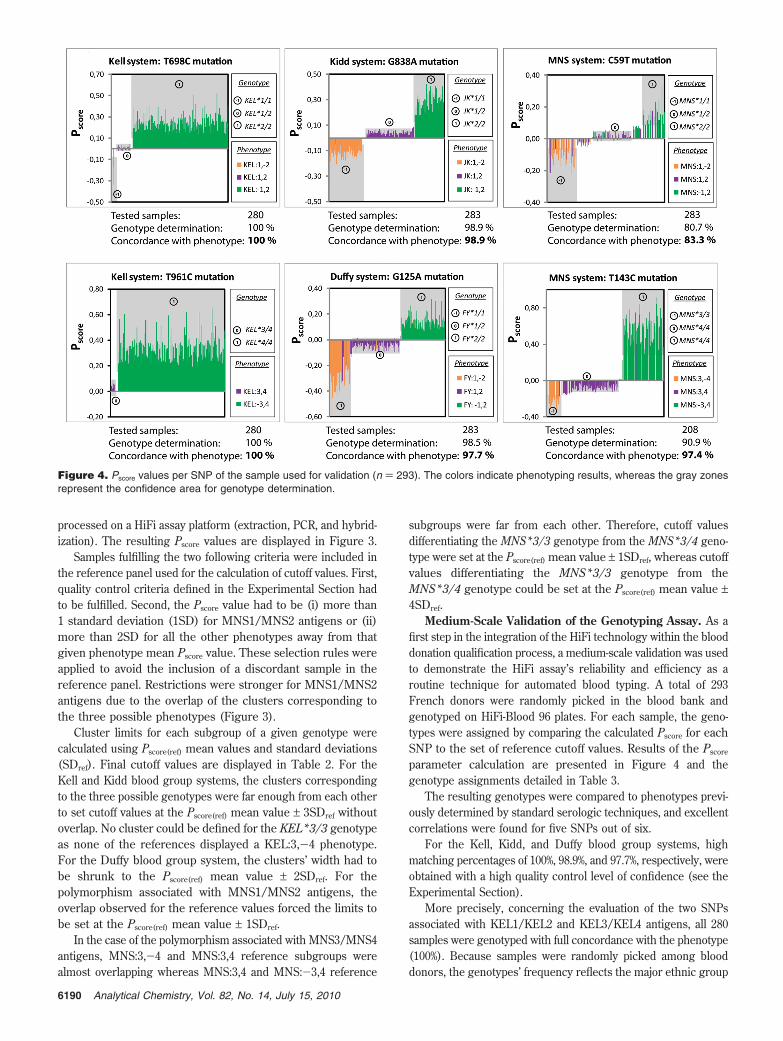
Medium-Scale Validation of the Genotyping Assay. As afirst step in the integration of the HiFi technology within the blooddonation qualification process, a medium-scale validation was usedto demonstrate the HiFi assay’s reliability and efficiency as aroutine technique for automated blood typing. A total of 293French donors were randomly picked in the blood bank andgenotyped on HiFi-Blood 96 plates. For each sample, the geno-types were assigned by comparing the calculated Pscore for eachSNP to the set of reference cutoff values. Results of the Pscore
parameter calculation are presented in Figure 4 and thegenotype assignments detailed in Table 3.
The resulting genotypes were compared to phenotypes previ-ously determined by standard serologic techniques, and excellentcorrelations were found for five SNPs out of six.
For the Kell, Kidd, and Duffy blood group systems, highmatching percentages of 100%, 98.9%, and 97.7%, respectively, wereobtained with a high quality control level of confidence (see theExperimental Section).
More precisely, concerning the evaluation of the two SNPsassociated with KEL1/KEL2 and KEL3/KEL4 antigens, all 280samples were genotyped with full concordance with the phenotype(100%). Because samples were randomly picked among blooddonors, the genotypes’ frequency reflects the major ethnic group
Figure 4. Pscore values per SNP of the sample used for validation (n ) 293). The colors indicate phenotyping results, whereas the gray zonesrepresent the confidence area for genotype determination.
6190 Analytical Chemistry, Vol. 82, No. 14, July 15, 2010
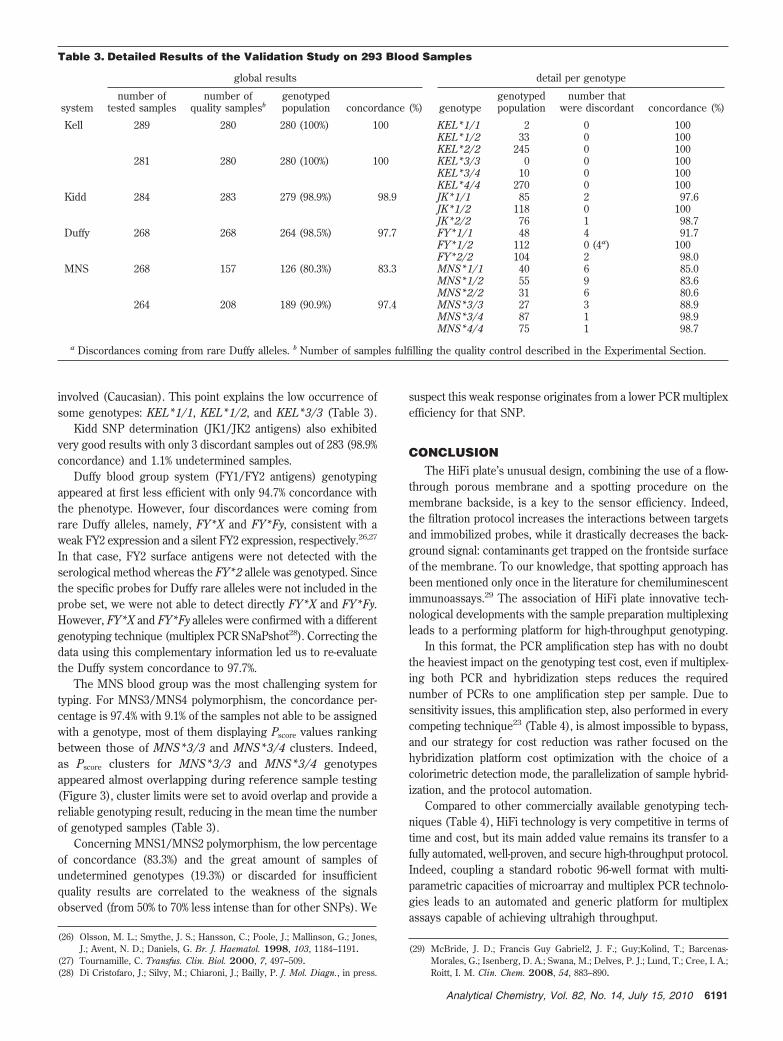
involved (Caucasian). This point explains the low occurrence ofsome genotypes: KEL*1/1, KEL*1/2, and KEL*3/3 (Table 3).
Kidd SNP determination (JK1/JK2 antigens) also exhibitedvery good results with only 3 discordant samples out of 283 (98.9%concordance) and 1.1% undetermined samples.
Duffy blood group system (FY1/FY2 antigens) genotypingappeared at first less efficient with only 94.7% concordance withthe phenotype. However, four discordances were coming fromrare Duffy alleles, namely, FY*X and FY*Fy, consistent with aweak FY2 expression and a silent FY2 expression, respectively.26,27
In that case, FY2 surface antigens were not detected with theserological method whereas the FY*2 allele was genotyped. Sincethe specific probes for Duffy rare alleles were not included in theprobe set, we were not able to detect directly FY*X and FY*Fy.However, FY*X and FY*Fy alleles were confirmed with a differentgenotyping technique (multiplex PCR SNaPshot28). Correcting thedata using this complementary information led us to re-evaluatethe Duffy system concordance to 97.7%.
The MNS blood group was the most challenging system fortyping. For MNS3/MNS4 polymorphism, the concordance per-centage is 97.4% with 9.1% of the samples not able to be assignedwith a genotype, most of them displaying Pscore values rankingbetween those of MNS*3/3 and MNS*3/4 clusters. Indeed,as Pscore clusters for MNS*3/3 and MNS*3/4 genotypesappeared almost overlapping during reference sample testing(Figure 3), cluster limits were set to avoid overlap and provide areliable genotyping result, reducing in the mean time the numberof genotyped samples (Table 3).
Concerning MNS1/MNS2 polymorphism, the low percentageof concordance (83.3%) and the great amount of samples ofundetermined genotypes (19.3%) or discarded for insufficientquality results are correlated to the weakness of the signalsobserved (from 50% to 70% less intense than for other SNPs). We
suspect this weak response originates from a lower PCR multiplexefficiency for that SNP.
CONCLUSIONThe HiFi plate’s unusual design, combining the use of a flow-
through porous membrane and a spotting procedure on themembrane backside, is a key to the sensor efficiency. Indeed,the filtration protocol increases the interactions between targetsand immobilized probes, while it drastically decreases the back-ground signal: contaminants get trapped on the frontside surfaceof the membrane. To our knowledge, that spotting approach hasbeen mentioned only once in the literature for chemiluminescentimmunoassays.29 The association of HiFi plate innovative tech-nological developments with the sample preparation multiplexingleads to a performing platform for high-throughput genotyping.
In this format, the PCR amplification step has with no doubtthe heaviest impact on the genotyping test cost, even if multiplex-ing both PCR and hybridization steps reduces the requirednumber of PCRs to one amplification step per sample. Due tosensitivity issues, this amplification step, also performed in everycompeting technique23 (Table 4), is almost impossible to bypass,and our strategy for cost reduction was rather focused on thehybridization platform cost optimization with the choice of acolorimetric detection mode, the parallelization of sample hybrid-ization, and the protocol automation.
Compared to other commercially available genotyping tech-niques (Table 4), HiFi technology is very competitive in terms oftime and cost, but its main added value remains its transfer to afully automated, well-proven, and secure high-throughput protocol.Indeed, coupling a standard robotic 96-well format with multi-parametric capacities of microarray and multiplex PCR technolo-gies leads to an automated and generic platform for multiplexassays capable of achieving ultrahigh throughput.
(26) Olsson, M. L.; Smythe, J. S.; Hansson, C.; Poole, J.; Mallinson, G.; Jones,J.; Avent, N. D.; Daniels, G. Br. J. Haematol. 1998, 103, 1184–1191.
(27) Tournamille, C. Transfus. Clin. Biol. 2000, 7, 497–509.(28) Di Cristofaro, J.; Silvy, M.; Chiaroni, J.; Bailly, P. J. Mol. Diagn., in press.
(29) McBride, J. D.; Francis Guy Gabriel2, J. F.; Guy;Kolind, T.; Barcenas-Morales, G.; Isenberg, D. A.; Swana, M.; Delves, P. J.; Lund, T.; Cree, I. A.;Roitt, I. M. Clin. Chem. 2008, 54, 883–890.
Table 3. Detailed Results of the Validation Study on 293 Blood Samples
global results detail per genotype
systemnumber of
tested samplesnumber of
quality samplesbgenotypedpopulation concordance (%) genotype
genotypedpopulation
number thatwere discordant concordance (%)
Kell 289 280 280 (100%) 100 KEL*1/1 2 0 100KEL*1/2 33 0 100KEL*2/2 245 0 100
281 280 280 (100%) 100 KEL*3/3 0 0 100KEL*3/4 10 0 100KEL*4/4 270 0 100
Kidd 284 283 279 (98.9%) 98.9 JK*1/1 85 2 97.6JK*1/2 118 0 100JK*2/2 76 1 98.7
Duffy 268 268 264 (98.5%) 97.7 FY*1/1 48 4 91.7FY*1/2 112 0 (4a) 100FY*2/2 104 2 98.0
MNS 268 157 126 (80.3%) 83.3 MNS*1/1 40 6 85.0MNS*1/2 55 9 83.6MNS*2/2 31 6 80.6
264 208 189 (90.9%) 97.4 MNS*3/3 27 3 88.9MNS*3/4 87 1 98.9MNS*4/4 75 1 98.7
a Discordances coming from rare Duffy alleles. b Number of samples fulfilling the quality control described in the Experimental Section.
6191Analytical Chemistry, Vol. 82, No. 14, July 15, 2010

This full automation guarantees that the HiFi platform issecured for the blood qualification center environment. Thehandling of the two robotic units dedicated to sample preparation(extraction and pre-PCR) and filtration assay (PCR and HiFi) onlyrequires minimum technician intervention, lowering human errorhazard. Besides, the convenient elimination of reagents throughvacuum soaking during the filtration assays and the unidirectionalfluid handling ensure reduced contamination. Last but not least,the long-term stability of the colorimetric staining enables the end-user to store result plates in addition to in silico data storage,leading to better traceability.
Still, HiFi assay remains currently behind commercially avail-able genotyping techniques regarding the amount of informationprovided per test (Table 4). Indeed, for that first medium-scalevalidation study, only 6 SNPs associated with 12 red blood cellsurface antigens of 4 blood group systems were detected.However, further improvements are already in progress, with thedevelopment of additional probes specific to the Duffy systemconcordant with the silent and weak Fy2 phenotype and newprobes associated with the major blood group system Rhesus. Ourfinal objective is to scale up to the analysis of 28 SNPs per well,targeting mutations associated with a selection of nine systemsof great interest for transfusion safety in Europe (major, RHCE;minor, Kell, Kidd, Duffy, MNS, Cartwright, Colton, Dumbrock,and Lutheran). Our strategy is indeed to use a probe set whichwill be admittedly limited in size (maximum 70 spots per well),but specifically chosen for the ethnic groups concerned.
In conclusion, the present study demonstrates the perfor-mances and the reliability of the HiFi-Blood 96 tests, whichconstitutes a secured and cost-efficient automated method for
blood group genotyping. The next version of this blood groupgenotyping tool will incorporate (i) advanced probe design andspotting conditions to increase MNS genotyping quality, (ii) newspecific probes for the Duffy system concordant with the silentand weak Fy2 phenotype, (iii) new probes associated with theRhesus system,1,7,30 and (iv) an increased panel of referencesamples for a more accurate determination of cutoff values (large-scale study). The next validation step will be the integration ofthe HiFi-Blood 96 complete platform in the Etablissement Francaisdu Sang Rhone-Alpes blood qualification process to monitor itsimpact on the blood qualification center environment and transfu-sion safety.
ACKNOWLEDGMENTWe thank the Blood Donation Qualification Center of Metz-
Tessy for the extended phenotyping of blood samples and theLaboratoire d’Hematologie Moleculaire of Etablissement Francaisdu Sang Alpes-Mediterranee for complementary characterizationof discordant samples.
SUPPORTING INFORMATION AVAILABLEAdditional information as noted in text. This material is
available free of charge via the Internet at http://pubs.acs.org.
Received for review April 16, 2010. Accepted June 7,2010.
AC101008D
(30) Flegel, W. A. Transfus. Clin. Biol. 2006, 13, 4–12.
Table 4. Comparison of HiFi-Blood 96 Assay with Commercially Available Genotyping Techniques8,23
genotyping technique HEA BeadChip,18,19
BioArray Solutions,Immucor
BLOODChip,24 ProgenikaPharma SA, Spain
Genome Lab SNPstream,16,22
Beckmann CoulterHiFi-Blood 96,
ICBMS-EFS RA, France
blood groups MNS, KEL, JK, FY, LU,DI, DO, CO, SC, LW
ABO, RHD, RHCE, MNS,KEL, JK, FY, DI,DO, CO
MNS, RHCE, KEL, JK, FY MNS, KEL, JK, FY
number of antigens(red blood cell antigens)
24 47 19-22 12 (soon 20)
number of target SNPs 18 128 (including plateletantigens)
12 6 (soon 11)
support glass slide glass slide 384-well plate 96-well platedetection mode and
apparatusfluorescence microscopy fluorescence microscopy fluorescence microscopy colorimetry flatbed
scannernumber of samples per run 8-96 1 384 1-96run time/duration 24 h (without extraction) 5 h (without extraction) 36 h (without extraction) 4 hautomated high-throughput
procedureno no no yes
automated securedprotocol
no no no yes
6192 Analytical Chemistry, Vol. 82, No. 14, July 15, 2010