robust medical image segmentation for accurate computer...
TRANSCRIPT

Mehdi Hassan
2015
Department of Computer and Information Sciences
Pakistan Institute of Engineering and Applied Sciences
Nilore, Islamabad, Pakistan
Robust Medical Image Segmentation for
Accurate Computer Aided Diagnosis

This page intentionally left blank.

Thesis Approval Form
Student’s Name: Mehdi Hassan Department: DCIS
Registration Number:03-7-1-027-2010 Date of Registration:26.01.2010
Thesis Title: Robust Medical Image Segmentation for Accurate Computer Aided Diagnosis
RECOMMENDATION (if any) by:
General comments (attach additional sheet if required)
When the final thesis defense of the student has been concluded and all other requirements have been
met, I
a. Do Recommend that the candidate be certified to the faculty for the degree of
Doctor of Philosophy
b. Do Recommend that the candidate be certified to the faculty for the degree of
Doctor of Philosophy subject to the minor correction in the thesis.
c. Do Recommend that the candidate should reappear in the oral defense
d. Do NOT Recommend that the candidate be certified to the faculty for the degree
of Doctor of Philosophy
Examiners Signatures
1. Internal Examiner (Name & Affiliation):
2. Internal Examiner (Name & Affiliation):
3. Internal Examiner (Name & Affiliation):
4. Supervisor (Name & Affiliation):
5. Head of Department (Name):
6. Dean (Research) :
Approved by:
Head of the Department (Name) :___________________________ Signatures/Date ______________
Distribution:
1. Original to be placed in Student’s Personal file in the office of Dean (Research)
2. Copy to be included in the thesis prior to final submission.
Thesis Submission Approval
This is to certify that the work contained in this thesis entitled Robust Medical
Image Segmentation for Accurate Computer Aided Diagnosis, was carried out by
Mehdi Hassan, and in my opinion, it is fully adequate, in scope and quality, for the
degree of Ph.D. Furthermore, it is hereby approved for submission for review and
thesis defense.
Supervisor: _____________________
Name: Dr. Asmatuallah Chaudhry
Date: 21 May, 2015
Place: Directorate of MIS, PAEC,
Islamabad.
Co-Supervisor: __________________
Name: Dr. Asifullah Khan
Date: 21 May, 2015
Place: PIEAS, Islamabad.
Head, DCIS: __________________
Name: Dr. Javid Khurshid
Date: 21 May, 2015
Place: PIEAS, Islamabad.

Robust Medical Image Segmentation for
Accurate Computer Aided Diagnosis
Mehdi Hassan
Submitted in partial fulfillment of the requirements
for the degree of Ph.D. May, 2015
Department of Computer and Information Sciences
Pakistan Institute of Engineering and Applied Sciences Nilore, Islamabad, Pakistan

ii
Dedications
Dedicated to my parents for their utmost love, prayers and
encouragement
&
My wife (Shamsa Batool) for all of her love and support

iii
Declaration of Originality
I hereby declare that the work contained in this thesis and the intellectual content of
this thesis are the product of my own work. This thesis has not been previously
published in any form nor does it contain any verbatim of the published resources
which could be treated as infringement of the international copyright law. I also
declare that I do understand the terms ‘copyright’ and ‘plagiarism,’ and that in case of
any copyright violation or plagiarism found in this work, I will be held fully
responsible of the consequences of any such violation.
__________________
(Mehdi Hassan)
21 May, 2015
PIEAS, Islamabad.

iv
Copyrights Statement
The entire contents of this thesis entitled Robust Medical Image Segmentation for
Accurate Computer Aided Diagnosis by Mehdi Hassan are an intellectual property
of Pakistan Institute of Engineering & Applied Sciences (PIEAS). No portion of the
thesis should be reproduced without obtaining explicit permission from PIEAS.

v
Acknowledgements
First of all, praise is due to Allah whose worth cannot be described by speakers,
whose bounties cannot be counted by calculators and whose claim (to obedience)
cannot be satisfied by those who attempt to do so, whom the height of intellectual
courage cannot appreciate, and the divings of understanding cannot reach; He for
whose description no limit has been laid down, no eulogy exists, no time is ordained
and no duration is fixed. He brought forth creation through His Omnipotence,
dispersed winds through His Compassion, and made firm the shaking earth with
rocks. Due to His showering of special blessings on me and honoring me with
strength and determination to accomplish PhD research work. He guided me during
every phase of my life as well as this PhD research work.
I am especially very grateful to Dr. Asmatullah Chaudhry and Dr. Asifullah
Khan for supervising me all heartedly and inspiring me for conducting and
completion of this research. I would also like to express my thanks to all beloved
teachers (especially to Dr. Abdul Majid, Dr. Abdul Jalil, and Dr. Ghulam Raza, who
give their precious time whenever I needed. I am very thankful to Dr. Nisar A.
Memon, QUEST, Nawabshah who motivated me to start my PhD studies at PIEAS.
I am grateful to my loving parents, siblings, cousins and other relatives, who
helped me and prayed for me to successfully accomplish PhD degree. I am also
thankful to all my friends and colleagues (especially Dr. Fakhar e Alam, Dr. Shozab
Mehdi, Khurram Jawad, Muhammad Tahir, Adnan Idris, Muhammad Aksam Iftikhar,
Iqbal Mirza, Syed Gibran Javed, Dr. Zia-ur-Rehman, Dr. Mattiullah Shah, Taskeen
Raza, Muhammad Shafiq, Safdar Ali) without them it would have been difficult for
me to stay and complete PhD research work at PIEAS.
Outside PIEAS, I am very thankful to Shakeel Ahmed, Tasuwar Hussain,
Aqeel Ahmed, and Raheel Ahmed who are always valuable throughout my life. I am
also thankful to my friends Haji Muhammad, Abdul Rasheed Safdar, Dr. Syed Hamad
Raza Naqvi, and Abdullah Aman Khan for their encouragement and support.

vi
I would like to extend my gratitude to all the anonymous reviewers of my
research papers. Without their valuable comments and suggestions it might not be
possible to complete my research on-time.
Beside these, how can I forget Pattern Recognition Lab, PIEAS where I have
spent days and nights to complete my PhD research? Pattern Recognition Lab
provided computational resources for experiments. Last but not least, I would like to
extend my thankfulness to Higher Education Commission (HEC) of Pakistan, for
providing financial support under Indigenous 5000 PhD program (PIN # 074-1729-
Ps4-078).
Mehdi Hassan
PIEAS, Islamabad.
vii
Table of Contents
Dedications ........................................................................................................................ ii
Declaration of Originality ................................................................................................ iii
Copyrights Statement ........................................................................................................iv
Acknowledgements ............................................................................................................ v
Table of Contents ............................................................................................................ vii
List of Figures....................................................................................................................xi
List of Tables .................................................................................................................... xv
Abstract ........................................................................................................................... xvi
List of Publications ...................................................................................................... xviii
List of Symbols ................................................................................................................ xx
List of Abbreviations .................................................................................................... xxii
Chapter 1 : Background and Goals of Study .................................................................... 1
1.1 Causes of Atherosclerosis................................................................................... 2
1.2 Symptoms of Cerebrovascular Accidents ......................................................... 2
1.3 Cerebrovascular Disease Diagnosis ................................................................... 3
1.4 Research Objectives and Contributions ............................................................. 5
1.5 Organization of Thesis ........................................................................................ 6
Chapter 2 : Literature Survey and Related Concepts ....................................................... 8
2.1 Segmentation of Carotid Artery Ultrasound Images ........................................ 8
2.2 Segmentation Algorithms ................................................................................. 11
2.2.1 Fuzzy C-means Clustering ........................................................................ 11
2.2.2 Spatial Fuzzy C-means Clustering ........................................................... 12
2.2.3 Radial Basis Function Network ................................................................ 13
2.2.4 Fuzzy Radial Basis Function Networks ................................................... 14
2.2.5 K-means Clustering ................................................................................... 15
2.2.6 Self-Organizing Maps (SOM) .................................................................. 15
2.3 IMT Measurements ........................................................................................... 15
2.4 Classification of Carotid Artery Ultrasound Images ...................................... 16
viii
2.5 Carotid Artery Ultrasound Images Datasets.................................................... 17
2.6 Performance Evaluation ................................................................................... 18
2.6.1 Clustering Performance Evaluation ......................................................... 18
2.6.2 Classification Performance Evaluation .................................................... 20
Chapter 3 : Carotid Artery Image Segmentation using Modified Spatial Fuzzy C-
means and Ensemble Clustering ..................................................................................... 22
3.1 The Proposed Spatial Fuzzy C-means Modified (sFCMM)........................... 22
3.1.1 Image Pre-processing ................................................................................ 23
3.1.2 Feature Extraction ..................................................................................... 23
3.1.3 Feature Selection ....................................................................................... 28
3.1.4 The Proposed Spatial Fuzzy C-means Modified Clustering Algorithm 29
3.1.5 The Proposed Ensemble Clustering Scheme ........................................... 30
3.1.6 Post-processing Operations ...................................................................... 31
3.2 Classification of Carotid Artery Ultrasound Images ...................................... 31
3.3 Experimental Results and Discussions ............................................................ 32
3.3.1 Performance Assessment of Proposed Technique on Phantom
Ultrasound Images .................................................................................................... 33
3.3.2 Performance Assessment of the Proposed Technique at Real Carotid
Artery Ultrasound Images ........................................................................................ 33
3.3.3 Performance Analysis of Ensemble Clustering based on Fuzzy C-means
34
3.3.4 Ensemble Clustering Assessment based on sFCM ................................. 37
3.3.5 Performance Analysis of sFCMM Based Ensemble Clustering............. 37
3.3.6 Clustering Performance Analysis of K-mean & SOM Based Ensemble ...
.................................................................................................................... 38
3.3.7 Classification of Carotid Artery Ultrasound Images ............................... 42
Chapter 4 : Robust Information Gain based Fuzzy C-Means Clustering and
Classification of Carotid Artery Ultrasound Images...................................................... 46
4.1 The Proposed Clustering Algorithm ................................................................ 46
4.1.1 The Proposed Information Gain Based FCM Clustering Algorithm ..... 46
4.1.2 Illustration of the Proposed IGFCM approach ........................................ 48
4.1.3 Clustering Quality Measures .................................................................... 51
4.2 Decision system for Segmented Carotid Artery Ultrasound Images ............. 51
4.2.1 Probabilistic Neural Networks Classifier................................................. 52
4.3 Experimental Results and Discussions ............................................................ 53
ix
4.3.1 Scenario-I: Segmentation Performance of the Proposed Algorithm ...... 54
4.3.2 Scenario-II: Segmentation and Decision Performance of IGFCM on
Carotid Artery Ultrasound Images .......................................................................... 61
Chapter 5 : Robust Segmentation of Carotid Artery Ultrasound Images based on
Neuro Fuzzy GA and Expectation Maximization .......................................................... 70
5.1 The Proposed RSC-US Technique................................................................... 70
5.1.1 Label Initialization of Pixels ..................................................................... 71
5.1.2 The Expectation Maximization Step ........................................................ 72
5.1.3 Feature Extraction ..................................................................................... 74
5.1.4 Neuro Fuzzy Classifier.............................................................................. 76
5.1 Decision Making System for Carotid Artery Ultrasound Images .................. 78
5.2.1 Classification Performance Measures ...................................................... 79
5.2 Experimental Results and Discussions ............................................................ 79
5.3.1 Performance Analysis of the Proposed Segmentation Technique.......... 83
5.3.2 SVM based Decision Making System ..................................................... 84
Chapter 6 : Robust Fuzzy RBF Network Based Segmentation and Decision
Making System for Carotid Artery Ultrasound Images ................................................. 90
6.1 The Proposed Robust Fuzzy RBF Network Approach ................................... 90
6.1.1 Targets Outputs ......................................................................................... 93
6.1.2 Input Features ............................................................................................ 94
6.1.3 Training of RFRBFN Clustering Approach ............................................ 95
6.2 Experimental Results and Discussions ............................................................ 96
6.2.1 Performance Comparison on Synthetic Image ........................................ 97
6.2.2 The proposed RFRBFN Segmentation Performance on Brain MRI ...... 99
6.2.3 Segmentation of Carotid Artery Ultrasound Images ............................. 105
6.2.4 Decision System for Carotid Artery Ultrasound Images ...................... 107
Chapter 7 : Automatic Active Contour Based Segmentation and Classification of
Carotid Artery Ultrasound Images ................................................................................112
7.1 The Proposed Approach ................................................................................. 112
7.1.1 Alignment of Carotid Artery Ultrasound Images .................................. 112
7.1.2 Snake Initialization .................................................................................. 114
7.1.3 Separation of Objects from Background................................................ 114
7.1.4 Segmentation of Carotid Artery Ultrasound Images ............................. 116
7.2 Classification of Carotid Artery Ultrasound Images .................................... 117
x
7.2.1 IMT Feature Extraction........................................................................... 118
7.2.2 Classification Performance Measurements............................................ 118
7.3 Experimental Results and Discussions .......................................................... 119
Chapter 8 : Conclusions and Future Directions............................................................126
8.1 Modified Spatial Fuzzy C-means and Ensemble Clustering ........................ 126
8.2 Robust Information Gain Based FCM Clustering ........................................ 127
8.3 Robust Segmentation of Carotid Artery Ultrasound Images using Neuro
Fuzzy and Expectation Maximization....................................................................... 127
8.4 Robust Fuzzy RBF Network Based Segmentation ....................................... 128
8.5 Automatic Active Contour Based Segmentation of Carotid Artery
Ultrasound Images...................................................................................................... 128
8.6 IMT Measurements and Medical Decision Systems .................................... 129
8.7 Future Recommendations ............................................................................... 129
References.......................................................................................................................131

xi
List of Figures
Figure 1-1 The ten most leading causes of death in United States [3] ........................... 2
Figure 1-2 (a) Carotid artery location in the head and neck, (b) the normal carotid
artery without any blockage, (c) the diseased carotid artery having plaque [1]. ............ 3
Figure 2-1 The sample carotid artery ultrasound image ................................................ 18
Figure 3-1 Block diagram of the proposed scheme ....................................................... 24
Figure 3-2 Experimental results: (a) the original phantom image; (b) FCM segmented
image; (c) segmented image using sFCM; (d) the proposed sFCMM segmented image
(e) segmented image using K-means (f) segmented image using SOM (g) proposed
ensemble scheme segmented image and (h) segmented image using sFCMLSM
technique. .......................................................................................................................... 34
Figure 3-3 Experimental results: (a) the original carotid artery image; (b) histogram
equalized image; (c) FCM segmented image; (d) segmented image by sFCM; (e) the
proposed sFCMM segmented image (f) K-means segmented image (g) SOM
segmented image (h) the proposed ensemble segmented image (i) morphological
corrected image, (j) sFCMLSM technique segmented image. ...................................... 35
Figure 3-4 (a) and (c) Carotid artery image is segmented using the proposed ensemble
clustering approach and (b) and (d) images segmented by sFCMLSM approach. ...... 40
Figure 3-5 Proposed approach segmentation of carotid artery ultrasound image using
(a) bilateral and (b) median filtering as pre-processing step for noise reduction......... 41
Figure 3-6 Performance measures versus increasing number of features. ................... 41
Figure 3-7 (a) Magnified IMT measurement section of an original carotid artery
ultrasound image (b) Magnified IMT measurement section of a segmented carotid
artery ultrasound image using the proposed scheme. .................................................... 41
Figure 3-8 (a) IMT measurements of a normal carotid artery image (b) IMT
measurements of abnormal carotid artery....................................................................... 42
Figure 3-9 ROC curve analysis of true and false positive rates using MLBPNN
classifications. .................................................................................................................. 42
Figure 4-1 The block diagram of the proposed IGFCM approach............................... 47
Figure 4-2 A sample pixel and corresponding local neighborhoods ........................... 50
Figure 4-3 Segmentation of noisy synthetic image (noise variance 0.01): (a) noisy
image segmented by (b) FCM, (c) sFCM, (d) sFCMM, (e) FLICM, and (f) the
proposed IGFCM algorithm. ........................................................................................... 55
Figure 4-4 Segmentation of noisy synthetic image (noise variance 0.02): (a) noisy
image segmented by (b) FCM, (c) sFCM, (d) sFCMM, (e) FLICM, and (f) the
proposed IGFCM algorithm. ........................................................................................... 55
Figure 4-5 Segmentation of noisy synthetic image (noise variance 0.03): (a) noisy
image segmented by (b) FCM, (c) sFCM, (d) sFCMM, (e) FLICM, and (f) the
proposed IGFCM algorithm. ........................................................................................... 56

xii
Figure 4-6 The Wolf image segmentation, (a) The Wolf image (original), (b) FCM
segmentation, (c) sFCM segmentation, (d) sFCMM segmentation, (e) FLICM
segmentation, and (f) the proposed IGFCM segmentation............................................ 56
Figure 4-7 Segmentation of noisy Wolf image (noise variance 0.01), (a) noisy Wolf
image, (b) FCM segmentation, (c) sFCM segmentation, (d) sFCMM segmentation,
(e) FLICM segmentation, and (f) the proposed IGFCM segmentation ....................... 57
Figure 4-8 CT liver image segmentation, (a) original CT liver image, (b) FCM
segmentation, (c) sFCM segmentation, (d) sFCMM segmentation, (e) FLICM
segmentation, and (f) the proposed IGFCM segmentation............................................ 60
Figure 4-9 Graphical comparison of clustering quality measures (a) PC and (b) CE for
the CT Liver image .......................................................................................................... 60
Figure 4-10 Carotid artery US image segmentation, (a) original carotid artery US
image, (b) FCM segmentation, (c) sFCM segmentation, (d) sFCMM
segmentation, (e) FLICM segmentation, and (f) the proposed IGFCM segmentation
........................................................................................................................................... 63
Figure 4-11 IGFCM segmentation at noise free and noisy carotid artery ultrasound
image corrupted through Gaussian noise of various intensities. ................................... 64
Figure 4-12 (a) PC and (b) CE measures of 300 carotid artery ultrasound images ..... 65
Figure 4-13 Average PC and CE measures for 300 carotid artery ultrasound images 65
Figure 4-14 IMT measurements of a normal and abnormal carotid artery................... 67
Figure 4-15 ROC curve plotted against true positive rate vs. false positive rate for
PNN, KNN, and MLBPNN classifiers. .......................................................................... 67
Figure 4-16 Effect of segmentation techniques on the classification of carotid artery
images ............................................................................................................................... 68
Figure 5-1 Graphical representation of the proposed RSC-US approach..................... 71
Figure 5-2 Initial targets marked as artery wall, area inside the artery and the
background tissues. .......................................................................................................... 72
Figure 5-3 GMM parameters estimation using EM algorithm ...................................... 75
Figure 5-4 Behavior of RMSE curve of NFC training at different epochs .................. 77
Figure 5-5 NFC generated FIS used for segmentation of carotid artery ultrasound
images. .............................................................................................................................. 78
Figure 5-6 Graphical representation of fuzzy membership functions for selected
feature 1 (a) and feature 2 (b) respectively. .................................................................... 79
Figure 5-7 a) One of the longitudinal original carotid artery ultrasound images with
marked plaque, b) selected ROI c) segmented by the proposed RSC-US scheme, d)
FCM segmentation, e) K-means and f) Magenta represents initial and green represents
final segmentation of sFCMLSM technique. ................................................................. 80
Figure 5-8 Sample noise free and noisy longitudinal carotid artery ultrasound images
segmented by the proposed RSC-US approach.............................................................. 82
Figure 5-9 (a) One of the original longitudinal carotid artery ultrasound images, b)
image corrupted by Gaussian noise of variance 0.10 with marked ROI c) the proposed
RSC-US technique segmented image; d) FCM segmentation e) K-means and f)
sFCMLSM segmentation. ................................................................................................ 82
xiii
Figure 5-10 Segmentation quality comparison of different techniques at various noise
levels ................................................................................................................................. 85
Figure 5-11 Computational time (in Sec.) of the proposed scheme across different
number of extracted features. .......................................................................................... 85
Figure 5-12 (a) IMT measurement of a normal and (b) abnormal carotid artery......... 86
Figure 5-13 Performance comparisons of KNN, MLBPNN and SVM classifiers using
RSC-US segmentation at various classification quality measures ................................ 87
Figure 5-14 ROC curves of SVM, MLBPNN and KNN. .............................................. 88
Figure 5-15 Comparison of classification accuracy for various segmentation
techniques ......................................................................................................................... 88
Figure 6-1 Schematic diagram of the proposed RFRBFN technique ........................... 93
Figure 6-2 (a) original synthetic image b) Noisy image (Gaussian noise intensity of
0.008) c) Image segmented by FCM d) RBF segmented image e) Fuzzy RBF
segmentation image and f) The proposed RFRBFN segmented image. ....................... 98
Figure 6-3 Misclassification error rE at various Gaussian noise levels ...................... 99
Figure 6-4 Cross validation error (in term of mean square error) of FCMJ vs ......... 99
Figure 6-5 RMSE of the proposed RFRBF network training for MR T1-weighted
image ............................................................................................................................... 101
Figure 6-6 (a) Original brain MR image (b) image with 0.01 Gaussian noise (c) FCM
segmentation (d) Image segmented by RBF technique (e) Fuzzy RBF segmented
image(f) The proposed RFRBFN segmented image. ................................................... 101
Figure 6-7 (a-c) Original brain MR images, (d-f) respective ground truths, (g-i)
RFRBFN based segmentation and (j-l) difference between ground truth and the image
by the proposed RFRBFN approach. ............................................................................ 102
Figure 6-8, Column (a) Original brain MR images, column (b) the noisy version of the
original brain MR images, column (c) the proposed RFRBFN approach segmented
images, column (d) the ground truth of the respective brain MR images. ................. 104
Figure 6-9 (a) Original carotid artery ultrasound image selected ROI (b) Noisy carotid
artery image of intensity 0.05 (salt & pepper) (c) FCM segmented image (d) image
segmented by RBF (e) FRBF network segmentation and (f) the proposed RFRBFN
segmented image. ........................................................................................................... 105
Figure 6-10 Left column: The original carotid artery ultrasound images with marked
plaque and right column: the proposed RFRBFN segmented images. ....................... 107
Figure 6-11 IMT measurements of normal and abnormal carotid arteries ................. 108
Figure 6-12 The ROC curves for different MLBPNN classifier (with different number
of hidden layer neuron) .................................................................................................. 110
Figure 7-1 Flow chart of the proposed approach ......................................................... 113
Figure 7-2 a) The original carotid artery ultrasound image, b) the cropped and median
filtered ROI, c) automatic snake initialization window, d) segmented carotid artery
ultrasound image using active contour method. ........................................................... 120
Figure 7-3 Column a) segmentation results using our proposed automatic snake
initialization approach and column b) images segmented by manual snake
initialization. ................................................................................................................... 121
xiv
Figure 7-4 IMT measurement of a normal carotid artery ultrasound image .............. 122
Figure 7-5 ROC curves of SVM, KNN and PNN classifiers showing true positive
(TP) and false positive (FP) rates at different thresholds ............................................ 124
Figure 7-6 Performance comparison of KNN, PNN and SVM classifiers at various
classification performance measures. ........................................................................... 124
xv
List of Tables
Table 3.1 Feature selected by WEKA using GA for segmentation of carotid artery
ultrasound images ............................................................................................................. 29
Table 3.2 Clustering performance measures of the proposed approach on phantom
ultrasound image. ............................................................................................................. 34
Table 3.3 The clustering quality performance comparison of various techniques....... 37
Table 3.4 Performance comparison of the proposed ensemble clustering approach
based on FCM, sFCM, sFCMM, K-means and SOM approaches. ............................... 39
Table 3.5 Performance comparison of the proposed approach segmentation of carotid
artery ultrasound images with other techniques by utilizing all thirty five extracted
features. ............................................................................................................................. 39
Table 3.6 The Performance comparison of segmentation using median and bilateral
filtering for image denoising. .......................................................................................... 40
Table 3.7 Classification performance measure of the MLBPNN ................................. 43
Table 3.8 The temporal comparison of the proposed approach at reduced and whole
extracted features set. ....................................................................................................... 43
Table 4.1 Clustering quality comparison of the proposed IGFCM and other
segmentation techniques .................................................................................................. 61
Table 4.2 Performance comparison of PNN-based decision system with other
classifiers .......................................................................................................................... 67
Table 4.3 The effect of segmentation technique at classification of carotid artery
ultrasound images ............................................................................................................. 68
Table 5.1 Average performance comparison of the proposed RSC-US and other
techniques over 300 carotid artery ultrasound images ................................................... 84
Table 5.2 Classification performance comparisons of SVM, KNN and MLBPNN
using the proposed RSC-US segmentation technique ................................................... 86
Table 5.3 Effects of segmentation on object classification ........................................... 88
Table 6.1 Parameters used for training of network for brain MR images .................. 100
Table 6.2 Parameters used for training of the network for carotid artery ultrasound
images ............................................................................................................................. 108
Table 6.3 The MLBPNN classification performance measures on 200 carotid artery
ultrasound images segmented by the proposed RFRBFN technique .......................... 109
Table 6.4 Effects of hidden layer neurons on classification accuracy of carotid artery
ultrasound images ........................................................................................................... 110
Table 7.1 Various IMT measurements of upper and lower wall of carotid artery in
term of mm ...................................................................................................................... 121
Table 7.2 Classification performance comparison of the various classifiers based on
proposed technique segmentation. ................................................................................ 122
xvi
Abstract
Image processing is being successfully applied in many areas medical research such
as computer aided diagnosis, tumor imaging and treatment, angiography, and carotid
artery plaque detection. For medical image analysis, segmentation is an intermediate
step to segregate region of interest from the background. The ultimate goal of
segmentation is to identify the part of the data array that makes up an object in the
real world. Many imaging modalities are in practice for disease diagnosis. Among
those, owing to noninvasive nature, ultrasound imaging provides an invaluable tool
for disease diagnosis. Major limitations faced by ultrasound imaging modality include
low quality, inherent noise, and wave interferences. Consequently, a substantial effort
from radiologists is required to extract constructive information about a particular
disease. In this regard, an efficient and accurate computer aided diagnostic system for
ultrasound images is highly desirable for disease (plaque) diagnosis.
Carotid arteries are vital arteries that supply oxygen rich blood to the brain.
Carotid artery stenosis is the process of narrowing the carotid artery due to the
presence of atherosclerosis. The plaque may partially or fully block the blood flow to
the brain and the probability of cerebrovascular stroke becomes high. Ultrasound
imaging is used for detection of plaque in carotid artery. Due to lower quality and
other degradations, segmentation of carotid arteries ultrasound images becomes a
challenging task.
In this thesis, several segmentation techniques are proposed, which
successfully segment the carotid artery ultrasound images. Firstly, we have proposed
spatial fuzzy c-means modified (sFCMM) clustering technique and also investigated
effectiveness of ensemble clustering. The proposed sFCMM technique assigns weight
to each pixel in a sub-window according to the pixel’s contribution. The proposed
scheme required image pre-processing for noise reduction and hence segmentation
has been performed on filtered image. In another approach, we propose information
gain based fuzzy c-means clustering (IGFCM) algorithm that avoids the pre-
processing step and still yields better results compared to sFCMM technique. The
IGFCM approach exploits the concept of information gain to automatically update the
xvii
fuzzy membership function and cluster centeriods. However, from IGFCM segmented
images, it has been observed that some of the pixels of arterial walls are mislabeled by
IGFCM. In order to overcome this problem, a semi-supervised clustering approach
named robust segmentation and classification of ultrasound images (RSC-US) has
been proposed to segment carotid artery ultrasound images.
The RSC-US approach is composed of three phases. In the first phase, the
fuzzy inference system (FIS) is generated. In second phase, carotid artery ultrasound
images are segmented based on the generated FIS. Finally, a decision making system
has been designed to segregate the segmented images into normal or abnormal
subjects. The RSC-US approach did not utilize the spatial information of pixel’s
which plays a vital role in segmentation. Consequently, the spatial information has
also been explored and a new approach named robust fuzzy radial basis function
networks (RFRBFN) has been proposed to segment carotid artery ultrasound images.
The RFRBFN segments the carotid artery ultrasound images with high precision. Due
to the Lagrange function and a smoothing parameter, the RFRBFN might be
computationally expensive. Finally, an automatic active contour based segmentation
technique for carotid artery ultrasound images is proposed. This technique can
successfully segment natural scene as well as medical images.
xviii
List of Publications
Journal Articles:
Mehdi Hassan, Asmatullah Chaudhry, Asifullah Khan, M. Aksam Iftikhar,
“Robust Information Gain Based Segmentation and Classification of Carotid
Artery Ultrasound Images”, “Computer Methods and Program in Biomedicine”
Vol. 113, pp. 593-609, 2013. Impact Factor 1.555
Mehdi Hassan, Asmatullah Chaudhry, Asifullah Khan, Jin Young Kim, “Carotid
Artery Ultrasound Image Segmentation using Modified Spatial Fuzzy c-means and
Ensemble Clustering”, “Computer Methods and Program in Biomedicine”, Vol
108, pp 1261-1276, 2012. Impact Factor 1.555
Asmatullah Chaudhry, Mehdi Hassan, Asifullah Khan, Jin Young Kim,
“Automatic Active Contour Based Segmentation and Classification of Carotid
Artery Ultrasound Images”, “Journal of Digital Imaging” Vol. 26, pp 1071-1081,
2013. Impact Factor 1.10
Asmatullah Chaudhry, Mehdi Hassan, Asifullah Khan, Jin Young Kim, Tran Anh
Tuan, “Automatic Carotid Artery Image Segmentation using Snake Based Model”,
“Journal of Korean Navigation Institute, Vol. 17, pp. 115-122, 2013”. Impact
Factor 0.278
Asmatulalh Chaudhry, Asifullah Khan, Anwar M. Mirza, Asad Ali, Mehdi
Hassan, Jin Young Kim, “Neuro Fuzzy and Punctual Kirging based Filter for
Image Restoration”, Applied Soft Computing, Vol. 13, 2012. Impact Factor
2.526.
Jan Alam, Mehdi Hassan, Asifullah Khan, Asmatullah Chaudhry, “Robust Fuzzy
RBF Network Based Segmentation and Intelligent Decision Making System for
Carotid Artery Ultrasound Images” “Neurocomputing” Vol. 151, pp. 745-755,
2015. Impact Factor 2.005
Asmatullah Chaudhry, Mehdi Hassan, Asifullah Khan, Robust Segmentation of
Carotid Artery Ultrasound Images using Neuro Fuzzy and Expectation
Maximization: Employing Intima-Media Thickness and SVM for Disease
Prediction, Submitted in Information Sciences, Journal, 2015.
Proceedings in National/International Conferences:
Asmatullah Chaudhry, Mehdi Hassan, Asifullah Khan, Jin Young Kim, Tran Anh
Tuan, Image clustering using Improved Spatial Fuzzy C-means. (ACM, ICUIMC,
12).
Mehdi Hassan, Asmatullah Chaudhry, Asifullah Khan, Kashif Riaz, An
Optimized Fuzzy C Means Clustering with Spatial Information for Carotid Artery
Image Segmentation. (IEEE, IBCAST, 2011).

xix
Mehdi Hassan, Asmatullah Chaudhry, Asifullah Khan, M. Aksam Iftikhar, Jin
Young Kim, Medical Image Segmentation Employing Information Gain and
Fuzzy C-means Algorithm, IEEE, ICOSST, Lahore, 2013.
Book Chapter:
Asmatullah Chaudhry, Mehdi Hassan, Asifullah Khan, Jin Young Kim, Tran Anh
Tuan, “Automatic Segmentation and Decision Making of Carotid Artery
Ultrasound Images”, Advances in Intelligent Systems and Computing, ISI
Indexed 2012.

xx
List of Symbols
nu nth order moment about mean
Standard deviation 2
Variance
ip z Probability of z for ith intensity value
iju Fuzzy membership function
iv Center of ith cluster.
kM kth classifier/cluster
|
k
iM
y c xP
Conditional probability of y on c value for x instance
ns The average distance of all objects from cluster centeriods.
Set of all possible points
x Observed/Pixel value
X Set of observed data points
Unknown log likelihood parameter need to be estimated
,L The log likelihood function
J Objective function
cW Weights between hidden and output node c
Smoothing parameter
, ,pL pM pHZ Z Z Low, medium and high linguistic property sets
p Z Input vector for low, medium and high linguistic property
sets
Normalization factor
pT Z Obtained target vector
rE Error rate
mcpN Number of misclassified pixels
Class probability separated by specific threshold
Morphological erosion
Morphological dilation
E v Energy function of snake
, ,M C K Mass, damping and stiffness matrices q External force
,s tv Element along snake contour
2
2
d
dt
u Second order snake function derivative
Observed value mean
xxi
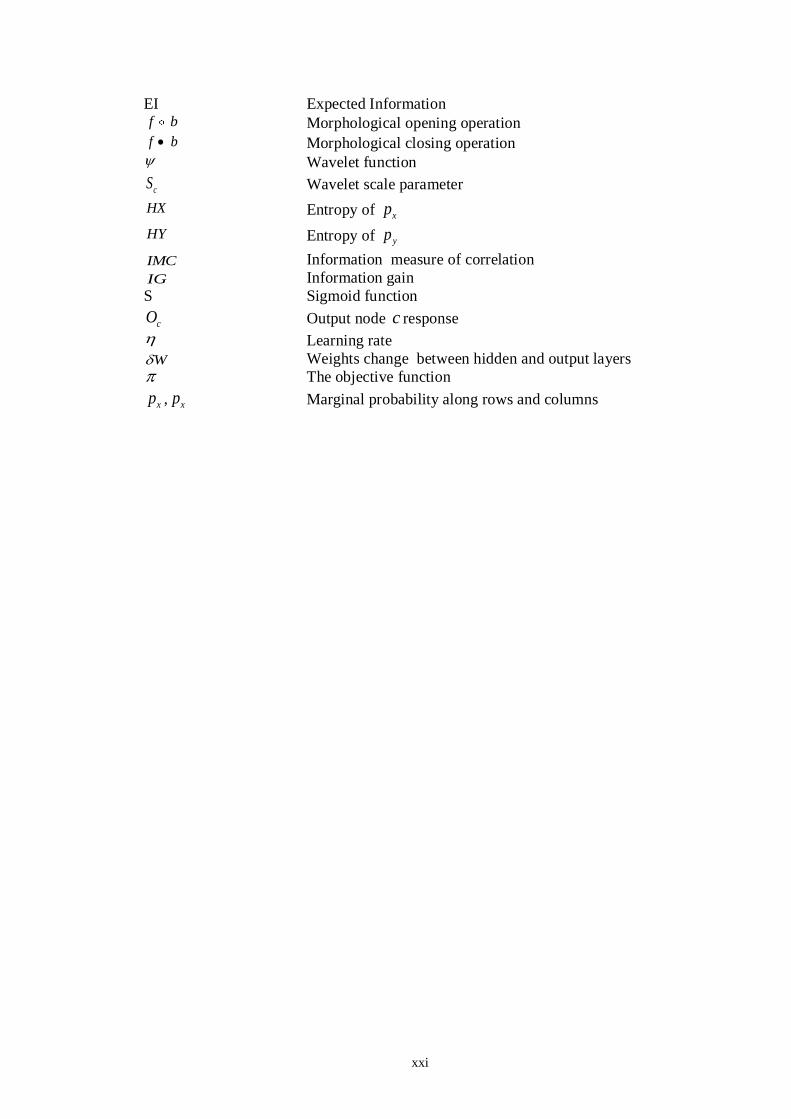
EI Expected Information f b Morphological opening operation
f b Morphological closing operation Wavelet function
cS Wavelet scale parameter
HX Entropy of xp
HY Entropy of yp
IMC Information measure of correlation
IG Information gain
S Sigmoid function
cO Output node c response
Learning rate
W Weights change between hidden and output layers
The objective function
xp , xp Marginal probability along rows and columns
xxii
List of Abbreviations
TIA Transient Ischemic Attack
MRA Magnetic Resonance Angiogram
CTA Computed Tomography Angiogram
CAD Computer Aided Diagnostics
IMT Intima Media Thickness
FCM Fuzzy C-Means
sFCM Spatial Fuzzy C-Means
sFCMM Spatial Fuzzy C-Means Modified
MGH Moments of Gray Level Histogram
ROI Region of Interest
MLBPNN Multi-Layer Backpropagation Neural Networks
FFT Fast Fourier Transform
SVM Support Vector Machine
KNN K Nearest Neighbors
PSNR Peak Signal to Noise Ratio
GLCM Gray Level Co-occurrence Matrix
CWT Continuous Wavelet Transform
GA Genetic Algorithm
SOM Self-Organizing Maps
DBI Davies Bouldin Index
sFCMLSM Spatial Fuzzy C-Means Level Set Method
IGFCM Information Gain Based Fuzzy C-Means
PNN Probabilistic Neural Networks
ROC Receiver Operating Characteristic
FLICM Fuzzy Local Information C-Means
AUC Area Under the Curve
RSC-US Robust Segmentation and Classification of Ultrasound
Images
EM Expectation Maximization
GMM Gaussian Mixture Model
NFC Neuro Fuzzy Classifier
FIS Fuzzy Inference System
RFRBFN Robust Fuzzy Radial Basis Function Networks

1
Chapter 1 : Background and Goals of Study
Carotid arteries supply oxygenated blood to the brain. These vital arteries reside at
each side of the lower neck, below the jaw. The carotid arteries are further divided
into internal and external carotid arteries. The internal carotid artery supply blood to
the brain, where thinking, sensory, personality, speech and motor functions reside.
Whereas, the external carotid artery is used to supply blood to human face, neck and
scalp [1].
Carotid artery stenosis is the process of narrowing the artery due to the
presence of atherosclerosis. A plaque is built up in carotid artery because of the
atherosclerosis which is formed by the excess amount cholesterol and other fatty
materials. This plaque may partially or fully block the blood flow to the brain and the
probability of cerebrovascular accident (stroke) became very high [1, 2].
Cerebrovascular accident occurs when blood supply to the brain is stopped or
the blood vessel bursts. As, there is no mechanism in which brain can store oxygen,
hence the brain solely depend on the internal carotid artery which provides oxygen-
rich blood [2]. Cerebrovascular attack can occur due to the following reasons:
Due to the presence of plaque, carotid artery becomes narrow
When plaque ruptures, small pieces of plaque drift to the brain
Carotid artery becomes narrowed, due to the formation of blood clots
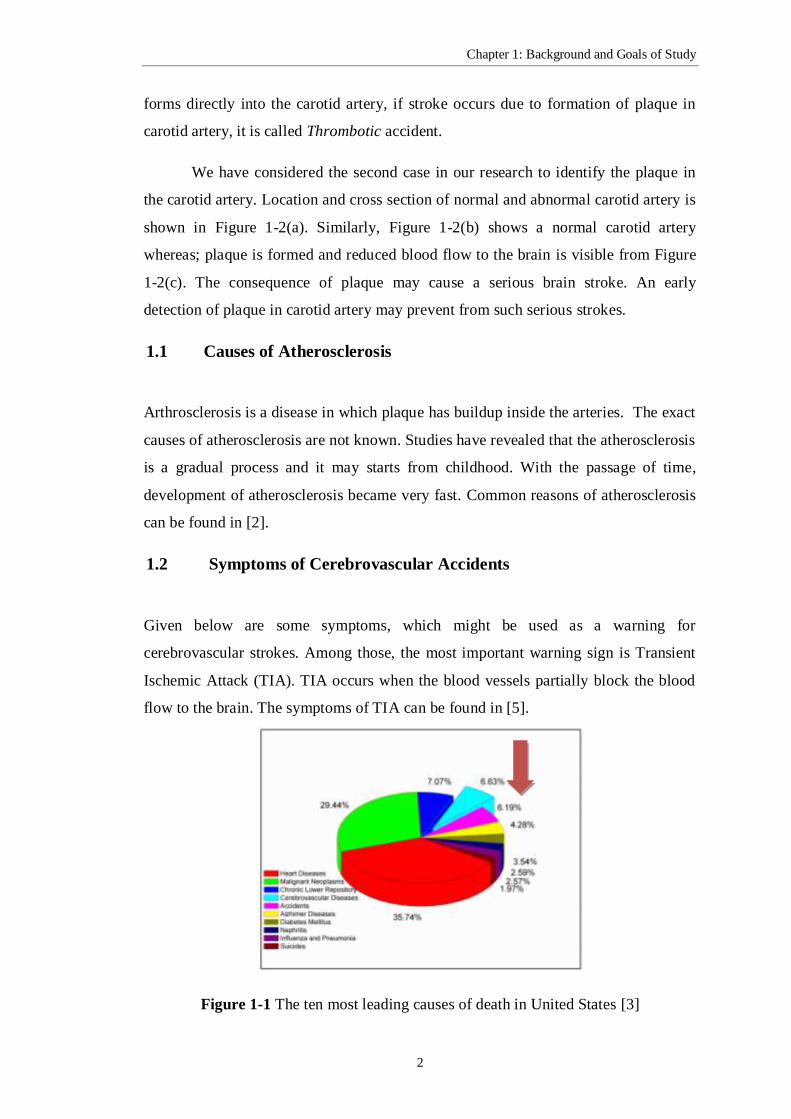
Figure 1-1 shows the ten most leading causes of deaths in United States.
Among those, cerebrovascular accident is the fourth leading cause of deaths in United
States. A total of 129476 deaths have been reported because of cerebrovascular
accidents in United States in year of 2010 only [3]. There are two common types of
cerebrovascular accidents (strokes), Ischemic and Hemorrhagic [4]. Ischemic stroke
mostly occurs in two ways: first, formation of clots somewhere in the body and
wedged into the blood vessel supplying oxygenated blood to the brain. If stroke
occurs in this way it is known as Embolic stroke. Secondly, a blockage or plaque
Chapter 1: Background and Goals of Study
2
forms directly into the carotid artery, if stroke occurs due to formation of plaque in
carotid artery, it is called Thrombotic accident.
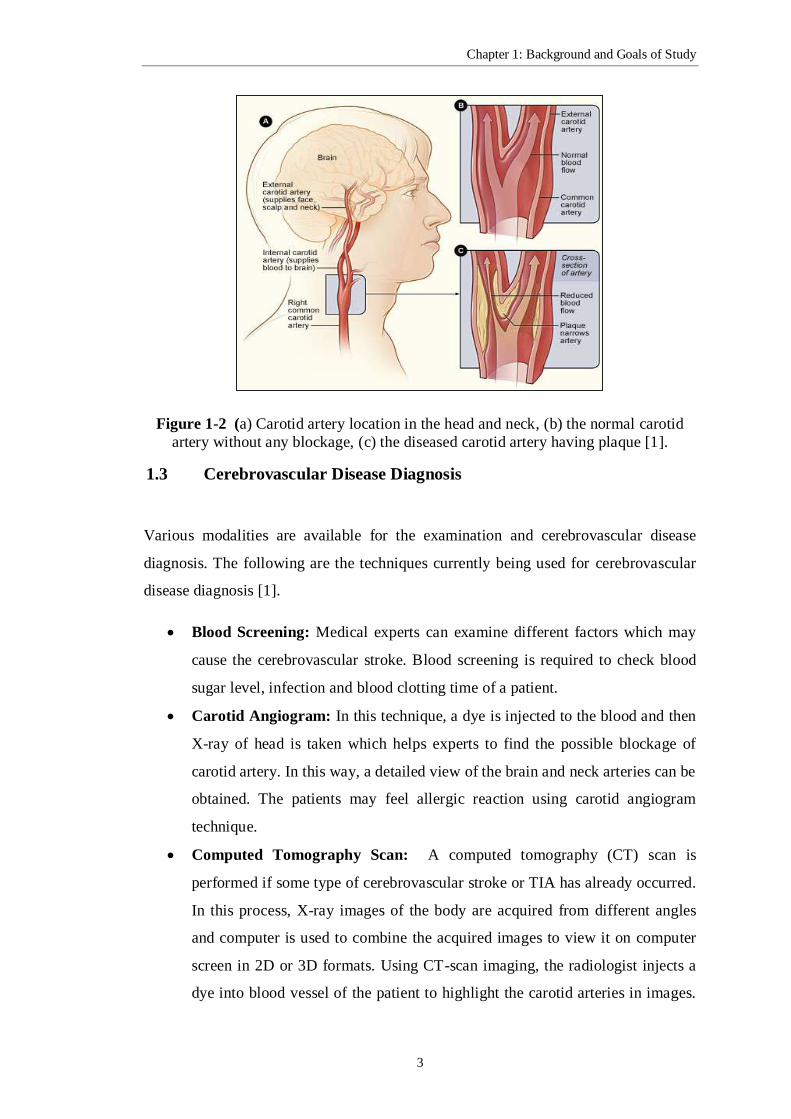
We have considered the second case in our research to identify the plaque in
the carotid artery. Location and cross section of normal and abnormal carotid artery is
shown in Figure 1-2(a). Similarly, Figure 1-2(b) shows a normal carotid artery
whereas; plaque is formed and reduced blood flow to the brain is visible from Figure
1-2(c). The consequence of plaque may cause a serious brain stroke. An early
detection of plaque in carotid artery may prevent from such serious strokes.
1.1 Causes of Atherosclerosis
Arthrosclerosis is a disease in which plaque has buildup inside the arteries. The exact
causes of atherosclerosis are not known. Studies have revealed that the atherosclerosis
is a gradual process and it may starts from childhood. With the passage of time,
development of atherosclerosis became very fast. Common reasons of atherosclerosis
can be found in [2].
1.2 Symptoms of Cerebrovascular Accidents
Given below are some symptoms, which might be used as a warning for
cerebrovascular strokes. Among those, the most important warning sign is Transient
Ischemic Attack (TIA). TIA occurs when the blood vessels partially block the blood
flow to the brain. The symptoms of TIA can be found in [5].
Figure 1-1 The ten most leading causes of death in United States [3]
Chapter 1: Background and Goals of Study
3
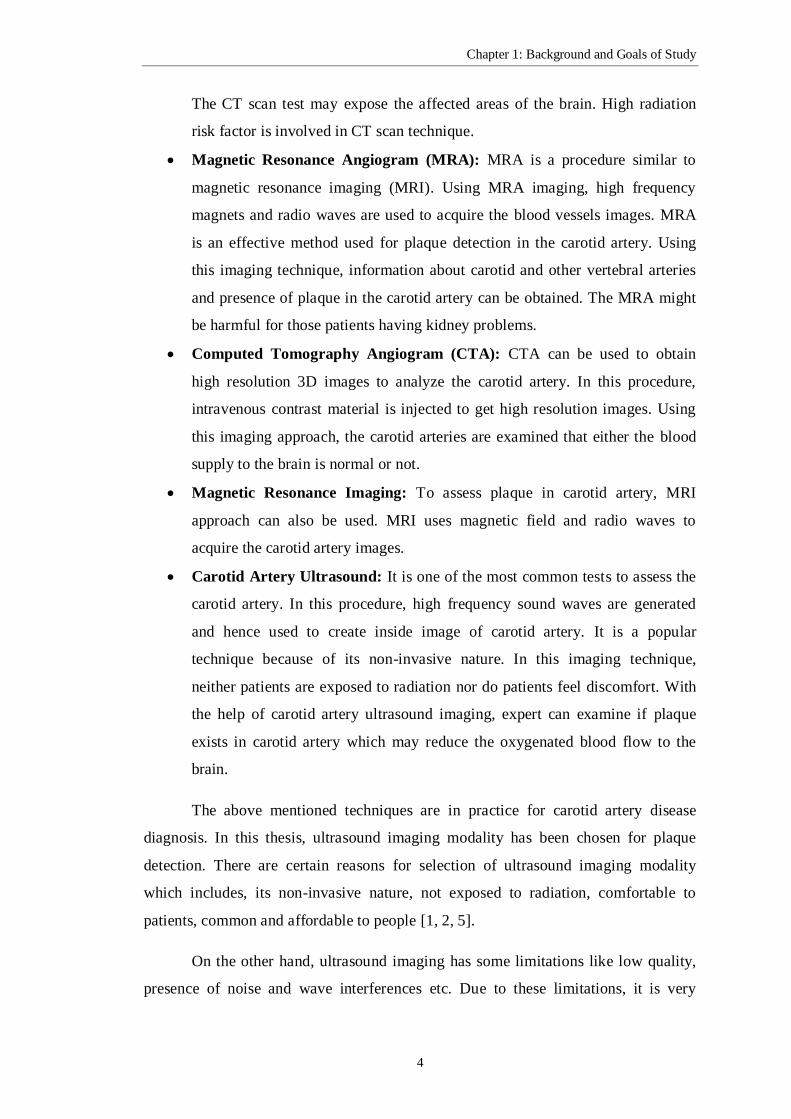
Figure 1-2 (a) Carotid artery location in the head and neck, (b) the normal carotid
artery without any blockage, (c) the diseased carotid artery having plaque [1].
1.3 Cerebrovascular Disease Diagnosis
Various modalities are available for the examination and cerebrovascular disease
diagnosis. The following are the techniques currently being used for cerebrovascular
disease diagnosis [1].
Blood Screening: Medical experts can examine different factors which may
cause the cerebrovascular stroke. Blood screening is required to check blood
sugar level, infection and blood clotting time of a patient.
Carotid Angiogram: In this technique, a dye is injected to the blood and then
X-ray of head is taken which helps experts to find the possible blockage of
carotid artery. In this way, a detailed view of the brain and neck arteries can be
obtained. The patients may feel allergic reaction using carotid angiogram
technique.
Computed Tomography Scan: A computed tomography (CT) scan is
performed if some type of cerebrovascular stroke or TIA has already occurred.
In this process, X-ray images of the body are acquired from different angles
and computer is used to combine the acquired images to view it on computer
screen in 2D or 3D formats. Using CT-scan imaging, the radiologist injects a
dye into blood vessel of the patient to highlight the carotid arteries in images.
Chapter 1: Background and Goals of Study
4
The CT scan test may expose the affected areas of the brain. High radiation
risk factor is involved in CT scan technique.
Magnetic Resonance Angiogram (MRA): MRA is a procedure similar to
magnetic resonance imaging (MRI). Using MRA imaging, high frequency
magnets and radio waves are used to acquire the blood vessels images. MRA
is an effective method used for plaque detection in the carotid artery. Using
this imaging technique, information about carotid and other vertebral arteries
and presence of plaque in the carotid artery can be obtained. The MRA might
be harmful for those patients having kidney problems.
Computed Tomography Angiogram (CTA): CTA can be used to obtain
high resolution 3D images to analyze the carotid artery. In this procedure,
intravenous contrast material is injected to get high resolution images. Using
this imaging approach, the carotid arteries are examined that either the blood
supply to the brain is normal or not.
Magnetic Resonance Imaging: To assess plaque in carotid artery, MRI
approach can also be used. MRI uses magnetic field and radio waves to
acquire the carotid artery images.
Carotid Artery Ultrasound: It is one of the most common tests to assess the
carotid artery. In this procedure, high frequency sound waves are generated
and hence used to create inside image of carotid artery. It is a popular
technique because of its non-invasive nature. In this imaging technique,
neither patients are exposed to radiation nor do patients feel discomfort. With
the help of carotid artery ultrasound imaging, expert can examine if plaque
exists in carotid artery which may reduce the oxygenated blood flow to the
brain.
The above mentioned techniques are in practice for carotid artery disease
diagnosis. In this thesis, ultrasound imaging modality has been chosen for plaque
detection. There are certain reasons for selection of ultrasound imaging modality
which includes, its non-invasive nature, not exposed to radiation, comfortable to
patients, common and affordable to people [1, 2, 5].
On the other hand, ultrasound imaging has some limitations like low quality,
presence of noise and wave interferences etc. Due to these limitations, it is very
Chapter 1: Background and Goals of Study
5
challenging to analyze and interpret the ultrasound images. It needs considerable
efforts from the radiologists to analyze these images for disease diagnosis. Firstly, as
the volume of medical images is growing day by day, manual interpretation and
analysis of these images in not feasible. Secondly, the variability of opinion across the
human experts is another major problem. Hence, a computer aided diagnostic (CAD)
technique is highly desirable to analyze the bulk of medical images. The objective of
CAD system is to provide additional support to the radiologists. Specifically, effective
computer algorithms are required to separate the region of interest (ROI) and the
structure of an organ automatically. These computer algorithms usually segment the
medical images into specified number of homogenous regions. Segmentation plays
vital role in image analysis such as anatomical structure [6], treatment planning [7],
and computer aided surgery [8].
1.4 Research Objectives and Contributions
There are two main objectives of this research for diagnosis of carotid artery plaque
using carotid artery ultrasound images. First and most important is segregation of
arterial walls of carotid artery from background tissues. This separation requires very
effective image segmentation algorithms which accurately segregate the arterial walls
from background tissues. Successful plaque identification requires accurate intima
media thickness (IMT) measurements from segmented carotid artery images. A great
care is needed to measure the IMT values because the plaque in carotid artery has to
be identified by the IMT measurement. Second objective of this thesis is to propose
an intelligent decision making system based on IMT values which classifies the
segmented images into normal and abnormal subjects.
To achieve these objectives, we have proposed several image segmentation
techniques named spatial fuzzy c-means modified and ensemble clustering,
information gain based fuzzy c-means, expectation maximization, neuro fuzzy,
genetic algorithm and automatic active contour based segmentation. Post processing
technique such as classification highly depends upon quality segmentation. The
proposed approaches outperformed the other state of the art segmentation techniques
like FCM, K-means, sFCM, SOM, FLICM, sFCMLSM.

Chapter 1: Background and Goals of Study
6
In classification, we have employed multilayer backpropagation neural
networks (MLBPNN), support vector machine (SVM), K-nearest neighbors (KNN),
and probabilistic neural networks (PNN) to detect the plaque in carotid artery. High
classification accuracy has been achieved by employing these classification systems.
Further, the effect of segmentation at classification has also been investigated. It has
been observed that accurate segmentation has a high impact on classification stage.
The research contributions of the thesis in the field of medical image analysis and
disease diagnosis are as follows.
Carotid artery segmentation technique named spatial fuzzy c-means modified
(sFCMM) and ensemble clustering has been proposed. Intelligent decision
making system has also proposed to separate out the normal and abnormal
subjects.
Robust information gain based FCM segmentation approach is proposed for
carotid artery ultrasound image segmentation. The proposed technique
outperforms state of the art segmentation approaches.
Segmentation and classification approach is proposed based on EM, neuro
fuzzy, GA and SVM for disease prediction.
Robust Fuzzy RBF network segmentation and intelligent classification
technique for carotid artery ultrasound images is proposed.
Automatic active contour based segmentation approach for carotid artery
ultrasound images is proposed. The segmented images are then classified into
normal and abnormal subjects.
The above mentioned proposed techniques offer quality segmentation and
high classification accuracy on the obtained datasets. Detailed description of the
datasets is presented in Section 2.5.
1.5 Organization of Thesis
The rest of the thesis is organized as follows: Chapter 2 describes a comprehensive
literature survey and related theory of segmentation and classification of carotid artery
ultrasound images. Detail of the datasets used in this research work has also described
in Chapter 2. In Chapter 3, carotid artery segmentation using a modified spatial fuzzy
Chapter 1: Background and Goals of Study
7
c-means and ensemble clustering approach is elaborated. In Chapter 4, information
gain fuzzy c-means clustering has been presented which is used for segmentation and
classification of carotid artery ultrasound images. In Chapter 5, a new robust approach
based on expectation maximization, neuro fuzzy classification and genetic algorithm
for segmentation is described. Chapter 6 presents a novel robust fuzzy radial basis
function network for segmentation and classification of carotid artery ultrasound
images approach. Whereas, in Chapter 7, a new automatic deformable model based
segmentation and classification of carotid artery ultrasound images is presented.
Finally, conclusions and future recommendations are provided in Chapter 8.
8
Chapter 2 : Literature Survey and Related
Concepts
In this chapter, we will present a detailed literature survey about the segmentation,
IMT measurements, and classification of medical images especially carotid artery
ultrasound images. The algorithms which have been used for segmentation of carotid
artery ultrasound images will be discussed with their pros and cons. Intima-media
thickness which is very important for the classification of carotid artery segmented
images will also be discussed. Finally, various classifiers used for identification of
plaque in carotid artery ultrasound images will also be discussed in this chapter.
2.1 Segmentation of Carotid Artery Ultrasound Images
Segmentation is the process of splitting an image into different homogenous regions.
Carotid artery ultrasound images based disease diagnosis is active area of research
and have attracted the attention of many researchers. Main task of segmentation is to
segregate the overlapping organs in medical images into non-overlapping regions. In
medical imaging, multiple tissues are contributing for the formation of a single pixel
so that they blur the boundaries of objects; hence this blurring is called a partial-
volume effect. Owing to the partial-volume effect, soft clustering is a good choice
because the clusters are allowed to overlap in a soft/fuzzy clustering. That is, one
pixel may belong to more than one class with a different degree of membership. In
fuzzy clustering, pixels have different memberships in multiple regions; thus fuzzy
clustering is more informative about original image [9].
Chuang et al. [10] have proposed spatial fuzzy c-means (sFCM) clustering
approach to segment medical images. The sFCM has utilized the spatial information
of the pixel under consideration and incorporates into conventional fuzzy c-means
(FCM). To make the model robust to noise, the objective function of the FCM has
been modified and spatial information has been incorporated into FCM objective
function. The sFCM approach assigns an equal weightage to all pixels of window and
it may produce inhomogeneous clustering. Chaudhry et al. [11] have proposed

Chapter 2: Literature Survey and Related Concepts
9
modification to sFCM for medical image segmentation named it spatial fuzzy c-
means modified (sFCMM). The Euclidean distance based weights have been assigned
to every pixel in sub-window according to pixel contribution. The advantage of
weight assignment is that it becomes robust and produces more homogenous
clustering as compare to sFCM.
Iscan et al. have proposed medical image segmentation technique using
incremental neural networks based on moments of gray level histogram (MGH) and
2D-continous wavelet transform [12]. It has used a high dimensional feature vector
and works only at the small noise levels. Vasantha et al. [13] have proposed
segmentation scheme in which most important features are selected by greedy
stepwise and genetic algorithm among a large set of hybrid features. Carotid artery
ultrasound image segmentation technique based on RANSAC and cubic splines has
been reported in [14]. The technique is computationally expensive and only 50
brightness mode (B-mode) ultrasound images used for evaluation.
Spatial fuzzy clustering and level set methods based medical image
segmentation is reported by Li et al. [15]. They have incorporated partial differential
equations into spatial fuzzy c-means became computationally expensive. Yu et al. [16]
have reported a medical image segmentation technique based on object density. The
marker controlled watershed segmentation approach has been utilized to the object of
interest which is used to identify the region of interest (ROI). Improper selection of
ROI leads to misleading results and over segmentation is one of the major drawbacks
of watershed segmentation.
Mao et al. [17] have used deformable model for extraction of carotid artery
lumen. The images using deformable models are segmented with high accuracy. The
snake based models have been reported in literature to extract the contour of carotid
artery using ultrasound images [18, 19]. However, the snake based/deformable
models have a major limitation in which user intervention is required for snake
initialization. A new Doppler based scheme is proposed by Hovda et al. [20] which
has been used to segment the image by utilizing the blood or tissue characteristics.
Likelihood ratio function was applied for classification however, very difficult to
validate the assumptions of the model and thus the system becomes more complex.

Chapter 2: Literature Survey and Related Concepts
10
Canny edge detector based technique has been proposed by Hamou et al. [21]
for segmentation of carotid artery ultrasound images. The proposed technique is based
on three parameters, upper and lower boundary thresholds, and standard deviation of
Gaussian smoothing kernel. This method is used to wipe out the insignificant details
from the map generated by their technique. Similarly, carotid artery contour
extraction technique is reported by Adel-Dayem et al. [22]. The carotid artery image
pixels have been segmented into three classes, named the arterial wall, an area inside
the artery and background tissues, by employing uniform quantizer. Edges among
these three clusters have been extracted using the morphological edge detector. For
minimizing the effect of noise, they have employed some pre and post-processing
techniques as well. However, the basic limitation of the technique is its low sensitivity
to noise and it may not differentiate the small variation in intensity especially within
the arterial walls.
Segmentation of carotid artery ultrasound images based on watershed
segmentation is reported in [23, 24]. Threshold selection is crucial to region merging
stage which is based on the average of neighboring area pixels. Kamel et al. [25] have
proposed a technique using fuzzy region growing for segmentation of carotid artery
ultrasound images. The technique generates a fuzzy connectedness map of image
which is computationally expensive.
An integrated approach based on snake based model for segmentation of
carotid artery ultrasound images have been proposed by Loizou et al. [26]. Bastida-
Jumilla et al. [27] have reported the common carotid artery segmentation scheme
using frequency implementation for deformable models. Improper initialization by the
inexperienced user may lead toward false results. Chaudhry et al. [28] have proposed
an automatic active contour based segmentation of carotid artery ultrasound images.
The proposed approach overcomes the limitation of manual initialization of snakes
and thus their approach is fully automatic.
Golemati et al. [29] have proposed Hough transform based segmentation of
carotid artery ultrasound images. Hough transform based techniques are useful to
detect lines and circles, however the carotid artery vessels are curvy and Hough
transform based techniques may not accurately segment such images. Moreover the

Chapter 2: Literature Survey and Related Concepts
11
authors tested their approach at 10 B-mode ultrasound images and have performed a
small scale evaluation of stenosis level.
Abdel Dayem and El Sakka [30] have proposed an integrated segmentation
approach which is based on multi-resolution and watershed techniques. Their
objective was to speedup segmentation process. The scheme has been employed to
decompose an image into a pyramid by applying wavelet transform. The proposed
scheme is suitable for noise free images but the noisy images might not be well
segmented by their approach. Dynamic programming based carotid artery ultrasound
image segmentation techniques have been reported in [31, 32]. The dynamic
programming performed well at noise free images, but the computational cost of
dynamic programming is significantly high.
The basic objective of the above mentioned techniques is to segment the
carotid artery ultrasound images in an efficient way. However, every technique has its
own limitations and thus it becomes challenging to segment carotid artery ultrasound
images with high precision.
2.2 Segmentation Algorithms
Detail of the segmentation/clustering algorithms used in our experiments are given
below. Some of our proposed approaches are extension of these algorithms. These
techniques are being successfully used to segment the medical images especially,
carotid artery ultrasound images. Additionally, these state of the art algorithms are
also used to compare the results of the proposed scheme. Detail of each algorithm is
as under:
2.2.1 Fuzzy C-means Clustering
Fuzzy c-means clustering (FCM) [33, 34] is an unsupervised technique that has been
successfully applied to clustering, features analysis and classifier designing in fields
such as image segmentation, medical imaging, astronomy and geology [35]. Similar
to other clustering algorithms, FCM is also used to group similar data points into a
same cluster. The clustering is achieved iteratively, minimizing the cost function, to
decide the fate of pixel to which cluster of pixel may belong.
Chapter 2: Literature Survey and Related Concepts
12
FCM may be one of the candidate techniques for clustering in areas where the
objects regions are overlapped. Image pixels are highly correlated and probability is
high that one pixel may belong to more than one clusters with different degree of
memberships. In such a case, fuzzy clustering algorithm like FCM might be a better
choice for segmentation.
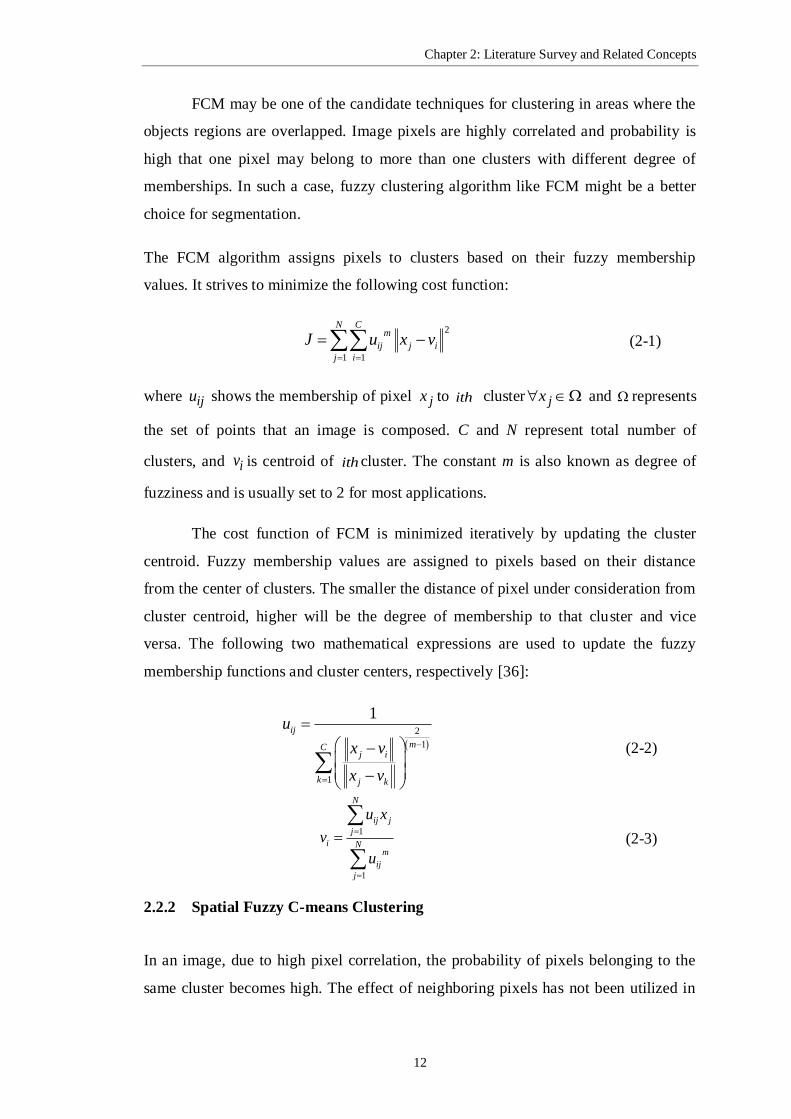
The FCM algorithm assigns pixels to clusters based on their fuzzy membership
values. It strives to minimize the following cost function:
2
1 1
N Cm
ij j i
j i
J u x v
(2-1)
where iju shows the membership of pixel jx to ith cluster jx and represents
the set of points that an image is composed. C and N represent total number of
clusters, and iv is centroid of ith cluster. The constant m is also known as degree of
fuzziness and is usually set to 2 for most applications.
The cost function of FCM is minimized iteratively by updating the cluster
centroid. Fuzzy membership values are assigned to pixels based on their distance
from the center of clusters. The smaller the distance of pixel under consideration from
cluster centroid, higher will be the degree of membership to that cluster and vice
versa. The following two mathematical expressions are used to update the fuzzy
membership functions and cluster centers, respectively [36]:
2
1
1
1ij
mCj i
k j k
u
x v
x v
(2-2)
1
1
N
ij j
j
i Nm
ij
j
u x
v
u
(2-3)
2.2.2 Spatial Fuzzy C-means Clustering
In an image, due to high pixel correlation, the probability of pixels belonging to the
same cluster becomes high. The effect of neighboring pixels has not been utilized in

Chapter 2: Literature Survey and Related Concepts
13
conventional FCM clustering. Using FCM algorithm, a noisy pixel may mislabeled
because of the abnormal feature data. To overcome this problem, Chuang et al. [10]
proposed modification in the basic FCM framework and named it spatial fuzzy c-
means clustering (sFCM) algorithm. In sFCM, the spatial information of pixel is
utilized and an equal weight is assigned to each pixel in sub-window to decide the
pixel’s fate. The advantage of incorporation of spatial information is that the sFCM
algorithm becomes more robust to noise and produces a more homogenous clustering
as compared to FCM algorithm.
The sFCM incorporates spatial information into the basic FCM framework for
clustering.
j
ij ik
k NB x
h u
(2-4)
where jNB x shows a square window centered on jx . Like the membership function
in FCM, ijh shows the probability of pixel belonging to ith cluster. Large spatial
function value shows that majority of the pixels belong to same cluster. Spatial
function has been incorporated into the FCM membership function and new
membership function will become as follows:
'
1
p qij ij
ij cp q
kj kj
k
u hu
u h
(2-5)
2.2.3 Radial Basis Function Network
Unlike the simple neural network, radial basis function has been used in the hidden
units of network as described in [37]. The functions used in the network are strictly
positive and radially symmetric with a unique maxima at its center. The hidden layer
weights were optimized using K-means algorithm [38].
2
1
N
kN p k
p k
J z v
(2-6)
where represents a set of input data points, N is the total number of hidden units,
and kv corresponds to cluster centers of hidden units. Here, we need to find kv that
Chapter 2: Literature Survey and Related Concepts
14
minimizes Equation 2-6. If we use Gaussian as a base function, the response of the
hidden units can be calculated using the following expression:
22
exp
p k
k
z v
k
(2-7)
where 1 2, ,...,p nz z z z corresponds to input data samples. Response of each output
node is simply a linear combination of kernel functions:
c c j
j k
O W
(2-8)
where cO is the response output of node c and cW represents the weights between the
hidden layers and the output of node c .
2.2.4 Fuzzy Radial Basis Function Networks
Fuzzy Radial Basis Function Network [38] combines FCM and RBF approaches.
Weights of hidden layers (cluster centriod kv ) are updated using FCM, instead of K-
means clustering. In fuzzy RBF network, fuzziness has been incorporated at input and
output layers. To compute pku locally, a modified RBF network was used [38]. Using
this modified architecture, the output of each hidden layer is calculated by the
Equation 2-9.
2
1
1
q
p
k
p k
p
z v
(2-9)
In FRBF, weights between hidden and output layers are optimized using
gradient descent algorithm. Response of each output node is calculated using the
following expression:
c ck kp
k N
O W u
(2-10)
Chapter 2: Literature Survey and Related Concepts
15
2.2.5 K-means Clustering
K-means clustering is an unsupervised technique of clustering. The K-means is a
commonly used algorithm in computer vision for image segmentation [39] . It is an
iterative approach to update cluster center or mean to classify the whole data.
2.2.6 Self-Organizing Maps (SOM)
Self-organizing maps (SOM) is learning algorithm that produces low dimension input
space for training samples. Kohonen has developed the technique with self-
organizing for a network of adaptive elements [40]. The SOM algorithm follows two
basic principles; matching and finding that determine the winner neuron by the
minimum Euclidean distance to the input and update the position of neurons inside
the cluster.
2.3 IMT Measurements
IMT measured values are used to identify the presence of plaque in carotid artery [41,
42]. High IMT value is associated with high risk of cerebrovascular stroke. Keeping
the importance of IMT measurements, it is essential that IMT should be measured
accurately. For accurate IMT measurements, it is necessary that the arterial walls
should be separated accurately from background tissues.
IMT is the width including lumen-intima and the media adventitia [43]. As the
atherosclerosis and other fatty materials narrow the carotid artery, hence due to the
presence of plaque blood supply to the brain is reduced. IMT is one of the important
measures being successfully used for identification of plaque in the carotid artery. The
atherosclerotic changes are reflected by IMT measurements and thus can be used to
predict the cerebrovascular accident (stroke). The certain factors should be considered
while measuring IMT, i.e. age, gender, body to mass index (BMI), high blood
pressure and diabetic patients [44-50]. Classification of the segmented carotid artery
is vital because patient’s rehabilitation process may start. The decision system for
carotid artery plaque detection can be formed based on the IMT values.

Chapter 2: Literature Survey and Related Concepts
16
2.4 Classification of Carotid Artery Ultrasound Images
The main objective of the classification is to divide an input dataset into various
categories. The input data need to be classified on the basis of classifier’s training. In
our case, the carotid artery ultrasound images segmented by the proposed techniques
need to be classified into normal or abnormal subjects. A number of classifiers (linear
and non-linear) have been reported in the literature to classify the input data into
specified number of classes. The classification phase results are highly dependent
upon the accurate IMT measurements. It is possible only when the carotid artery
ultrasound images are segmented correctly.
Texture based classification of carotid artery plaque is proposed by
Christodoulou et al. [51]. A set of statistical and gray level dependence feature
vectors has been formed to classify the carotid artery plaque. The technique might be
computationally expensive because of large feature vector dimensions. K-nearest
neighbors (KNN) based classification of carotid artery plaque is reported in [52]. A
large dimension of feature set including shape, texture, statistical and morpholog have
been extracted and given as an input to KNN classifier. Similarly, KNN based
classification of carotid artery plaque have been investigated in [26]. A robust
decision system based on KNN for identification of plaque in carotid artery has been
proposed by Latifoglu et al. [53]. The fast Fourier transform (FFT) based features are
extracted and important features are selected using principal component analysis
(PCA). Similarly, spatial gray level dependence matrices features were extracted and
consequently used for plaque classification employing SVM classifier [54].
Multilayer back-propagation neural networks (MLBPNN) based classification
of carotid artery plaque has been reported in [32]. The probability of MLBPNN
approach to trap into a local minima is high. Support vector machine (SVM) and
probabilistic neural network based classification of atherosclerosis tissues have been
reported in [55]. The authors have achieved the classification accuracy of upto 90%.
The post-processing techniques (classification in this case) highly depend
upon quality segmentation. The efficiency of decision system can be examined by
high classification accuracy. It is essential for computer aided diagnostic (CAD)
system to distinguish the abnormal subjects from normal ones.
Chapter 2: Literature Survey and Related Concepts
17
2.5 Carotid Artery Ultrasound Images Datasets
It is very important for any segmentation algorithm to test its worth at a significant
amount of dataset. To the best of our knowledge, we could not find any standard
dataset of carotid artery ultrasound images. We have formed a real carotid artery
ultrasound images dataset and made collaboration with Radiology department, Shifa
International Hospital Islamabad, Pakistan. We have frequently visited and have
arranges meetings with the medical experts to understand the basic phenomenon and
problems are faced by experts for identification of carotid artery plaque. After a
careful study, to coup with those problems, we have proposed several new algorithms
for solution of those problems. The detail of the datasets used in the whole study is
given below.
In Shifa International Hospital Islamabad, Toshiba Xario XG Ultrasound
machine is being used for carotid artery examination. The machine is equipped with
Linear Probe Transducer and the frequency of range 7-8 MHz has employed for
carotid artery imaging. The carotid artery data was originally recorded videos taken
for 10 seconds. These videos have been then converted into frames using video
Decompiler. The original images are the size of 800x600 pixels with a resolution of
72 pixels per inch (PPI). The images were cropped from borders to separate area of
interest and converted into gray scale before further processing has been applied. The
size of cropped images reduced to 350x380 pixels.
The whole dataset consists of 350 carotid artery ultrasound images. A total of
57 patients’ data (including males and females) was obtained. The age of the patients
was in the range of 35-76 years. Overall mean and standard deviation of the patients’
age is 61.75 and 7.67 years respectively.
With the help of medical experts, images in the dataset were labeled as normal
or abnormal subjects. The benefit labeling the images was to test the classification
performance based on the proposed segmentation algorithms. Training of classifiers
needs class labels for learning the patterns effectively and based on the learned
patterns, it might be able to classify the test images with high accuracy. The dataset is
obtained step by step depends upon the arrival of patients to the hospital for carotid
artery examination. This is why different number of images has been used for
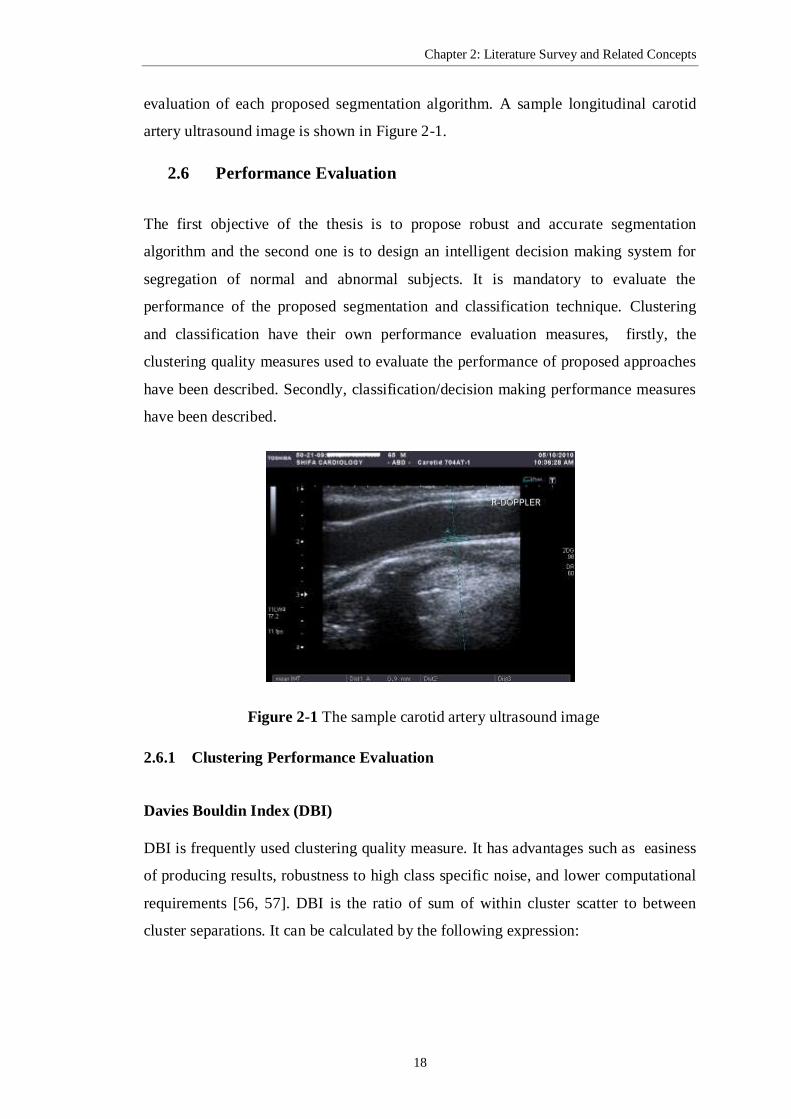
Chapter 2: Literature Survey and Related Concepts
18
evaluation of each proposed segmentation algorithm. A sample longitudinal carotid
artery ultrasound image is shown in Figure 2-1.
2.6 Performance Evaluation
The first objective of the thesis is to propose robust and accurate segmentation
algorithm and the second one is to design an intelligent decision making system for
segregation of normal and abnormal subjects. It is mandatory to evaluate the
performance of the proposed segmentation and classification technique. Clustering
and classification have their own performance evaluation measures, firstly, the
clustering quality measures used to evaluate the performance of proposed approaches
have been described. Secondly, classification/decision making performance measures
have been described.
Figure 2-1 The sample carotid artery ultrasound image
2.6.1 Clustering Performance Evaluation
Davies Bouldin Index (DBI)
DBI is frequently used clustering quality measure. It has advantages such as easiness
of producing results, robustness to high class specific noise, and lower computational
requirements [56, 57]. DBI is the ratio of sum of within cluster scatter to between
cluster separations. It can be calculated by the following expression:

Chapter 2: Literature Survey and Related Concepts
19
1
( ) ( )1DBI max
( , )
nn i n j
i i j
Q s Q
n s Q Q
s
(2-11)
where n represents number of clusters, ns is an average distance of all objects from
cluster to the cluster centroid and ,i js Q Q is the distance between cluster centers.
The ratio will be small, if clusters are compact and far from each other. It means that
the smaller the DBI is the better the clustering quality is [58, 59].
Partition Coefficient (PC)
The PC index proposed by Bezdek [60] is a fuzzy clustering quality measure and used
to measure the amount of overlap between clusters. PC index is used to evaluate the
presence of fuzziness in partitions/clusters. Maximal value of PC represents the best
possible clustering [59]. It can be calculated by the following expression:
2
1 1PC
n c
ijj i
u
n
(2-12)
where iju shows the fuzzy membership of data point j to cluster i .
Classification Entropy (CE)
Similar to PC measure, CE is another measure to evaluate the fuzziness of
partitions/clusters. Minimal value of CE shows better clustering [59, 61]. Classification
entropy can be computed as:
21 1
1CE log ( )
c n
ij iji j
u un
(2-13)
where iju is the fuzzy membership of data point j belonging to cluster i .
To check the clustering quality the above mentioned quality measures have been
calculated for each of the segmented carotid artery ultrasound images.
Chapter 2: Literature Survey and Related Concepts
20
2.6.2 Classification Performance Evaluation
In statistical prediction, to check the effectiveness of the classifier, different types of
cross validation techniques are in practice. Among those, Jackknife technique is a
popular one. It gives unique results for a given dataset. It is being used by the analysts
to validate the accuracy of prediction. In our work, we have used Jackknife validation
technique to examine the quality of classifier. According to Jackknife test, N-1 data
samples are used for training and one data sample for testing. The class of the test
pattern is predicted by the classifier based on the N-1 training data samples. The
sampling process is repeated for N times and the class of each test sample is
predicted. The true positive (TP) and true negative (TN) are the number of correctly
classified positive and negative test samples. False positive (FP) and false negative
(FN) numbers represent those images whether are they incorrectly classified or not,
respectively. Following measures are used to evaluate the performance of a classifier
[59].
Accuracy
The accuracy measure is used to check the overall usefulness of the classifier. It can
be expressed by the following equation.
Accuracy 100TP TN
TP FP TN FN
(2-14)
Sensitivity
This measure is used to check if, either the classifier is able to predict the positive
class patterns. Sensitivity of a classifier can be calculated by the following equation.
SensitivityTP
TP FN
(2-15)
Specificity
The specificity is used to validate how much ability of a classifier has to recognize the
negative class patterns. Specificity can be calculated by the following expression.
SpecificityTN
TN FP
(2-16)
Chapter 2: Literature Survey and Related Concepts
21
Mathew Correlation Co-efficient (MCC)
MCC is used to measure the classifier performance for binary classes having the value
range from -1 to 1. MCC value +1 means perfect classification having no mistake, zero
MCC value means a random prediction and -1 MCC value means that classifier never
predict a correct label. MCC measure can be obtained using the following expression:
MCC
)
TP TN FP FN
TP FN TP FP TN FN TN FP
(2-17)
F-Score
The F-score considers both precision and recall to measure the validation of a
classifier. Its value ranges from 0 to 1 and is a weighted average of the precision and
recall. Value 0 and 1 shows worst and best scores, respectively. The F-score is
calculated by the following formula:
precision recallF.Score 2
precision recall
Precision= ,Recall=TP TP
TP FP TP FN
(2-18)
Negative Predicted Value (NPV)
The NPV measure is used for evaluation of diagnostic performance. High value of
NPV indicates high probability that a patient is free from the disease against which
the test was conducted. NPV is calculated by the following equation [62]:
NPV 100TN
FN TN
(2-19)
ROC Curve
ROC curve is a graphical representation of true positive vs. false positive rates. It is
one of the effective measures in disease diagnostic tests. It is widely being exploited in
radiological tests to evaluate the performance of a medical test. ROC is used to show
the performance of binary classifier by varying threshold. ROC curve is obtained from
the true rate and false positive rate (1-specificity).

22
Chapter 3 : Carotid Artery Image Segmentation
using Modified Spatial Fuzzy C-means and
Ensemble Clustering
In this chapter, first we thoroughly discuss the proposed clustering approach, which
is used to segment carotid artery ultrasound images. The proposed clustering approach
is an extension of spatial fuzzy c-means (sFCM) developed by Chuang et al. [10]. In
addition, an intelligent decision making system has been designed for segregation of
carotid artery ultrasound images into of normal or abnormal subjects. Enhanced
classification performance has been achieved based on the proposed approach
segmentation in comparison to the existing state of the art approaches.
3.1 The Proposed Spatial Fuzzy C-means Modified (sFCMM)
The proposed sFCMM is used to overcome the limitation of sFCM [10]. The sFCM
technique assigns equal weightage to all pixels in sub-window which may produces
noisy clusters. The objective function of the sFCM has been modified such that it
includes a weightage for every pixel of window has proposed. The advantage of the
new membership function is that it is tolerant to noise and offers homogenous
clustering compare to some other states of the art clustering techniques. In sFCMM,
we have considered spatial information of pixel under consideration, which contribute
more to decide the fate of pixel. Detail of the proposed sFCMM can be found in
Section 3.1.4. In addition to this, we have explored the ensemble clustering of
majority voting.
The proposed scheme consists of four stages:
a. Pre-processing
b. Feature extraction and selection
c. Image segmentation
d. IMT measurements and classification of segmented carotid artery ultrasound
images
Chapter 3: Carotid Artery Image Segmentation using Modified Spatial Fuzzy C-means and Ensemble
Clustering
23
Each and every phase of the proposed scheme is explained below and the block
diagram of the proposed scheme is depicted in Figure 3-1.
3.1.1 Image Pre-processing
Ultrasound imaging has several types of degradations such as low quality, speckle
noise, wave interferences and subject movements. It is convenient to minimize these
degradations as much as possible in pre-processing phase. The advantage of image
pre-processing phase is that one can get better segmented images. To increase the
dynamic range, histogram equalization has been applied on carotid artery ultrasound
images [63]. Several approaches have been reported in literature to minimize the
degradations due to noise such as median, bilateral, and antistrophic diffusion filtering
[64-67].
To reduce the effect of noise, we have employed median and bilateral filtering
on carotid artery ultrasound images. The PSNR of both filtered images have been
computed and a noise removal filter is selected having maximum PSNR values.
Median filter with PSNR value 35.51db has been chosen as compared to bilateral
filtering having PSNR value of 28,12db. Median filter is easy to implement technique
and preserve the image details. Impact of median and bilateral filters at segmentation
has also investigated.
3.1.2 Feature Extraction
The objective of feature extraction phase is to formulate a feature vector for every
pixel. In this work, three different types of feature extraction strategies named as
moments of gray level histogram (MGH), continuous wavelet transforms (CWT) and
gray level co-occurrence matrix (GLCM) have been employed. These combined
features are hence used for segmentation of carotid artery ultrasound images. The
extracted features have advantages to represent the medical images [63, 68]. Brief
description of each feature extraction strategy is given below.

Chapter 3: Carotid Artery Image Segmentation using Modified Spatial Fuzzy C-means and Ensemble
Clustering
24
Figure 3-1 Block diagram of the proposed scheme
Moments of Gray Level Histogram
MGH is a frequently used statistical technique of feature extraction which is based on
intensity histogram to represent the medical images. The histogram based features
have better capability to represents the normal and abnormal tissues in medical
images [69]. Nine MGH features are extracted from the carotid artery ultrasound
image [63, 68]. The following expression nu is used to find the nth order moment
about the mean:
where z represents the intensity and ip z is the intensity histogram in the specified
region, m is average intensity level, and L is the total possible intensity level.
The mathematical expressions to find MGH features are given below:
1
0
Mean FM1 . ( )L
i ii
z p z
(3-2)
1
0
( ) . ( )L
n
n i ii
u z m p z
(3-1)

Chapter 3: Carotid Artery Image Segmentation using Modified Spatial Fuzzy C-means and Ensemble
Clustering
25
2Standard Deviation FM2 u (3-3)
1Smoothness FM3 1
1
(3-4)
13
0
Third moment FM4 ( ) . ( )L
i ii
z m p z
(3-5)
12
0
Uniformity FM5 ( )
L
i
i
p z
(3-6)
1
2
0
Entropy FM6 ( ).log ( ( ))
L
i i
i
p z p z
(3-7)
13
0
FM7 ( )
L
i
i
p z
(3-8)
14
0
FM8 ( )
L
i
i
p z
(3-9)
15
0
FM9 ( )
L
i
i
p z
(3-10)
These features are extracted to segment the carotid artery ultrasound images.
Window size of 5x5 has been used and dimension of the image remains same for the
feature extraction strategy. The 7 , 8 , and 9th th th moments have been utilized in
literature for segmentation of medical images [12].
2D-Continuous Wavelet Transform
Since, the medical images used in our experiment are non-stationary in nature and it is
convenient to analyze non-stationary signals using continuous wavelet transform [70].
In pattern recognition 2D-CWT offers robust processing and analysis. Rather than
pixel evaluation, 2D-CWT evaluates the whole image [12]. To overcome the
computational complexity and speed up CWT, the concept of cover-map has been
introduced [71]. The wavelet function used in this study is defined as:

Chapter 3: Carotid Artery Image Segmentation using Modified Spatial Fuzzy C-means and Ensemble
Clustering
26
, ,
1cu s
c c
x ux r
s s
(3-11)
where u is translation and cS is scale parameters, respectively. and r are rotation
angle and rotation matrix with respect to angle, respectively. We have exploited
the scale parameter only for feature extraction, keeping default value for rotation and
translation parameters (i.e. zero).
We have obtained a total of nine features at different scales, which outputs
different filtered images, corresponding to lower frequency bands. Related to 2D-
CWT (Gaussian wavelet) feature extraction strategy, scale parameter is very
important. Smooth areas become visible at higher scale values and high frequency
components (edges) become clear at lower scale values. A number of scale parameter
values ranging 1 to 10 have been utilized to extract features from carotid artery
ultrasound images. Through experiment, it has been observed that eight out of ten
scale values are well enough to segment the images and the remaining redundant scale
parameter values contribute less for segmentation. We have empirically found that
these scale parameter value (i.e. 1.0, 1.6., 2.6, 3.9, 4.0, 5.0, 5.4 and 7.0) produces
better segmentation results.
Gray Level Co-Occurrence Matrix
The GLCM feature extraction strategy is a statistical approach finding in which pixels
spatial relationship is explored also known as gray level spatial dependence matrix.
By default, the spatial relationship of a pixel is defined as the pixel under
consideration and its immediate right neighboring pixel (horizontally adjacent). But
the relationship can be specified between two pixels into diagonal, off-diagonal etc.
In resultant GLCM, an element (J, K) represents the sum of the number of times a
pixel J occurred in a specified spatial relationship with a pixel K of the input image
[13]. A fixed size window of 5x5 has been used for GLCM feature extraction strategy.
From statistical viewpoint, when using a small window size the extracted spatial
information may not be reliable. Alternatively, if window size becomes too large, it
may lead to erroneous textural information. A total of 17 GLCM features have been
extracted from the image and mathematical description of each feature is given below:
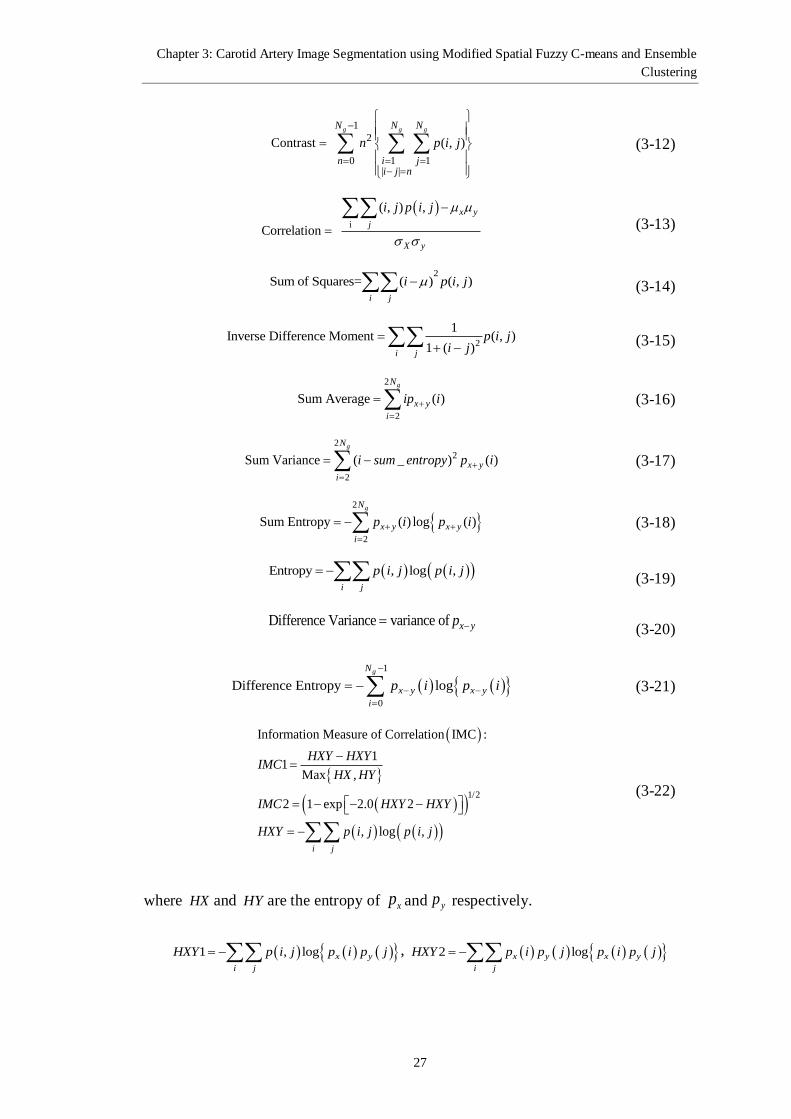
Chapter 3: Carotid Artery Image Segmentation using Modified Spatial Fuzzy C-means and Ensemble
Clustering
27
1
2
0 1 1| |
Contrast ( , )
g g gN N N
n i ji j n
n p i j
(3-12)
i
( , ) ,
Correlation
x y
j
X y
i j p i j
(3-13)
2Sum of Squares= ( ) ( , )
i j
i p i j (3-14)
2
1Inverse Difference Moment ( , )
1 ( )i j
p i ji j
(3-15)
2
2
Sum Average ( )
gN
x y
i
ip i
(3-16)
2
2
2
Sum Variance ( _ ) ( )
gN
x y
i
i sum entropy p i
(3-17)
2
2
Sum Entropy ( ) log ( )
gN
x y x y
i
p i p i
(3-18)
Entropy , log ,
i j
p i j p i j (3-19)
Difference Variance variance of x yp (3-20)
1
0
Difference Entropy log
gN
x y x y
i
p i p i
(3-21)
1/2
Information Measure of Correlation IMC :
11
Max ,
2 1 exp 2.0 2
, log ,
i j
HXY HXYIMC
HX HY
IMC HXY HXY
HXY p i j p i j
(3-22)
where HX and HY are the entropy of xp and yp respectively.
1 , log x y
i j
HXY p i j p i p j , 2 logx y x y
i j
HXY p i p j p i p j
Chapter 3: Carotid Artery Image Segmentation using Modified Spatial Fuzzy C-means and Ensemble
Clustering
28
1 1,
20 0
Homogeneity
N Ni j
i j
p
i j
(3-23)
1 1
,
0 0
Dissimilarity
N N
i j
i j
p i j
(3-24)
where ,, P i jRp i j is ,i j th the normalized gray tone spatial dependence matrix
entry, and gN is the total unique gray levels in the image.
The autocorrelation, cluster prominence, cluster shade, maximum probability features
have also been extracted from the given image.
3.1.3 Feature Selection
Feature selection is used to reduce the feature vector dimension and improve accuracy
and computational time [13]. Redundant and irrelevant features are excluded from
feature space and only those features having high contribution are selected for
segmentation. High dimensional data needs more computational time and valuable
resources. It is highly required to select the most relevant features to save valuable
resources and computational time. Feature selection is usually done using search
methods. Many search methods have been reported in literature such as, forward
selection, genetic algorithm, greedy search, sequential backward selection, and
particle swarm optimization.
Feature selection has been performed by employing Genetic Algorithm (GA),
an evolutionary approach, which works on the principle of survival of the fittest. GA
is being successfully used to optimize complex problems. The fittest or best
individuals are selected after each generation. These individuals, after crossover and
mutation, produce new offspring, which are supposed to be better than their parents.
In this research work, hybrid extracted features are provided as input to GA for
selection of most important features using WEKA machine learning tool [72]. GA
parameters are set empirically and the following configuration parameters of GA have
been used for feature selection. Except the following (probability of crossover=0.8,
number of generations=100, Population size=100 and probability of mutation=0.1),
default GA parameters of WEKA has been used. The selected features are shown in
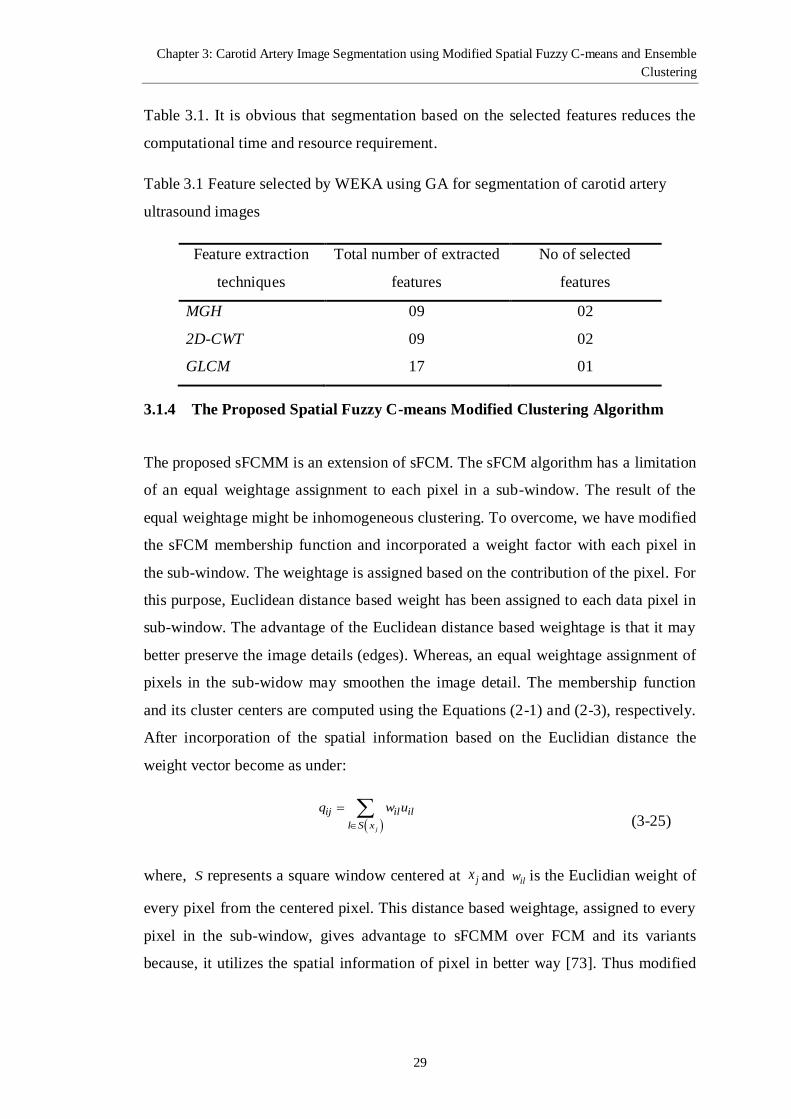
Chapter 3: Carotid Artery Image Segmentation using Modified Spatial Fuzzy C-means and Ensemble
Clustering
29
Table 3.1. It is obvious that segmentation based on the selected features reduces the
computational time and resource requirement.
Table 3.1 Feature selected by WEKA using GA for segmentation of carotid artery
ultrasound images
Feature extraction
techniques
Total number of extracted
features
No of selected
features
MGH 09 02
2D-CWT 09 02
GLCM 17 01
3.1.4 The Proposed Spatial Fuzzy C-means Modified Clustering Algorithm
The proposed sFCMM is an extension of sFCM. The sFCM algorithm has a limitation
of an equal weightage assignment to each pixel in a sub-window. The result of the
equal weightage might be inhomogeneous clustering. To overcome, we have modified
the sFCM membership function and incorporated a weight factor with each pixel in
the sub-window. The weightage is assigned based on the contribution of the pixel. For
this purpose, Euclidean distance based weight has been assigned to each data pixel in
sub-window. The advantage of the Euclidean distance based weightage is that it may
better preserve the image details (edges). Whereas, an equal weightage assignment of
pixels in the sub-widow may smoothen the image detail. The membership function
and its cluster centers are computed using the Equations (2-1) and (2-3), respectively.
After incorporation of the spatial information based on the Euclidian distance the
weight vector become as under:
j
ij il il
l S x
q w u
(3-25)
where, S represents a square window centered at jx and ilw is the Euclidian weight of
every pixel from the centered pixel. This distance based weightage, assigned to every
pixel in the sub-window, gives advantage to sFCMM over FCM and its variants
because, it utilizes the spatial information of pixel in better way [73]. Thus modified

Chapter 3: Carotid Artery Image Segmentation using Modified Spatial Fuzzy C-means and Ensemble
Clustering
30
membership function of the proposed algorithm after including distance based
weightage can be represented as follows:
1
p rij ij
ij cp r
kj kj
k
u qH
u q
(3-26)
The parameters p , r , and other conditions remain same as in spatial fuzzy c-means.
3.1.5 The Proposed Ensemble Clustering Scheme
The main idea behind the ensemble technique is to combine several individual
algorithm results to obtain a segmented image that outperforms every individual
algorithm. Ensemble technique has many advantages; first, it also reduces the risk of
picking the wrong algorithm, second, it also reduces the risk of staying trapped into
local minima, third, one may not be able to obtain the optimal algorithm, hence
combining several classifiers may result in better clustering. Whereas, combining of
several classifiers produce a better approximation of the optimal solution [74]. In this
research work, after obtaining optimized image features by Genetic algorithm and
segmenting by the various algorithm, an ensemble clustering of majority voting
scheme using Expression 3.27 has been applied. Ensemble clustering of majority
voting can be written as:
( )
class argmax ( ( ( ), ))
i
k ic dom y k
x g y x c
(3-27)
where ky x is the classification (segmentation) of the kth classifier and ,g y c is
an indicator function which is defined as:
1 y = c( , )
0 y cg y c
(3-28)
and ky x is defined as:
( )
( ) ( )arg maxk
i
Mk ic dom y
x y c xy P
(3-29)
Chapter 3: Carotid Artery Image Segmentation using Modified Spatial Fuzzy C-means and Ensemble
Clustering
31
where kM denotes classifier k and ( )k
iMy c xP
denotes the probability of y
obtaining the value c for given instance x .
3.1.6 Post-processing Operations
Some isolated pixels might be wrongly segmented into other clusters and requires to
be removed from the final segmented image. For this purpose, post-processing
techniques have been applied at the segmented images. In order to remove isolated
pixels, morphological opening and closing operations have been applied on
segmented image, which help to measure IMT values more accurately. The opening
and closing operations with structuring elements of size 5x5 have performed by
employing the following expressions [59].
( ) f b f b b (3-30)
( ) f b f b b (3-31)
3.2 Classification of Carotid Artery Ultrasound Images
The segmented carotid artery ultrasound image needs to be classified into normal and
abnormal subjects. Quality of segmentation has a high impact on classification. For
classification, artificial neural networks (ANN) is widely being used in many areas and
has been demonstrated by many researchers in the field of classification and pattern
recognition [75-77], image restoration [78], and machine vision [79]. Consequently,
we have employed ANN to classify the segmented images based on measured IMT
values. In this work, we have used multilayered perceptron with back-propagation
neural network (MLBPNN) algorithm for classification of segmented images into
normal or abnormal.
Neural Networks Architecture
The network configuration used for classification based on IMT values is given below.
Input Layer: Five neurons
Hidden Layer: Fifty neurons
Output Layer: Two neuron
Activation Function: Binary sigmoidal function.
No. of Epochs: 500
Chapter 3: Carotid Artery Image Segmentation using Modified Spatial Fuzzy C-means and Ensemble
Clustering
32
The neural network architecture has high impact on classification accuracy.
Each layer of neural network consists of different processing neurons. Among these
layers, numbers of hidden layer neurons are most important. Neural network with
small number of hidden layer neurons may affect the network in a way that it may not
have sufficient degree of freedom to learn the patterns correctly. Network may over-
fit or it may take a long time to converge, if hidden layer neurons are high [80].
In order to find an optimal number of hidden layer neurons a validation set
error has been used. In this process, various combinations of input and hidden layer
neuron are compared. This process has been repeated for number of times with one
leave out concept and the model with minimum mean sum of prediction error (MSPE)
has been selected [80, 81]. Enhanced classification accuracy has been achieved by
utilizing the above mentioned architecture obtained by the aforementioned procedure.
Training and Testing of MLBPNN
IMT values have been measured from segmented carotid artery ultrasound images and
given as input to the MLBPNN classifier. For training and validation, 10-fold cross
validation technique has been utilized.
3.3 Experimental Results and Discussions
The proposed scheme has been used to segment the synthetic as well as real carotid
artery ultrasound images. Optimized features obtained by WEKA using GA, hence,
used as input to clustering algorithm. Ensemble clustering approach of majority voting
has also been developed to segment carotid artery ultrasound image. All of the
computations have been performed on Intel Core i7 PC with Matlab 7.12 (2011a). The
dataset detail used in this research work is described in Section 2.5. The images have
been categorized into normal and abnormal with the help of medical experts.
MLBPNN is used for classification of the segmented images. Classification
performance of MLBPNN has been assessed against already labeled images.
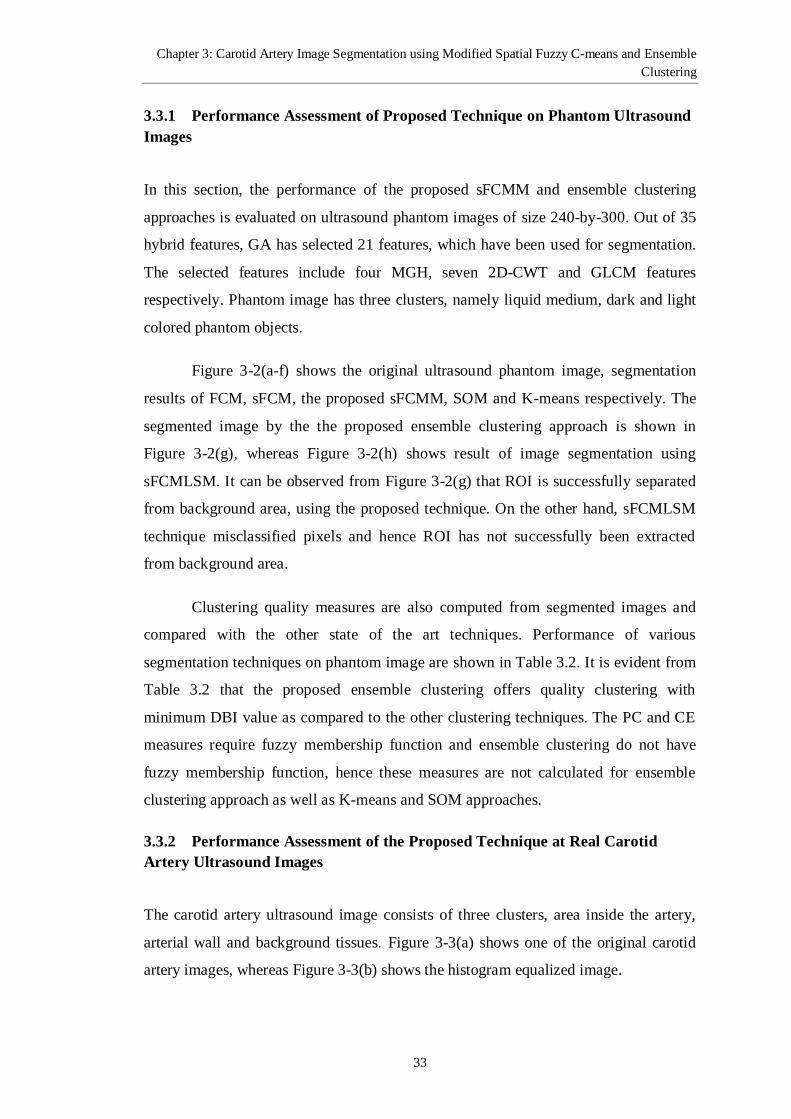
Chapter 3: Carotid Artery Image Segmentation using Modified Spatial Fuzzy C-means and Ensemble
Clustering
33
3.3.1 Performance Assessment of Proposed Technique on Phantom Ultrasound
Images
In this section, the performance of the proposed sFCMM and ensemble clustering
approaches is evaluated on ultrasound phantom images of size 240-by-300. Out of 35
hybrid features, GA has selected 21 features, which have been used for segmentation.
The selected features include four MGH, seven 2D-CWT and GLCM features
respectively. Phantom image has three clusters, namely liquid medium, dark and light
colored phantom objects.
Figure 3-2(a-f) shows the original ultrasound phantom image, segmentation
results of FCM, sFCM, the proposed sFCMM, SOM and K-means respectively. The
segmented image by the the proposed ensemble clustering approach is shown in
Figure 3-2(g), whereas Figure 3-2(h) shows result of image segmentation using
sFCMLSM. It can be observed from Figure 3-2(g) that ROI is successfully separated
from background area, using the proposed technique. On the other hand, sFCMLSM
technique misclassified pixels and hence ROI has not successfully been extracted
from background area.
Clustering quality measures are also computed from segmented images and
compared with the other state of the art techniques. Performance of various
segmentation techniques on phantom image are shown in Table 3.2. It is evident from
Table 3.2 that the proposed ensemble clustering offers quality clustering with
minimum DBI value as compared to the other clustering techniques. The PC and CE
measures require fuzzy membership function and ensemble clustering do not have
fuzzy membership function, hence these measures are not calculated for ensemble
clustering approach as well as K-means and SOM approaches.
3.3.2 Performance Assessment of the Proposed Technique at Real Carotid
Artery Ultrasound Images
The carotid artery ultrasound image consists of three clusters, area inside the artery,
arterial wall and background tissues. Figure 3-3(a) shows one of the original carotid
artery images, whereas Figure 3-3(b) shows the histogram equalized image.
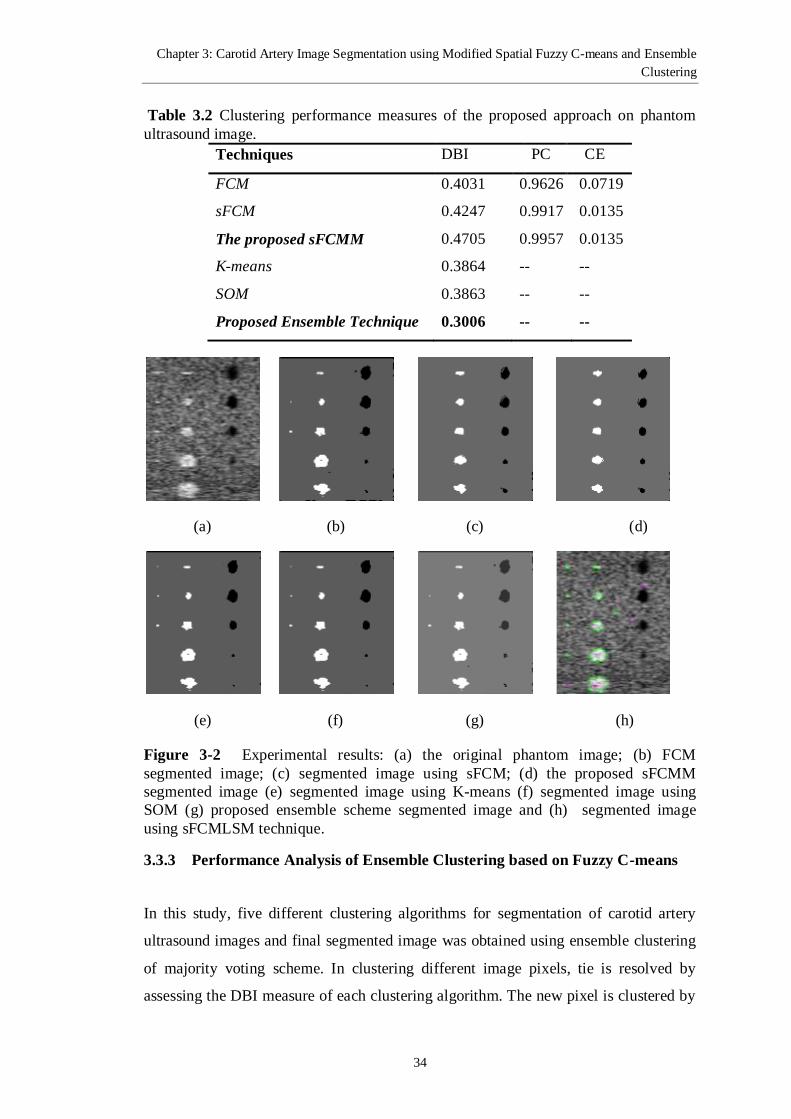
Chapter 3: Carotid Artery Image Segmentation using Modified Spatial Fuzzy C-means and Ensemble
Clustering
34
Table 3.2 Clustering performance measures of the proposed approach on phantom
ultrasound image.
Techniques DBI PC CE
FCM 0.4031 0.9626 0.0719
sFCM 0.4247 0.9917 0.0135
The proposed sFCMM 0.4705 0.9957 0.0135
K-means 0.3864 -- --
SOM 0.3863 -- --
Proposed Ensemble Technique 0.3006 -- --
(a) (b) (c) (d)
(e) (f) (g) (h)
Figure 3-2 Experimental results: (a) the original phantom image; (b) FCM
segmented image; (c) segmented image using sFCM; (d) the proposed sFCMM
segmented image (e) segmented image using K-means (f) segmented image using
SOM (g) proposed ensemble scheme segmented image and (h) segmented image
using sFCMLSM technique.
3.3.3 Performance Analysis of Ensemble Clustering based on Fuzzy C-means
In this study, five different clustering algorithms for segmentation of carotid artery
ultrasound images and final segmented image was obtained using ensemble clustering
of majority voting scheme. In clustering different image pixels, tie is resolved by
assessing the DBI measure of each clustering algorithm. The new pixel is clustered by
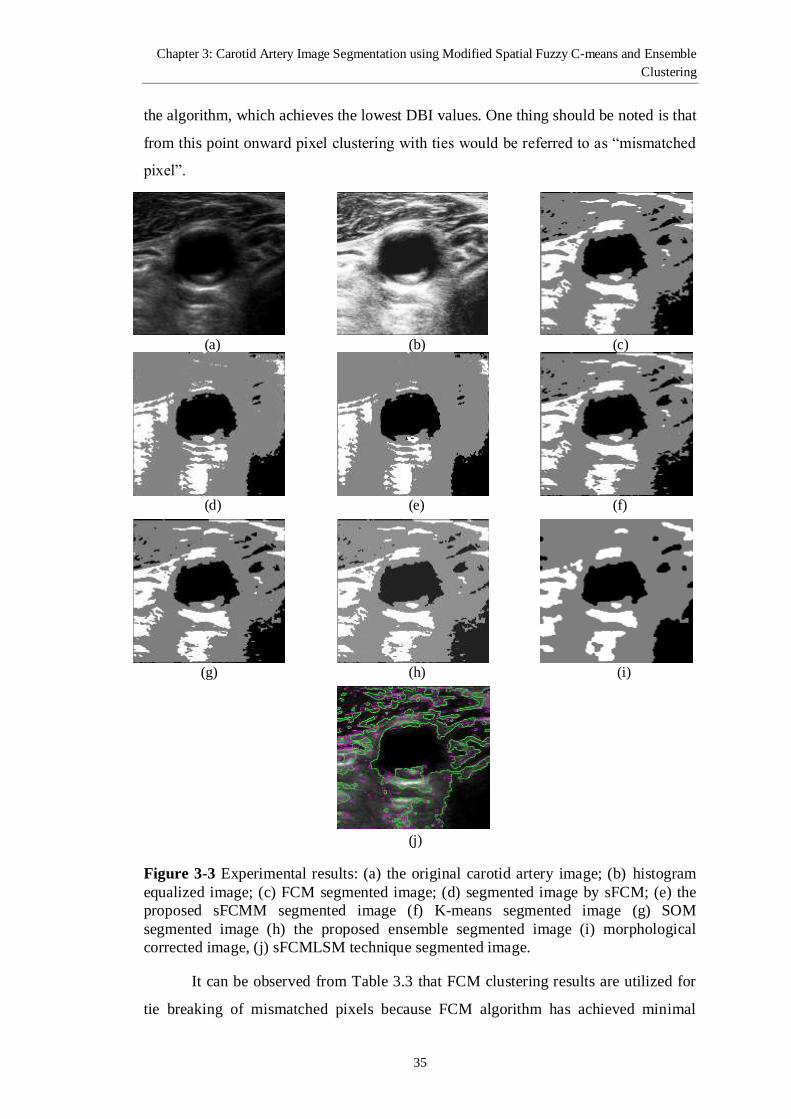
Chapter 3: Carotid Artery Image Segmentation using Modified Spatial Fuzzy C-means and Ensemble
Clustering
35
the algorithm, which achieves the lowest DBI values. One thing should be noted is that
from this point onward pixel clustering with ties would be referred to as “mismatched
pixel”.
(a) (b) (c)
(d) (e) (f)
(g) (h) (i)
(j)
Figure 3-3 Experimental results: (a) the original carotid artery image; (b) histogram
equalized image; (c) FCM segmented image; (d) segmented image by sFCM; (e) the
proposed sFCMM segmented image (f) K-means segmented image (g) SOM
segmented image (h) the proposed ensemble segmented image (i) morphological
corrected image, (j) sFCMLSM technique segmented image.
It can be observed from Table 3.3 that FCM clustering results are utilized for
tie breaking of mismatched pixels because FCM algorithm has achieved minimal

Chapter 3: Carotid Artery Image Segmentation using Modified Spatial Fuzzy C-means and Ensemble
Clustering
36
DBI. It is evident from Table 3.4 that ensemble based on FCM clustering has
minimum DBI among all other mentioned techniques. Figure 3-3(h) shows that
carotid artery ROI is very clear and well separated from the background tissues.
Although, other measures of FCM like PC and CE is lower as compared to sFCM and
sFCMM, but DBI measure of FCM is better than those of other approaches.
Figure 3-3(c) depicts the carotid artery ultrasound image segmented by FCM
whereas Figure 3-3(d) and (e) do those by sFCM and sFCMM clustering algorithms,
respectively. It can be observed from Figure 3-3(c) that there exist some incorrectly
clustered pixels in the FCM segmented image. It is due to the fact that FCM algorithm
is susceptible to noise. The sFCM utilized spatial information, hence it works better as
shown in Figure 3-3(d) compared to FCM algorithm. Further, from Figure 3-3(d) it
can be noticed that some patterns are not clustered accurately by the sFCM algorithm,
especially near the ROI. It is because of assigning equal weightage to all neighboring
pixels in sub-window around the pixel considered. In this connection, the proposed
sFCMM has been utilized to assign the Euclidian distance based weight to the
neighboring pixels in the sub-window. It can be observed, from Figure 3-3(e), that
sFCMM has shown an improved clustering performance over FCM and sFCM
approaches. Carotid artery ultrasound images segmented by K-means and SOM are
shown in Figure 3-3(f) and (g), respectively. Visual inspection shows that K-means
and SOM segmentation results are almost similar.
The proposed ensemble clustering scheme of carotid artery image is presented
in Figure 3-3(h). From visual inspection of the segmentation results, it is evident that
the ensemble clustering strategy is promising compared to other approaches. The
post-processing operation is demonstrated on Figure 3-3(h) and its resultant image is
shown in Figure 3-3(i). Here, one can see that the image is segmented well and region
of interest is successfully separated from background area. Figure 3-3(j) shows the
image segmented by sFCMLSM for comparison purpose. It can be observed that
background tissues are merged with ROI as shown in Figure 3-3(j).
The performance of the proposed approach is also examined using all the
thirty five features without performing any feature selection mechanism. Table 3.3
shows the comparison of the proposed ensemble approach on reduced feature set

Chapter 3: Carotid Artery Image Segmentation using Modified Spatial Fuzzy C-means and Ensemble
Clustering
37
selected by GA, whereas Table 3.5 shows the performance comparison suing thirty
five extracted features. Reduced feature set strategy offers outstanding performance
due to its features orthogonalaty with reduced computational cost.
Table 3.3 The clustering quality performance comparison of various techniques.
Clustering Techniques
Clustering quality measures
DBI PC CE
Hassan
et al.
[73]
Proposed
Strategy
Hassan
et al.
[73]
Proposed
Strategy
Hassan
et al.
[73]
Proposed
Strategy
FCM 0.51 0.41 0.79 0.85 0.38 0.27
sFCM 0.57 0.55 0.94 0.96 0.09 0.06
The Proposed
sFCMM 0.61 0.61 0.97 0.98 0.04
0.03
K-means 0.52 0.42 -- -- -- --
SOM 0.52 0.42 -- -- -- --
Proposed Ensemble
Clustering
0.45 0.30 -- -- -- --
3.3.4 Ensemble Clustering Assessment based on sFCM
We have also assessed the performance of ensemble clustering based on sFCM
algorithm. The PC and CE measures of sFCM are better than that of FCM, but DBI of
sFCM is comparable with the FCM algorithm. When mismatched pixels are replaced
with sFCM clustering results, resultant DBI measure becomes higher than FCM as
shown in Table 3.4. Closely observing the sFCM segmented image, some background
tissues along with region of interest are mislabeled and considered as ROI area. This is
why sFCM based ensemble clustering performance is lower as compared to FCM
clustering.
3.3.5 Performance Analysis of sFCMM Based Ensemble Clustering
In this study five different segmentation algorithms are used and ensemble
performance of these algorithms is analyzed one by one. Performance of ensemble
clustering using sFCMM is analyzed and has less effective as compared with FCM.
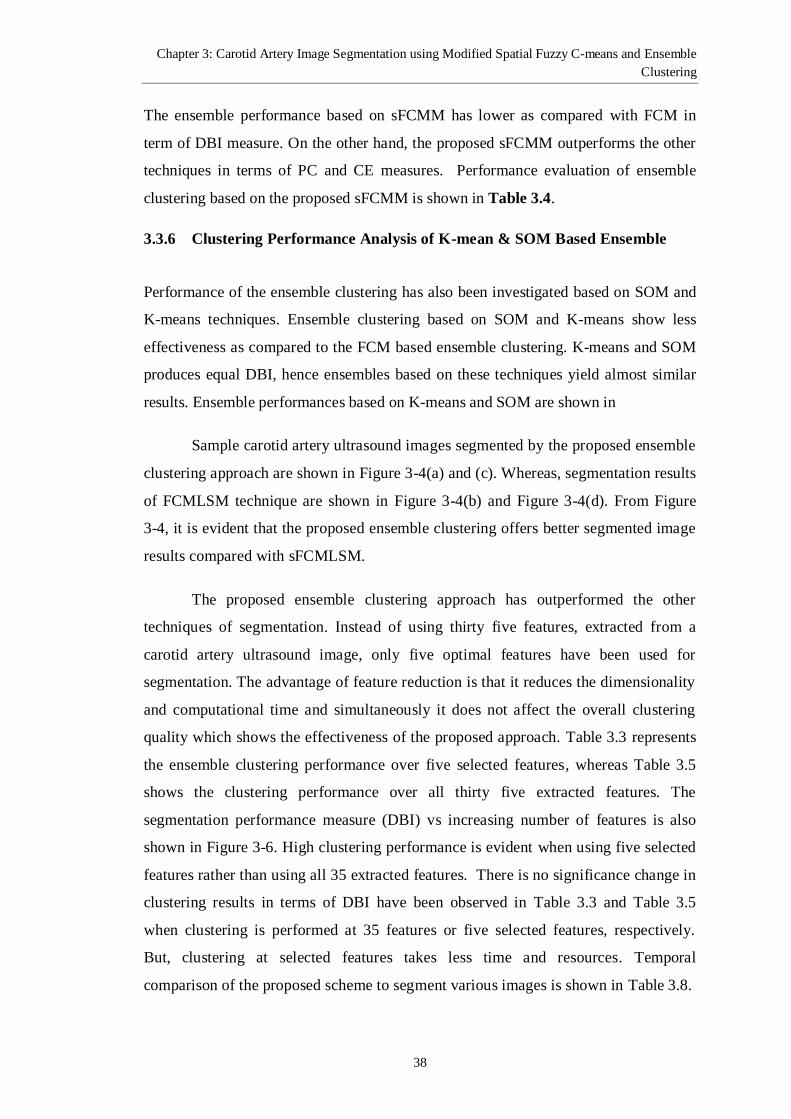
Chapter 3: Carotid Artery Image Segmentation using Modified Spatial Fuzzy C-means and Ensemble
Clustering
38
The ensemble performance based on sFCMM has lower as compared with FCM in
term of DBI measure. On the other hand, the proposed sFCMM outperforms the other
techniques in terms of PC and CE measures. Performance evaluation of ensemble
clustering based on the proposed sFCMM is shown in Table 3.4.
3.3.6 Clustering Performance Analysis of K-mean & SOM Based Ensemble
Performance of the ensemble clustering has also been investigated based on SOM and
K-means techniques. Ensemble clustering based on SOM and K-means show less
effectiveness as compared to the FCM based ensemble clustering. K-means and SOM
produces equal DBI, hence ensembles based on these techniques yield almost similar
results. Ensemble performances based on K-means and SOM are shown in
Sample carotid artery ultrasound images segmented by the proposed ensemble
clustering approach are shown in Figure 3-4(a) and (c). Whereas, segmentation results
of FCMLSM technique are shown in Figure 3-4(b) and Figure 3-4(d). From Figure
3-4, it is evident that the proposed ensemble clustering offers better segmented image
results compared with sFCMLSM.
The proposed ensemble clustering approach has outperformed the other
techniques of segmentation. Instead of using thirty five features, extracted from a
carotid artery ultrasound image, only five optimal features have been used for
segmentation. The advantage of feature reduction is that it reduces the dimensionality
and computational time and simultaneously it does not affect the overall clustering
quality which shows the effectiveness of the proposed approach. Table 3.3 represents
the ensemble clustering performance over five selected features, whereas Table 3.5
shows the clustering performance over all thirty five extracted features. The
segmentation performance measure (DBI) vs increasing number of features is also
shown in Figure 3-6. High clustering performance is evident when using five selected
features rather than using all 35 extracted features. There is no significance change in
clustering results in terms of DBI have been observed in Table 3.3 and Table 3.5
when clustering is performed at 35 features or five selected features, respectively.
But, clustering at selected features takes less time and resources. Temporal
comparison of the proposed scheme to segment various images is shown in Table 3.8.
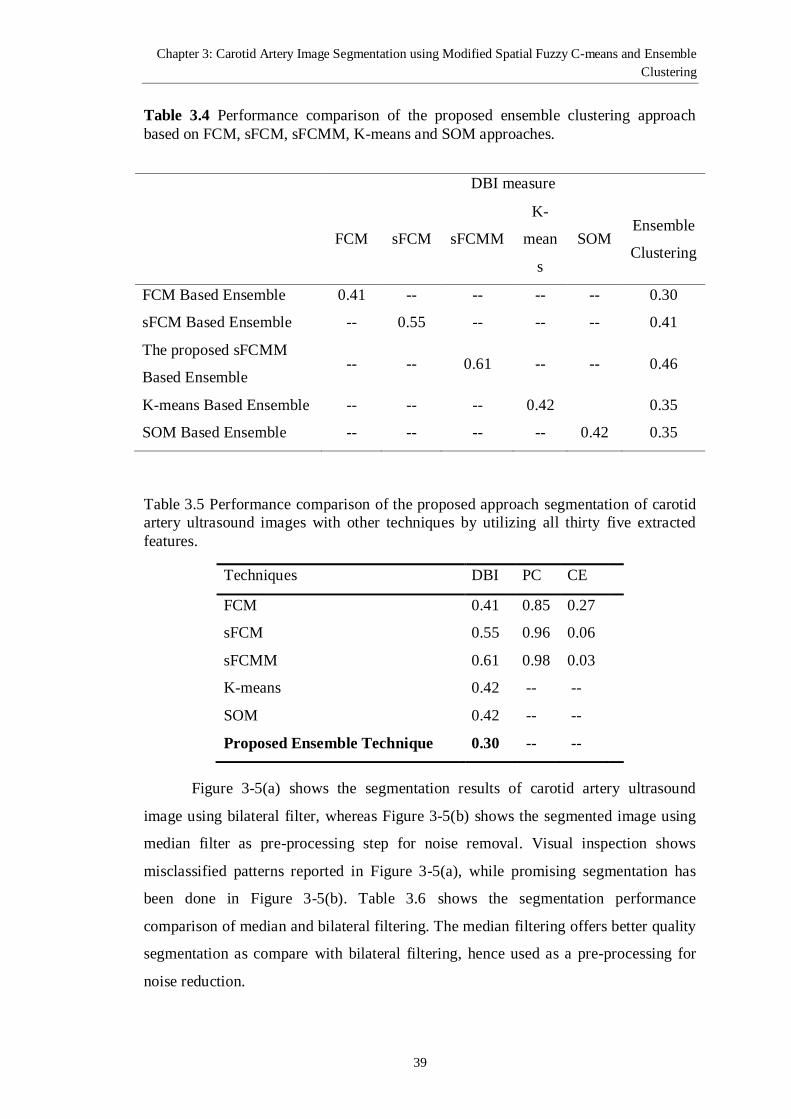
Chapter 3: Carotid Artery Image Segmentation using Modified Spatial Fuzzy C-means and Ensemble
Clustering
39
Table 3.4 Performance comparison of the proposed ensemble clustering approach
based on FCM, sFCM, sFCMM, K-means and SOM approaches.
DBI measure
FCM sFCM sFCMM
K-
mean
s
SOM Ensemble
Clustering
FCM Based Ensemble 0.41 -- -- -- -- 0.30
sFCM Based Ensemble -- 0.55 -- -- -- 0.41
The proposed sFCMM
Based Ensemble -- -- 0.61 -- -- 0.46
K-means Based Ensemble -- -- -- 0.42 0.35
SOM Based Ensemble -- -- -- -- 0.42 0.35
Table 3.5 Performance comparison of the proposed approach segmentation of carotid
artery ultrasound images with other techniques by utilizing all thirty five extracted
features.
Techniques DBI PC CE
FCM 0.41 0.85 0.27
sFCM 0.55 0.96 0.06
sFCMM 0.61 0.98 0.03
K-means 0.42 -- --
SOM 0.42 -- --
Proposed Ensemble Technique 0.30 -- --
Figure 3-5(a) shows the segmentation results of carotid artery ultrasound
image using bilateral filter, whereas Figure 3-5(b) shows the segmented image using
median filter as pre-processing step for noise removal. Visual inspection shows
misclassified patterns reported in Figure 3-5(a), while promising segmentation has
been done in Figure 3-5(b). Table 3.6 shows the segmentation performance
comparison of median and bilateral filtering. The median filtering offers better quality
segmentation as compare with bilateral filtering, hence used as a pre-processing for
noise reduction.
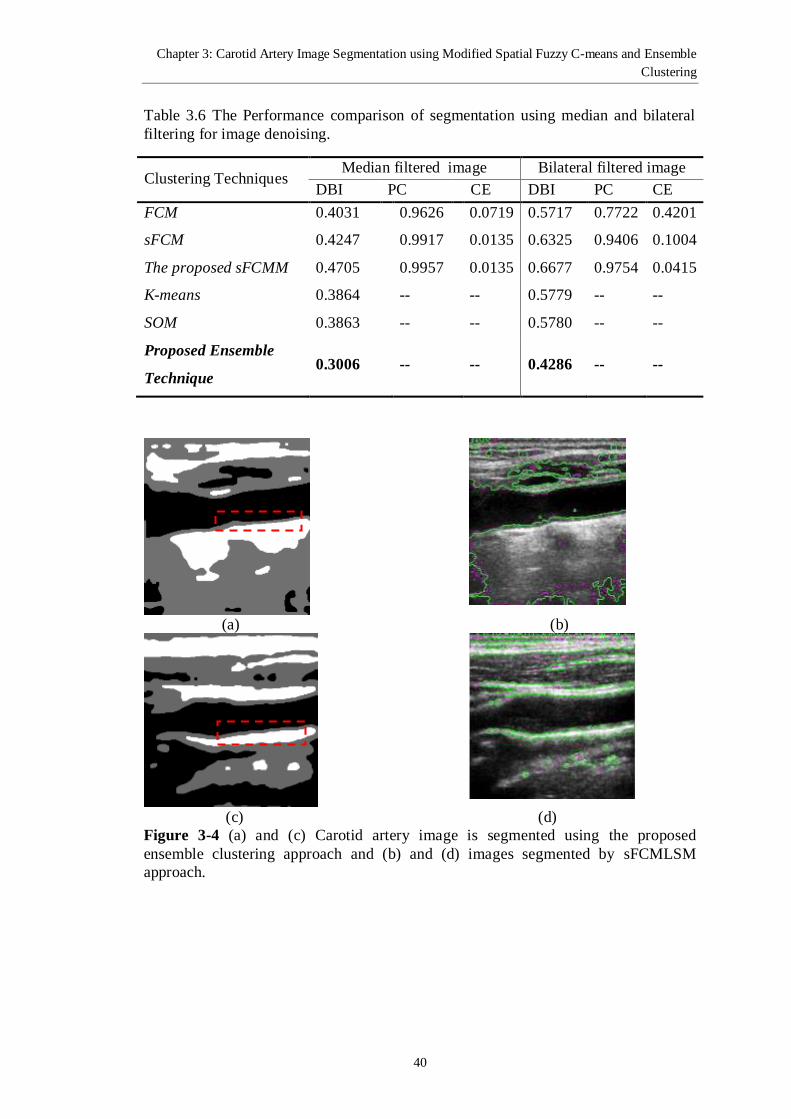
Chapter 3: Carotid Artery Image Segmentation using Modified Spatial Fuzzy C-means and Ensemble
Clustering
40
Table 3.6 The Performance comparison of segmentation using median and bilateral
filtering for image denoising.
Clustering Techniques Median filtered image Bilateral filtered image
DBI PC CE DBI PC CE
FCM 0.4031 0.9626 0.0719 0.5717 0.7722 0.4201
sFCM 0.4247 0.9917 0.0135 0.6325 0.9406 0.1004
The proposed sFCMM 0.4705 0.9957 0.0135 0.6677 0.9754 0.0415
K-means 0.3864 -- -- 0.5779 -- --
SOM 0.3863 -- -- 0.5780 -- --
Proposed Ensemble
Technique 0.3006 -- -- 0.4286 -- --
(a) (b)
(c) (d)
Figure 3-4 (a) and (c) Carotid artery image is segmented using the proposed
ensemble clustering approach and (b) and (d) images segmented by sFCMLSM
approach.
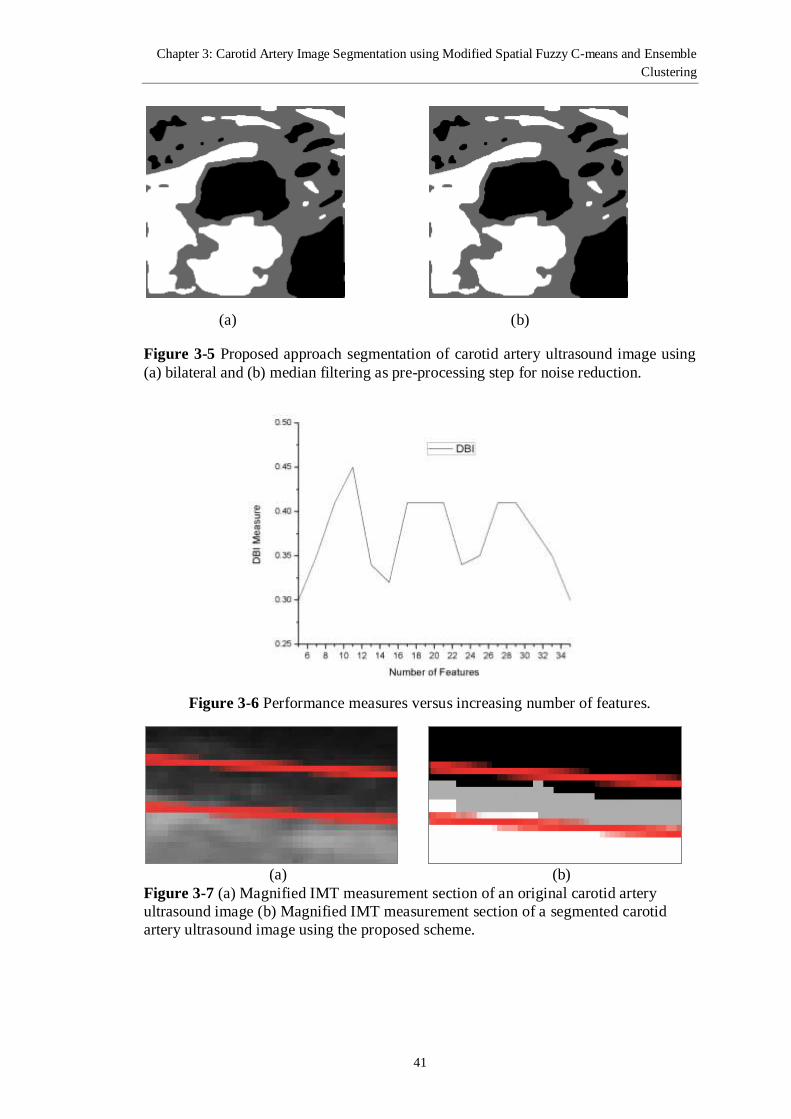
Chapter 3: Carotid Artery Image Segmentation using Modified Spatial Fuzzy C-means and Ensemble
Clustering
41
(a) (b)
Figure 3-5 Proposed approach segmentation of carotid artery ultrasound image using
(a) bilateral and (b) median filtering as pre-processing step for noise reduction.
Figure 3-6 Performance measures versus increasing number of features.
(a) (b)
Figure 3-7 (a) Magnified IMT measurement section of an original carotid artery
ultrasound image (b) Magnified IMT measurement section of a segmented carotid
artery ultrasound image using the proposed scheme.

Chapter 3: Carotid Artery Image Segmentation using Modified Spatial Fuzzy C-means and Ensemble
Clustering
42
(a) (b)
Figure 3-8 (a) IMT measurements of a normal carotid artery image (b) IMT
measurements of abnormal carotid artery
Figure 3-9 ROC curve analysis of true and false positive rates using MLBPNN
classifications.
3.3.7 Classification of Carotid Artery Ultrasound Images
IMT values have been measured from images segmented by the proposed ensemble
clustering approach. The dataset, which we have utilized to assess the performance of
the proposed approach is comprised of 150 images of different patients and ages.
Figure 3-7 shows a magnified ROI of original and segmented image using the
proposed ensemble approach. From Figure 3-7(b), one can observe that the proposed
approach successfully segregated the plaque presented in the carotid artery. With the
consultation of medical expert, IMT measurements have been performed and have
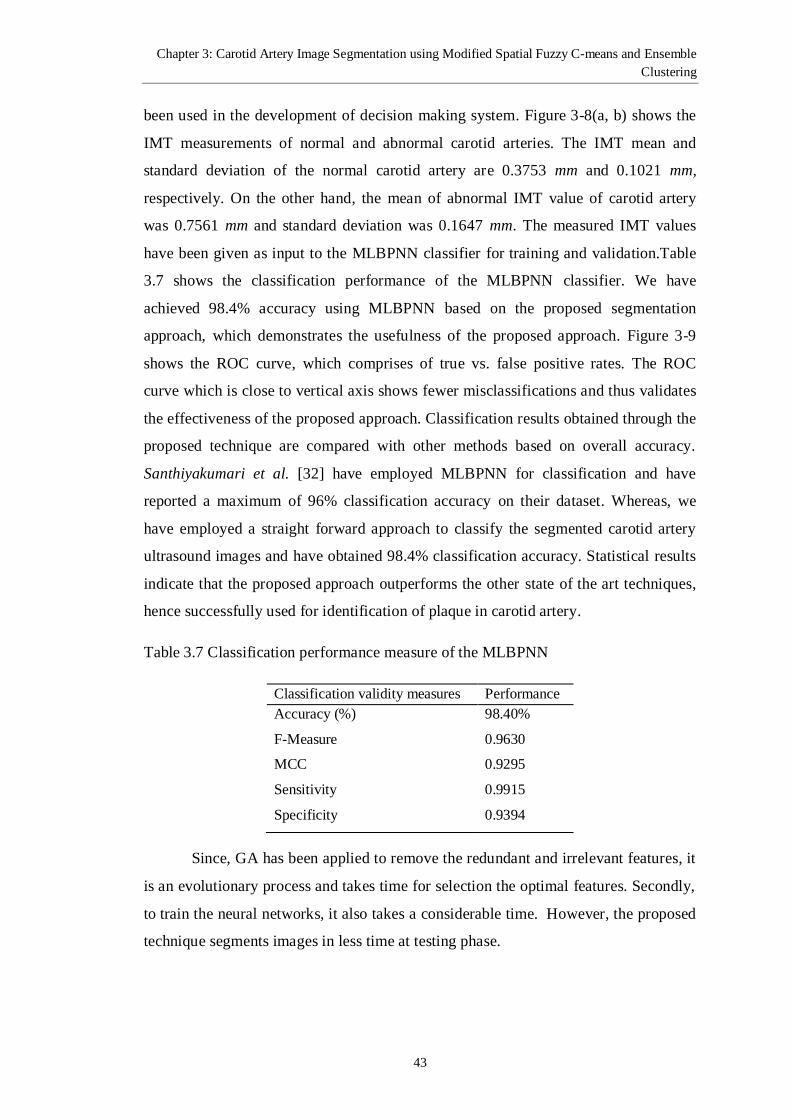
Chapter 3: Carotid Artery Image Segmentation using Modified Spatial Fuzzy C-means and Ensemble
Clustering
43
been used in the development of decision making system. Figure 3-8(a, b) shows the
IMT measurements of normal and abnormal carotid arteries. The IMT mean and
standard deviation of the normal carotid artery are 0.3753 mm and 0.1021 mm,
respectively. On the other hand, the mean of abnormal IMT value of carotid artery
was 0.7561 mm and standard deviation was 0.1647 mm. The measured IMT values
have been given as input to the MLBPNN classifier for training and validation.Table
3.7 shows the classification performance of the MLBPNN classifier. We have
achieved 98.4% accuracy using MLBPNN based on the proposed segmentation
approach, which demonstrates the usefulness of the proposed approach. Figure 3-9
shows the ROC curve, which comprises of true vs. false positive rates. The ROC
curve which is close to vertical axis shows fewer misclassifications and thus validates
the effectiveness of the proposed approach. Classification results obtained through the
proposed technique are compared with other methods based on overall accuracy.
Santhiyakumari et al. [32] have employed MLBPNN for classification and have
reported a maximum of 96% classification accuracy on their dataset. Whereas, we
have employed a straight forward approach to classify the segmented carotid artery
ultrasound images and have obtained 98.4% classification accuracy. Statistical results
indicate that the proposed approach outperforms the other state of the art techniques,
hence successfully used for identification of plaque in carotid artery.
Table 3.7 Classification performance measure of the MLBPNN
Classification validity measures Performance
Accuracy (%) 98.40%
F-Measure 0.9630
MCC 0.9295
Sensitivity 0.9915
Specificity 0.9394
Since, GA has been applied to remove the redundant and irrelevant features, it
is an evolutionary process and takes time for selection the optimal features. Secondly,
to train the neural networks, it also takes a considerable time. However, the proposed
technique segments images in less time at testing phase.
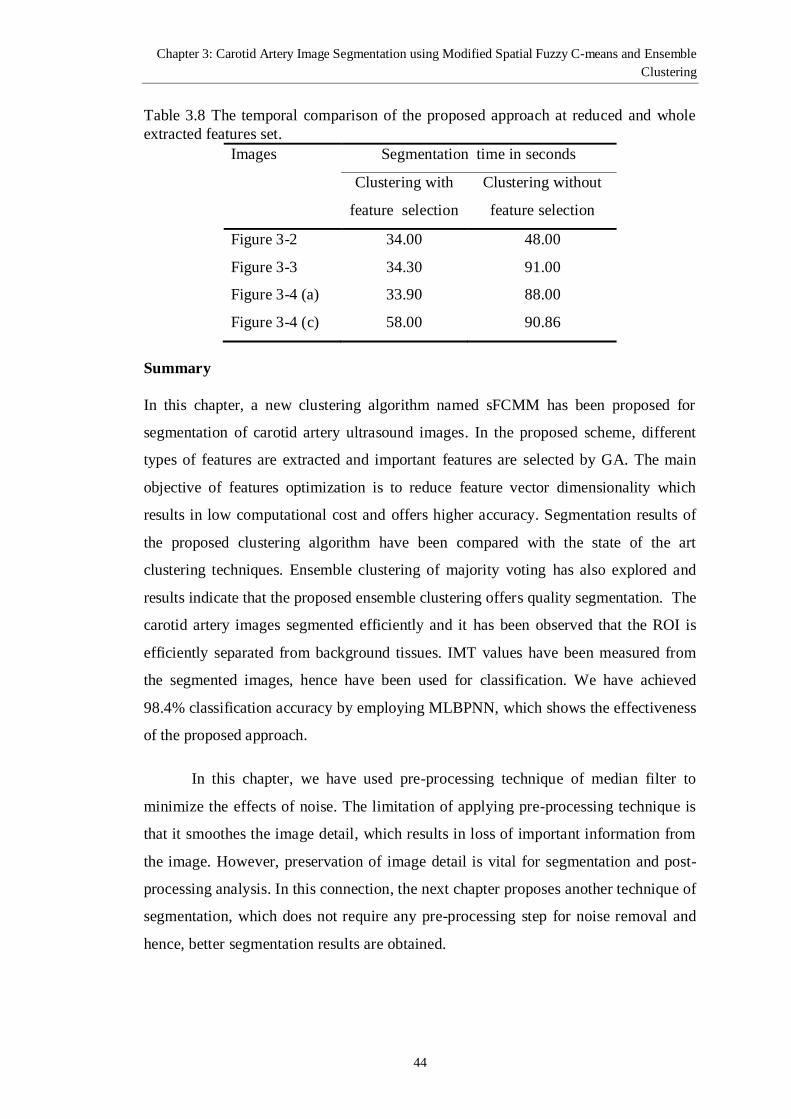
Chapter 3: Carotid Artery Image Segmentation using Modified Spatial Fuzzy C-means and Ensemble
Clustering
44
Table 3.8 The temporal comparison of the proposed approach at reduced and whole
extracted features set.
Images Segmentation time in seconds
Clustering with
feature selection
Clustering without
feature selection
Figure 3-2 34.00 48.00
Figure 3-3 34.30 91.00
Figure 3-4 (a) 33.90 88.00
Figure 3-4 (c) 58.00 90.86
Summary
In this chapter, a new clustering algorithm named sFCMM has been proposed for
segmentation of carotid artery ultrasound images. In the proposed scheme, different
types of features are extracted and important features are selected by GA. The main
objective of features optimization is to reduce feature vector dimensionality which
results in low computational cost and offers higher accuracy. Segmentation results of
the proposed clustering algorithm have been compared with the state of the art
clustering techniques. Ensemble clustering of majority voting has also explored and
results indicate that the proposed ensemble clustering offers quality segmentation. The
carotid artery images segmented efficiently and it has been observed that the ROI is
efficiently separated from background tissues. IMT values have been measured from
the segmented images, hence have been used for classification. We have achieved
98.4% classification accuracy by employing MLBPNN, which shows the effectiveness
of the proposed approach.
In this chapter, we have used pre-processing technique of median filter to
minimize the effects of noise. The limitation of applying pre-processing technique is
that it smoothes the image detail, which results in loss of important information from
the image. However, preservation of image detail is vital for segmentation and post-
processing analysis. In this connection, the next chapter proposes another technique of
segmentation, which does not require any pre-processing step for noise removal and
hence, better segmentation results are obtained.
Chapter 3: Carotid Artery Image Segmentation using Modified Spatial Fuzzy C-means and Ensemble
Clustering
45
Outcomes of the current chapter:
1. Carotid artery ultrasound image segmentation using modified spatial fuzzy c-
means and ensemble clustering, “Computer Methods and Program in
Biomedicine”, Journal, Vol. 108, pp 1261-1276, 2012. (Impact Factor=1.555)
2. Image Clustering using Improved Spatial Fuzzy C-means Modified, ACM,
ICUMIC, Kuala Lumpur, Malaysia, 2012.
3. An Optimized Fuzzy C-means clustering with spatial information for carotid
artery image segmentation, IEEE, IBCAST Islamabad, Pakistan, 2011.
46
Chapter 4 : Robust Information Gain based
Fuzzy C-Means Clustering and Classification of
Carotid Artery Ultrasound Images
In this chapter, a new robust clustering approach namely Information Gain based
Fuzzy C-Means (IGFCM) has been proposed. IGFCM utilizes the concept of
information gain into basic FCM framework and thus avoids any pre-processing step
for noise reduction. The proposed approach has been applied to segment synthetic,
daylight, CT-liver, and real carotid artery images. In order to evaluate the robustness,
segmentation is performed using IGFCM on images degraded with Gaussian noise of
various intensities. The proposed approach successfully segments the noisy and noise
free images. To evaluate the effectiveness of the proposed IGFCM, a significant
amount of real carotid artery images are segmented. Segmentation results of the
proposed IGFCM technique have been compared with other state-of-the-art
techniques. It has been observed from segmentation results both visually and
quantitatively that IGFCM performs better compare with other state-of-the-art
approaches. In addition, an intelligent decision making system has also been proposed
to segregate the normal and abnormal subjects.
4.1 The Proposed Clustering Algorithm
The proposed segmentation algorithm incorporates the information gain concept into
the basic FCM framework. The membership values of FCM algorithm need to be
updated by the procedure of information gain. FCM cost function, membership
functions, and cluster centers can be computed by using the Equations (2-1), (2-2),
and (2-3), respectively.
4.1.1 The Proposed Information Gain Based FCM Clustering Algorithm
The conventional FCM algorithm is susceptible to noise and may produce
inhomogeneous clustering. To coup with the problem effectively, the concepts of
information gain has been incorporated into the basic FCM algorithm. The idea of
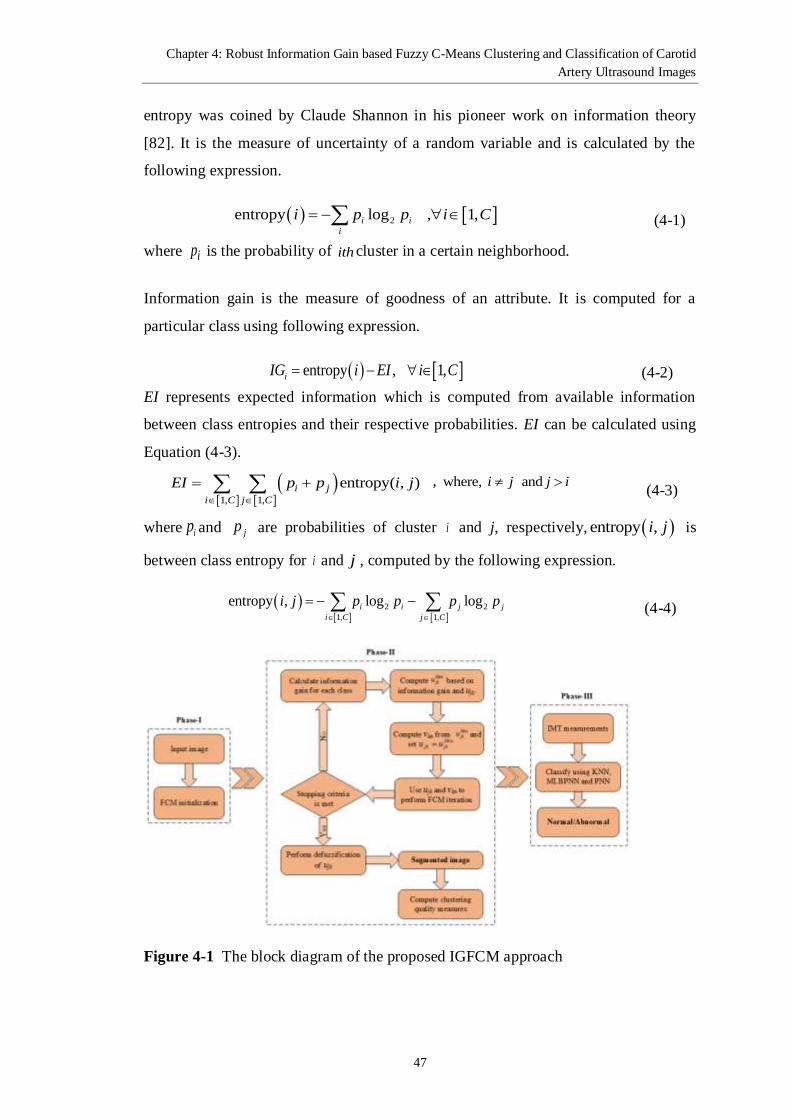
Chapter 4: Robust Information Gain based Fuzzy C-Means Clustering and Classification of Carotid
Artery Ultrasound Images
47
entropy was coined by Claude Shannon in his pioneer work on information theory
[82]. It is the measure of uncertainty of a random variable and is calculated by the
following expression.
2entropy log , 1,i i
i
i p p i C (4-1)
where ip is the probability of ith cluster in a certain neighborhood.
Information gain is the measure of goodness of an attribute. It is computed for a
particular class using following expression.
entropy , 1,iIG i EI i C (4-2)
EI represents expected information which is computed from available information
between class entropies and their respective probabilities. EI can be calculated using
Equation (4-3).
1, 1,
en tropy( , )i j
i C j C
EI p p i j
, where, and i j j i (4-3)
where ip and jp are probabilities of cluster i and j, respectively, entropy ,i j is
between class entropy for i and j , computed by the following expression.
1, 1,
2 2entropy , log log i i j
i j C
j
C
i j p p p p
(4-4)
Figure 4-1 The block diagram of the proposed IGFCM approach

Chapter 4: Robust Information Gain based Fuzzy C-Means Clustering and Classification of Carotid
Artery Ultrasound Images
48
The proposed IGFCM algorithm is composed of two-phases. In first phase,
input image is segmented by FCM but limited to few iterations to obtain an initial
estimate of true segmentation. In the second phase, for every pixel in FCM-segmented
images, entropy and information gain are computed from its surrounding pixels in a
certain neighborhood (5x5 selected empirically in our case). The proposed technique
then updates the fuzzy membership values of every pixel by swapping them together.
The swapping order of the pixel’s fuzzy membership values is determined by the rank
of its information gain values computed for different clusters. The cluster centroids
are then updated, as in classical FCM. After that, an iteration of classical FCM
proceeds with the new membership values and update cluster centroids. This process
continues until the difference between cluster centroid values in consecutive iterations
reduces below a particular threshold or maximum numbers of iterations have been
reached. The algorithm of IGFCM is presented in Algorithm 4.1.
The defuzzification of membership function ( jku ) yields the final image
segmented by the proposed IGFCM algorithm. Figure 4-1 shows the block diagram of
the proposed scheme. A detailed illustration of algorithmic steps is shown by an
example in Figure 4-2. It should be noted that phase-III is concerned with application
of IGFCM algorithm on classification scenario which will be described in Section
4.3.2.
4.1.2 Illustration of the Proposed IGFCM approach
An example is presented here to demonstrate the working mechanism of the proposed
IGFCM algorithm. Phase-I of the algorithm is straightforward because classical FCM
is well studied and can be easily reproduced. Therefore, only phase-II of IGFCM
algorithm is described in this illustration. We have considered a local neighborhood of
5x5 pixels from the input image (FCM segmented) and apply phase-II steps of the
proposed algorithm. These steps will be repeated for every pixel of the input image
until the convergence criteria has been met; hence, the final IGFCM segmented image
has been obtained.
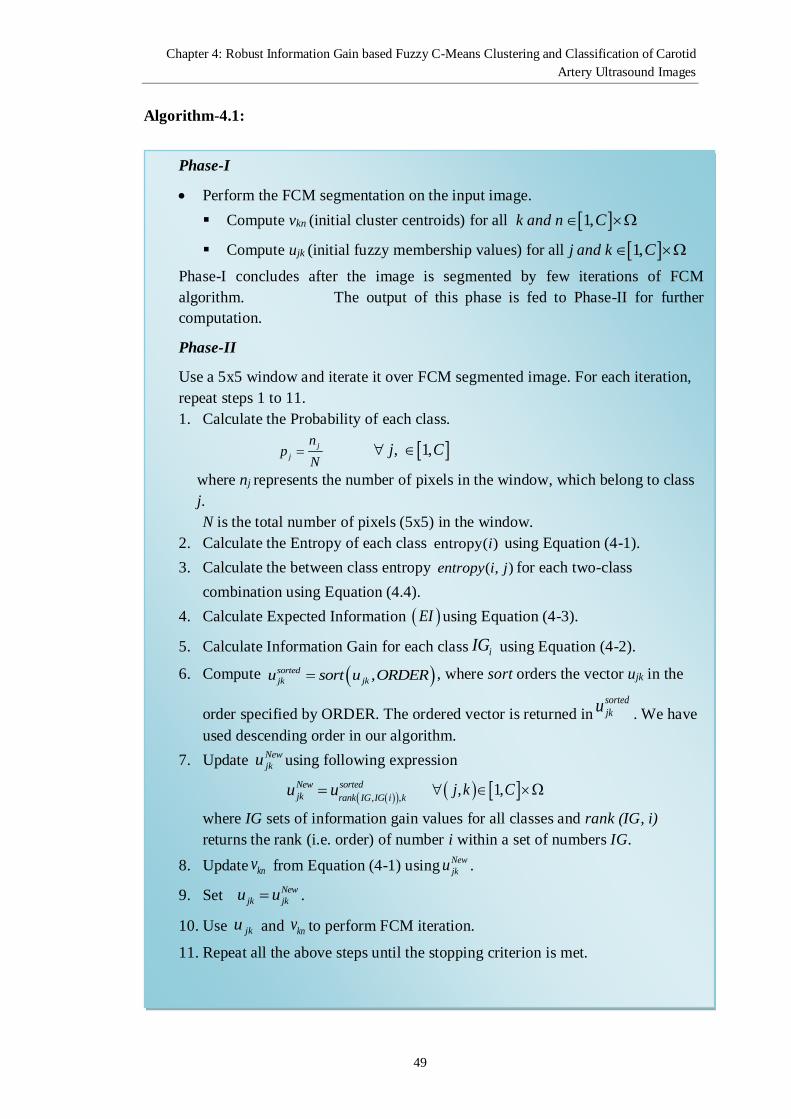
Chapter 4: Robust Information Gain based Fuzzy C-Means Clustering and Classification of Carotid
Artery Ultrasound Images
49
Algorithm-4.1:
Phase-I
Perform the FCM segmentation on the input image.
Compute vkn (initial cluster centroids) for all k and n 1,C
Compute ujk (initial fuzzy membership values) for all j and k 1,C
Phase-I concludes after the image is segmented by few iterations of FCM
algorithm. The output of this phase is fed to Phase-II for further
computation.
Phase-II
Use a 5x5 window and iterate it over FCM segmented image. For each iteration,
repeat steps 1 to 11.
1. Calculate the Probability of each class.
j
j
np
N , 1,j C
where nj represents the number of pixels in the window, which belong to class
j.
N is the total number of pixels (5x5) in the window.
2. Calculate the Entropy of each class entropy( )i using Equation (4-1).
3. Calculate the between class entropy ( , )entropy i j for each two-class
combination using Equation (4.4).
4. Calculate Expected Information EI using Equation (4-3).
5. Calculate Information Gain for each class iIG using Equation (4-2).
6. Compute ,sorted
jk jku sort u ORDER , where sort orders the vector ujk in the
order specified by ORDER. The ordered vector is returned insorted
jku. We have
used descending order in our algorithm.
7. Update New
jku using following expression
, ,
New sorted
jk rank IG IG i ku u 1,,k Cj
where IG sets of information gain values for all classes and rank (IG, i)
returns the rank (i.e. order) of number i within a set of numbers IG.
8. Update knv from Equation (4-1) usingNew
jku .
9. Set New
jk jku u .
10. Use jku and knv to perform FCM iteration.
11. Repeat all the above steps until the stopping criterion is met.
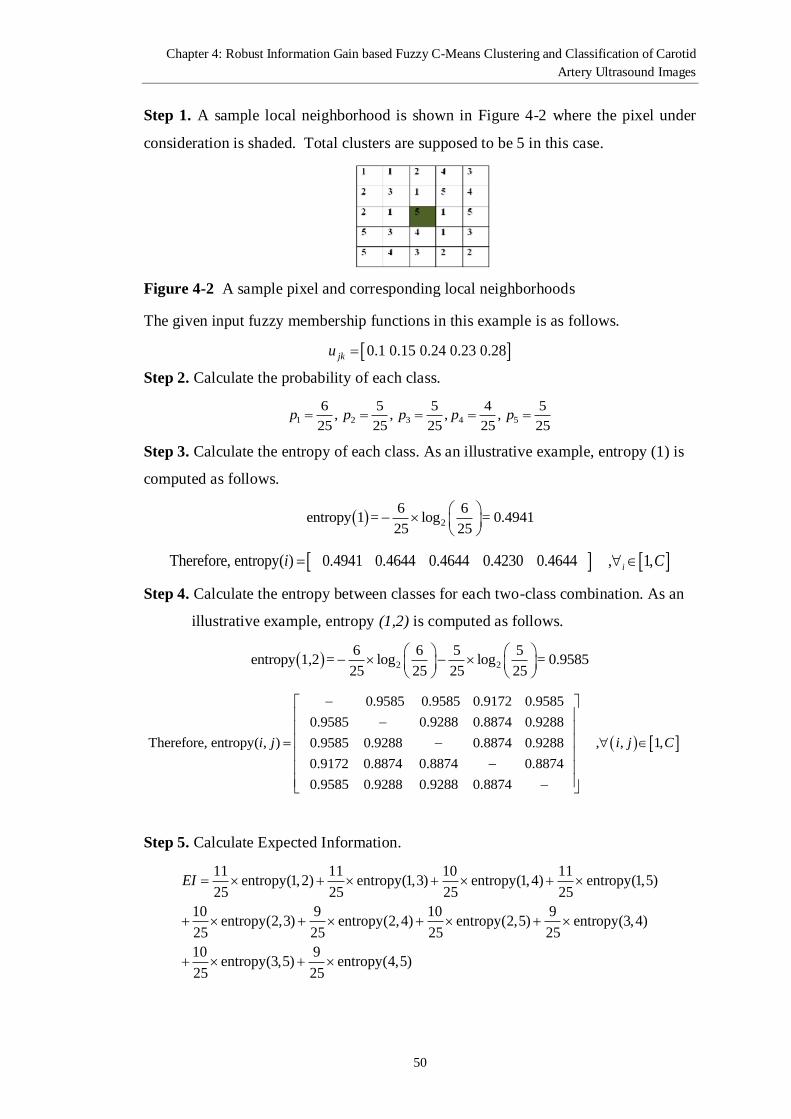
Chapter 4: Robust Information Gain based Fuzzy C-Means Clustering and Classification of Carotid
Artery Ultrasound Images
50
Step 1. A sample local neighborhood is shown in Figure 4-2 where the pixel under
consideration is shaded. Total clusters are supposed to be 5 in this case.
Figure 4-2 A sample pixel and corresponding local neighborhoods
The given input fuzzy membership functions in this example is as follows.
0.1 0.15 0.24 0.23 0.28jku
Step 2. Calculate the probability of each class.
1 2 3 4 5
6 5 5 4 5, , , ,
25 25 25 25 25p p p p p
Step 3. Calculate the entropy of each class. As an illustrative example, entropy (1) is
computed as follows.
2
6 6entropy 1 = log = 0.4941
25 25
Therefore, entropy( ) 0.4941 0.4644 0.4644 0.4230 0.4644 , 1,ii C
Step 4. Calculate the entropy between classes for each two-class combination. As an
illustrative example, entropy (1,2) is computed as follows.
2 2
6 6 5 5entropy 1,2 = log log = 0.9585
25 25 25 25
0.9585 0.9585 0.9172 0.9585
0.9585 0.9288 0.8874 0.9288
Therefore, entropy( , ) , , 0.9585 0.9288 0.8874 0.9288
0.9172 0.8874 0.8874 0.8874
0.9585 0.9288 0.9288 0.8874
1,Ci j i j
Step 5. Calculate Expected Information.
11 11 10 11entropy(1,2) entropy(1,3) entropy(1,4) entropy(1,5)
25 25 25 25
10 9 10 9entropy(2,3) entropy(2,4) entropy(2,5) entropy(3,4)
25 25 25 25
10 9entropy(3,5) entropy(4,5)
25 25
EI
Chapter 4: Robust Information Gain based Fuzzy C-Means Clustering and Classification of Carotid
Artery Ultrasound Images
51
11 100.9585 0.9585 0.9585 + 0.9172 0.9288 0.9288 0.9288
25 25
90.8874 0.8874 0.8874 3.8606
25
EI
Step 6. Calculate Information Gain for each class. As an illustrative example, IG1 is
computed as follows.
1 entropy(1) 0.7950 3.8606 3.0655IG EI
Therefore, 3.3664 3.3962 3.3962 3.4376 3.3962 IG
Step 7. Compute , ' 'sortedjk jku sort u desc
.
0.28,0.24,0.23,0.15,0.10sorted
jku
Step 8. UpdateNew
jku.
1 2 3 4 5, , , , 3.3664, 3.3962, 3.3962, 3.3962, 3.4376IG IG IG IG IG IG
, 5 3 4 2 1 irank IG IG
1 5Therefore, New sortedk ku u
, 2 3Newk
sortedku u
, 3 4Newk
sortedku u
, 4 2Newk
sortedku u
, 5 1Newk
sortedku u
. . 0.28,0.24,0.23,0.10,0.15Newjki e u
Until this point, we have obtained the new fuzzy membership functions. We can use
these new membership values to continue the process for further calculations (e.g. to
find out new centroids as in step 8 of Phase-II).
4.1.3 Clustering Quality Measures
To check the usefulness of the proposed IGFCM clustering approach quantitatively,
the clustering quality measures partition co-efficient (PC) and classification entropy
(CE) have been computed for every segmented image. Detail description of PC and
CE measures can be found in Section 2.6.
4.2 Decision system for Segmented Carotid Artery Ultrasound
Images
The segmentation performance is critical to disease diagnosis in most computer-aided
diagnostic systems based on medical imaging. Effective segmentation results offer
Chapter 4: Robust Information Gain based Fuzzy C-Means Clustering and Classification of Carotid
Artery Ultrasound Images
52
high classification results. In this section, the impact of segmentation using the
proposed IGFCM algorithm has been evaluated on classification of carotid artery
ultrasound images. For this purpose, a decision system based on PNN classifier has
been proposed. In the proposed decision system, IMT values have been measured
from segmented carotid artery ultrasound using IGFCM algorithm. These values
correspond to the number of pixels along columns of a selected region of the
segmented images which belong to the arterial wall [83, 84]. Based on these
measurements, a set of 6 features namely mean, variance, skewness, kurtosis, min and
max [28, 85] has been formed and provided as input to the classifier. Probabilistic
neural network (PNN) has been employed for classification owing to better learning
capability of neural networks. The use of PNN has been justified by comparing its
performance with two other classifiers. Finally, the effect of segmentation has been
analyzed by segmenting the carotid artery ultrasound images with different techniques
including the proposed algorithm. The dataset used in this study is described in
Section 2.5.
4.2.1 Probabilistic Neural Networks Classifier
Probabilistic neural network (PNN) is a popular and frequently used tool for decision
making, which works well both for linear and nonlinear data. It is a feed forward
neural network that utilizes Kernel Fisher discriminant analysis and Bayesian
networks. It employs four layers of neural network, namely, input, hidden, pattern,
and output layers. Compared to multilayer perceptron, PNN is faster, more accurate,
and tolerant to outliers. Moreover, the complexity of the decision surface of PNN
classifier can be controlled by varying the spread parameter. In this case, the spread
parameter value has been empirically found and set to 0.9, which offers high
classification accuracy. The decision surface can approach Bayes optimal classifier
using an optimal value of the spread parameter. PNN classifier has the capability to
operate in parallel without getting feedback from individual input neurons. Finally,
for time variant problems, old patterns can be replaced with new patterns. More
details on PNN can be found in [86].
In this work, IMT features are given as input to the network along with spread
parameter value 0.9 which was set empirically to yield the optimal performance. For
training and validation of PNN, 10-fold cross validation using Jackknife method has

Chapter 4: Robust Information Gain based Fuzzy C-Means Clustering and Classification of Carotid
Artery Ultrasound Images
53
been utilized. The detail of 10-fold cross validation and Jackknife approaches can be
found in Section 2.6.
We have used accuracy, sensitivity, specificity, Mathew’s Correlation
Coefficient (MCC), and F-measure to assess the effectiveness of the classifier.
Receiver Operating Characteristics (ROC) curve has been drawn to compare true
positive rate vs. false positive rate. ROC curve, widely used in medical diagnosis
systems, is an effective analysis tool that demonstrates the performance of decision
making system. The area under the curve (AUC) [87] has also been computed from
ROC curve, which shows the effectiveness of the decision system.
4.3 Experimental Results and Discussions
Two major experiments have been conducted to access the effectiveness of the
proposed IGFCM algorithm. In first experiment, the proposed IGFCM technique is
applied to segment the various modality images including synthetic, daylight, and CT
liver images. The segmentation results have been obtained for both noisy and noise-
free version of images. Performance of the proposed algorithm has been compared
with some state-of-the-art techniques such as, FCM, sFCM, sFCMM, and FLICM,
both visually and quantitatively. Partition coefficient (PC) and classification entropy
(CE) have been applied as quantitative clustering performance measures.
Whereas, in second experiment, segmentation and classification on real
carotid artery ultrasound images has been performed. These images are segmented by
the proposed IGFCM algorithm prior to classification so that the effect of
segmentation on classification has to be investigated. The proposed decision system,
based on PNN classifier, successfully identifies the segmented carotid artery
ultrasound images as normal or abnormal subjects. Classification results of PNN have
been compared with K-nearest neighbor (KNN) and MLBPNN classifiers. The feature
set feeds input to PNN classifier to obtain the final decision about pathological state
of the subject. A dataset of 300 real carotid artery ultrasound images is used in our
decision making system (Chapter 2). Finally, the superiority of employing the
proposed IGFCM in the decision system has been shown. In particular, the carotid
artery dataset is segmented using different variants of FCM and used in the decision
system in a way similar to IGFCM. The classification results employing different
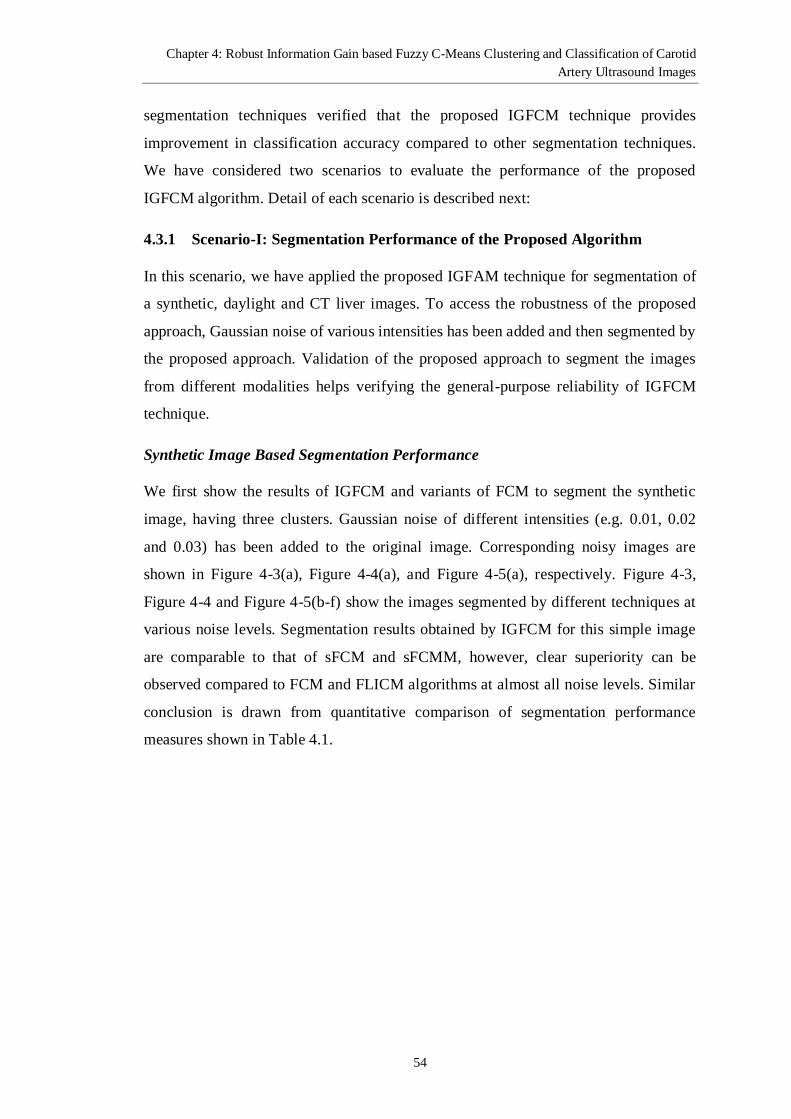
Chapter 4: Robust Information Gain based Fuzzy C-Means Clustering and Classification of Carotid
Artery Ultrasound Images
54
segmentation techniques verified that the proposed IGFCM technique provides
improvement in classification accuracy compared to other segmentation techniques.
We have considered two scenarios to evaluate the performance of the proposed
IGFCM algorithm. Detail of each scenario is described next:
4.3.1 Scenario-I: Segmentation Performance of the Proposed Algorithm
In this scenario, we have applied the proposed IGFAM technique for segmentation of
a synthetic, daylight and CT liver images. To access the robustness of the proposed
approach, Gaussian noise of various intensities has been added and then segmented by
the proposed approach. Validation of the proposed approach to segment the images
from different modalities helps verifying the general-purpose reliability of IGFCM
technique.
Synthetic Image Based Segmentation Performance
We first show the results of IGFCM and variants of FCM to segment the synthetic
image, having three clusters. Gaussian noise of different intensities (e.g. 0.01, 0.02
and 0.03) has been added to the original image. Corresponding noisy images are
shown in Figure 4-3(a), Figure 4-4(a), and Figure 4-5(a), respectively. Figure 4-3,
Figure 4-4 and Figure 4-5(b-f) show the images segmented by different techniques at
various noise levels. Segmentation results obtained by IGFCM for this simple image
are comparable to that of sFCM and sFCMM, however, clear superiority can be
observed compared to FCM and FLICM algorithms at almost all noise levels. Similar
conclusion is drawn from quantitative comparison of segmentation performance
measures shown in Table 4.1.

Chapter 4: Robust Information Gain based Fuzzy C-Means Clustering and Classification of Carotid
Artery Ultrasound Images
55
(a) (b) (c)
(d) (e) (f)
Figure 4-3 Segmentation of noisy synthetic image (noise variance 0.01): (a) noisy
image segmented by (b) FCM, (c) sFCM, (d) sFCMM, (e) FLICM, and (f) the
proposed IGFCM algorithm.
(a) (b) (c)
(d) (e) (f)
Figure 4-4 Segmentation of noisy synthetic image (noise variance 0.02): (a) noisy
image segmented by (b) FCM, (c) sFCM, (d) sFCMM, (e) FLICM, and (f) the
proposed IGFCM algorithm.
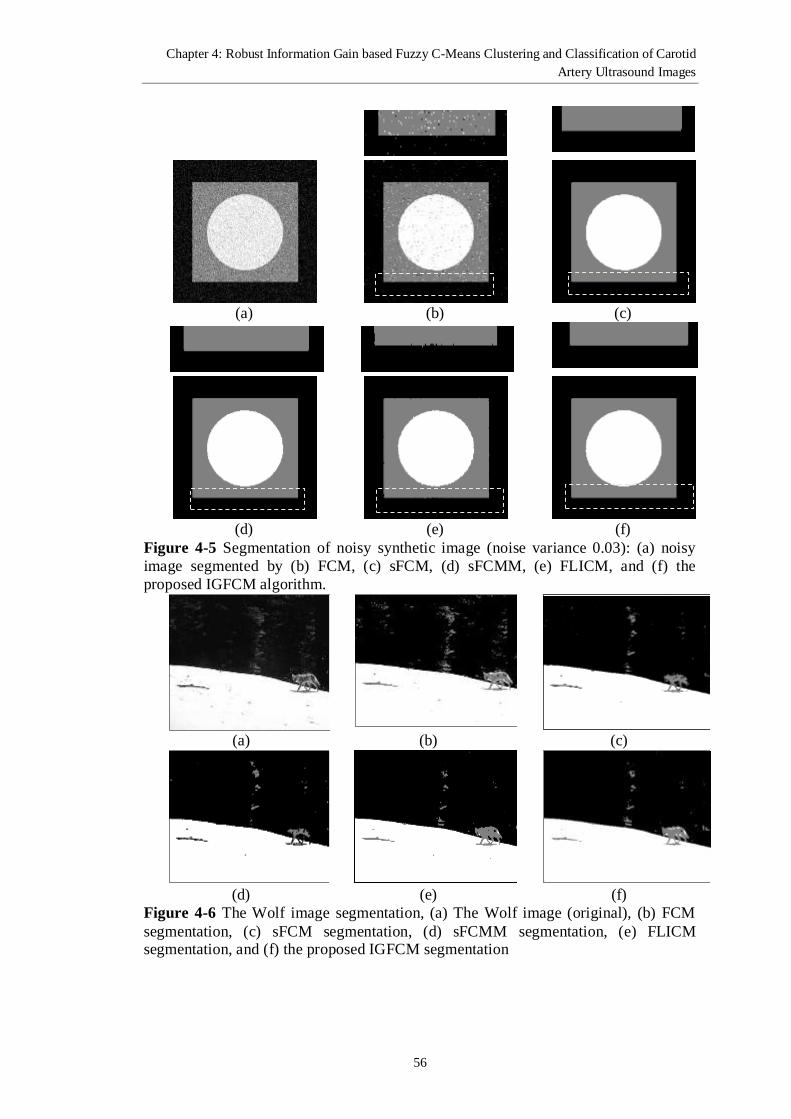
Chapter 4: Robust Information Gain based Fuzzy C-Means Clustering and Classification of Carotid
Artery Ultrasound Images
56
(a) (b) (c)
(d) (e) (f)
Figure 4-5 Segmentation of noisy synthetic image (noise variance 0.03): (a) noisy
image segmented by (b) FCM, (c) sFCM, (d) sFCMM, (e) FLICM, and (f) the
proposed IGFCM algorithm.
(a) (b) (c)
(d) (e) (f)
Figure 4-6 The Wolf image segmentation, (a) The Wolf image (original), (b) FCM
segmentation, (c) sFCM segmentation, (d) sFCMM segmentation, (e) FLICM segmentation, and (f) the proposed IGFCM segmentation

Chapter 4: Robust Information Gain based Fuzzy C-Means Clustering and Classification of Carotid
Artery Ultrasound Images
57
(a) (b) (c)
(d) (e) (f)
Figure 4-7 Segmentation of noisy Wolf image (noise variance 0.01), (a) noisy Wolf
image, (b) FCM segmentation, (c) sFCM segmentation, (d) sFCMM segmentation,
(e) FLICM segmentation, and (f) the proposed IGFCM segmentation
Segmentation Performance of IGFCM on Daylight Image
Daylight images or natural images also find several applications in computer vision,
such as surveillance and object tracking. Image segmentation is an essential
intermediate processing step in these applications. Performance of the proposed
IGFCM algorithm has been examined on a daylight image, named 'the wolf image',
which is shown in Figure 4-6(a). The objective is to segment the image into three
logical segments. As shown in Figure 4-6(b-f), the images segmented by different
variants of FCM contain misclassified pixels compared with the image segmented by
the proposed IGFCM algorithm. The image has corrupted by adding Gaussian noise
of variance 0.01 and different segmentation techniques have been applied to the noisy
image. Figure 4-7(a-f) show noisy image as well as the image segmented by FCM,
sFCM, sFCMM, FLICM, and IGFCM, respectively. From visual inspection, it can be
observed that the proposed IGFCM algorithm produces quality segmentation with
minimum misclassifications. On the other hand, images segmented by standard FCM
and its variants contain a lot of misclassified patterns. It can be verified that IGFCM is
more robust to noise and produces more homogeneous clustering compared with other
segmentation techniques.

Chapter 4: Robust Information Gain based Fuzzy C-Means Clustering and Classification of Carotid
Artery Ultrasound Images
58
Segmentation Performance of IGFCM on CT-Liver Image
Recognizing the importance of segmentation process on medical image based disease
diagnosis, the proposed IGFCM algorithm has been applied to a CT liver image
(extracted region of interest) with a tumor. The proposed IGFCM algorithm, standard
FCM and its variants are also applied to segment CT-Liver image. The objective is to
segment the image into three clusters namely background, tumor and the main liver
tissues. For a segmentation to be ranked as high quality, the tumor must stand out of
other two segments in the image. The original image and the resultant segmented
images obtained after applying different segmentation algorithms on original CT-
Liver image are shown in Figure 4-8(a-f). The over-segmentation is immediately
visible in case of segmentation produced by FCM, sFCM and sFCMM techniques.
Whereas, in case of FLICM segmentation, several misclassified patterns can be
observed in the tumor region as shown in Figure 4-8(e). However, the proposed
IGFCM segments tumor regions with high precision. The quantitative performance
measures have also been computed by applying different segmentation techniques to
noisy versions of CT liver image. The proposed IGFCM outperforms all mentioned
techniques at various noise levels as shown in Table 4.1.
Quantitative Analysis
Table 4.1 compares PC and CE measures for different segmentation techniques
applied to noisy and original images discussed in previous sections. Note that the
quantitative results for carotid artery image correspond to Figure 4-10. The
quantitative results shown in Table 4.1 indicate a better segmentation performance
using IGFCM than standard FCM and its variants. Particularly, there is a significant
improvement in overall segmentation quality when input images contain noise of
different levels. An exception is the case of synthetic image where sFCM and the
proposed approach to produce comparable results. Also, the visual inspection of
Figure 4-3, Figure 4-4 and Figure 4-5(c &f) reveals that the results of sFCM and
IGFCM segmentations are comparable. However, IGFCM performs at other image
modalities. Hence, the general superiority of IGFCM is maintained.
The performance of different segmentation techniques, in terms of PC and CE,
has also been compared graphically. As shown in Figure 4-9, the results have been

Chapter 4: Robust Information Gain based Fuzzy C-Means Clustering and Classification of Carotid
Artery Ultrasound Images
59
displayed only for CT Liver image for demonstration purpose. In terms of both PC
and CE measures, superiority of the proposed IGFCM algorithm is immediately
evident from respective graphs. The performance advantage is even more in case of
CE as compared to PC. Hence, it can be concluded reasonably that IGFCM performs
better segmentation than FCM and various variants of FCM, especially in the
presence of noise.
Computational Analysis of the proposed IGFCM Algorithm
The storage and computational complexity of any segmentation technique is an
important factor, especially when two competitor methods have very comparable
segmentation results. In this regard, the proposed IGFCM algorithm does not require
any additional storage capacity as no memory-intensive data structure has been
introduced. Similarly, the computational performance of the proposed algorithm is
also comparable to other employed fuzzy algorithms except FCM. However, FCM
suffers intensively in the presence of noise; therefore, its computational superiority is
not justifiable. All other employed fuzzy algorithms process the input image in a way
similar to IGFCM i.e. they convolve the input image with a window of certain size.
Moreover, due to the information gain in the convergence process, the proposed
IGFCM algorithm converges in less number of iterations than other algorithms. The
computation of information gain is an additional step in the proposed algorithm.
However, the cost of computing information gain is balanced by a faster convergence
rate of IGFCM. Finally, in several offline medical applications, segmentation
accuracy is the main concern rather than computational complexity. Therefore, our
technique is preferable to other techniques as the segmentation accuracy results
presented in the paper verify its superiority.
As an improvement to the proposed IGFCM algorithm from computational
perspective, we conjecture that a parallel implementation similar to [88] is also
possible. In [88], authors have presented a non-rigid 3D medical image registration
framework and a high-speed GPU-based parallel implementation of the framework
has also been proposed. GPU-based implementation of FCM is also a part of this
framework. The proposed IGFCM approach is consistent with FCM implementation
presented in [88]. Parallel implementation of FCM in [88] spreads the processing
across several kernels, each one performing certain processing. Different steps
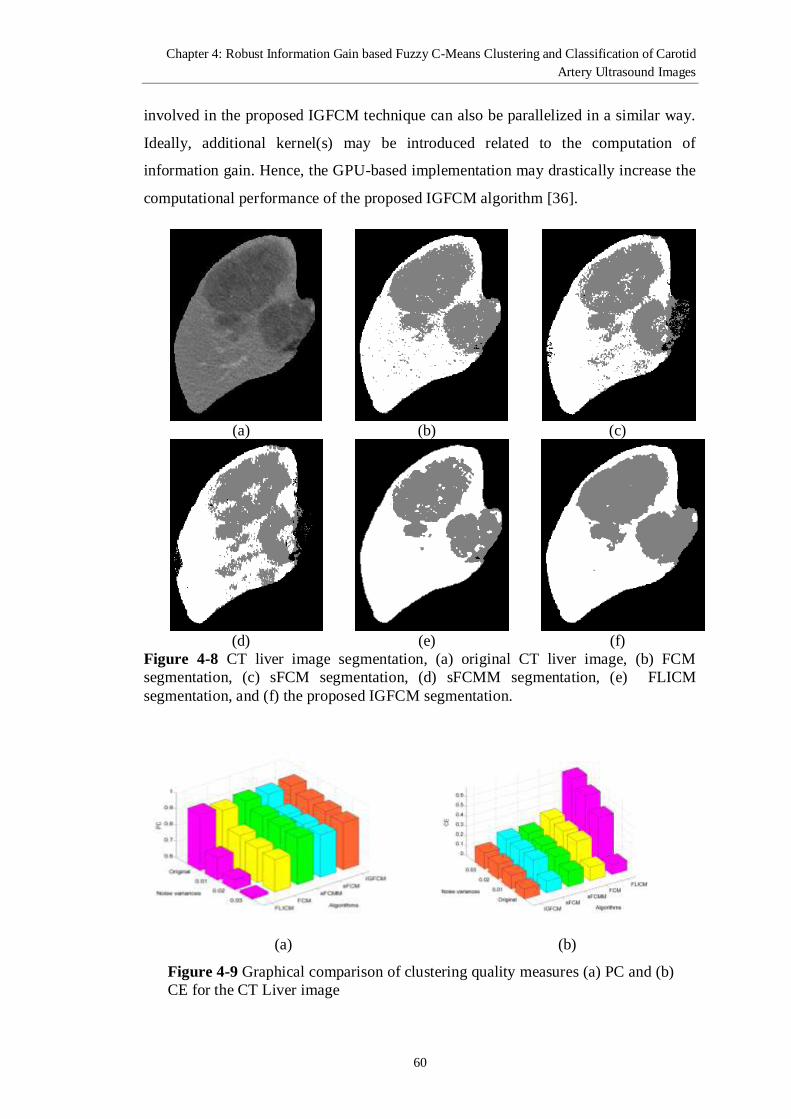
Chapter 4: Robust Information Gain based Fuzzy C-Means Clustering and Classification of Carotid
Artery Ultrasound Images
60
involved in the proposed IGFCM technique can also be parallelized in a similar way.
Ideally, additional kernel(s) may be introduced related to the computation of
information gain. Hence, the GPU-based implementation may drastically increase the
computational performance of the proposed IGFCM algorithm [36].
(a) (b) (c)
(d) (e) (f)
Figure 4-8 CT liver image segmentation, (a) original CT liver image, (b) FCM
segmentation, (c) sFCM segmentation, (d) sFCMM segmentation, (e) FLICM
segmentation, and (f) the proposed IGFCM segmentation.
(a) (b)
Figure 4-9 Graphical comparison of clustering quality measures (a) PC and (b)
CE for the CT Liver image
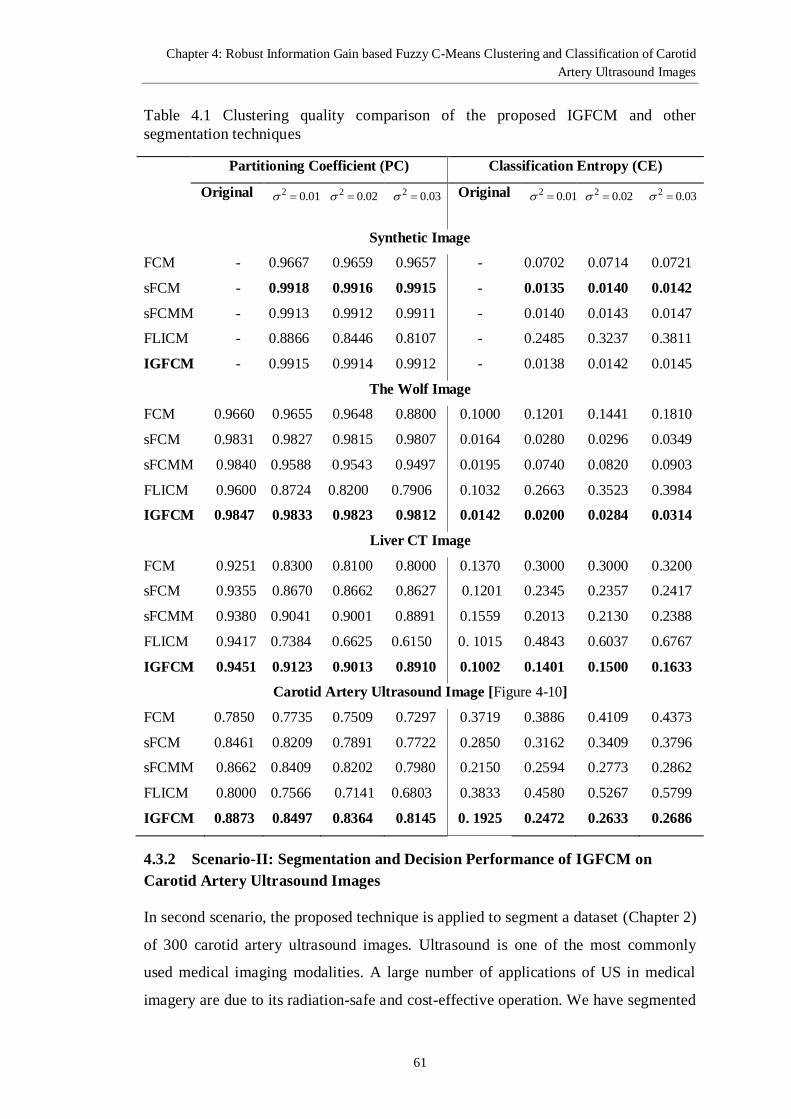
Chapter 4: Robust Information Gain based Fuzzy C-Means Clustering and Classification of Carotid
Artery Ultrasound Images
61
Table 4.1 Clustering quality comparison of the proposed IGFCM and other
segmentation techniques
Partitioning Coefficient (PC) Classification Entropy (CE)
Original 2 0.01
2 0.02
2 0.03
Original 2 0.01
2 0.02
2 0.03
Synthetic Image
FCM - 0.9667 0.9659 0.9657 - 0.0702 0.0714 0.0721
sFCM - 0.9918 0.9916 0.9915 - 0.0135 0.0140 0.0142
sFCMM - 0.9913 0.9912 0.9911 - 0.0140 0.0143 0.0147
FLICM - 0.8866 0.8446 0.8107 - 0.2485 0.3237 0.3811
IGFCM - 0.9915 0.9914 0.9912 - 0.0138 0.0142 0.0145
The Wolf Image
FCM 0.9660 0.9655 0.9648 0.8800 0.1000 0.1201 0.1441 0.1810
sFCM 0.9831 0.9827 0.9815 0.9807 0.0164 0.0280 0.0296 0.0349
sFCMM 0.9840 0.9588 0.9543 0.9497 0.0195 0.0740 0.0820 0.0903
FLICM 0.9600 0.8724 0.8200 0.7906 0.1032 0.2663 0.3523 0.3984
IGFCM 0.9847 0.9833 0.9823 0.9812 0.0142 0.0200 0.0284 0.0314
Liver CT Image
FCM 0.9251 0.8300 0.8100 0.8000 0.1370 0.3000 0.3000 0.3200
sFCM 0.9355 0.8670 0.8662 0.8627 0.1201 0.2345 0.2357 0.2417
sFCMM 0.9380 0.9041 0.9001 0.8891 0.1559 0.2013 0.2130 0.2388
FLICM 0.9417 0.7384 0.6625 0.6150 0. 1015 0.4843 0.6037 0.6767
IGFCM 0.9451 0.9123 0.9013 0.8910 0.1002 0.1401 0.1500 0.1633
Carotid Artery Ultrasound Image [Figure 4-10]
FCM 0.7850 0.7735 0.7509 0.7297 0.3719 0.3886 0.4109 0.4373
sFCM 0.8461 0.8209 0.7891 0.7722 0.2850 0.3162 0.3409 0.3796
sFCMM 0.8662 0.8409 0.8202 0.7980 0.2150 0.2594 0.2773 0.2862
FLICM 0.8000 0.7566 0.7141 0.6803 0.3833 0.4580 0.5267 0.5799
IGFCM 0.8873 0.8497 0.8364 0.8145 0. 1925 0.2472 0.2633 0.2686
4.3.2 Scenario-II: Segmentation and Decision Performance of IGFCM on
Carotid Artery Ultrasound Images
In second scenario, the proposed technique is applied to segment a dataset (Chapter 2)
of 300 carotid artery ultrasound images. Ultrasound is one of the most commonly
used medical imaging modalities. A large number of applications of US in medical
imagery are due to its radiation-safe and cost-effective operation. We have segmented

Chapter 4: Robust Information Gain based Fuzzy C-Means Clustering and Classification of Carotid
Artery Ultrasound Images
62
carotid artery ultrasound images using FCM, sFCM, sFCMM, FLICM, and the
proposed IGFCM techniques into three clusters, namely, the arterial wall, an area
inside the artery, and the background tissues. Figure 4-10(a) shows region of interest
(ROI) for one of the original carotid artery ultrasound images. Figure 4-10(b-e) show
that in all cases FCM and its variants have produced a clustering with misclassified
pixels. The IGFCM segmented image on the other hand, produces homogenous
clustering as shown in Figure 4-10(f).
A keen observation of Figure 4-10 reveals that images segmented by variants
of FCM contain most misclassified pixels in the background and arterial walls
regions. Misclassification of arterial wall tissues cannot be tolerated as accurate as
IMT values requires accurate segmentation of arterial wall. On the other hand, the
image segmented by IGFCM has fewer misclassified pixels at arterial walls and
background area compared with other techniques. Figure 4-11(a-l) shows the
proposed approach segmentation at various intensities of Gaussian noise. It can be
seen from Figure 4-11 that the proposed IGFCM has successfully segmented carotid
artery ultrasound image. Further, very few misclassifications show the robustness of
the IGFCM approach.
Figure 4-12(a) and (b) show PC and CE measures for the various carotid
artery images obtained from the database of 300 images. For convenient comparison,
the results have been shown on an interval of 20 images, resulting into a 15 images.
However, average results for all 300 images are also compared for different
segmentation techniques in Figure 4-13. The results in the Figure 4-12 and Figure
4-13 verify that the proposed IGFCM approach outperforms other variants of FCM.
The proposed IGFCM approach also yields more consistent results as evident by the
standard deviation values in Figure 4-13.
A decision system for classification of carotid artery ultrasound images into
normal/abnormal subjects has also been proposed in this work. The classification is
performed based on features computed from IMT values which in turn, are measured
from segmented carotid artery images. Precise IMT measurement, which is based on
accurate segmentation, consequently yields a better decision accuracy. Therefore, for
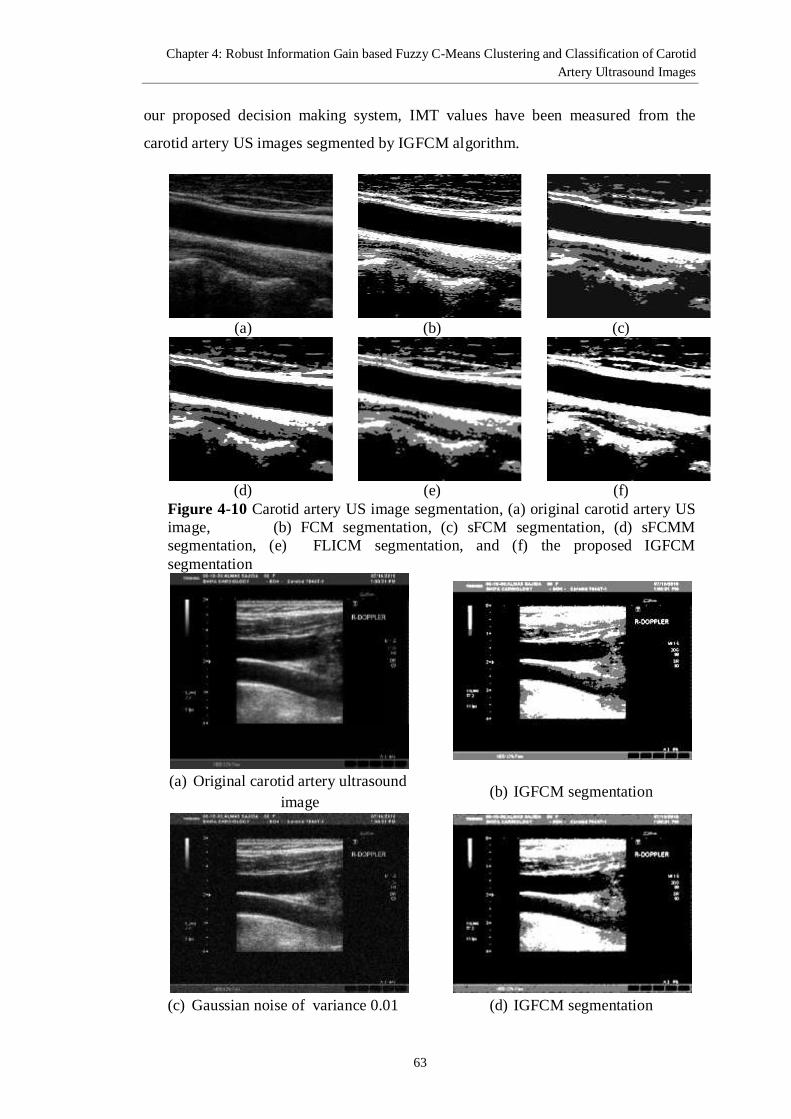
Chapter 4: Robust Information Gain based Fuzzy C-Means Clustering and Classification of Carotid
Artery Ultrasound Images
63
our proposed decision making system, IMT values have been measured from the
carotid artery US images segmented by IGFCM algorithm.
(a) (b) (c)
(d) (e) (f)
Figure 4-10 Carotid artery US image segmentation, (a) original carotid artery US
image, (b) FCM segmentation, (c) sFCM segmentation, (d) sFCMM
segmentation, (e) FLICM segmentation, and (f) the proposed IGFCM
segmentation
(a) Original carotid artery ultrasound
image (b) IGFCM segmentation
(c) Gaussian noise of variance 0.01 (d) IGFCM segmentation

Chapter 4: Robust Information Gain based Fuzzy C-Means Clustering and Classification of Carotid
Artery Ultrasound Images
64
(e) Gaussian noise of variance 0.02 (f) IGFCM segmentation
(g) Gaussian noise of variance 0.03 (h) IGFCM segmentation
(i) Original carotid artery image
with marked plaque
(j) IGFCM segmentation
(k) Gaussian noise of variance 0.01 (l) IGFCM segmentation
Figure 4-11 IGFCM segmentation at noise free and noisy carotid artery ultrasound
image corrupted through Gaussian noise of various intensities.
With the consultation of a medical expert, IMT values for upper and lower
arterial walls of carotid artery have been measured from each segmented image.
Figure 4-14 shows the measured IMT curve for one of the normal and abnormal
Plaque
Plaque
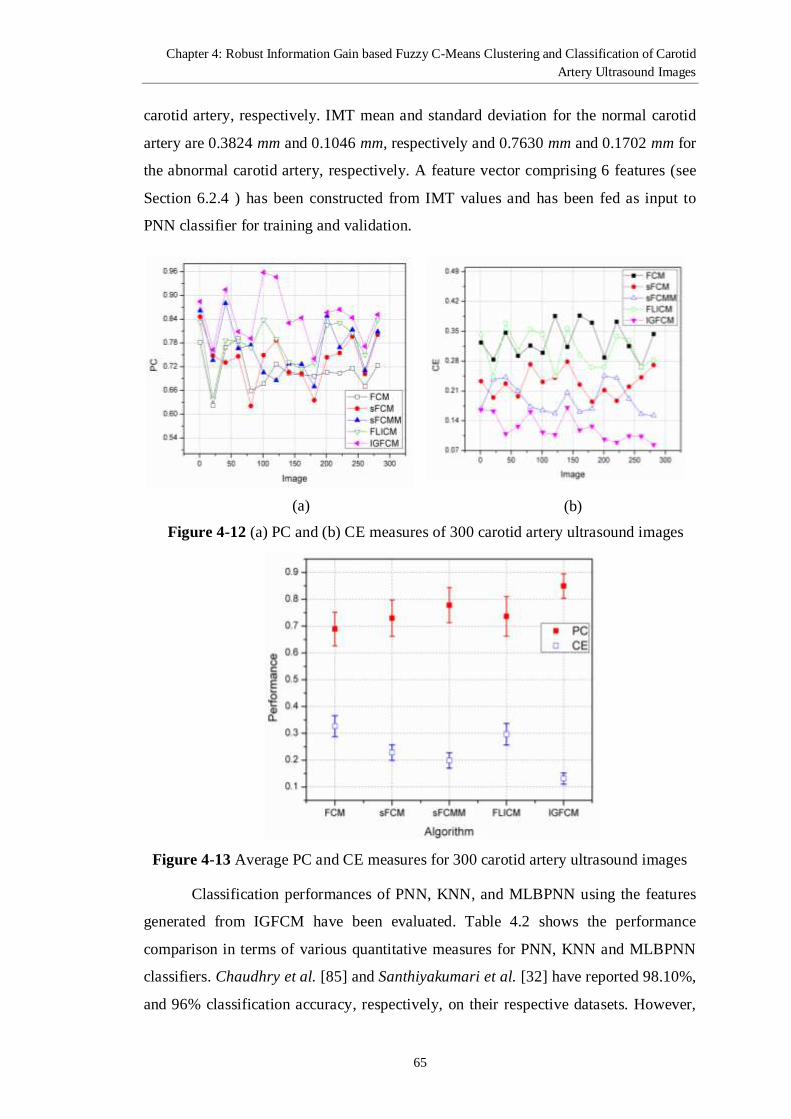
Chapter 4: Robust Information Gain based Fuzzy C-Means Clustering and Classification of Carotid
Artery Ultrasound Images
65
carotid artery, respectively. IMT mean and standard deviation for the normal carotid
artery are 0.3824 mm and 0.1046 mm, respectively and 0.7630 mm and 0.1702 mm for
the abnormal carotid artery, respectively. A feature vector comprising 6 features (see
Section 6.2.4 ) has been constructed from IMT values and has been fed as input to
PNN classifier for training and validation.
(a) (b)
Figure 4-12 (a) PC and (b) CE measures of 300 carotid artery ultrasound images
Figure 4-13 Average PC and CE measures for 300 carotid artery ultrasound images
Classification performances of PNN, KNN, and MLBPNN using the features
generated from IGFCM have been evaluated. Table 4.2 shows the performance
comparison in terms of various quantitative measures for PNN, KNN and MLBPNN
classifiers. Chaudhry et al. [85] and Santhiyakumari et al. [32] have reported 98.10%,
and 96% classification accuracy, respectively, on their respective datasets. However,

Chapter 4: Robust Information Gain based Fuzzy C-Means Clustering and Classification of Carotid
Artery Ultrasound Images
66
PNN classifier achieved 98.40% classification accuracy using the measures extracted
from the proposed IGFCM technique. This accuracy is comparable to 98.4% reported
by Hassan et al.[59]. Hence, the positive influence of our proposed technique on the
classification process is evident.
Figure 4-15 shows ROC curves for PNN, KNN, and MLBPNN classifiers. It
can be observed from the obtained ROC curves that PNN ROC curve is very close to
vertical axis, which signifies fewer misclassifications as compared with KNN and
MLBPNN classifiers. AUC value for PNN has been computed as 0.982, which
indicates a high diagnostic accuracy. These statistical results indicate that the
proposed decision system has effectively discriminated the normal and abnormal
subjects using the features from IGFCM.
Finally, we have also compared the effects of different segmentation
techniques on classification performance. In particular, FCM, sFCM, sFCMM,
FLICM, and IGFCM have been applied to 300 carotid artery images and segmented
images have been classified by PNN, KNN and MLBPNN classifiers. Figure 4-16
shows that highest classification accuracy is obtained by segmenting carotid artery
ultrasound images using the proposed IGFCM and classifying through PNN classifier,
which we have suggested in our proposed decision system.
By critically analyzing the classification results presented in Figure 4-16, one
can observe that the classification accuracy has been improved by 3.27%, 3.80% and
4.31% for PNN, KNN, and MLBPNN classifiers (see Table 4.3), respectively. This
significant classification improvement is due to the accurate segmentation of carotid
artery ultrasound images by the proposed IGFCM technique. As the classification
phase is highly dependent on segmentation and hence correct IMT measurements
which is derived from accurate segmentation. Hence, it can be concluded that the
proposed segmentation based classification scheme can successfully be applied to
identify the presence of plaque in carotid artery.
Hence, the proposed IGFCM algorithm boosts the classification accuracy and can be
used as part of the proposed decision system.

Chapter 4: Robust Information Gain based Fuzzy C-Means Clustering and Classification of Carotid
Artery Ultrasound Images
67
Figure 4-14 IMT measurements of a normal and abnormal carotid artery
Table 4.2 Performance comparison of PNN-based decision system with other
classifiers
Classifiers Classification performance
Accuracy MCC F-Score Sensitivity Specificity
PNN 98.40% 0.9600 0.9799 0.9839 0.9762
KNN 98.10% 0.9520 0.9709 0.9742 0.9725
MLBPNN 95.20% 0.8600 0.9244 0.9735 0.8905
Figure 4-15 ROC curve plotted against true positive rate vs. false positive rate for
PNN, KNN, and MLBPNN classifiers.

Chapter 4: Robust Information Gain based Fuzzy C-Means Clustering and Classification of Carotid
Artery Ultrasound Images
68
Table 4.3 The effect of segmentation technique at classification of carotid artery
ultrasound images
Classification Techniques
PNN KNN MLBPNN
Segmentation Techniques Accuracy (%)
FCM 95.20 94.37 91.10
sFCM 96.91 95.87 94.27
sFCMM 97.80 95.93 94.71
FLICM 97.84 97.30 95.10
Proposed IGFCM 98.40 98.10 95.20
Figure 4-16 Effect of segmentation techniques on the classification of carotid artery
images
Summary
In this chapter, a robust technique of segmentation, called IGFCM, has been
proposed. The proposed algorithm incorporates the concept of information gain into
fuzzy framework to overcome the shortcomings of conventional FCM algorithm. The
proposed IGFCM algorithm has been applied to segment images from different
modalities and compared with conventional FCM and three different variants of FCM.
Gaussian noise of various intensities is added to images in order to check robustness
of the proposed technique. Quantitative measures (PC and CE) computed from
Chapter 4: Robust Information Gain based Fuzzy C-Means Clustering and Classification of Carotid
Artery Ultrasound Images
69
segmented images of different modalities verify the robustness and effectiveness of
the proposed algorithm over other techniques.
Afterward, a decision system has been designed based on PNN classifier using
a dataset of 300 real carotid artery ultrasound images. The proposed decision system
has successfully distinguished the abnormal subjects from normal ones, with accuracy
of 98.40%. In addition to this, the effect of segmentation on classification has also
been investigated. The classification accuracy based on the proposed segmentation
technique has been improved by 4.31% compared with other segmentation techniques
using PNN classifier. The significant improvement in classification accuracy is due to
accurate segmentation of carotid artery ultrasound images by the proposed IGFCM
approach.
In this chapter, a robust clustering technique is proposed to segment carotid
artery ultrasound images. It has been observed from the experimental results of the
proposed IGFCM technique that there still exist some incorrect labeled patterns,
especially, on arterial walls, which is the most important part to be segmented
correctly, since IMT values are measured from these arterial walls. In order to
overcome this limitation, it is desirable to propose a technique, which minimizes the
incorrect clustering in arterial wall tissues. For this purpose, a semi-supervised
clustering technique is developed to correctly cluster the patterns present in carotid
artery ultrasound images.
Outcomes of the current chapter:
1. Robust Information Gain based Fuzzy C-Means Clustering and Classification
of Carotid Artery Ultrasound Images, “Computer Methods and Program in
Biomedicine, Journal” (IF=1.555), 2013.
2. Medical Image Segmentation Employing Information Gain and Fuzzy C-Means
Algorithm, IEEE ICOSST, Lahore, 2013.
70
Chapter 5 : Robust Segmentation of Carotid
Artery Ultrasound Images based on Neuro
Fuzzy GA and Expectation Maximization
In this chapter, a new robust segmentation and classification of carotid artery
ultrasound images (RSC-US) is proposed. The proposed hybrid approach employed
neuro fuzzy, expectation maximization (EM) and GA techniques and hence has been
used to segment carotid artery ultrasound images. Initially, class data are selected by
the user and these labels are refined by the expectation maximization algorithm.
Further, fuzzy inference system has been generated based on GA feature selection
mechanism. An intelligent decision making system based on SVM has also been
proposed to classify the segmented carotid artery ultrasound images into normal and
abnormal subjects. Hence, the proposed approach can be used as a secondary
observation to an experienced radiologist.
5.1 The Proposed RSC-US Technique
The prime objective of the proposed RSC-US scheme is to segment the carotid artery
ultrasound images with high accuracy. IMT values have been measured by carrying
out the proposed segmentation approach. Further, SVM classifier has been employed
to classify a real carotid artery images dataset into normal and abnormal subjects.
Due to inherited degradations in ultrasound images, high pixel correlation, and
partial volume effects, it is very hard to identify the correct label for each pixel. For
accurate and robust segmentation, it is highly required to train the model in such a
way that it can segment the image with high accuracy, even in the presence of noise.
The EM algorithm has been used to refine the initial labels of each class
assigned by the user. MGH based image features have been extracted, most relevant
and useful image descriptors are selected by GA. Selected image descriptors and
targets have been given as input to a neural network for generation of FIS. The
generated FIS has further been used to segment the carotid artery ultrasound images.
IMT values have been measured from the proposed RSC-US approach segmented
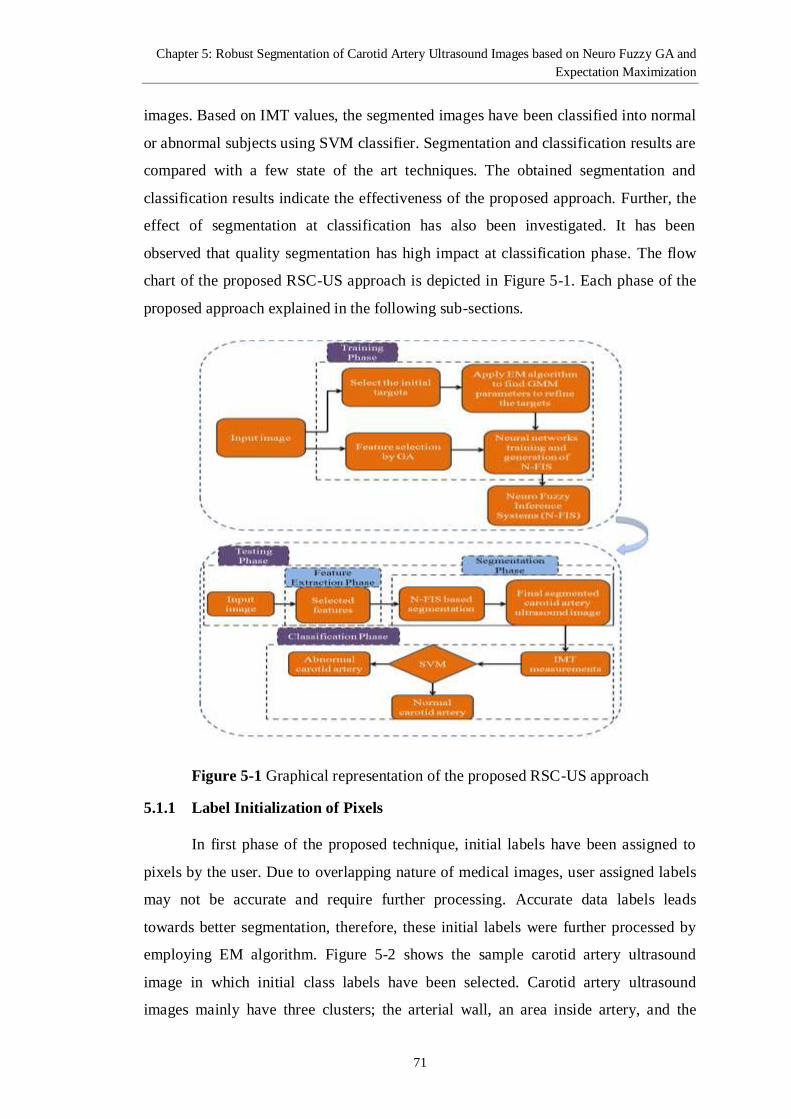
Chapter 5: Robust Segmentation of Carotid Artery Ultrasound Images based on Neuro Fuzzy GA and
Expectation Maximization
71
images. Based on IMT values, the segmented images have been classified into normal
or abnormal subjects using SVM classifier. Segmentation and classification results are
compared with a few state of the art techniques. The obtained segmentation and
classification results indicate the effectiveness of the proposed approach. Further, the
effect of segmentation at classification has also been investigated. It has been
observed that quality segmentation has high impact at classification phase. The flow
chart of the proposed RSC-US approach is depicted in Figure 5-1. Each phase of the
proposed approach explained in the following sub-sections.
Figure 5-1 Graphical representation of the proposed RSC-US approach
5.1.1 Label Initialization of Pixels
In first phase of the proposed technique, initial labels have been assigned to
pixels by the user. Due to overlapping nature of medical images, user assigned labels
may not be accurate and require further processing. Accurate data labels leads
towards better segmentation, therefore, these initial labels were further processed by
employing EM algorithm. Figure 5-2 shows the sample carotid artery ultrasound
image in which initial class labels have been selected. Carotid artery ultrasound
images mainly have three clusters; the arterial wall, an area inside artery, and the

Chapter 5: Robust Segmentation of Carotid Artery Ultrasound Images based on Neuro Fuzzy GA and
Expectation Maximization
72
background tissues. It can be observed from Figure 5-2 that the initial selected labels
have the data of other regions. Especially, some background region has been merged
into the artery wall (ROI). Arterial walls are significant for classification; therefore
these walls need to be separated from background with high accuracy.
Owing to narrow region of arterial walls, the probability of merging pixels of
other classes into arterial walls is higher. Because, the other regions like background
tissues and area inside arterial walls have large enough and the probability of merging
these areas is lower. Now, the question is how these initial targets should be refined to
find accurate class labels. For this purpose, EM algorithm has been used to handle this
issue.
Figure 5-2 Initial targets marked as artery wall, area inside the artery and the
background tissues.
5.1.2 The Expectation Maximization Step
The expectation maximization algorithm is widely used to estimate the statistical
models. It has the advantage of being simple, robust, and easy to implement. The
objective of using EM algorithm is to find iterative convergence of a set of input
projections on the most likely reconstruction. The goal is to estimate the parameters of
Gaussian mixture model (GMM) by employing EM algorithm, hence used for target
class estimation. The unknown parameter θ of the model needs to be estimated in a
Artery wall
Area inside artery
Background tissues

Chapter 5: Robust Segmentation of Carotid Artery Ultrasound Images based on Neuro Fuzzy GA and
Expectation Maximization
73
way that |p X becomes maximize. Log likelihood function is used to estimate the
parameter θ as described in Expression (5.1).
ln |L p X (5-1)
At given data X, the parameter can be considered as a function of log
likelihood. The logarithmic function is strictly increasing and so that value of
maximizes |p X . Resultantly, the L will become maximum. EM algorithm
iteratively maximizes L . Further, it is assumed that after last iteration, the current
estimate of becomes n .
nL L (5-2)
Mathematically, the difference should have to be maximized using equation (5-3),
ln | ln |n nL L p p X X (5-3)
The sole objective is to select the values of θ parameter, where L get maximized.
EM algorithm is used to select the θ at maximum | nL . The updated value is
represented by n and finally got,
1arg max |
arg max | , ln | , | | | ,
n n
n n
z
n n
l
L p z p z p z p p z
X X X X
The constant terms w.r.t. θ needs to be dropped.
arg max | , ln | , |
arg max | , ln
arg max | , ln , |
, , , ,
n
z
n
z
n
z
p z p z p z
p z
p z p z
p z p z p z p
X X
X
X X
X
| ,arg max ln , |
n
E p z
Z X
X (5-4)
Chapter 5: Robust Segmentation of Carotid Artery Ultrasound Images based on Neuro Fuzzy GA and
Expectation Maximization
74
The EM algorithm has two steps, one is expectation and other is maximization. These
steps are represented in Equation (5-4). EM algorithm thus consists of the following
steps:
1. Expectation-step, which is used to find the conditional expectation
| , ln , |n
E p z Z X X .
2. Maximization-step, which maximizes the step 1, w.r.t.θ.
Further detail and derivation of EM algorithm can be found in [89, 90]. Mean
and standard deviation for GMM model has been estimated using EM algorithm.
These estimated parameters are then used in the following expressions to find more
refined labels for the input data.
2
1
for 1, 2, ...,
n
ik
j
ij k kz k lx
(5-5)
where ijx is the jth element of the ith input data point and k is the number of class,
and are the mean and standard deviation respectively estimated by the EM
algorithm. The predicted labels are calculated by using the following expression:
1
1 ek i f
ik d
yz f
X (5-6)
where yk represents the membership of each pixel to a certain class k and zik values are
obtained from equation (5-5). The variables fe and fd are used for controlling the
fuzziness amount and these values are set empirically [91]. It is obvious that the
output of yk will be in the interval of 0 and 1. Using the maximum value of index yk,
we get the target label associated with each pixel. The graphical representation GMM
estimated by EM algorithm is presented in Figure 5-3, where, horizontal axis ( x )
shows the number of data points in association with its probability density function at
vertical axis, and the dotted curves represents data clusters.
5.1.3 Feature Extraction
The objective of this phase is to formulate a feature vector for every pixel and thus
used for segmentation. In this study, feature extraction strategy based on MGH has
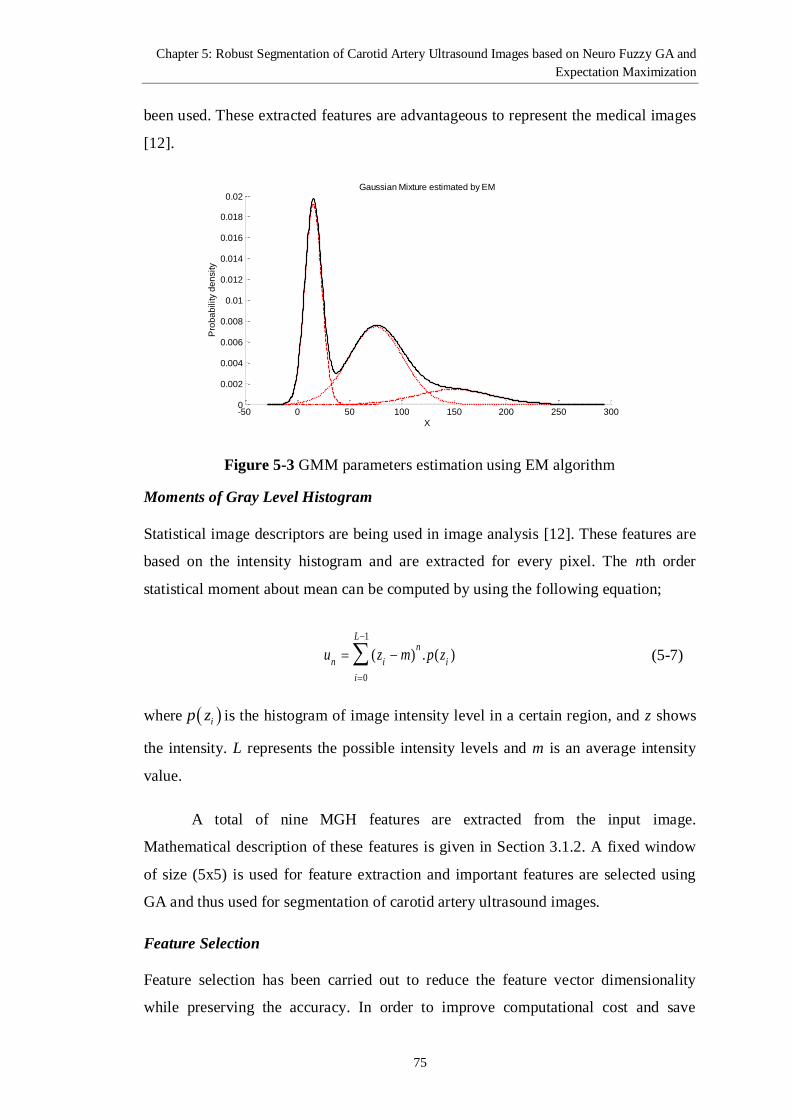
Chapter 5: Robust Segmentation of Carotid Artery Ultrasound Images based on Neuro Fuzzy GA and
Expectation Maximization
75
been used. These extracted features are advantageous to represent the medical images
[12].
Figure 5-3 GMM parameters estimation using EM algorithm
Moments of Gray Level Histogram
Statistical image descriptors are being used in image analysis [12]. These features are
based on the intensity histogram and are extracted for every pixel. The nth order
statistical moment about mean can be computed by using the following equation;
1
0
( ) . ( )
Ln
n i i
i
u z m p z
(5-7)
where ip z is the histogram of image intensity level in a certain region, and z shows
the intensity. L represents the possible intensity levels and m is an average intensity
value.
A total of nine MGH features are extracted from the input image.
Mathematical description of these features is given in Section 3.1.2. A fixed window
of size (5x5) is used for feature extraction and important features are selected using
GA and thus used for segmentation of carotid artery ultrasound images.
Feature Selection
Feature selection has been carried out to reduce the feature vector dimensionality
while preserving the accuracy. In order to improve computational cost and save
-50 0 50 100 150 200 250 3000
0.002
0.004
0.006
0.008
0.01
0.012
0.014
0.016
0.018
0.02
X
Pro
ba
bility d
en
sity
Gaussian Mixture estimated by EM
Chapter 5: Robust Segmentation of Carotid Artery Ultrasound Images based on Neuro Fuzzy GA and
Expectation Maximization
76
valuable resources, irrelevant and redundant features need to be omitted using some
searching algorithm. Many researchers have explored various feature selection
strategies such as sequential backward selection, greedy stepwise, forward selection,
GA, and swarm optimization etc. Whereby, each searching technique has its own
advantages and disadvantages [13].
In this study, GA has been used to select discriminating image descriptors
from the already extracted feature set, hence used for segmentation. WEKA 3.6, a
machine learning software has been employed for this purpose [72]. Same GA
parameters have been used as mentioned in Section 3.1.3. Only 4 out of 9 features
have been selected by GA hence was used for segmentation, which obviously saves
time and resources. The following features namely; FM2, FM4, FM5 and FM6 have
been selected by GA and thus used for segmentation.
5.1.4 Neuro Fuzzy Classifier
In image segmentation, the effectiveness of the NFC approach has been analyzed,
hence was used for segmentation of carotid artery ultrasound images. The basic
objective of fuzzy classification is to segment out the feature space into specified
fuzzy classes. In medical images, as the regions are overlapped with each other, it is
quite possible that a pixel may belong to more than one class with different degree of
membership. In this scenario, fuzzy approaches might be suitable approaches [92,
93]. Like other fuzzy techniques, in NFC, fuzzy if then else rules are applied to
develop a classifier. NFC based segmentation needs a FIS which is actually a
collection of fuzzy rules.
NFC is a supervised learning approach, its structure (i.e. input, hidden and
output layers) is similar to other neural networks. Input to the classifier is optimized
features selected by GA and a hidden layer of fifty neurons. Output layer consists of
three neurons, which represents three different classes of carotid artery ultrasound
image. Neural networks have capability to learn the system behavior and can
successfully generate the fuzzy “if then else rules” and fuzzy membership functions.
The general structure of NFC is as below:
Input layer: Four neurons
Hidden layer: Fifty neurons

Chapter 5: Robust Segmentation of Carotid Artery Ultrasound Images based on Neuro Fuzzy GA and
Expectation Maximization
77
Output layer: Three neurons
The aforementioned neutral network architecture is used for generation of FIS and the
generated FIS is thus used for segmentation. The hidden layer neurons are set
empirically and at fifty hidden layer neurons the network offers superior performance.
Training and Testing of NFC
After the selection of important image descriptors using GA, NFC training and
validation procedure starts. Class labels have been assigned to every pixel by EM
algorithm. For training and validation of NFC, 18 different carotid artery images have
been utilized from obtained dataset. Training and validation process was performed at
the ratios of 67 and 33 percent. The FIS was generated by NFC and hence used for
segmentation of carotid artery ultrasound images. Root mean square error (RMSE)
has measured by the difference between actual and predicted values Figure 5-4 shows
the RMSE curve plotted against epochs of NFC training. From Figure 5-4, it can be
observed that NFC converges when error gradient becomes very small. RMSE shows
monotonically decreasing behavior, therefore error rate decreases with increasing
number of epochs. The NFC was trained at 400 epochs so that it can learn the patterns
effectively.
Figure 5-4 Behavior of RMSE curve of NFC training at different epochs
FIS has been generated and is used for segmentation of carotid artery
ultrasound images. The proposed RSC-US approach performance is evaluated by a
significant amount of real carotid artery ultrasound images, dataset details is given in
Chapter 2. The proposed RSC-US generated FIS is shown in Figure 5-5. The
horizontal axis shows the number of selected image descriptors, whereas the vertical
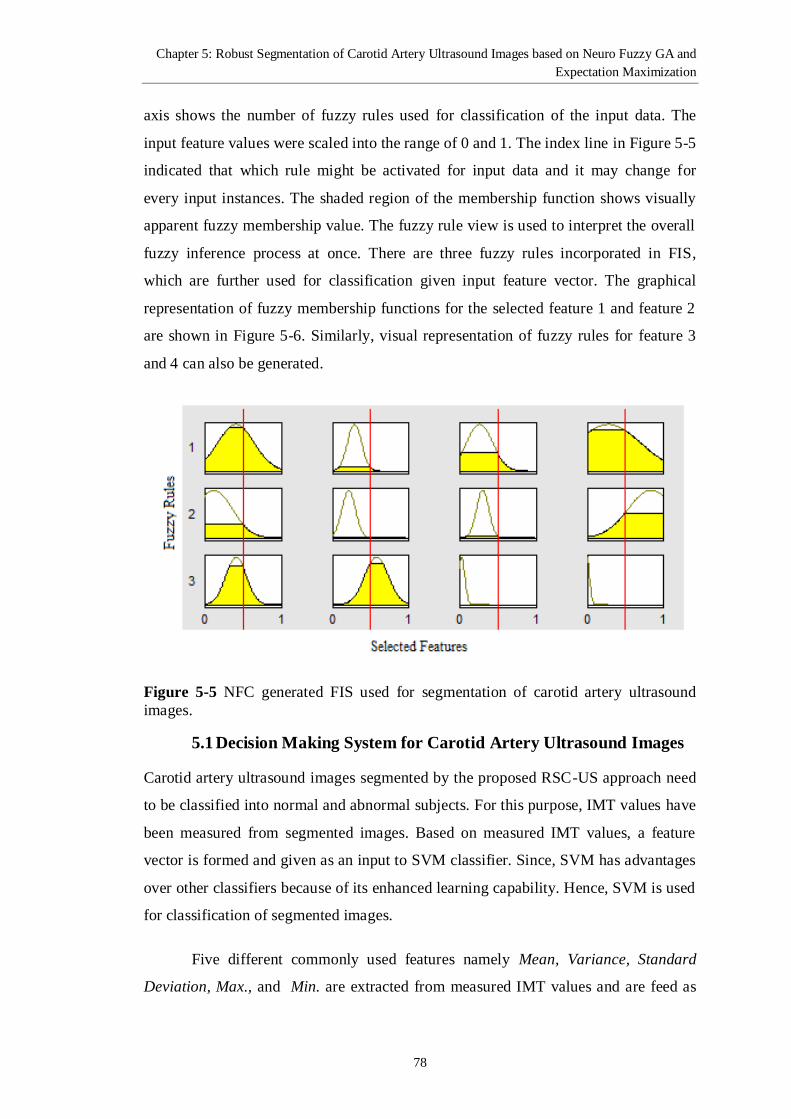
Chapter 5: Robust Segmentation of Carotid Artery Ultrasound Images based on Neuro Fuzzy GA and
Expectation Maximization
78
axis shows the number of fuzzy rules used for classification of the input data. The
input feature values were scaled into the range of 0 and 1. The index line in Figure 5-5
indicated that which rule might be activated for input data and it may change for
every input instances. The shaded region of the membership function shows visually
apparent fuzzy membership value. The fuzzy rule view is used to interpret the overall
fuzzy inference process at once. There are three fuzzy rules incorporated in FIS,
which are further used for classification given input feature vector. The graphical
representation of fuzzy membership functions for the selected feature 1 and feature 2
are shown in Figure 5-6. Similarly, visual representation of fuzzy rules for feature 3
and 4 can also be generated.
Figure 5-5 NFC generated FIS used for segmentation of carotid artery ultrasound
images.
5.1 Decision Making System for Carotid Artery Ultrasound Images
Carotid artery ultrasound images segmented by the proposed RSC-US approach need
to be classified into normal and abnormal subjects. For this purpose, IMT values have
been measured from segmented images. Based on measured IMT values, a feature
vector is formed and given as an input to SVM classifier. Since, SVM has advantages
over other classifiers because of its enhanced learning capability. Hence, SVM is used
for classification of segmented images.
Five different commonly used features namely Mean, Variance, Standard
Deviation, Max., and Min. are extracted from measured IMT values and are feed as

Chapter 5: Robust Segmentation of Carotid Artery Ultrasound Images based on Neuro Fuzzy GA and
Expectation Maximization
79
input to the classifier. The extracted feature values are normalized into the range of 0
to 1. By utilizing these features, SVM offers superior classification accuracy.
a) b)
Figure 5-6 Graphical representation of fuzzy membership functions for (a) selected
feature 1 and (b) selected feature 2
5.2.1 Classification Performance Measures
To evaluate the performance of the classifier, accuracy, MCC, sensitivity, specificity,
F-score, ROC and AUC measures have been computed, and details of these measures
is described in Section 2.6.
5.2 Experimental Results and Discussions
Real carotid artery ultrasound images have been segmented by the proposed RSC-US
approach. Details of the dataset can be found in Chapter 2. The obtained dataset is
segmented by the proposed RSC-US technique. To confirm robustness of the
proposed approach, it has been evaluated by considering various intensities of
Gaussian noise. The results of the proposed technique have been compared with few
state of the art approaches. The proposed RSC-US technique outperforms both at
noisy and noise free images.
The Figure 5-7(a) shows one of the original longitudinal carotid artery
ultrasound images with marked plaque. Selected ROI is shown in Figure 5-7(b).
Segmented carotid artery ultrasound image by the proposed technique is presented in
Figure 5-7(c). The proposed technique successfully separated plaque in carotid artery
with minimum mislabeled patterns as compared with other techniques. Results
obtained through the proposed technique are also compared with few exiting state of
the art techniques. Figure 5-7(d), 5-7 (e) and Figure 5-7(f) show the images
segmented by the FCM, K-means, and sFCMLSM methods, respectively. From visual

Chapter 5: Robust Segmentation of Carotid Artery Ultrasound Images based on Neuro Fuzzy GA and
Expectation Maximization
80
inspection, superiority of the proposed RSC-US approach is clear. On the other side,
segmented images by FCM, K-means and sFCMLSM segmented images contain
much misclassified patterns especially in marked plaque area. Further, IMT has been
measured from segmented images to form a feature vector and have been fed as input
to the SVM classifier. Therefore, image post-processing techniques are highly
dependent on segmentation quality. If carotid artery segmented images contain
misclassifications, IMT value may not be accurately measured. Consequently, the
effect of the inaccurate IMT measure produces misleading results. Particularly when
dealing with medical images a great care is needed because wrong predictions may
not be affordable in this field.
(a) (b)
(c) (d)
(e) (f)
Figure 5-7 a) One of the longitudinal original carotid artery ultrasound images with
marked plaque, b) selected ROI c) segmented by the proposed RSC-US scheme, d)
FCM segmentation, e) K-means and f) Magenta represents initial and green represents
final segmentation of sFCMLSM technique.
Magenta: Initial; Green: Final
Plaque
Plaque

Chapter 5: Robust Segmentation of Carotid Artery Ultrasound Images based on Neuro Fuzzy GA and
Expectation Maximization
81
The proposed technique’s performance robustness has also been assessed. The
carotid artery ultrasound images have been degraded by white Gaussian noise of
various intensities. Keeping in mind, medical images may not contain high intensity
of noise, beside this; we have evaluated the proposed technique at Gaussian noises of
0.01, 0.015, 0.05 and 0.1. Some sample noisy carotid artery images segmented by the
proposed RSC-US approach with Gaussian noise of variance 0.05 are shown in Figure
5-8. From Figure 5-8, it can be observed that the proposed approach has successfully
segmented images even in the presence of noise.
a) Original carotid artery image with selected ROI
b) Noisy carotid artery image with Gaussian noise of 0.05 variance
c) The proposed approach segmented image d) The proposed approach segmented image
e) Original carotid artery image with selected
ROI f) Noisy carotid artery image with Gaussian
noise of 0.05 variance

Chapter 5: Robust Segmentation of Carotid Artery Ultrasound Images based on Neuro Fuzzy GA and
Expectation Maximization
82
g) The proposed approach segmented image h) The proposed approach segmented image
Figure 5-8 Sample noise free and noisy longitudinal carotid artery ultrasound images
segmented by the proposed RSC-US approach.
(a) (b)
(c) (d)
(e) (f)
Figure 5-9 (a) One of the original longitudinal carotid artery ultrasound images, b)
image corrupted by Gaussian noise of variance 0.10 with marked ROI c) the proposed
RSC-US technique segmented image; d) FCM segmentation e) K-means and f)
sFCMLSM segmentation.
Figure 5-9(a) shows one of the original longitudinal carotid artery ultrasound
images. The image has been corrupted with Gaussian white noise of variance 0.10 and
selected ROI is shown in Figure 5-9(b). Images segmented using the proposed RSC-
US, FCM, K-means, and sFCMLSM approaches are shown in Figure 5-9(c), 5-9(d),
Plaque Plaque
Plaque
Chapter 5: Robust Segmentation of Carotid Artery Ultrasound Images based on Neuro Fuzzy GA and
Expectation Maximization
83
5-9(e), and Figure 5-9 (f), respectively. Apparently, it can be observed that the image
segmented by the proposed approach outperforms all mentioned techniques, with
minimum misclassifications even in the presence of noise. In Figure 5-9(d), the FCM
segmented image has a lot of misclassified regions, hence IMT values measurement
might be incorrect. In other segmentation approaches, such as K-means, Figure 5-9(e)
and sFCMLSM Figure 5-9(f), we can also observe the existence of misclassified
pixels. These noisy patterns may mislead IMT measurements and consequently, may
increase the false detection of plaque in carotid artery. Segmentation performance,
even in the presence of noise, shows the robustness and effectiveness of the RSC-US
approach.
5.3.1 Performance Analysis of the Proposed Segmentation Technique
Apparently, we have observed that the proposed RSC-US technique outperforms
other segmentation techniques at various noise levels. To verify the superiority of the
proposed approach qualitatively, Davies Bouldin Index (DBI) of segmented images
has been computed. Smaller the value of DBI is, the betters the clustering quality is
[58]. Using DBI clustering quality measure, Table 5.1 shows the average
performance of different techniques for obtained dataset of real carotid artery
ultrasound images on various noise levels. From Table 5.1, it can be observed that the
proposed RSC-US outperforms the mentioned techniques at all given noise levels.
From the results presented in Table 5.1, a significant fact established is that the noise
has minimum effect on the proposed approach compared with the other considered
techniques. Hence, RSC-US segmentation shows the superiority in terms of
quantitative quality measures. The graphical representation of segmentation quality
measure based on DBI at various noise levels is shown in Figure 5-10. It is evident
from Figure 5-10 that the proposed segmentation approach works efficiently also in
the presence of noise.
Segmentation time (in sec.) of the proposed RSC-US technique across the
increasing number of features is shown in Figure 5-11. Optimal performance has been
obtained by utilizing only four important features. Less segmentation time and
resources are required at selected feature set. It is evident from Table 5.1, and Table
5.2 that the proposed approach at reduced features maintains accuracy; hence offers
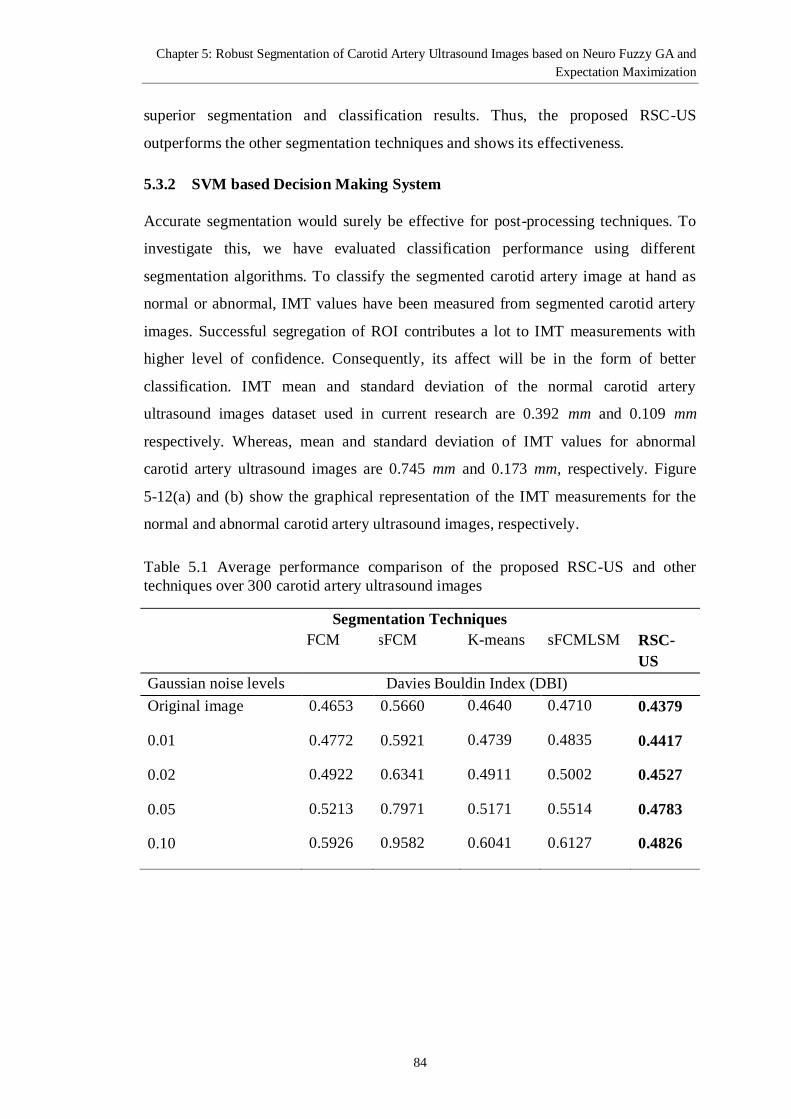
Chapter 5: Robust Segmentation of Carotid Artery Ultrasound Images based on Neuro Fuzzy GA and
Expectation Maximization
84
superior segmentation and classification results. Thus, the proposed RSC-US
outperforms the other segmentation techniques and shows its effectiveness.
5.3.2 SVM based Decision Making System
Accurate segmentation would surely be effective for post-processing techniques. To
investigate this, we have evaluated classification performance using different
segmentation algorithms. To classify the segmented carotid artery image at hand as
normal or abnormal, IMT values have been measured from segmented carotid artery
images. Successful segregation of ROI contributes a lot to IMT measurements with
higher level of confidence. Consequently, its affect will be in the form of better
classification. IMT mean and standard deviation of the normal carotid artery
ultrasound images dataset used in current research are 0.392 mm and 0.109 mm
respectively. Whereas, mean and standard deviation of IMT values for abnormal
carotid artery ultrasound images are 0.745 mm and 0.173 mm, respectively. Figure
5-12(a) and (b) show the graphical representation of the IMT measurements for the
normal and abnormal carotid artery ultrasound images, respectively.
Table 5.1 Average performance comparison of the proposed RSC-US and other
techniques over 300 carotid artery ultrasound images
Segmentation Techniques
FCM sFCM K-means sFCMLSM RSC-
US
Gaussian noise levels Davies Bouldin Index (DBI)
Original image 0.4653 0.5660 0.4640 0.4710 0.4379
0.01 0.4772 0.5921 0.4739 0.4835 0.4417
0.02 0.4922 0.6341 0.4911 0.5002 0.4527
0.05 0.5213 0.7971 0.5171 0.5514 0.4783
0.10 0.5926 0.9582 0.6041 0.6127 0.4826

Chapter 5: Robust Segmentation of Carotid Artery Ultrasound Images based on Neuro Fuzzy GA and
Expectation Maximization
85
Figure 5-10 Segmentation quality comparison of different techniques at various
noise levels
Figure 5-11 Computational time (in Sec.) of the proposed scheme across different
number of extracted features.
In this chapter, KNN, MLBPNN, and SVM classifiers have been used for
separation of normal and abnormal subjects. To choose an optimum classifier for
carotid artery ultrasound images, performance of each classifier in terms of various
quality measures has been analyzed on the proposed approach segmentation results.
Table 5.2, shows the performance comparison of SVM, MLBPNN, and KNN
approach at various classification quality parameters. We have achieved 98.84%
classification accuracy by SVM which shows the effectiveness of the proposed
segmentation technique. Classification accuracy based on the proposed RSC-US
segmentation approach has also been compared with recent published techniques.
Santhiyakumari et al. [32] have used MLBPNN for classification and reported 96%
classification accuracy at their dataset. Hassan et al. [36] have employed PNN to
classify the normal and abnormal subjects and have reported 98.4% classification

Chapter 5: Robust Segmentation of Carotid Artery Ultrasound Images based on Neuro Fuzzy GA and
Expectation Maximization
86
accuracy. Hassan et al. [59] have employed MLBPNN for classification and achieved
98.4% classification accuracy at their dataset. Whereas, using the current study’s
segmentation approach, classification accuracy of 98.84% is obtained by SVM
classifier. The results indicate that classification using the proposed technique
segmentation outperform the other techniques and hence shows the usefulness of the
proposed RSC-US segmentation approach. Graphically, a comparison of various
classifiers at different validity measures has also been shown in Figure 5-13. It can be
perceived from Figure 5-13 that SVM outperforms the other classification techniques.
Further, a comparison of different classifiers in term of ROC and AUC has
also been made. Figure 5-14 shows ROC curves for SVM, MLBPNN and KNN
classifiers. From Figure 5-14, it can be seen that SVM’s ROC is close to vertical axis,
which depicts high classification accuracy. Obtained AUC value 0.98 shows the
overall better diagnostic test and confirmed the advantage of the proposed scheme.
(a) (b)
Figure 5-12 (a) IMT measurement of a normal and (b) abnormal carotid artery
Table 5.2 Classification performance comparisons of SVM, KNN and MLBPNN
using the proposed RSC-US segmentation technique
Techniques Accuracy (%) F-Score MCC Sensitivity Specificity
KNN 98.30 0.9700 0.9483 0.9697 0.9486
MLBPNN 98.40 0.9551 0.9127 0.9750 0.9385
SVM 98.84 0.9880 0.9767 1.0000 0.9773
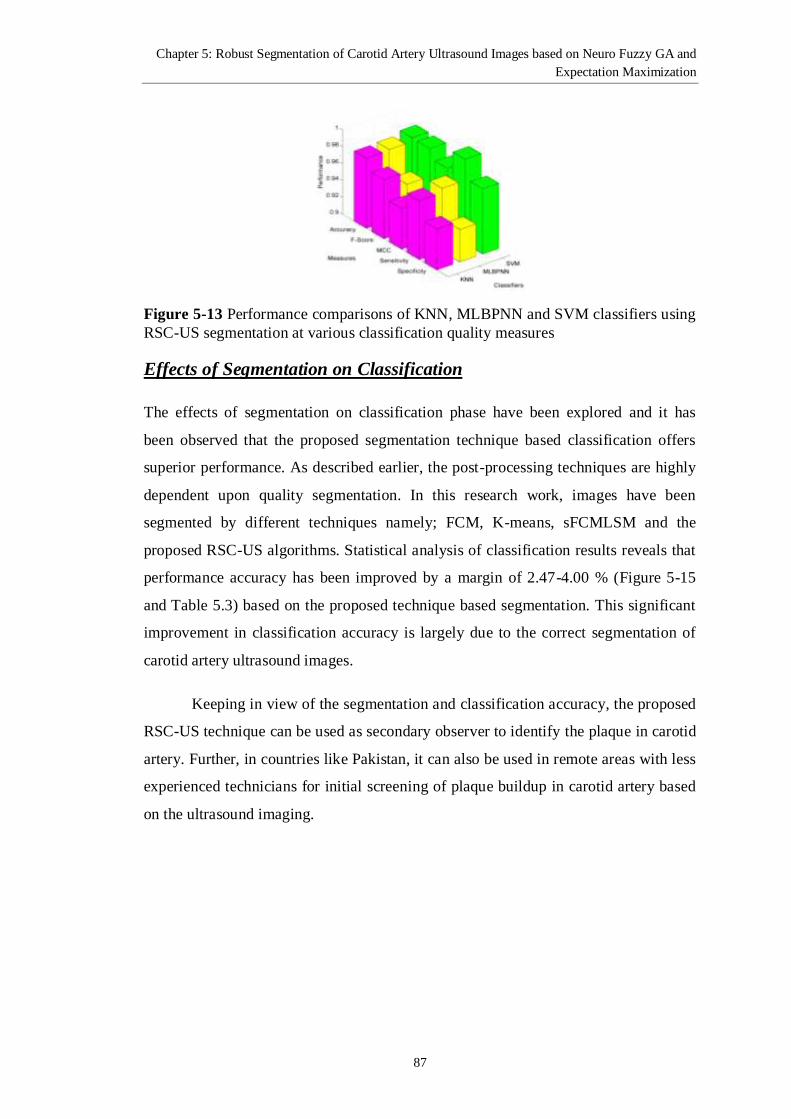
Chapter 5: Robust Segmentation of Carotid Artery Ultrasound Images based on Neuro Fuzzy GA and
Expectation Maximization
87
Figure 5-13 Performance comparisons of KNN, MLBPNN and SVM classifiers using
RSC-US segmentation at various classification quality measures
Effects of Segmentation on Classification
The effects of segmentation on classification phase have been explored and it has
been observed that the proposed segmentation technique based classification offers
superior performance. As described earlier, the post-processing techniques are highly
dependent upon quality segmentation. In this research work, images have been
segmented by different techniques namely; FCM, K-means, sFCMLSM and the
proposed RSC-US algorithms. Statistical analysis of classification results reveals that
performance accuracy has been improved by a margin of 2.47-4.00 % (Figure 5-15
and Table 5.3) based on the proposed technique based segmentation. This significant
improvement in classification accuracy is largely due to the correct segmentation of
carotid artery ultrasound images.
Keeping in view of the segmentation and classification accuracy, the proposed
RSC-US technique can be used as secondary observer to identify the plaque in carotid
artery. Further, in countries like Pakistan, it can also be used in remote areas with less
experienced technicians for initial screening of plaque buildup in carotid artery based
on the ultrasound imaging.
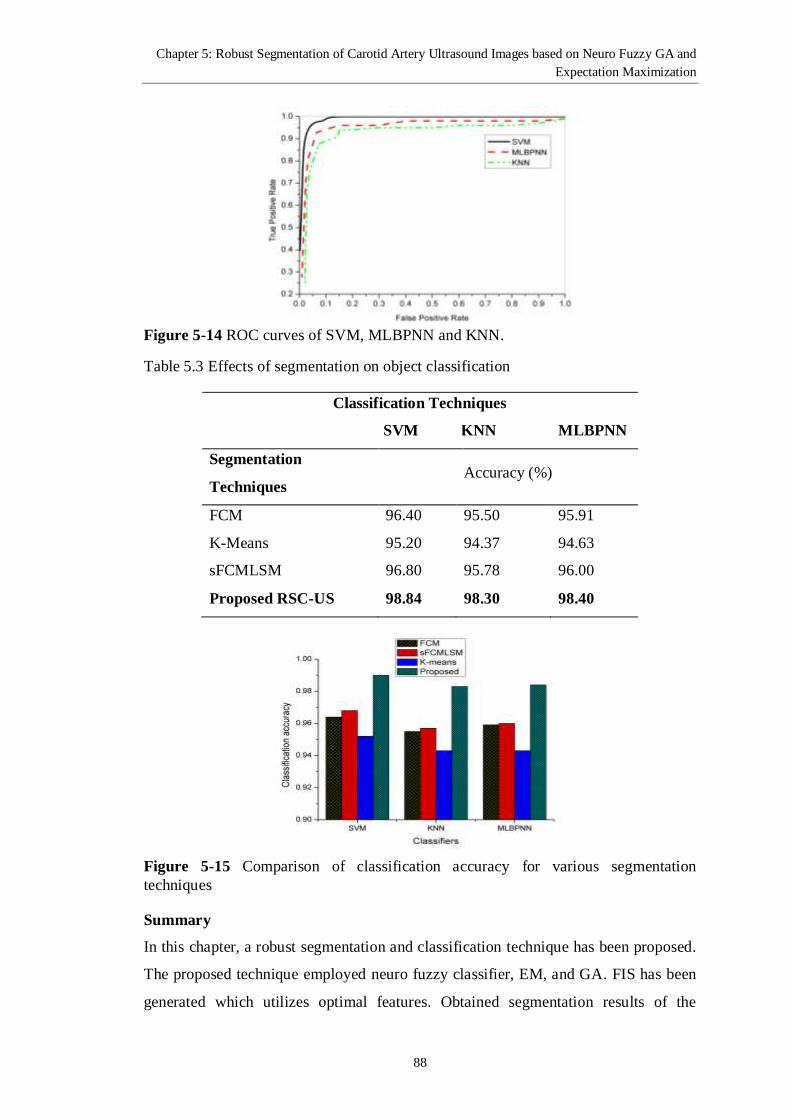
Chapter 5: Robust Segmentation of Carotid Artery Ultrasound Images based on Neuro Fuzzy GA and
Expectation Maximization
88
Figure 5-14 ROC curves of SVM, MLBPNN and KNN.
Table 5.3 Effects of segmentation on object classification
Classification Techniques
SVM KNN MLBPNN
Segmentation
Techniques Accuracy (%)
FCM 96.40 95.50 95.91
K-Means 95.20 94.37 94.63
sFCMLSM 96.80 95.78 96.00
Proposed RSC-US 98.84 98.30 98.40
Figure 5-15 Comparison of classification accuracy for various segmentation
techniques
Summary
In this chapter, a robust segmentation and classification technique has been proposed.
The proposed technique employed neuro fuzzy classifier, EM, and GA. FIS has been
generated which utilizes optimal features. Obtained segmentation results of the
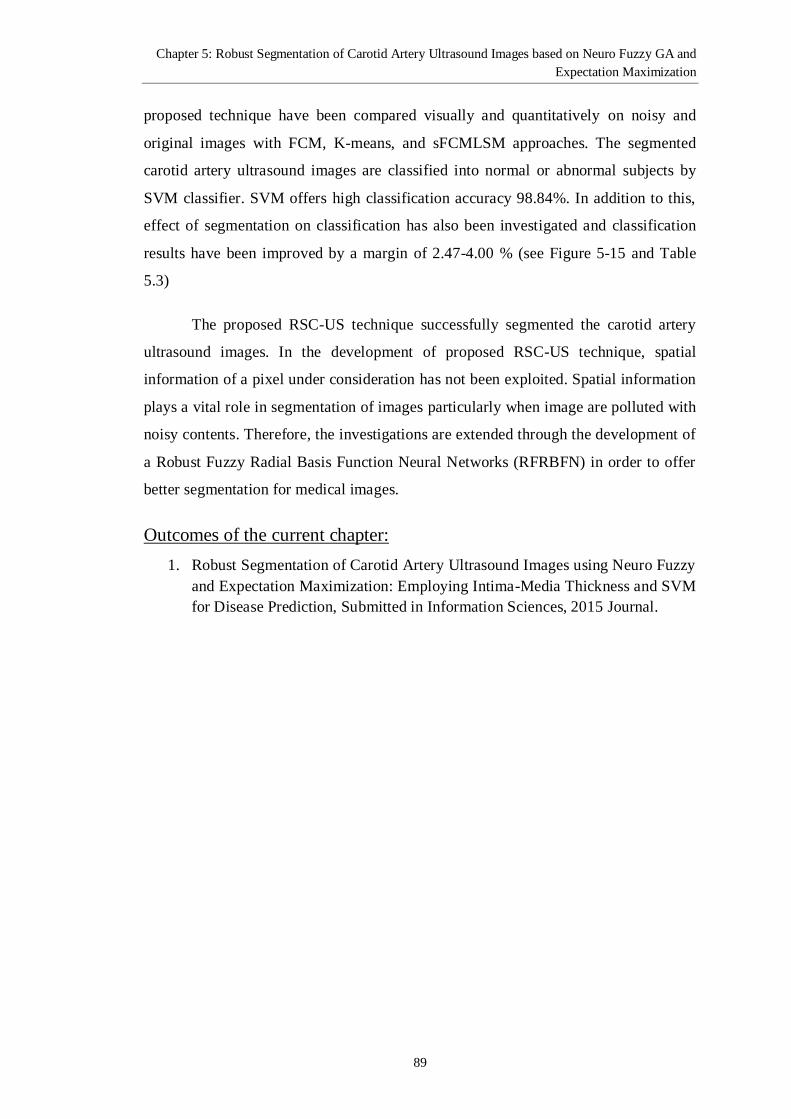
Chapter 5: Robust Segmentation of Carotid Artery Ultrasound Images based on Neuro Fuzzy GA and
Expectation Maximization
89
proposed technique have been compared visually and quantitatively on noisy and
original images with FCM, K-means, and sFCMLSM approaches. The segmented
carotid artery ultrasound images are classified into normal or abnormal subjects by
SVM classifier. SVM offers high classification accuracy 98.84%. In addition to this,
effect of segmentation on classification has also been investigated and classification
results have been improved by a margin of 2.47-4.00 % (see Figure 5-15 and Table
5.3)
The proposed RSC-US technique successfully segmented the carotid artery
ultrasound images. In the development of proposed RSC-US technique, spatial
information of a pixel under consideration has not been exploited. Spatial information
plays a vital role in segmentation of images particularly when image are polluted with
noisy contents. Therefore, the investigations are extended through the development of
a Robust Fuzzy Radial Basis Function Neural Networks (RFRBFN) in order to offer
better segmentation for medical images.
Outcomes of the current chapter:
1. Robust Segmentation of Carotid Artery Ultrasound Images using Neuro Fuzzy
and Expectation Maximization: Employing Intima-Media Thickness and SVM
for Disease Prediction, Submitted in Information Sciences, 2015 Journal.

90
Chapter 6 : Robust Fuzzy RBF Network Based
Segmentation and Decision Making System for
Carotid Artery Ultrasound Images
In this chapter, a robust clustering method for accurate segmentation of medical
images and its subsequent intelligent classification has been proposed. Medical
images may have various types of degradations and it is challenging to segment the
degraded images. In order to segment the degraded images, a new approach RFRBFN
has been proposed. For this purpose, the fuzzy RBF algorithm has been modified by
incorporating spatial information and a smoothing parameter into its objective
function, and therefore it intelligently copes with noise related variation. To validate
its effectiveness, the proposed RFRBFN is applied on the segmentation of different
imaging modalities as well as tested against impulse and Gaussian noise of various
intensities. Multi-layer backpropagation neural network is employed to classify the
segmented images into normal or abnormal subjects. The proposed intelligent
decision making system can thus be used as a secondary observer for identification of
plaque in the carotid artery.
6.1 The Proposed Robust Fuzzy RBF Network Approach
As described in Section 2.2.4, clusters centroids of radial basis function network
(RBFN) hidden units are optimized using FCM clustering algorithm. For noise free
images, using the FRBFN approach may offer better segmentation results.
Considering high susceptibility of FCM algorithm to noise, it is expected that FRBF
network may not offer better segmentation results for noisy images.
The main reason for decreased performance of FRBF network especially in
case of noise is that it has to update weights between input and hidden layer without
utilizing the spatial information shown in Equation 2-1. Thus, we incorporate the
spatial information into Equation 2-1 and the modified objective function becomes:
2
1 12p k
C Cq q q
RFCM pk j k pk lm
p k p k l N m M
J u z v u u
(6-1)
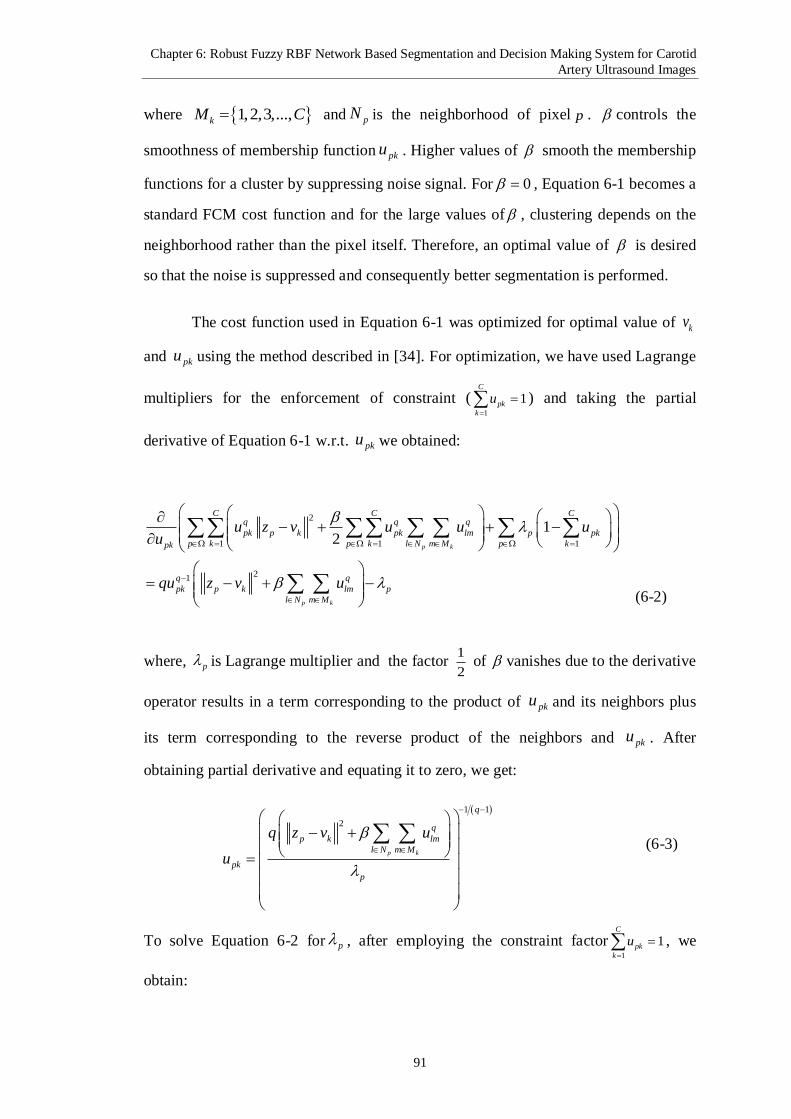
Chapter 6: Robust Fuzzy RBF Network Based Segmentation and Decision Making System for Carotid
Artery Ultrasound Images
91
where 1,2,3,...,kM C and pN is the neighborhood of pixel p . controls the
smoothness of membership function pku . Higher values of smooth the membership
functions for a cluster by suppressing noise signal. For 0 , Equation 6-1 becomes a
standard FCM cost function and for the large values of , clustering depends on the
neighborhood rather than the pixel itself. Therefore, an optimal value of is desired
so that the noise is suppressed and consequently better segmentation is performed.
The cost function used in Equation 6-1 was optimized for optimal value of kv
and pku using the method described in [34]. For optimization, we have used Lagrange
multipliers for the enforcement of constraint (1
1C
pk
k
u
) and taking the partial
derivative of Equation 6-1 w.r.t. pku we obtained:
2
1 1 1
21
12
p k
p k
C C Cq q q
pk p k pk lm p pk
p k p k l N m M p kpk
q q
pk p k lm p
l N m M
u z v u u uu
qu z v u
(6-2)
where, p is Lagrange multiplier and the factor 1
2 of vanishes due to the derivative
operator results in a term corresponding to the product of pku and its neighbors plus
its term corresponding to the reverse product of the neighbors and pku . After
obtaining partial derivative and equating it to zero, we get:
1 1
2
p k
q
q
p k lm
l N m M
pk
p
q z v u
u
(6-3)
To solve Equation 6-2 for p , after employing the constraint factor1
1C
pk
k
u
, we
obtain:

Chapter 6: Robust Fuzzy RBF Network Based Segmentation and Decision Making System for Carotid
Artery Ultrasound Images
92
1 1
2
1
1p k
qC
q
p k lm p
k l N m M
q z v u
(6-4)
p does not depend on k, therefore, it can be factored out of the summation:
1 1121
1 p k
qC
q q
p p k lm
k l N m M
q z v u
(6-5)
Now a combination of Equations 6-3 and 6-5 results in the following necessary
condition for pku to be at locally minimum of RFCMJ :
1 1
2
1 1
2
1
p k
p k
q
q
p k lm
l N m M
pk qC
q
p i lm
i l N m M
z v u
u
z v u
(6-6)
The cost function used in Equation 6-1 was optimized. The optimal value of kv , using
Equation 2-3 and pku,has been obtained by utilizing the method described in [34].
The closed form of equation for membership functions pku , after optimization of
Equation 6-1, becomes:
1
11
12 2
121
2
11
q
p k p k
p k
p k
qq q
p k lm p k lm
l N m M l N m M
pkC
qC qq p r lm
p r lm r l N m Mr l N m M
z v u z v u
u
z v uz v u
(6-7)
The equation used to find cluster centroids in the hidden layer is same as used
in Equation 2-2. If 0 , Equation 6-7 will be reduced to the standard FCM as
mentioned in Equation 2-1.
The cost function used in Equation 6-1 was optimized for optimal value of kv and pku
using the method described in. The closed form of equation for membership functions
pku , after optimization of Equation 6-1 becomes:

Chapter 6: Robust Fuzzy RBF Network Based Segmentation and Decision Making System for Carotid
Artery Ultrasound Images
93
2
1
1
1
1
p k
p k
pk lm
l N m M
pk
qCq
pr lm
r l N m M
d u
u
d u
(6-8)
The equation used to find cluster centroids in the hidden layer is the same as
used in Equation 2-2. Setting 0 in Equation 6-8 it will reduces into Equation 2-3,
which is the similar used for calculating pku in standard FCM.
The basic block diagram of the proposed method is shown in Figure 6-1. The
description of each section is given in the following subsections.
Figure 6-1 Schematic diagram of the proposed RFRBFN technique
6.1.1 Targets Outputs
Instead of using hard labels as used in RBF, we incorporate the fuzzy set concepts at
the output layer. Consider a k class problem, let each cluster has a mean k and
standard deviation k . Then the target outputs pT z can be calculated using the
following expression:
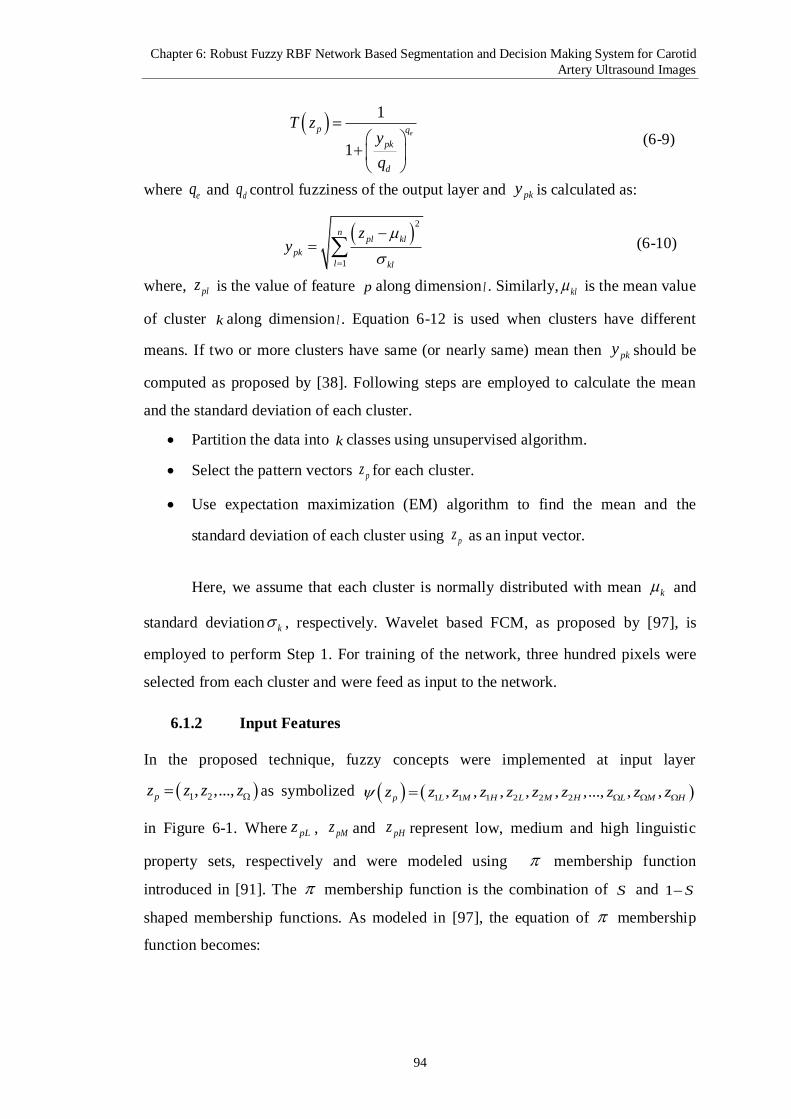
Chapter 6: Robust Fuzzy RBF Network Based Segmentation and Decision Making System for Carotid
Artery Ultrasound Images
94
1
1
ep q
pk
d
T zy
q
(6-9)
where eq and dq control fuzziness of the output layer and pky is calculated as:
2
1
npl kl
pk
l kl
zy
(6-10)
where, plz is the value of feature p along dimension l . Similarly, kl is the mean value
of cluster k along dimension l . Equation 6-12 is used when clusters have different
means. If two or more clusters have same (or nearly same) mean then pky should be
computed as proposed by [38]. Following steps are employed to calculate the mean
and the standard deviation of each cluster.
Partition the data into k classes using unsupervised algorithm.
Select the pattern vectors pz for each cluster.
Use expectation maximization (EM) algorithm to find the mean and the
standard deviation of each cluster using pz as an input vector.
Here, we assume that each cluster is normally distributed with mean k and
standard deviation k , respectively. Wavelet based FCM, as proposed by [97], is
employed to perform Step 1. For training of the network, three hundred pixels were
selected from each cluster and were feed as input to the network.
6.1.2 Input Features
In the proposed technique, fuzzy concepts were implemented at input layer
1 2, ,...,pz z z z as symbolized 1 1 1 2 2 2, , , , , ,..., , ,p L M H L M H L M Hz z z z z z z z z z
in Figure 6-1. Where pLz , pMz and pHz represent low, medium and high linguistic
property sets, respectively and were modeled using membership function
introduced in [91]. The membership function is the combination of S and 1 S
shaped membership functions. As modeled in [97], the equation of membership
function becomes:
Chapter 6: Robust Fuzzy RBF Network Based Segmentation and Decision Making System for Carotid
Artery Ultrasound Images
95
, , , 2
, ,
1 , , , 2
aS z v v a v if z c
z v aa
S z v v v a if z c
(6-11)
where 0a is the radius of function, v is the central point of the function and c
is the number of clusters. For all three types of membership functions, values of these
parameters ,a c should be chosen such that at least one of pLz , pMz and pHz is
greater than 0.5 [91].
6.1.3 Training of RFRBFN Clustering Approach
Training algorithm consists of the following three steps:
1. Find target outputs pT z as described in Section 6.1.1
2. Compute input membership functions pz as illustrated in Section 6.1.1
3. Train the proposed RFRBFN using data obtained from step 1 and step 2
The detailed description of the last step of the training algorithm is provided as
follows. When pz is presented as an input to the RFRBF network, hidden layer
partitioned it into N classes. The output layer of the proposed scheme will perform a
linear combination of the hidden layer responses and will cluster the data into k
classes by employing Equation 2-10. In order to express Equation 2-10 in terms of
hidden layer responses in the combination of Equation 6-8, the output node response
can be written as:
1
1
1
1
1
p k
p k
pk lm
l N m M
c ck
k N qCq
pr lm
r l N m M
d u
O W
d u
(6-12)
where ckW corresponds to the weight between output layer node c and hidden layer
node k . Let p
k h be the thk hidden layer node response, which can be written as:
1
1
p k
qp q
k h pk lm
l N m M
d u
(6-13)
Using this notation Equation 6-12 is simplified to.

Chapter 6: Robust Fuzzy RBF Network Based Segmentation and Decision Making System for Carotid
Artery Ultrasound Images
96
1
p
k hc ck C
pk Nr h
r
O W
(6-14)
1 p
c ck k hpk Nr H
O W
(6-15)
where
1
Cp p
r H r h
r
(6-16)
If we consider p
r H as normalization term, Equation 6-13 and Equation 6-15
imply that the output node creates a linear combination of the hidden node responses.
Therefore, RFRBF network architecture is same as FRBF network proposed in [97]
and equation for updating the weights between hidden layer and output layers are as
follows:
p p
ck p c k hp
r H
W T Z O
(6-17)
Here, pT Z is the target output obtained using Equation 6-9. Thus, step 3 of
training algorithm is summarized in the following steps.
Each hidden node response p
k h is calculated by using Equation 6-13
Calculate the normalization term p
r H by using Equation 6-16
Compute the output layer response p
cO by using Equation 6-15
The hidden and output layers weights are updated by using Equation 6-17
Update the weights of input and hidden layers by using Equations 2-2 and 6-8
Repeat these steps until MSE is minimized or becomes below the specified threshold
6.2 Experimental Results and Discussions
The proposed RFRBFN method has been applied on different imaging modalities
such as the synthetic image, brain MRI and CCA (common carotid artery) ultrasound
images with different types (Gaussian, Rician and impulse) and intensities of noises.
The proposed technique has also been compared with state of the art clustering
approaches i.e. FCM, RBF and fuzzy RBF.

Chapter 6: Robust Fuzzy RBF Network Based Segmentation and Decision Making System for Carotid
Artery Ultrasound Images
97
6.2.1 Performance Comparison on Synthetic Image
In order to examine the robustness of proposed RFRBFN method, we have generated
a gray scale synthetic image having three clusters. The size of image is 200x200 with
gray levels 0.00, 0.7 and 1.00. Gaussian noise of varied intensity (range from 0.001 to
0.3) was added to original image and the performance of the proposed RFRBFN was
analyzed. For performance evaluation, error rate rE has been computed and described
as the percentage of misclassified pixels. It is computed by using the following
expression:
100mcp
r
NE
R C
(6-18)
where mcpN is the total number of misclassified pixels, R and C correspond to number
of rows and the number of columns of the image, respectively. Figure 6-2(b) shows
the synthetic image corrupted with Gaussian noise of intensity 0.008. Different
algorithms have been applied to segment the noisy image. Figure 6-2(c) shows the
FCM segmented image, where a lot of misclassified patterns can be seen. It is due to
the fact that FCM is sensitive to noise RBF segmented image also contains
misclassifications at a specific cluster as shown in Figure 6-2(d). Figure 6-2(e) shows
the image segmented by fuzzy RBF network. Like FCM and RBF network segmented
images, fuzzy RBF network segmented image also contains mislabeled patterns.
The proposed RFRBFN technique segmented image is shown in Figure 6-2(f).
We can see that there are fewer mislabeled patterns as compared with FCM, RBF, and
FRBF network segmentation. From visual inspection, the proposed RFRBFN
approach offers better results compared with other techniques mentioned earlier. The
percentage of mislabeled pixels on various Gaussian noise levels is presented in
Figure 6-3.
The error rate of mislabeled pixels is shown in Figure 6-3. From the error rate
curves, we can see that the proposed RFRBF network has lower error rates at all noise
levels compared with other techniques. As shown in Figure 6-3, the proposed
technique outperforms other state of the art techniques showing robustness at all
mentioned noise levels. This is because of the smoothing parameter ( ) and hidden
layer outputs, which is not only depending on the current pixel but also utilizes the

Chapter 6: Robust Fuzzy RBF Network Based Segmentation and Decision Making System for Carotid
Artery Ultrasound Images
98
spatial information. For robust clustering, the parameter should be selected very
carefully in order to minimize the effect of noise. Equation 6-13 may be rewritten as
Equation 6-15 for a very small value of parameter , which will act like fuzzy RBF.
Large values of will make the classification dependent only on pixel’s
neighborhood rather than the pixel itself. Therefore, for an accurate classification,
selection of appropriate parameter is critical.
(a) (b) (c)
(d) (e) (f)
Figure 6-2 (a) original synthetic image b) Noisy image (Gaussian noise intensity of
0.008) c) Image segmented by FCM d) RBF segmented image e) Fuzzy RBF
segmentation image and f) The proposed RFRBFN segmented image.
Cross validation technique reported in [34] was utilized in the proposed
technique to find optimum value of . In the cross validation technique, dataset was
divided into two sets and RFRBFN was trained. The parameter was initialized
randomly at one part of the dataset and the cluster centers kv as well as membership
functions pku were calculated. Using the computed kv and pku , error rate was
calculated using Expression 2-4 and same procedure was repeated for a number of
steps to obtain value. Minimum value has been selected as shown in Figure 6-4.

Chapter 6: Robust Fuzzy RBF Network Based Segmentation and Decision Making System for Carotid
Artery Ultrasound Images
99
Figure 6-3 Misclassification error rE at various Gaussian noise levels
Figure 6-4 Cross validation error (in term of mean square error) of FCMJ vs
6.2.2 The proposed RFRBFN Segmentation Performance on Brain MRI
During image acquisition process, quality of brain MR images is usually
degraded. Segmentation of such degraded images is a challenging task. The proposed
RFRBFN segmentation technique is applied at T1-weighted brain MR images. The
brain MR images have been acquired from Brain web simulated brain database which
is publically available online (http://www.bic.mni.mcgill.ca/brainweb/). These images
were generated by a brain MRI simulator reported in [98].
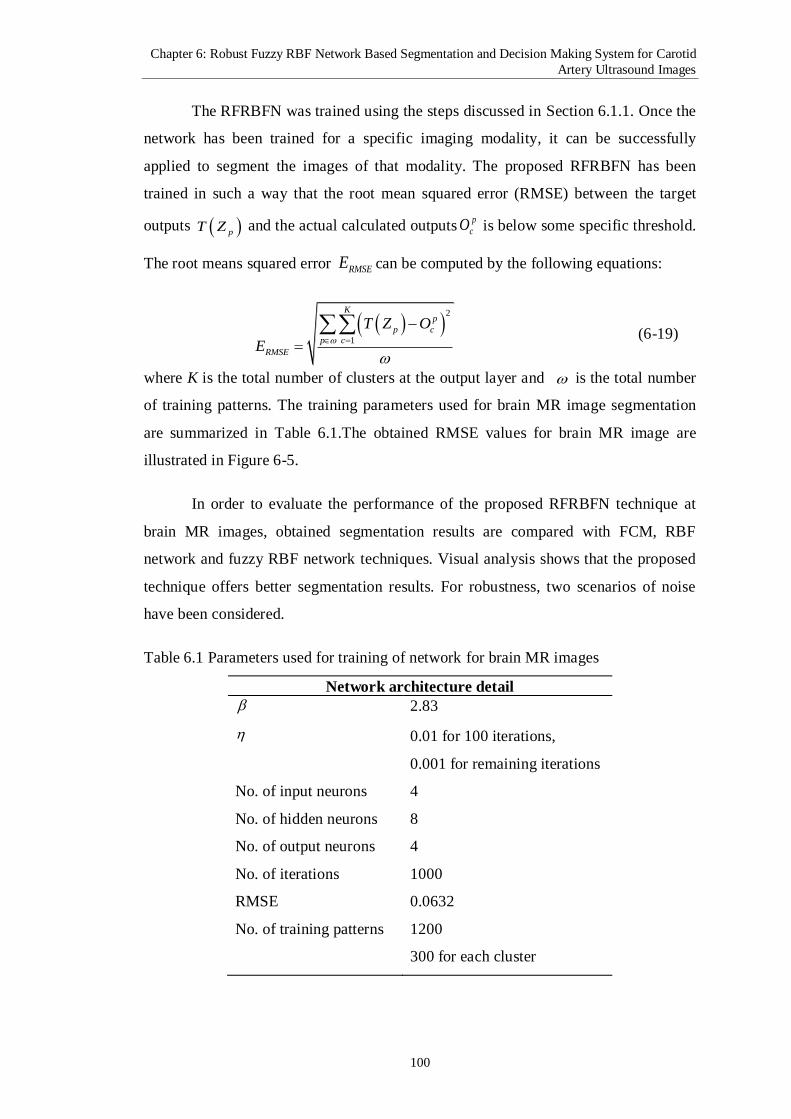
Chapter 6: Robust Fuzzy RBF Network Based Segmentation and Decision Making System for Carotid
Artery Ultrasound Images
100
The RFRBFN was trained using the steps discussed in Section 6.1.1. Once the
network has been trained for a specific imaging modality, it can be successfully
applied to segment the images of that modality. The proposed RFRBFN has been
trained in such a way that the root mean squared error (RMSE) between the target
outputs pT Z and the actual calculated outputsp
cO is below some specific threshold.
The root means squared error RMSEE can be computed by the following equations:
2
1
Kp
p c
p c
RMSE
T Z O
E
(6-19)
where K is the total number of clusters at the output layer and is the total number
of training patterns. The training parameters used for brain MR image segmentation
are summarized in Table 6.1.The obtained RMSE values for brain MR image are
illustrated in Figure 6-5.
In order to evaluate the performance of the proposed RFRBFN technique at
brain MR images, obtained segmentation results are compared with FCM, RBF
network and fuzzy RBF network techniques. Visual analysis shows that the proposed
technique offers better segmentation results. For robustness, two scenarios of noise
have been considered.
Table 6.1 Parameters used for training of network for brain MR images
Network architecture detail
2.83
0.01 for 100 iterations,
0.001 for remaining iterations
No. of input neurons 4
No. of hidden neurons 8
No. of output neurons 4
No. of iterations 1000
RMSE 0.0632
No. of training patterns 1200
300 for each cluster

Chapter 6: Robust Fuzzy RBF Network Based Segmentation and Decision Making System for Carotid
Artery Ultrasound Images
101
Figure 6-5 RMSE of the proposed RFRBF network training for MR T1-weighted
image
(a) (b) (c)
(d) (e) (f)
Figure 6-6 (a) Original brain MR image (b) image with 0.01 Gaussian noise (c) FCM
segmentation (d) Image segmented by RBF technique (e) Fuzzy RBF segmented
image(f) The proposed RFRBFN segmented image.

Chapter 6: Robust Fuzzy RBF Network Based Segmentation and Decision Making System for Carotid
Artery Ultrasound Images
102
(a) (d) (g) (j)
(b) (e) (h) (k)
(c) (f) (i) (l)
Figure 6-7 (a-c) Original brain MR images, (d-f) respective ground truths, (g-i)
RFRBFN based segmentation and (j-l) difference between ground truth and the image
by the proposed RFRBFN approach.
In first scenario, Gaussian noise of variance 0.01 was added to the original
brain MR image. Noisy brain MR images segmented by proposed, FCM, RBF
network and fuzzy RBF techniques as well as the proposed one, are shown in Figure
6-6. The proposed RFRBFN offers superior segmentation results even in the presence
of noise, as compared with the other techniques and it is shown in Figure 6-7 (f).
Further, Figure 6-7 shows a few sample brain MR images, their ground truths,
segmented images by the proposed technique and the difference between the ground
truth and proposed RFRBFN segmented images. Visual analysis of the segmented and
ground truth image reveals fewer misclassifications using RFRBFN. This is evident
from the difference images shown in last column of Figure 6-7 where only a few
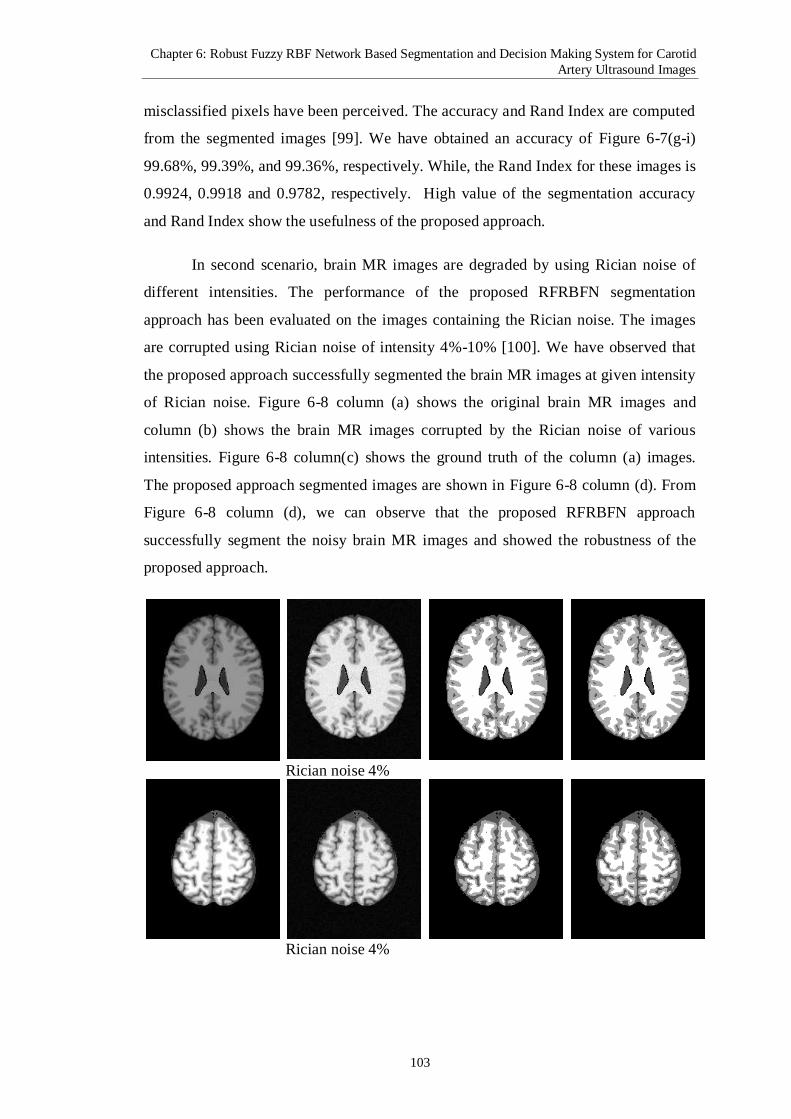
Chapter 6: Robust Fuzzy RBF Network Based Segmentation and Decision Making System for Carotid
Artery Ultrasound Images
103
misclassified pixels have been perceived. The accuracy and Rand Index are computed
from the segmented images [99]. We have obtained an accuracy of Figure 6-7(g-i)
99.68%, 99.39%, and 99.36%, respectively. While, the Rand Index for these images is
0.9924, 0.9918 and 0.9782, respectively. High value of the segmentation accuracy
and Rand Index show the usefulness of the proposed approach.
In second scenario, brain MR images are degraded by using Rician noise of
different intensities. The performance of the proposed RFRBFN segmentation
approach has been evaluated on the images containing the Rician noise. The images
are corrupted using Rician noise of intensity 4%-10% [100]. We have observed that
the proposed approach successfully segmented the brain MR images at given intensity
of Rician noise. Figure 6-8 column (a) shows the original brain MR images and
column (b) shows the brain MR images corrupted by the Rician noise of various
intensities. Figure 6-8 column(c) shows the ground truth of the column (a) images.
The proposed approach segmented images are shown in Figure 6-8 column (d). From
Figure 6-8 column (d), we can observe that the proposed RFRBFN approach
successfully segment the noisy brain MR images and showed the robustness of the
proposed approach.
Rician noise 4%
Rician noise 4%

Chapter 6: Robust Fuzzy RBF Network Based Segmentation and Decision Making System for Carotid
Artery Ultrasound Images
104
Rician noise 5%
Rician noise 6%
Rician noise 8%
Rician noise 10%
Column (a) Column (b) Column (c) Column (d)
Figure 6-8, Column (a) Original brain MR images, column (b) the noisy version of
the original brain MR images, column (c) the proposed RFRBFN approach segmented
images, column (d) the ground truth of the respective brain MR images.

Chapter 6: Robust Fuzzy RBF Network Based Segmentation and Decision Making System for Carotid
Artery Ultrasound Images
105
(a) (b)
(c) (d)
(e) (f)
Figure 6-9 (a) Original carotid artery ultrasound image selected ROI (b) Noisy
carotid artery image of intensity 0.05 (salt & pepper) (c) FCM segmented image (d)
image segmented by RBF (e) FRBF network segmentation and (f) the proposed
RFRBFN segmented image.
6.2.3 Segmentation of Carotid Artery Ultrasound Images
The proposed RFRBFN approach has been applied to segment on a significant real
carotid artery ultrasound images. The detail of the dataset used for segmentation is
described in Chapter 2.
Taking the advantage of the proposed segmentation approach, it has also been
applied to the common carotid artery ultrasound images. Table 6.2 shows the
architecture used for the training of RFRBFN on carotid artery ultrasound images.
Ultrasound images are affected by different types of degradations. A potential
solution is to apply some noise reduction filter to images as a preprocessing step
before segmentation. On the contrary, it will result in loss of fine details or important
edge information of the image. It is due to the fact that smoothing corresponds to a

Chapter 6: Robust Fuzzy RBF Network Based Segmentation and Decision Making System for Carotid
Artery Ultrasound Images
106
low pass filtering and the fine detail lies in high frequencies. These fine details will be
lost by applying some denoising filter on image before segmentation. Therefore, a
lossless algorithm is required to suppress the noisy signal and also preserve image
details. The proposed method can be successfully used in this situation because it
smoothes membership functions within a cluster rather than between clusters, thus
suppresses noises within the cluster and preserve details taking advantage of
segmentation.
Carotid artery ultrasound images were segmented by the proposed and other
techniques. The proposed technique successfully segmented ultrasound images even
in the presence of noise. Figure 6-9(a) shows ROI of one of the original carotid artery
ultrasound images. As marked, the lower arterial wall needs to be segmented for IMT
measurements. Impulse noise of intensity 0.05 has been added to the image and the
segmentation techniques are applied. Figure 6-9(c) shows the FCM segmented image
and due to the sensitivity of FCM to noise, it contains a significant amount of
misclassified patterns. RBF segmented image is shown in Figure 6-9(d), which
contain apparently misclassified patterns. Figure 6-9(e) shows an image segmented by
the FRBF network technique. Like FCM and RBF segmented images, FRBF network
segmented images also contain many misclassified pixels. On the other hand, Figure
6-9(f) shows the image segmented by the proposed RFRBFN approach. The image is
segmented with minimum misclassified patterns. From segmented results, one can
observe the superiority of the proposed approach. The sample carotid artery
ultrasound images with marked plaque, segmented by the proposed RFRBF network
approach, are presented in Figure 6-10. The proposed approach segmented the marked
plaque with high accuracy. Figure 6-10 (a, c) show the sample carotid artery
ultrasound images with marked plaque, whereas the Figure 6-10(b, d) show the
segmented images, where the plaque has been successfully separated from
background.
Similarly, Figure 6-10 (e, g) show the carotid artery ultrasound images and
Figure 6-10 (f, h) represent the segmented images by the proposed RFRBF network
approach. The post-processing techniques are highly affected by the segmentation
quality. The proposed RFRBFN technique segments the ultrasound images with a
high precision, which has a direct impact on the classification.
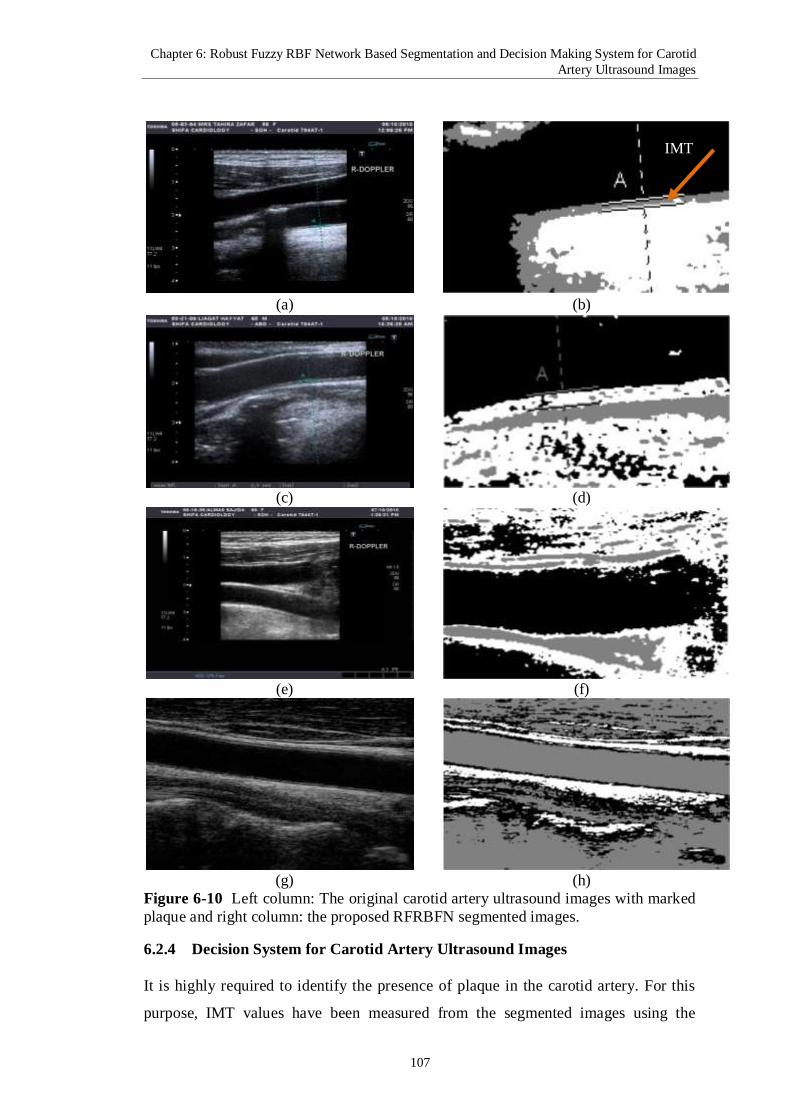
Chapter 6: Robust Fuzzy RBF Network Based Segmentation and Decision Making System for Carotid
Artery Ultrasound Images
107
Figure 6-10 Left column: The original carotid artery ultrasound images with marked
plaque and right column: the proposed RFRBFN segmented images.
6.2.4 Decision System for Carotid Artery Ultrasound Images
It is highly required to identify the presence of plaque in the carotid artery. For this
purpose, IMT values have been measured from the segmented images using the
(a) (b)
(c) (d)
(e) (f)
(g) (h)
IMT
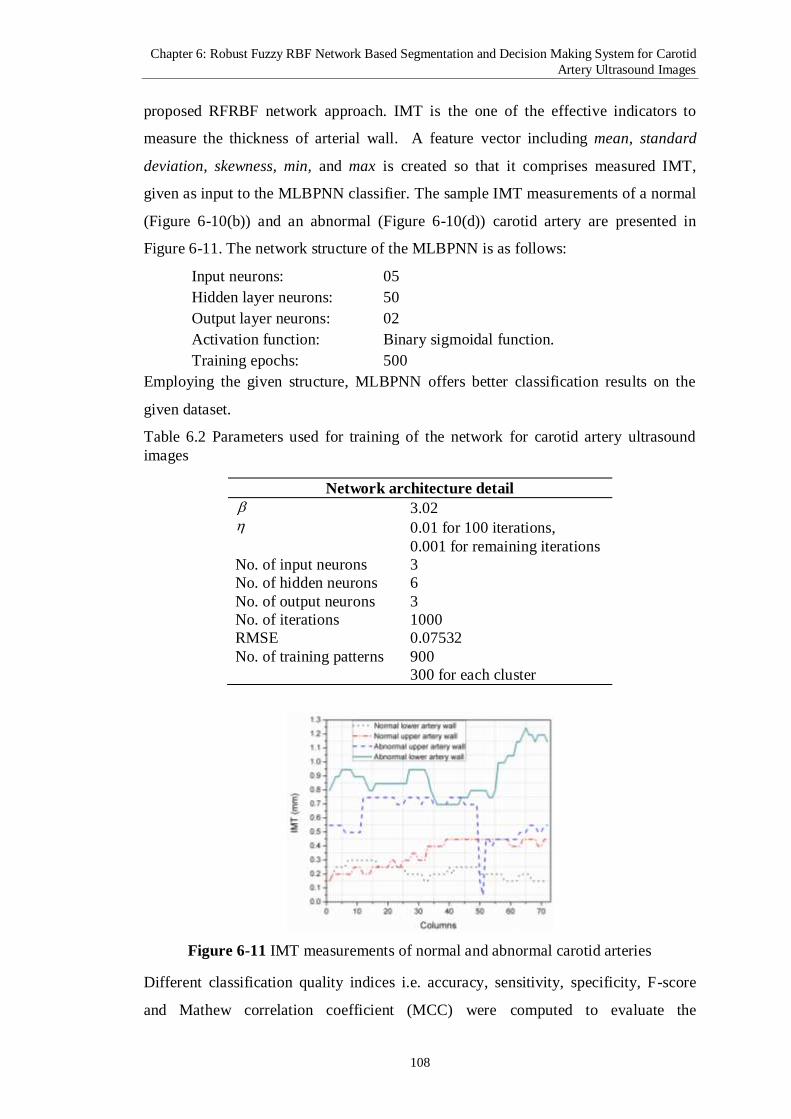
Chapter 6: Robust Fuzzy RBF Network Based Segmentation and Decision Making System for Carotid
Artery Ultrasound Images
108
proposed RFRBF network approach. IMT is the one of the effective indicators to
measure the thickness of arterial wall. A feature vector including mean, standard
deviation, skewness, min, and max is created so that it comprises measured IMT,
given as input to the MLBPNN classifier. The sample IMT measurements of a normal
(Figure 6-10(b)) and an abnormal (Figure 6-10(d)) carotid artery are presented in
Figure 6-11. The network structure of the MLBPNN is as follows:
Input neurons: 05
Hidden layer neurons: 50
Output layer neurons: 02
Activation function: Binary sigmoidal function.
Training epochs: 500
Employing the given structure, MLBPNN offers better classification results on the
given dataset.
Table 6.2 Parameters used for training of the network for carotid artery ultrasound
images
Network architecture detail
3.02 0.01 for 100 iterations,
0.001 for remaining iterations
No. of input neurons 3
No. of hidden neurons 6
No. of output neurons 3
No. of iterations 1000
RMSE 0.07532
No. of training patterns 900
300 for each cluster
Figure 6-11 IMT measurements of normal and abnormal carotid arteries
Different classification quality indices i.e. accuracy, sensitivity, specificity, F-score
and Mathew correlation coefficient (MCC) were computed to evaluate the
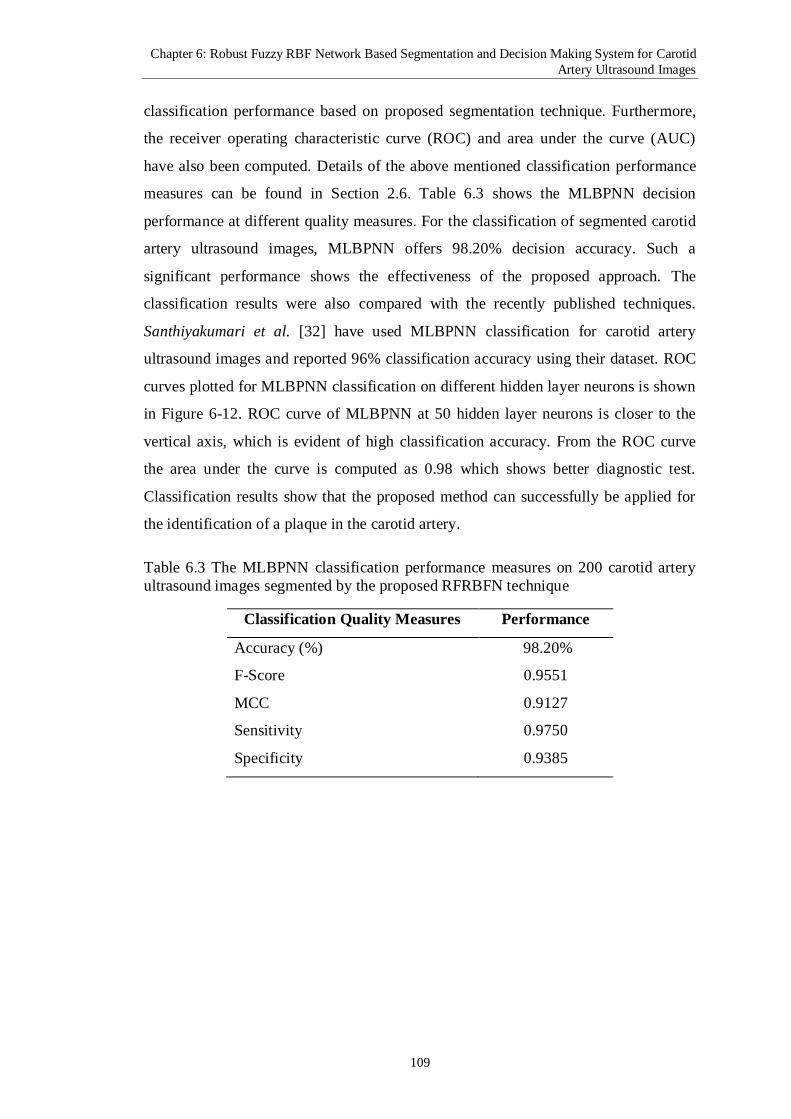
Chapter 6: Robust Fuzzy RBF Network Based Segmentation and Decision Making System for Carotid
Artery Ultrasound Images
109
classification performance based on proposed segmentation technique. Furthermore,
the receiver operating characteristic curve (ROC) and area under the curve (AUC)
have also been computed. Details of the above mentioned classification performance
measures can be found in Section 2.6. Table 6.3 shows the MLBPNN decision
performance at different quality measures. For the classification of segmented carotid
artery ultrasound images, MLBPNN offers 98.20% decision accuracy. Such a
significant performance shows the effectiveness of the proposed approach. The
classification results were also compared with the recently published techniques.
Santhiyakumari et al. [32] have used MLBPNN classification for carotid artery
ultrasound images and reported 96% classification accuracy using their dataset. ROC
curves plotted for MLBPNN classification on different hidden layer neurons is shown
in Figure 6-12. ROC curve of MLBPNN at 50 hidden layer neurons is closer to the
vertical axis, which is evident of high classification accuracy. From the ROC curve
the area under the curve is computed as 0.98 which shows better diagnostic test.
Classification results show that the proposed method can successfully be applied for
the identification of a plaque in the carotid artery.
Table 6.3 The MLBPNN classification performance measures on 200 carotid artery
ultrasound images segmented by the proposed RFRBFN technique
Classification Quality Measures Performance
Accuracy (%) 98.20%
F-Score 0.9551
MCC 0.9127
Sensitivity 0.9750
Specificity 0.9385
Chapter 6: Robust Fuzzy RBF Network Based Segmentation and Decision Making System for Carotid
Artery Ultrasound Images
110
Figure 6-12 The ROC curves for different MLBPNN classifier (with different
number of hidden layer neuron)
Table 6.4 Effects of hidden layer neurons on classification accuracy of carotid artery
ultrasound images
Hidden Layer Neurons Classification Accuracy (%)
30 95.20
40 96.00
50 98.20
55 97.37
60 96.74
The effect of varying hidden layer neurons on classification accuracy of
carotid artery ultrasound images is presented in Table 6.4. The hidden layer neurons
are selected empirically. It is evident from Table 6.4 that MLBPNN using the above
mentioned structure offers a superior performance. Keeping in view of segmentation
and classification performance of the proposed RFRBFN approach, it can be used as
secondary observer to identify the presence of plaque in carotid artery.
Summary
In this chapter, a new robust segmentation technique which integrates fuzzy RBF
network and robust FCM segmentation techniques has been proposed. In this
approach, a new smoothing parameter has been introduced, which minimizes the
Chapter 6: Robust Fuzzy RBF Network Based Segmentation and Decision Making System for Carotid
Artery Ultrasound Images
111
effect of noise. The proposed RFRBFN approach is applied to different imaging
modalities and different noise types, and its results are compared with those of FCM,
RBF and fuzzy RBF network approaches. For robustness assessment of the proposed
approach, images were degraded by various intensities of Gaussian, Rician, and
impulse noises. The proposed technique outperformed other techniques in
segmentation of noisy or noise-free images. The proposed segmentation technique has
also applied successfully at various imaging modalities. RFRBFN approach was
applied to segment a significant amount of real carotid artery ultrasound images. A
decision system based on the proposed scheme segmentation results has been
designed by employing MLBPNN classifier. High classification accuracy 98.20% has
been achieved by using MLBPNN which shows the usefulness of the proposed
approach. The proposed approach can be applied as a secondary observer to the
experienced radiologists.
The proposed technique, however, introduces some computationally overhead
due to the incorporation of Lagrange function and spatial information. Therefore, in
order to compensate this limitation, another technique based on deformable model is
proposed, which automatically segments the carotid artery ultrasound images with
high precision. The deformable method is useful when analyzing natural scenes as
well as medical images.
Outcomes of the current chapter:
1. Robust fuzzy RBF Network Based Segmentation and Intelligent Decision
Making System for Carotid Artery Ultrasound Images, Neurocomputing,
Journal (Impact Factor 2.005).

112
Chapter 7 : Automatic Active Contour Based
Segmentation and Classification of Carotid
Artery Ultrasound Images
In this chapter, a new automatic active contour based segmentation and classification
of carotid artery ultrasound images has been proposed. Early detection of the plaque
in carotid artery can avoid serious brain strokes. The active contour based techniques
have been applied successfully to segment out the carotid artery ultrasound images.
Support Vector Machine (SVM) classifier has employed to segregate the segmented
images into normal or diseased subjects. The proposed approach needs minimum
interaction for plaque detection in carotid artery.
7.1 The Proposed Approach
The proposed scheme of automated carotid artery image segmentation and
classification consists of a) preprocessing b) image alignments c) carotid artery image
segmentation d) IMT measurement e) classification of segmented carotid artery
ultrasound images into normal and abnormal subjects. Graphical representation of the
proposed approach is shown in Figure 7-1. Each step of the proposed technique is
described below in detail.
7.1.1 Alignment of Carotid Artery Ultrasound Images
During our experiments, we have found that all images are not aligned. It is due to the
fact that during the imaging process, ultrasound transducer has continuously been
moved toward around the carotid artery. Patient movement is another factor for non-
uniform imaging. Thus the movement of ultrasound transducer and the patient will
bring out images taken in out of ROI. It is easy for a human expert to locate the region
of interest (ROI) and obtain IMT measurements.
However, automatic detection of ROI by computer is not an easy task. It
requires aligned images for an accurate ROI identification. To handle rotation,
translation, and shearing transformation in carotid artery ultrasound images, we have
incorporated the image alignment as a pre-processing step in the proposed approach.
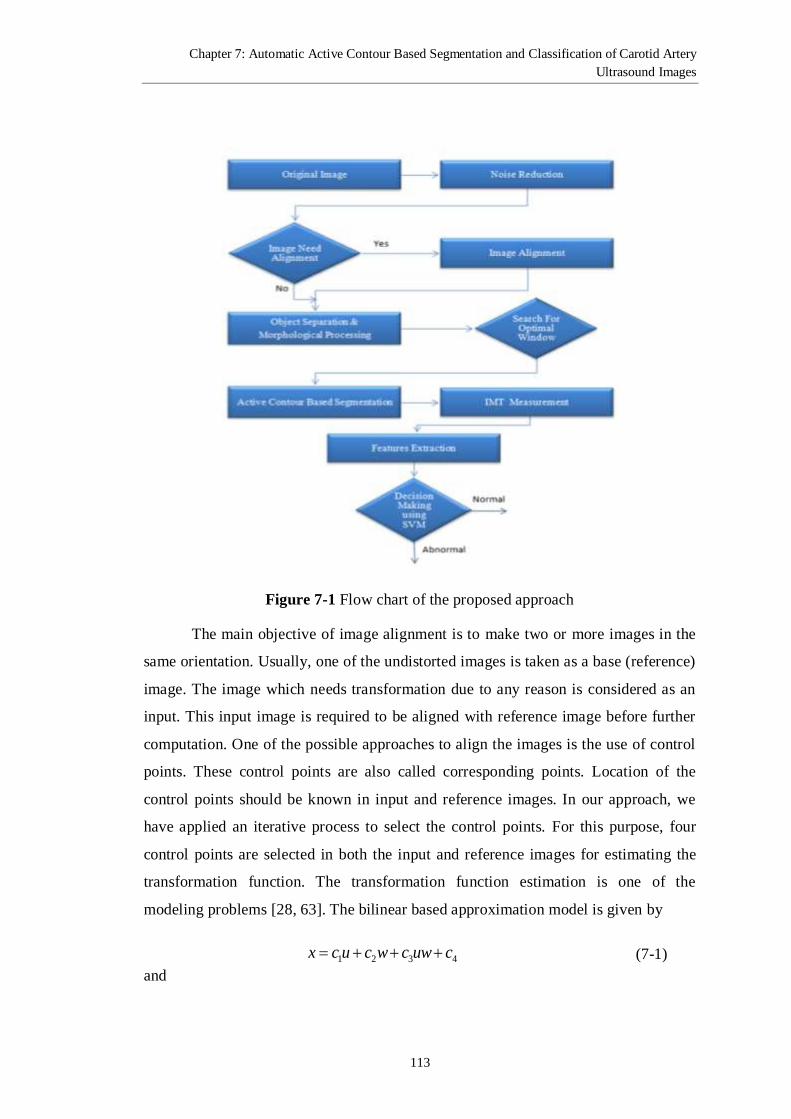
Chapter 7: Automatic Active Contour Based Segmentation and Classification of Carotid Artery
Ultrasound Images
113
Figure 7-1 Flow chart of the proposed approach
The main objective of image alignment is to make two or more images in the
same orientation. Usually, one of the undistorted images is taken as a base (reference)
image. The image which needs transformation due to any reason is considered as an
input. This input image is required to be aligned with reference image before further
computation. One of the possible approaches to align the images is the use of control
points. These control points are also called corresponding points. Location of the
control points should be known in input and reference images. In our approach, we
have applied an iterative process to select the control points. For this purpose, four
control points are selected in both the input and reference images for estimating the
transformation function. The transformation function estimation is one of the
modeling problems [28, 63]. The bilinear based approximation model is given by
1 2 3 4x c u c w c uw c (7-1)
and

Chapter 7: Automatic Active Contour Based Segmentation and Classification of Carotid Artery
Ultrasound Images
114
5 6 7 8y c u c w c uw c
(7-2)
where ,x y and ,u w are the control point coordinates of reference and input
images, respectively. In both images, if we have four corresponding pair points, eight
equations have to be defined based on Equations 7-1 and 7-2. These equations are
used to solve eight unknown coefficients 1 2 3 8, , ,...,c c c c .
Accurate alignment of images is greatly influenced by the selected control
points. Inappropriate selection of control points may lead to misleading results. For
accurate control point’s selection, the concept of spatial information has been
incorporated. In this regard, cross correlation is calculated between the selected input
and reference control points. The advantage of incorporating spatial information is an
accurate input control-point selection and results in a better aligned image. This
accurate image alignment plays a significant role in the automated carotid artery
image segmentation.
7.1.2 Snake Initialization
The major shortcoming of active contour model is snakes initialization [101]. The
initial selected window greatly affects the segmentation results. The proposed
technique automatically selects the snake initialization window which is used to
segment carotid artery ultrasound image. Snakes initialization in an automatic process
and is one of the main contributions of this research work. The input to this step is a
pre-processed image. Automatic window selection methodology is described in detail
in the following subsections.
7.1.3 Separation of Objects from Background
First of all, we have to find the objects of interest in the carotid artery ultrasound
images. For this purpose, Otsu’s method [102] has been used to separate the objects
from the background. The Otsu’s method is an automatic method of histogram based
thresholding. It is a non-parametric and unsupervised threshold selection method. The
goal is to separate out the objects from background by considering it as a two class
problem. The algorithm calculates optimal threshold to separate the objects from
background so that the intra-class variance becomes minimal by using the following
equations.
Chapter 7: Automatic Active Contour Based Segmentation and Classification of Carotid Artery
Ultrasound Images
115
2 2 2
1 1 2 2t t t t t (7-3)
where, 2
i is the class variance, i denotes the probabilities of the classes separated by
threshold t . Equation 7-4 is used to minimize the inter-class variance.
22 2 2
1 2 1 2b t t t t t t (7-4)
where 1 2 and are the means of class 1 and class 2, respectively. The probability of
class 1 t is computed from the histogram at t using Equation 7-5:
1
0
t
t p i (7-5)
where p i is the probability of a pixel belonging to respective class, whereas mean
of the class is computed by using Equation 8-6:
1
0
.t
t p i x i (7-6)
where p i is probability of the variable x i in the respective class.
The objects and background are separated from the carotid artery ultrasound
images. Some noisy and isolated patterns may remain there. These isolated patterns
have to be removed by morphological opening operation using Equation 7-7. The
morphological opening operation is usually used for smoothing object contours and
for elimination of thin protrusions [28, 63]. The opening of image f by the
structuring element b is denoted by f b , and defined as:
f b f b b (7-7)
where the symbols and denote the erosion and dilation operations, respectively.
After the morphological opening operation, area inside the artery walls has to be
intelligently identified. For this purpose, we take negative of the segmented image
using the following expression.
1s r (7-8)
where s is the resultant negative binary image and r is the segmented image using
Otsu’s approach.

Chapter 7: Automatic Active Contour Based Segmentation and Classification of Carotid Artery
Ultrasound Images
116
The advantage of an image negative is that it can be used effectively in finding
the area inside the arterial walls. After finding area inside the artery, the algorithm
intelligently decides the location and size of the window for snakes’ initialization. The
height of the initial window will be the distance between the upper and lower arterial
walls. Location and size of the window vary from image to image depending upon the
objects in the carotid artery ultrasound images. Once the window is determined, active
contour method can be successfully applied to segment the carotid artery ultrasound
images [28].
7.1.4 Segmentation of Carotid Artery Ultrasound Images
In this study, we have employed an active contour method to segment the carotid
artery ultrasound images in an automatic way. Active contour model is proposed by
Kass et al. [103] and is widely used in computer vision applications. It is based on the
energy minimization function. The advantage of an active contour model for
segmentation is that the snakes are autonomous and self-adapting in search of a
minimal energy state and can easily be manipulated. The active contour model can be
used to track objects in both the spatial and temporal domains.
The governing equation of the snake is based on the internal and external
energy components. Liang et al. [104] proposed that snake is a time variant
parametric curve T
, , , ,s t x s t y s tv located on image surface ,x y ,
where x and y are coordinate functions depending on the parameter s and t. The
Equation 7-9 is used as the governing equation of active contour model [28].
22 2
2
0
L
S
E s s ds Ps s
v
v vv v
(7-9)
The parameters and are used to control the internal energy, S v shows the
contour stiffness and elasticity. The gradient of image is calculated to find the external
energy P v . Minimum energy is obtained when contour approaches at edge of
interest.
Practically, N piecewise polynomials are used to assemble the contour. Space
independent shape function like B-Spline has been used to build each polynomial

Chapter 7: Automatic Active Contour Based Segmentation and Classification of Carotid Artery
Ultrasound Images
117
[105] weighted by the node parameters. The energy function i.e. Equation 7-9 is
minimized corresponding to Euler Lagrange partial differential equations (PDE).
2
2t
d t d tt
dt dt
u uM C Ku q (7-10)
where u(t) is the vector of N terminals, M, C and K are mass, damping and stiffness
matrices respectively. The external forces are represented by q [104].
The motion Equation 7-10 are solved with the replacement of time gradients
and its discrete approximations. By discretizing time variable t, Equation 7-10 results
in the following difference matrix equation.
1 1 2 2 1 Fu A u A u q (7-11)
where discrete time is represented by and,
2
1 2 / / ,t t A M C (7-.12)
2
2 / ,t A M (7-13)
1 2 F A A K (7-14)
The computational cost of Equation 7-11 is very high because of F inverse
calculation. An alternative formulation has been proposed by Weruaga et al. [106]
for translation of the energy function i.e. expression 7.9 in frequency domain. In this
procedure, matrix inversion is avoided because in frequency domain it becomes a
point-wise inversion.
To get the final solution smoother, B-splines are utilized as a shape function
[104], and at each update of the contour some additional calculations are performed.
To get better execution time ratio, cubic B-splines have been used in this study [107].
Cubic B-splines interpolation technique has been applied at the node parameters u to
achieve the active contour v.
7.2 Classification of Carotid Artery Ultrasound Images
The carotid artery disease diagnosis heavily depends upon an accurate segmentation
and classification of the segmented images. Segmented images need to be classified
into normal or abnormal subjects. In this study, we have employed SVM classifier for
classification of the carotid artery images. Four different features are extracted from

Chapter 7: Automatic Active Contour Based Segmentation and Classification of Carotid Artery
Ultrasound Images
118
measured IMT values obtained from the carotid artery segmented images for training
and testing of SVM classifier.
7.2.1 IMT Feature Extraction
The following four commonly used statistical features are extracted from IMT
measurements of the segmented carotid artery image. These features are normalized
in the range of [0 1] and then used as input to the SVM classifier. Classification
performance has been obtained to be the best using these features for the given
dataset. Mathematical description of each feature is as under:
1
1Average
n
i
i
xN
(7-15)
where, 1 2, ,...., nx x x are the observed values and n is the total number of
observations.
21
Var(x) iE xN
(7-16)
where, 1 2, ,....,
Nx x x are the observed values, µ is the mean of the observed values
and N is the total number of observations.
21
s.d iE xN
(7-17)
Standard deviation is the square root of the variance defined in Equation 8-16. 3
Skewness ixE
(7-18)
where µ shows the mean and expected value of quantity is represented by E.
7.2.2 Classification Performance Measurements
For classification of segmented carotid artery ultrasound images, we have used SVM
classifier and the detail of SVM classifier can be found in Section Error! Reference
ource not found.. For classification evaluation the following performance measures
accuracy, sensitivity, specificity, MCC, F-score, ROC, AUC and Negative predictive
value (NPV) have been computed. These measures are described and defined in
Section 2.6, respectively.
Chapter 7: Automatic Active Contour Based Segmentation and Classification of Carotid Artery
Ultrasound Images
119
7.3 Experimental Results and Discussions
The real carotid artery ultrasound images dataset, described in Chapter 2, are
segmented and then classified using SVM classifier. Figure 7-2(a) shows one of the
original carotid artery ultrasound images. The region of interest (ROI) is selected
from the original image. Figure 7-2(b) shows the selected ROI. To reduce the speckle
noise and wave interferences, the median filter is applied on the original image. As
described in Section 7.1, a window for snake initialization has been determined
automatically using the mentioned procedure. The selected window for snake
initialization is shown in Figure 7-2(c). Carotid artery ultrasound image is segmented
using active contour approach as shown in Figure 7-2(d). From Figure 7-2(d), it can
be observed that the arterial walls are segmented accurately by the active contour
method. Accurate segmentation of carotid artery ultrasound images using active
contour approach highly depends upon the window initialization. If initialization is
done well, one can get significant results. In the proposed approach, we have
developed a technique for automatic initialization of snakes for carotid artery
ultrasound image segmentation. As described earlier, manual initialization of snakes
by inexperience users may lead toward false segmentation results. Hence, there is
need of such a mechanism in which minimum interaction from user is required. The
proposed approach requires minimum user interaction for segmentation of carotid
artery ultrasound images
A comparison of manual and an automatic snake initialization have been made
for segmentation of carotid artery ultrasound images. The proposed approach shows
the promising segmentation results for carotid artery ultrasound images. Figure 7-3
column (a) shows the carotid artery images of different patients segmented by our
proposed approach using automatic initialization of snakes and Figure 7-3 column (b)
shows results through manual snakes initialization. The last row of Figure 7-3 shows
the normal carotid artery ultrasound images segmented by the proposed and manual
initialization techniques. From Figure 7-3, it can be observed that images segmented
by the proposed and manual initialization approach do not have any difference, which
shows the effectiveness of our proposed approach.
The problem in automatic initialization of snakes arises when images are not
aligned. The images might be rotated, sheared and translated during image acquisition
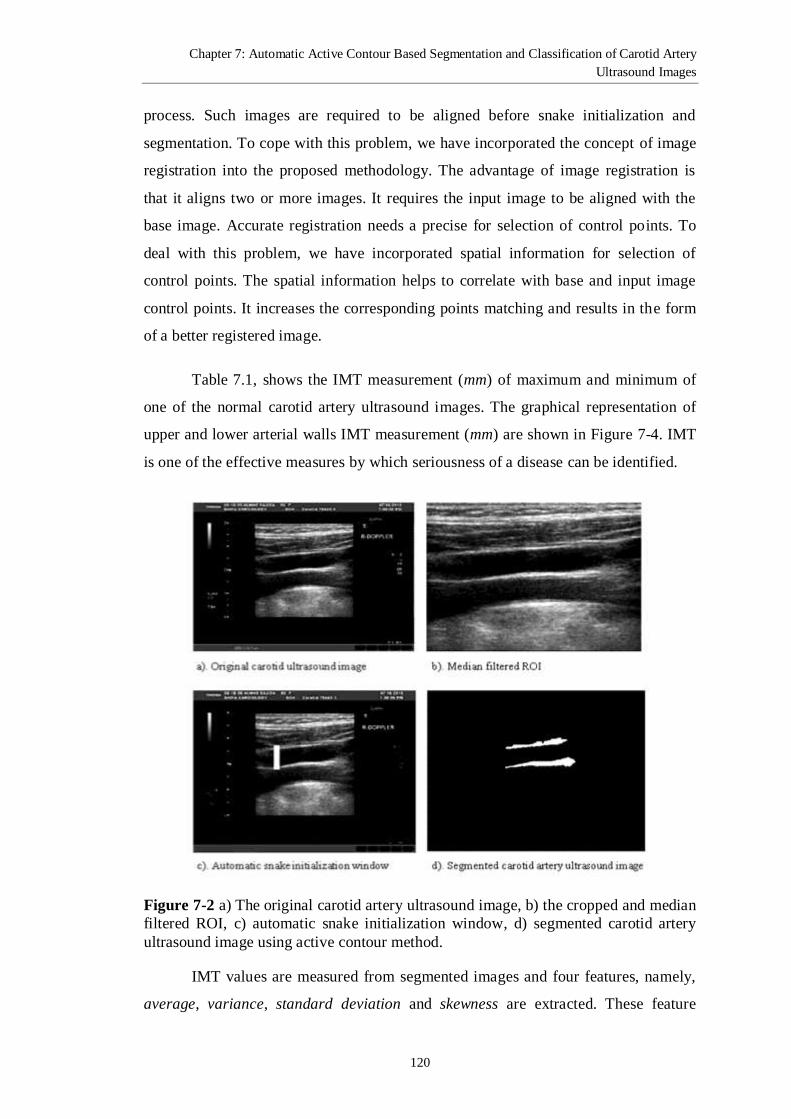
Chapter 7: Automatic Active Contour Based Segmentation and Classification of Carotid Artery
Ultrasound Images
120
process. Such images are required to be aligned before snake initialization and
segmentation. To cope with this problem, we have incorporated the concept of image
registration into the proposed methodology. The advantage of image registration is
that it aligns two or more images. It requires the input image to be aligned with the
base image. Accurate registration needs a precise for selection of control points. To
deal with this problem, we have incorporated spatial information for selection of
control points. The spatial information helps to correlate with base and input image
control points. It increases the corresponding points matching and results in the form
of a better registered image.
Table 7.1, shows the IMT measurement (mm) of maximum and minimum of
one of the normal carotid artery ultrasound images. The graphical representation of
upper and lower arterial walls IMT measurement (mm) are shown in Figure 7-4. IMT
is one of the effective measures by which seriousness of a disease can be identified.
Figure 7-2 a) The original carotid artery ultrasound image, b) the cropped and median
filtered ROI, c) automatic snake initialization window, d) segmented carotid artery
ultrasound image using active contour method.
IMT values are measured from segmented images and four features, namely,
average, variance, standard deviation and skewness are extracted. These feature
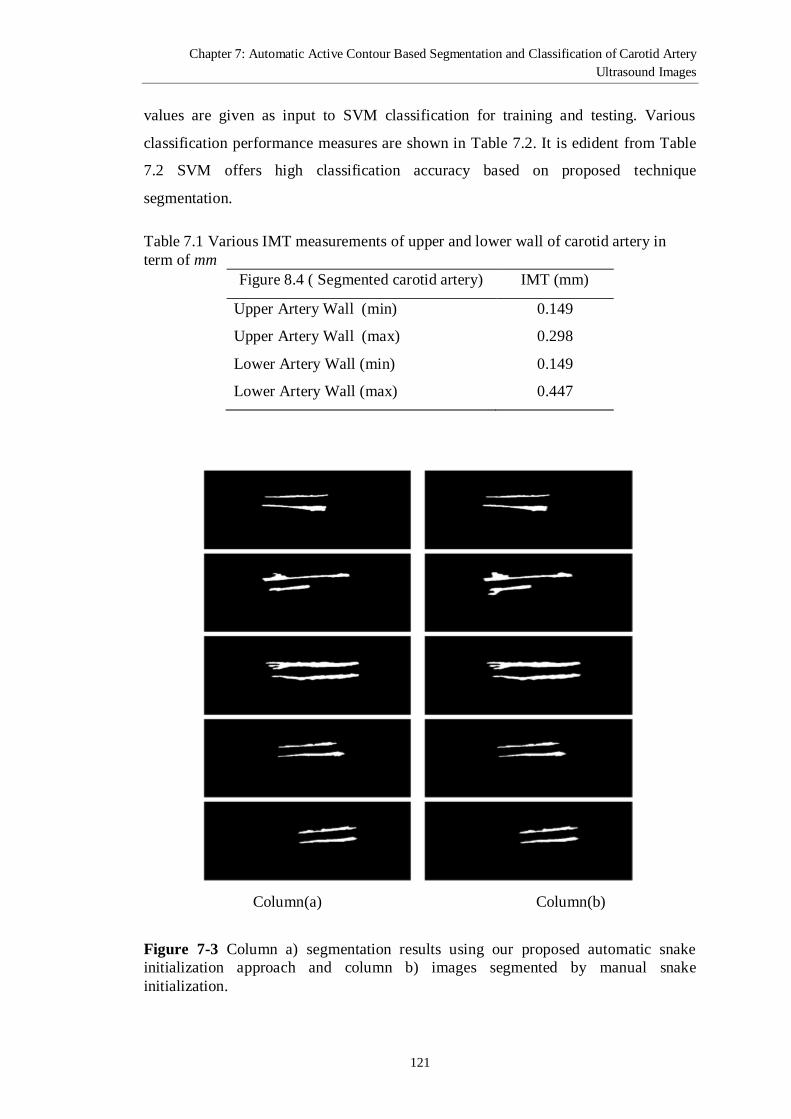
Chapter 7: Automatic Active Contour Based Segmentation and Classification of Carotid Artery
Ultrasound Images
121
values are given as input to SVM classification for training and testing. Various
classification performance measures are shown in Table 7.2. It is edident from Table
7.2 SVM offers high classification accuracy based on proposed technique
segmentation.
Table 7.1 Various IMT measurements of upper and lower wall of carotid artery in
term of mm
Figure 8.4 ( Segmented carotid artery) IMT (mm)
Upper Artery Wall (min) 0.149
Upper Artery Wall (max) 0.298
Lower Artery Wall (min) 0.149
Lower Artery Wall (max) 0.447
Figure 7-3 Column a) segmentation results using our proposed automatic snake
initialization approach and column b) images segmented by manual snake
initialization.
Column(a) Column(b)

Chapter 7: Automatic Active Contour Based Segmentation and Classification of Carotid Artery
Ultrasound Images
122
Figure 7-4 IMT measurement of a normal carotid artery ultrasound image
Table 7.2 Classification performance comparison of the various classifiers based on
proposed technique segmentation.
Techniques Accuracy
(%)
F-
Score
MCC Sensitivity Specificity NPV
(%)
KNN 98.40 0.9799 0.9600 0.9839 0.9762 98.4
PNN 98.40 0.9799 0.9600 0.9839 0.9762 98.4
SVM 98.80 0.9879 0.9763 1.0000 0.9766 100
Furthermore, we compare the performance classification techniques in terms
of ROC and AUC. Figure 7-5 shows ROC curves obtained for the true positive (TP)
and false positive (FP) rates using SVM, KNN and PNN classifiers, respectively.
From Figure 7-5, it can be observed that SVM ROC is close to vertical axis which
shows a high classification accuracy. Small deviation in ROC can be observed in both
KNN and PNN as compared to SVM. Table 7.2 shows that KNN and PNN offers
equal classification performance; hence ROC of PNN and KNN overlaps in the graph.
We have obtained 98.80% classification accuracy for the proposed approach. ROC
curve shows some variation at y-axis and this variation represents the
misclassifications when the threshold for classification is very strict. To check the
overall performance of the classifier, we have also computed area under the curve
(AUC). SVM offers high AUC value 0.98 which shows high classification rate. SVM
value of AUC is close to 1.0 which shows the overall better classification
performance (better diagnostic test). It confirms the superiority of the proposed

Chapter 7: Automatic Active Contour Based Segmentation and Classification of Carotid Artery
Ultrasound Images
123
approach. High NPV value 100% is obtained by the proposed approach based
classification. Resulted high value of NPV means that the probability of a patient has
become risk free for which the test was conducted. Therefore, it can be concluded that
our proposed approach can be used effectively for diagnostics of plaque into carotid
artery ultrasound images.
In addition, performance comparison of the proposed scheme in terms of a
size of the feature vector for classification has been carried out with other techniques.
Minghao et al. [95] have used SVM classification with 22 different features obtained
from IMT measurements. They have reported F-measure 0.98 using their own dataset.
While a large feature vector dimension may affect the classification accuracy because
of the redundant features. In the proposed scheme, high F-measure ~ 0.99 value has
been achieved with only four features as compared to 22 features dataset. The reduced
features may save classification time and resources. Moreover, the proposed scheme
outperforms using given features.
In term of overall accuracy, Santhiyakumari et al. [32] have employed
Multilayer Backpropagation Neural Networks (MLBPNN) for classification and have
reported a maximum of 96% classification accuracy. In their approach, IMT values
are used to train the neural networks, but they did not mention feature extraction
strategy and it might be difficult to reproduce the results. On the other hand, in the
proposed scheme, a straight forward approach has been utilized to classify the
segmented images and have obtained 98.8% classification accuracy. Similarly,
Hassan et al. [59] have obtained 98.4% classification accuracy. Statistical results
indicate the usefulness of the proposed approach.
Furthermore, to check the performance of our proposed approach, we have
applied KNN (k-nearest neighborhood) and PNN (probabilistic neural networks) on
the given dataset. The detail of KNN and PNN can be found in [108] and [109],
respectively. Table 7.2 shows comparison of different methods at different quality
measures. From Table 7.2, it is clear that SVM offers superior results as compared to
the other techniques. Statistical analysis of results represents the usefulness of the
proposed approach. Figure 7-6 shows the graphical performance comparison of PNN,
KNN and SVM at various classification validity measures. Classification using SVM
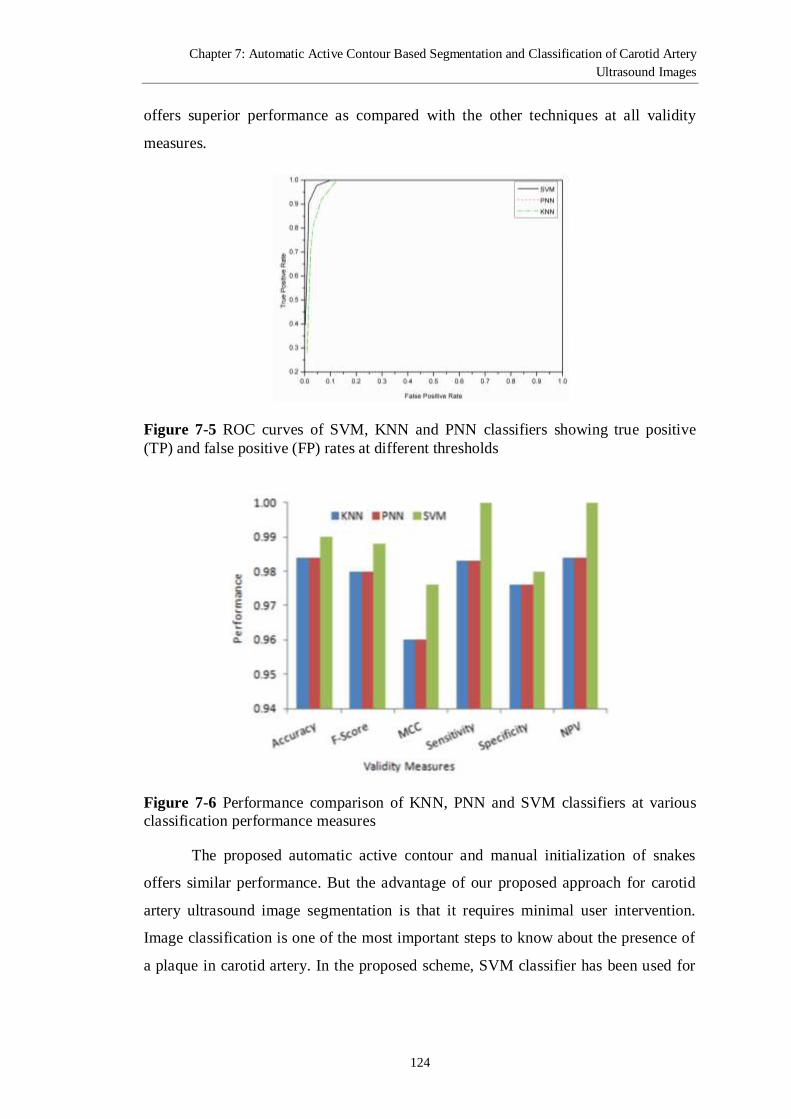
Chapter 7: Automatic Active Contour Based Segmentation and Classification of Carotid Artery
Ultrasound Images
124
offers superior performance as compared with the other techniques at all validity
measures.
Figure 7-5 ROC curves of SVM, KNN and PNN classifiers showing true positive
(TP) and false positive (FP) rates at different thresholds
Figure 7-6 Performance comparison of KNN, PNN and SVM classifiers at various
classification performance measures
The proposed automatic active contour and manual initialization of snakes
offers similar performance. But the advantage of our proposed approach for carotid
artery ultrasound image segmentation is that it requires minimal user intervention.
Image classification is one of the most important steps to know about the presence of
a plaque in carotid artery. In the proposed scheme, SVM classifier has been used for
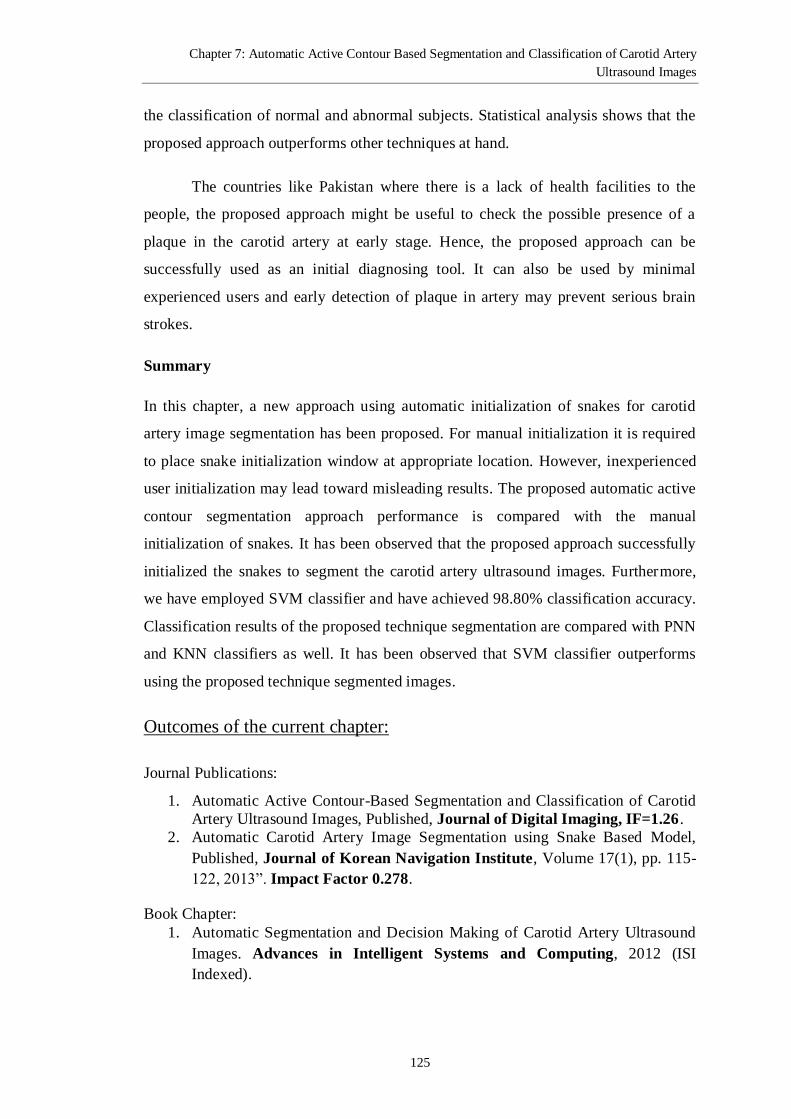
Chapter 7: Automatic Active Contour Based Segmentation and Classification of Carotid Artery
Ultrasound Images
125
the classification of normal and abnormal subjects. Statistical analysis shows that the
proposed approach outperforms other techniques at hand.
The countries like Pakistan where there is a lack of health facilities to the
people, the proposed approach might be useful to check the possible presence of a
plaque in the carotid artery at early stage. Hence, the proposed approach can be
successfully used as an initial diagnosing tool. It can also be used by minimal
experienced users and early detection of plaque in artery may prevent serious brain
strokes.
Summary
In this chapter, a new approach using automatic initialization of snakes for carotid
artery image segmentation has been proposed. For manual initialization it is required
to place snake initialization window at appropriate location. However, inexperienced
user initialization may lead toward misleading results. The proposed automatic active
contour segmentation approach performance is compared with the manual
initialization of snakes. It has been observed that the proposed approach successfully
initialized the snakes to segment the carotid artery ultrasound images. Furthermore,
we have employed SVM classifier and have achieved 98.80% classification accuracy.
Classification results of the proposed technique segmentation are compared with PNN
and KNN classifiers as well. It has been observed that SVM classifier outperforms
using the proposed technique segmented images.
Outcomes of the current chapter:
Journal Publications:
1. Automatic Active Contour-Based Segmentation and Classification of Carotid
Artery Ultrasound Images, Published, Journal of Digital Imaging, IF=1.26.
2. Automatic Carotid Artery Image Segmentation using Snake Based Model,
Published, Journal of Korean Navigation Institute, Volume 17(1), pp. 115-
122, 2013”. Impact Factor 0.278.
Book Chapter:
1. Automatic Segmentation and Decision Making of Carotid Artery Ultrasound
Images. Advances in Intelligent Systems and Computing, 2012 (ISI
Indexed).

126
Chapter 8 : Conclusions and Future Directions
Carotid arteries supply oxygenated blood to the brain. The carotid artery stenosis is
the process of narrowing the carotid artery due to the presence of atherosclerosis. The
atherosclerosis is caused by the cholesterol and other fatty materials, which introduce
plaque in carotid artery. The plaque may partially or fully block the blood flow to the
brain and the probability of cerebrovascular accident (stroke) becomes high. Many
techniques (invasive and non-invasive) are currently in practice to identify the plaque
in carotid artery. Among those, we have selected carotid artery ultrasound imaging
modality for plaque detection, which is a safe and non-invasive diagnosis approach.
The sole objective of this research was to identify the presence of plaque in
carotid artery by utilizing the ultrasound imaging modality. Several techniques have
been proposed to achieve the objective. First and the most important phase of a
computer aided diagnostic system is image segmentation. Accurate segmentation of
the ultrasound imaging is challenging, because of its low quality, presence of noise
and wave interferences. We have proposed five techniques which have successfully
segmented the carotid artery ultrasound images. The major features and results of
each technique are briefly described below.
8.1 Modified Spatial Fuzzy C-means and Ensemble Clustering
A new clustering algorithm named sFCMM has been proposed for segmentation of
carotid artery ultrasound images. The proposed sFCMM overcomes the equal
weightage problem of spatial sFCM algorithm. In addition to this, ensemble clustering
of majority voting has also investigated. The proposed scheme utilized hybrid feature
including GLCM, 2D-CWT and MGH. Most important features are selected by GA.
The main objective of features optimization is to reduce feature vector dimensionality
which results in low computational cost and higher accuracy. Visual and quantitative
results of the proposed clustering algorithm have been compared with the state of the
art clustering techniques such as FCM, sFCM, K-means, SOM, and sFCMLSM. High
quality clustering has been achieved using ensemble clustering of majority voting
scheme. It can be observed that the ROI is efficiently separated from background
Chapter 8: Conclusions and Future Directions
127
tissues by the proposed segmentation technique. IMT values are measured from
segmented carotid artery ultrasound images and given as input to MLBPNN for
classification. MLBPNN offers an enhanced classification accuracy of 98.40% based
on the proposed segmentation technique. However, the proposed sFCMM approach
utilizes median filter as a pre-processing step and it may smoothes the important
image details.
8.2 Robust Information Gain Based FCM Clustering
A new robust segmentation technique called IGFCM approach has been proposed.
The proposed algorithm incorporates the concept of information gain into
conventional fuzzy framework in order to overcome the shortcomings of conventional
FCM algorithm. The proposed IGFCM algorithm has been applied to segment
different modality images like synthetic, CT liver, and daylight, results are compared
with the conventional FCM, sFCM, sFCMM, and FLICM techniques. Gaussian noise
of various intensities has been added to the images in order to check the robustness of
the proposed IGFCM algorithm. Visually and quantitatively the superiority of the
proposed IGFCM segmentation algorithm has been verified. PNN classifier is
employed to separate the normal and abnormal subjects. More than 98% classification
accuracy has been achieved by PNN using the proposed scheme segmented images.
Furthermore, effects of segmentation at classification have also been investigated. It
has been observed that the classification accuracy has been increased by 4.31% using
the proposed IGFCM segmentation. However, the proposed IGFCM did not utilizes
the spatial information of a pixel thus at very high noise level it may produces
misleading results.
8.3 Robust Segmentation of Carotid Artery Ultrasound Images using
Neuro Fuzzy and Expectation Maximization
A new robust segmentation approach namely RSC-US has been proposed. The
proposed approach employed neuro fuzzy classifier, EM, and GA for segmentation of
the carotid artery ultrasound images. By utilizing the GA based selected features;
NFC has been employed to generate FIS, hence used for segmentation. The results of
the proposed technique have been compared visually and quantitatively with FCM, K-
means, and sFCMLSM approaches on noisy and noise free images. The proposed
RSC-US shows outstanding segmentation results compared to other state of the art
Chapter 8: Conclusions and Future Directions
128
techniques. SVM classifier is employed to distinguish normal and abnormal subjects.
High classification accuracy of 98.84% is achieved by SVM classification using the
proposed RSC-US segmentation approach. The RSC-US is semi supervised approach
and did not utilizes the spatial information of pixel which plays a vital role in
segmentation.
8.4 Robust Fuzzy RBF Network Based Segmentation
A new robust segmentation technique, which integrates fuzzy RBF network and the
robust FCM segmentation techniques have been proposed. In this approach, a new
smoothing which reduces the effect of noise without applying any noise removal
technique has been introduced. The proposed RFRBFN approach is applied to the
different imaging modalities and different noise types, and results are compared with
FCM, RBF and fuzzy RBFN approaches. In order to check the robustness, the images
were degraded by Gaussian, Rician as well as the impulse noises. The proposed
technique outperforms the other state of the art techniques for segmentation of noisy
images as well. Medical decision making system based on MLBPNN has been
designed for plaque identification in carotid artery; hence classification accuracy more
than 98% has been achieved. However, the RFRBFN approach is some
computationally overhead due to the incorporation of Lagrange function and spatial
information.
8.5 Automatic Active Contour Based Segmentation of Carotid Artery
Ultrasound Images
A new automatic active contour based approach for carotid artery ultrasound image
segmentation has been proposed. Using manual initialization, a window for snake
initialization has been set empirically and required to be placed at right location.
However, improper snake initialization may produce misleading results. Performance
comparison of the proposed approach has been carried out with the manual
initialization of snakes. The proposed approach of an automatic active contour based
segmentation shows the effectiveness of the proposed scheme. Furthermore, the
segmented images are classified into normal and abnormal subjects. High
classification accuracy has been achieved by SVM classifier using the proposed
segmentation scheme. However to obtained accurate segmentation of carotid artery

Chapter 8: Conclusions and Future Directions
129
ultrasound images, selection of control points is very sensitive and it expects an
expertise from the user to alignment images.
8.6 IMT Measurements and Medical Decision Systems
IMT values have been measured from carotid artery ultrasound images segmented by
our proposed segmentation techniques. Based on IMT values, it can decide whether
the carotid artery is normal or abnormal. IMT measurements are highly depending on
the segmentation quality. The results of post-processing steps are dependent on
segmentation. It is mandatory that the images are segmented with high accuracy so
that medical decision system may be proposed for carotid artery plaque identification.
Classification of the segmented carotid artery is vital because based on its results
patient’s rehabilitation process may start. Different features from measured IMT
values were extracted and given as input to the decision making system for
identification of normal and abnormal subjects. In this thesis, various decision system
such as, SVM, MLBPNN, KNN, and PNN to segregate normal and abnormal
subjects. Among those, an enhanced classification accuracy 98.84% with SVM
classifier using RBF kernel function. It has been observed that classification results
based on the proposed segmentation technique are superior as compared to other state
of the art techniques. Moreover, the effects of segmentation at classification have also
been investigated. The proposed segmentation techniques improve the classification
accuracy by 4%. Keeping in view the segmentation quality and decision system
accuracy, the decision system can be used in health care centers to diagnose the
presence of a plaque in carotid artery. In Pakistan, where there is lack of medical
facility, especially in rural areas, the proposed system can be implemented
successfully for initial screening of carotid artery plaque patients. The system can also
be used as a secondary observer to the medical experts for plaque diagnosis in carotid
artery.
8.7 Future Recommendations
In order to obtain robust and accurate segmentation, the proposed segmentation
techniques can also be extended. We have worked on ultrasound imaging modality
and the techniques can be extended for other imaging modalities such as CT scan and
MRI. Quality of segmentation and consequently high classification results are
expected by employing computational intelligence techniques. A medical decision

Chapter 8: Conclusions and Future Directions
130
system can be designed for diagnosis based on other imaging modalities. Such
systems might be useful for initial screening especially for those patients who are
living in remote areas of Pakistan.

131
References
[1] NHLBI, U.S. Department of Health & Human Services, "Explore Carotid
Artery Disease ", Internet: http://www.nhlbi.nih.gov/health/health-
topics/topics/catd/., May. 15, 2013,[Feb. 14, 2014].
[2] J. Stein "Stroke: Essentials of Physical Medicine and Rehabilitation: National
Institute of Health", Internet:
http://www.nlm.nih.gov/medlineplus/ency/article/000726.htm , Oct, 20. 2012,
[Feb. 14, 2014].
[3] S. L. Murphy, J. Xu, and K. D. Kochanek, "National Vital Statistics Report,"
National Center for Health Statistics, Hyattsville 2013.
[4] National Stroke Association, "Types of Stroke", Internet:
http://www.stroke.org/site/PageServer?pagename=type, Oct 12, 2013, [Feb.
14, 2014].
[5] Mayo Clinic, "Stroke: Symptoms", Internet:
http://www.mayoclinic.com/health/stroke/DS00150/DSECTION=symptoms.
Sep 21, 2013, [Feb 14, 2014].
[6] J. Tan, D. Lim Joon, G. Fitt, M. Wada, M. Lim Joon, A. Mercuri, M. Marr, M.
Chao, and V. Khoo, "The utility of multimodality imaging with CT and MRI
in defining rectal tumour volumes for radiotherapy treatment planning: a pilot
study," Journal of Medical Imaging and Radiation Oncology, vol. 54, pp. 562-
568, 2010.
[7] S. M. Smith, P. T. Fox, K. L. Miller, D. C. Glahn, P. M. Fox, C. E. Mackay,
N. Filippini, K. E. Watkins, R. Toro, A. R. Laird, and C. F. Beckmann,
"Correspondence of the brain's functional architecture during activation and
rest," Proceedings of the National Academy of Sciences, vol. 106, pp. 13040-
45, 2009.
[8] N. Ayache, P. Cinquin, I. Cohen, L. Cohen, F. Leitner, and O. Monga.,
"Segmentation of complex three dimensional medical objects: a challenge and
a requirement for computer-assisted surgery planning and performance,"
Computer integrated surgery: technology and clinical applications, pp. 59-74,
1996.
[9] N. Sharma and L. M. Aggarwal, "Automated medical image segmentation
techniques," Journal of Medical Physics / Association of Medical Physicists of
India, vol. 35, pp. 3-14, 2010.
132
[10] K.-S. Chuang, H.-L. Tzeng, S. Chen, J. Wu, and T.-J. Chen, "Fuzzy c-means
clustering with spatial information for image segmentation," Computerized
Medical Imaging and Graphics, vol. 30, pp. 9-15, 2006.
[11] A. Chaudhry, M. Hassan, A. Khan, J. Y. Kim, and T. A. Tuan, "Image
clustering using improved spatial fuzzy C-means," in Proceedings of the 6th
International Conference on Ubiquitous Information Management and
Communication. Kuala Lumpur, Malaysia: ACM, 2012.
[12] Z. Iscan, A. Yüksel, Z. Dokur, M. Korürek, and T. Ölmez, "Medical image
segmentation with transform and moment based features and incremental
supervised neural network," Digital Signal Processing, vol. 19, pp. 890-901,
2009.
[13] M. Vasantha, Dr. V. Sunniah Bharathi, and T. Dhamodharan, "Medical Image
Features, Extraction, Selection and Classification," International Journal of
Engineering Sciences and Technology, vol. 2, pp. 2071-2076, 2010.
[14] R. Rocha, A. l. Campilho, J. Silva, E. Azevedo, and R. Santos, "Segmentation
of ultrasound images of the carotid using RANSAC and cubic splines,"
Computer Methods and Programs in Biomedicine, vol. 101, pp. 94-106, 2011.
[15] B. N. Li, C. K. Chui, S. Chang, and S. H. Ong, "Integrating spatial fuzzy
clustering with level set methods for automated medical image segmentation,"
Computers in Biology and Medicine, vol. 41, pp. 1-10, 2011.
[16] J. Yu and J. Tan, "Object density-based image segmentation and its
applications in biomedical image analysis," Computer Methods and Programs
in Biomedicine, vol. 96, pp. 193-204, 2009.
[17] F. Mao, J. Gill, D. Downey, and A. Fenster, "Segmentation of carotid artery in
ultrasound images," in Proceedings of the Proceedings of the 22nd Annual
International Conference of the IEEE Engineering in Medicine and Biology
Society, 2000, pp. 1734-1737
[18] P. Abolmaesumi, M. R. Sirouspour, and S. E. Salcudean, "Real-time
extraction of carotid artery contours from ultrasound images," in Proceedings
of the 13th IEEE Symposium on Computer-Based Medical Systems, CBMS. ,
2000, pp. 181-186.
[19] D.-C. Cheng, A. Schmidt-Trucksass, K.-s. Cheng, and H. Burkhardt, "Using
snakes to detect the intimal and adventitial layers of the common carotid artery
wall in sonographic images," Computer Methods and Programs in
Biomedicine, vol. 67, pp. 27-37, 2002.

133
[20] S. Hovda, H. Rue, and B. Olstad, "New Doppler-based imaging method in
echocardiography with applications in blood/tissue segmentation," Computer
Methods and Programs in Biomedicine, vol. 96, pp. 12-24, 2009.
[21] A. K. Hamou and M. R. El-Sakka, "A novel segmentation technique for
carotid ultrasound images," in Proceedings of the IEEE International
Conference on Acoustics, Speech, and Signal Processing, (ICASSP '04). 2004,
pp. 521-524.
[22] A. R. Abdel-Dayem and M. R. Ei-Sakka, "A novel morphological-based
carotid artery contour extraction," in Proceedings of the Canadian Conference
on Electrical and Computer Engineering 2004, pp. 1873-1876.
[23] L. Vincent and P. Soille, "Watersheds in digital spaces: an efficient algorithm
based on immersion simulations," IEEE Transactions on Pattern Analysis and
Machine Intelligence, vol. 13, pp. 583-598, 1991.
[24] A. R. Abdel-Dayem, M. R. El-Sakka, and A. Fenster, "Watershed
segmentation for carotid artery ultrasound images," in Proceedings of the The
3rd ACS/IEEE International Conference on Computer Systems and
Applications, 2005, pp. 131.
[25] M. Kamel, A. Campilho, A. R. Abdel-Dayem, and M. R. El-Sakka Senior
Member Ieee, "Carotid Artery Ultrasound Image Segmentation Using Fuzzy
Region Growing," in Image Analysis and Recognition, vol. 3656, Lecture
Notes in Computer Science: Springer Berlin / Heidelberg, 2005, pp. 869-878.
[26] C. P. Loizou, C. S. Pattichis, M. Pantziaris, and A. Nicolaides, "An Integrated
System for the Segmentation of Atherosclerotic Carotid Plaque," IEEE
Transactions on Information Technology in Biomedicine, vol. 11, pp. 661-
667, 2007.
[27] M. Bastida-Jumilla, R. Menchon-Lara, J. Morales-Sanchez, R. Verdu-
Monedero, J. Larrey-Ruiz, and J. L. Sancho-Gomez, "Segmentation of the
Common Carotid Artery Walls Based on a Frequency Implementation of
Active Contours," Journal of Digital Imaging, vol. 26, pp. 129-139, 2013.
[28] A. Chaudhry, M. Hassan, A. Khan, and J. Kim, "Automatic Active Contour-
Based Segmentation and Classification of Carotid Artery Ultrasound Images,"
Journal of Digital Imaging, vol. 26, pp. 1071-81, 2013.
[29] S. Golemati, J. Stoitsis, E. Sifakis, T. Balkizas, and K. S. Nikita, "Using the
Hough transform to segment ultrasound images of longitudinal and transverse
sections of the carotid artery," Ultrasound in Medicine & Biology, vol. 33, pp.
1918-1932, 2007.
134
[30] A. Abdel Dayem and M. El Sakka, "Carotid Artery Contour Extraction from
Ultrasound Images Using Multi-Resolution-Analysis and Watershed
Segmentation Scheme," International journal on Graphics Vision and Image
processing, vol. 5, pp. 1-10, 2010.
[31] L. Quan, I. Wendelhag, J. Wikstrand, and T. Gustavsson, "A multiscale
dynamic programming procedure for boundary detection in ultrasonic artery
images," Medical Imaging, IEEE Transactions on, vol. 19, pp. 127-142, 2000.
[32] N. Santhiyakumari, P. Rajendran, and M. Madheswaran, "Medical Decision-
Making System of Ultrasound Carotid Artery Intima–Media Thickness Using
Neural Networks," Journal of Digital Imaging, vol. 24, pp. 1112-1125, 2011.
[33] J. Bezdek, L. Hall, and L. Clarke, "Review of MR image segmentation using
pattern recognition," Med. Phys., vol. 20, pp. 1033-48, 1993.
[34] D. L. Pham, "Spatial Models for Fuzzy Clustering," Computer Vision and
Image Understanding, vol. 84, pp. 285-297, 2001.
[35] N. S. Iyer, A. Kandel, and M. Schneider, "Feature-based fuzzy classification
for interpretation of mammograms," Fuzzy Sets and Systems, vol. 114, pp.
271-280, 2000.
[36] M. Hassan, A. Chaudhry, A. Khan, and M. A. Iftikhar, "Robust information
gain based fuzzy c-means clustering and classification of carotid artery
ultrasound images," Computer Methods and Programs in Biomedicine, vol.
113, pp. 593-609, 2013.
[37] P. E. Andries, Computational Intelligence: An Introduction, 2nd ed: Wiley
Publishing, 2007.
[38] S. K. Pal and S. Mitra, "Multilayer perceptron, fuzzy sets, and classification,"
IEEE Transactions on Neural Networks, vol. 3, pp. 683-697, 1992.
[39] L. G. Shaprio and G. C. Stockman, Computer Vision. Upper Saddle River, NJ:
Printice Hall, 2001.
[40] Kohonen T, Self Organizing and Associative Memory. New York, USA:
Springer Verlag 1989.
[41] M. Lorenz, H. Markus, M. Bots, M. Rosvall, and S. M., "Prediction of clinical
cardiovascular events with carotid intima-media thickness: a systematic
review and metaanalysis," Circulation, vol. 115, pp. 459-67, 2007.
[42] Y.-F. Juan, T. Chen, T.-H. Chao, and C.-C. Huang, "The investigation of the
relationship between carotid intima-media thickness and vascular compliance
135
in patients with coronary artery disease," Biomedical Engineering:
Applications, Basis and Communications, vol. 16, pp. 37-42, 2004.
[43] M. A. Mansour and N. Labropoulos, Vascular Diagnosis. Philadelphia,
Pennsylvania: Elsevier, 2005.
[44] C. Sass, B. Herbeth, O. Chapet, G. Siest, S. Visvikis, and F. Zannad, "Intima-
media thickness and diameter of carotid and femoral arteries in children,
adolescents and adults from the Stanislas cohort: effect of age, sex,
anthropometry and blood pressure," J Hypertens., vol. 16, pp. 1593-602, 1998.
[45] R. Salonen and J. Salonen, "Progression of carotid atherosclerosis and its
determinants: A population-based ultrasonography study," Atherosclerosis,
vol. 18, pp. 33-40, 1990.
[46] G. Howard, A. Sharrett, G. Heiss, G. Evans, L. Chambless, Riley WA, and B.
GL, "Carotid artery intimalmedial thickness distribution in general populations
as evaluated by B-mode ultrasound," Storke, vol. 24, pp. 1297-304, 1993.
[47] J. Stevens, H. Tyroler, J. Cai, C. Paton, A. Folsom, G. Tell, P. Schreiner, and
L. Chambless, "Body weight changes and carotid artery wall thickness. The
Atherosclerosis Risk in Communities Study," Am. J. Epidemiol, vol. 147, pp.
563-73, 1998.
[48] M. Muiesan, G. Pasini, M. Salvetti, S. Calebich, R. Zulli, M. Castellano, D.
Rizzoni, G. Bettoni, A. Cinelli, E. Porteri, V. Corsetti, and E. Agabiti-Rosei,
"Cardiac and vascular structural changes. Prevalence and relation to
ambulatory blood pressure in a middle-aged general population in northern
Italy: the Vobarno Study.," Hypertesion, vol. 27, pp. 1046-52, 1996.
[49] A. Visona, L. Lusiani, A. Bonanome, G. Beltramello, L. Confortin, B.
Papesso, F. Costa, and A. Pagnan, "Wall thickening of common carotid
arteries in patients affected by noninsulin-dependent diabetes mellitus:
relationship to microvascular complications," Angiology, vol. 46, pp. 793-9,
1995.
[50] L. Wagenknecht, R. J. D'Agostino, P. Savage, D. O'Leary, M. Saad, and S.
Haffner, "Duration of diabetes and carotid wall thickness. The Insulin
Resistance Atherosclerosis Study (IRAS)." Storke, vol. 28, pp. 999-1005,
1997.
[51] C. I. Christodoulou, C. S. Pattichis, M. Pantziaris, and A. Nicolaides,
"Texture-based classification of atherosclerotic carotid plaques," IEEE
Transactions on Medical Imaging, vol. 22, pp. 902-912, 2003.

136
[52] C. I. Christodoulou, C. S. Pattichis, E. Kyriacou, and A. Nicolaides, "Image
Retrieval and Classification of Carotid Plaque Ultrasound Images," Journal of
Cardiovascular Imaging, vol. 2, pp. 18-28, 2010.
[53] F. Latifoglu, K. Polat, S. Kara, and S. Gunes, "Medical diagnosis of
atherosclerosis from Carotid Artery Doppler Signals using principal
component analysis (PCA), k-NN based weighting pre-processing and
Artificial Immune Recognition System (AIRS)," Journal of Biomedical
Informatics, vol. 41, pp. 15-23, 2008.
[54] E. C. Kyriacou, S. Petroudi, C. S. Pattichis, M. S. Pattichis, M. Griffin, S.
Kakkos, and A. Nicolaides, "Prediction of High-Risk Asymptomatic Carotid
Plaques Based on Ultrasonic Image Features," IEEE Transactions on
Information Technology in Biomedicine, vol. 16, pp. 966-973, 2012.
[55] N. Tsiaparas, S. Golemati, I. Andreadis, J. S. Stoitsis, I. Valavanis, and K. S.
Nikita, "Comparison of Multiresolution Features for Texture Classification of
Carotid Atherosclerosis From B-Mode Ultrasound," Trans. Info. Tech.
Biomed., vol. 15, pp. 130-137, 2011.
[56] S. Petrović, "A Comparison Between the Silhouette Index and the Davies-
Bouldin Index in Labelling IDS Clusters," in Proceedings of the 11th Nordic
Workshop on Secure IT-systems, NORDSEC Linkoping, Sweden, 2006, pp.
53-56.
[57] M. Wigness, "Evaluating Cluster Quality For Visual Data," in Department of
Computer Science, vol. MSCS. Fort Collins, Colorado: Colorado State
University, 2013.
[58] D. L. Davies and D. W. Bouldin, "A Cluster Separation Measure," IEEE
Transaction on Pattern Analysis and Machine Intelligence, vol. 1, pp. 224-227,
1979.
[59] M. Hassan, A. Chaudhry, A. Khan, and J. Y. Kim, "Carotid artery image
segmentation using modified spatial fuzzy c-means and ensemble clustering,"
Computer Methods and Programs in Biomedicine, vol. 108, pp. 1261-76,
2012.
[60] J. C. Bezdek "Cluster Validity with Fuzzy Sets," Journal of Cybernetics, vol.
3, pp. 58 - 73, 1973.
[61] Bazdek JC., "Mathematical models for systematic and taxonomy," in
Proceedings of the International Conference on Numerical Taxonomy, San
Frabcisco, 1975, pp. 143-66.
[62] D. G. Altman, "Statistics Notes: Diagnostic tests 2: predictive values," BMJ,
vol. 309, pp. 102, 1994.
137
[63] G. Gonzalez and E. Woods, Digital Image Processing, Third Edition ed:
Prentice Hall, 2008.
[64] T. Huang, G. Yang, and G. Tang, "A fast two-dimensional median filtering
algorithm," IEEE Transactions on Acoustics, Speech and Signal Processing,
vol. 27, pp. 13-18, 1979.
[65] T. Loupas, W. N. McDicken, and P. L. Allan, "An adaptive weighted median
filter for speckle suppression in medical ultrasonic images," IEEE
Transactions on Circuits and Systems, vol. 36, pp. 129-135, 1989.
[66] A. Toprak and İ. Güler, "Suppression of Impulse Noise in Medical Images
with the Use of Fuzzy Adaptive Median Filter," Journal of Medical Systems,
vol. 30, pp. 465-471, 2006.
[67] C. Tomasi and R. Manduchi, "Bilateral filtering for gray and color images," in
Proceedings of the Sixth International Conference on Computer Vision,
Bombay, India, 1998, pp. 839-846.
[68] H. S. Sheshadri and A. Kandaswamy, "Experimental investigation on breast
tissue classification based on statistical feature extraction of mammograms,"
Computerized Medical Imaging and Graphics, vol. 31, pp. 46-48, 2007.
[69] S. Ao, B. B. Rieger, and M. Amouzegar, Machine Learning and Systems
Engineering, vol. 68. California, USA: Springer, 2010.
[70] R. Polikar, "Fundamental concepts & an overview of the wavelet theory:
Tutorial, http://users.rowan.edu/~polikar/WAVELETS/WTpart1.html," 1996.
[71] J. Ma, Z. Wang, M. Vo, and L. Luu, "Parameter discretization in two-
dimensional continuous wavelet transform for fast fringe pattern analysis,"
Optics Info Base, pp. 6399-63408, 2011.
[72] G. Holmes, A. Donkin, and I. H. Witten, "WEKA: a machine learning
workbench," in Proceedings of the Proceedings of the 1994 Second Australian
and New Zealand Conference on Intelligent Information Systems. , 1994, pp.
357-361.
[73] M. Hassan, A. Chaudhry, A. Khan, and S. Riaz, "An Optimized Fuzzy C-
Means Clustering with Spatial Information for Carotid Artery Image
Segmentation,," in Proceedings of the IBCAST, Islamabad, 2011.
[74] R. Polikar, "Ensemble based systems in decision making," IEEE Circuits and
Systems Magazine, vol. 6, pp. 21-45, 2006.
138
[75] M. S. El Sherif and M. S. Abdel Samee, "Pattern recognition using neural
networks that learn from fuzzy rules," in Proceedings of the Proceedings of the
37th Midwest Symposium on Circuits and Systems., 1994, pp. 599-602.
[76] L. Rudasi and S. A. Zahorian, "Pattern recognition using neural networks with
a binary partitioning approach," in Proceedings of the IEEE Proceedings of
Southeastcon, Williamsburg, VA, 1991, pp. 726-730.
[77] H. Takahashi, N. Pecharanin, Y. Akima, and M. Sone, "The reliability of
neural networks on pattern recognition," in Proceedings of the IEEE World
Congress on Computational Intelligence.,, 1994, pp. 3067-3070.
[78] D. Greenhil and E. R. Dvvies, "Relative effectiveness of neural networks for
image noise suppression," in Proceedings of the Pattern Recognition in
Practice, 1994, pp. 367-378.
[79] T. M. Jochem, D. A. Pomerleau, and C. E. Thorpe, "Vision-based neural
network road and intersection detection and traversal," in Proceedings of the
IEEE/RSJ International Conference on Intelligent Robots and Systems 95
Human Robot Interaction and Cooperative Robots, , Pittsburgh, PA, 1995, pp.
344-349.
[80] D. Svozil, V. r. Kvasnicka, and J. Ã. Pospichal, "Introduction to multi-layer
feed-forward neural networks," Chemometrics and Intelligent Laboratory
Systems, vol. 39, pp. 43-62, 1997.
[81] U. Anders and O. Korn, "Model selection in neural networks," Neural
Networks, vol. 12, pp. 309-323, 1999.
[82] C. E. Shanoon, "A Mathematical Theory of Communication," Bell System
Technical Journal vol. 27, pp. 379-423, 1948.
[83] M. Filippo, Z. Guang, and S. S. Jasjit, "Review: A state of the art review on
intima-media thickness (IMT) measurement and wall segmentation techniques
for carotid ultrasound," Comput. Methods Prog. Biomed., vol. 100, pp. 201-
221, 2012.
[84] M. Filippo, M. M. Kristen, S. Luca, U. R. Acharya, L. Giuseppe, Z. Guang, H.
Sin Yee Stella, T. A. Anil, C. H. Suzanne, N. Andrew, and S. S. Jasjit,
"Ultrasound IMT measurement on a multi-ethnic and multi-institutional
database: Our review and experience using four fully automated and one semi-
automated methods," Comput. Methods Prog. Biomed., vol. 108, pp. 946-960,
2012.
[85] A. Chaudhry, M. Hassan, A. Khan, J. Kim, and T. Tuan, "Automatic
Segmentation and Decision Making of Carotid Artery Ultrasound Images," in
139
Intelligent Autonomous Systems, vol. 194, Advances in Intelligent Systems
and Computing: Springer Berlin Heidelberg, 2012, pp. 185-196.
[86] F. S. Donald, "Probabilistic neural networks," Neural Netw., vol. 3, pp. 109-
118, 1990.
[87] S. H. Park, J. M. Goo, and C.-H. Jo, "Receiver Operating Characteristic
(ROC) Curve: Practical Review for Radiologists," Korean Journal of
Radiology, vol. 5, pp. 11-18, 2004.
[88] R. Gallea, E. Ardizzone, R. Pirrone, and O. Gambino, "Three-dimensional
Fuzzy Kernel Regression framework for registration of medical volume data,"
Pattern Recognition, vol. 46, pp. 3000-3016, 2013.
[89] S. Borman, "The Expectation Maximization Algorithm – A Short Tutorial,":
Internet: http://www.seanborman.com/publications/EM_algorithm.pdf., Jan. 9,
2009, [Dec 20, 2013].
[90] M. S. Mahmoud and H. M. Khalid, "Expectation maximization approach to
data-based fault diagnostics," Information Sciences, vol. 235, pp. 80-96, 2013.
[91] S. Mitra and J. Basak, "FRBF: A Fuzzy Radial Basis Function Network,"
Neural Computing & Applications, vol. 10, pp. 244-252, 2001.
[92] S. Ovchinnikov, "Similarity relations, fuzzy partitions and fuzzy ordering,"
Fuzzy Sets and Systems, vol. 40, pp. 107-126, 1991.
[93] L. A. Zadeh, "Fuzzy sets and their application to pattern classification and
clustering analysis," in Fuzzy sets, fuzzy logic, and fuzzy systems: World
Scientific Publishing Co., Inc., 1996, pp. 355-393.
[94] N. Cristianini and J. S. Taylor, An Introduction to Support Vector Machines
and other kernel-based learning methods: Cambridge University Press, 2000.
[95] P. Minghao, L. Heon Gyu, P. Couchol, and R. Keun Ho, "A data mining
approach for dyslipidemia disease prediction using carotid arterial feature
vectors," in Proceedings of the IEEE, 2nd International Conference on
Computer Engineering and Technology (ICCET), Chengdu, 2010, pp. 171-
175.
[96] C. Chih-Chung and L. Chih-Jen, "LIBSVM: A library for support vector
machines," ACM Trans. Intell. Syst. Technol., vol. 2, pp. 1-27, 2011.
[97] K. B. Zayanthi and R. S. D. W. Banu, "Carotid Artery Boundary Extraction
Using Segmentation Techniques: A Comparative Study," in Proceedings of
140
the Sixth International Conference on Information Technology: New
Generations Las Vegas, NV, 2009, pp. 1290-1295.
[98] R. K. S. Kwan, A. C. Evans, and G. B. Pike, "An Extensible MRI Simulator
for Post-Processing Evaluation," in Proceedings of the Visualization in
Biomedical Computing, Lecture Notes in Computer Science, Hamburg,
Germany, 1996, pp. 135-140.
[99] W. M. Rand, "Objective criteria for the evaluation of clustering methods,"
Journal of the American Statistical association, vol. 66, pp. 846-850, 1971.
[100] M. Aksam Iftikhar, A. Jalil, S. Rathore, and M. Hussain, "Robust brain MRI
denoising and segmentation using enhanced non-local means algorithm,"
International Journal of Imaging Systems and Technology, vol. 24, pp. 52-66,
2014.
[101] D. L. Pham, C. Xu, and J. L. Prince, "A Survey of Current Methods in
Medical Image Segmentation," in Annual Review of Biomedical Engineering,
vol. 2, 2000, pp. 315-338.
[102] N. Otsu, "A Threshold Selection Method from Gray-Level Histograms," IEEE
Transactions on Systems, Man., and Cybernetics., vol. 9, pp. 62-66, 1979.
[103] M. Kass, A. Witkin, and D. Terzopoulos, "Snakes: Active contour models,"
International Journal of Computer Vision, vol. 1, pp. 321-331, 1988.
[104] J. Liang, T. McInerny, and D. Terzopoulos, "United Snakes," in Proceedings
of the IEEE, Int. Conf. Computer Vision, 1999, pp. 933-940.
[105] P. Brigger, J. Hoeg, and M. Unser, "B-spline snakes: a flexible tool for
parametric contour detection," IEEE Transaction on Image Processing, vol. 9,
pp. 1484-1496, 2000.
[106] L. Weruaga, R. Verdu, and J. Morales, "Frequency domain formulation of
active parametric deformable models," IEEE Transaction on Pattern Analysis
and Machine Intelligence, vol. 26, pp. 1568-1578, 2004.
[107] M. Unser, Splines: "A perfect fit for medical imaging, Progress in Biomedical
Optics and Imaging", 2002.
[108] S. K. Pal and P. Mitra, Pattern Recognition Algorithms for Data Mining:
Scalability, Knowledge Discovery, and Soft Granular Computing: Chapma,
Hall, Ltd., 2004.

141
[109] D. F. Specht, "Probabilistic neural networks and the polynomial Adaline as
complementary techniques for classification," IEEE Transaction on Neural
Networks, vol. 1, pp. 111-121, 1990.