robust method for detecting convergent shifts in
TRANSCRIPT

Robust Method for Detecting Convergent Shifts inEvolutionary Rates
Raghavendran Partha12 Amanda Kowalczyk12 Nathan L Clark12 and Maria Chikina12
1Department of Computational and Systems Biology University of Pittsburgh Pittsburgh PA2Joint Carnegie Mellon University-University of Pittsburgh PhD Program in Computational Biology Pittsburgh PA
Corresponding author E-mail mchikinapittedu
Associate editor Koichiro Tamura
Abstract
Identifying genomic elements underlying phenotypic adaptations is an important problem in evolutionary biologyComparative analyses learning from convergent evolution of traits are gaining momentum in accurately detectingsuch elements We previously developed a method for predicting phenotypic associations of genetic elements by con-trasting patterns of sequence evolution in species showing a phenotype with those that do not Using this method wesuccessfully demonstrated convergent evolutionary rate shifts in genetic elements associated with two phenotypicadaptations namely the independent subterranean and marine transitions of terrestrial mammalian lineages Ouroriginal method calculates gene-specific rates of evolution on branches of phylogenetic trees using linear regressionThese rates represent the extent of sequence divergence on a branch after removing the expected divergence on thebranch due to background factors The rates calculated using this regression analysis exhibit an important statisticallimitation namely heteroscedasticity We observe that the rates on branches that are longer on average show highervariance and describe how this problem adversely affects the confidence with which we can make inferences about rateshifts Using a combination of data transformation and weighted regression we have developed an updated method thatcorrects this heteroscedasticity in the rates We additionally illustrate the improved performance offered by the updatedmethod at robust detection of convergent rate shifts in phylogenetic trees of protein-coding genes across mammals aswell as using simulated tree data sets Overall we present an important extension to our evolutionary-rates-basedmethod that performs more robustly and consistently at detecting convergent shifts in evolutionary rates
Key words convergent evolution evolutionary rates molecular evolution
IntroductionUnderstanding the relationship between phenotype and ge-notype is a fundamental question in biological research Amechanistic characterization of this relationship hinges onour ability to define how specific genetic elements contributeto biological processes at the molecular cellular and organ-ismal level High-throughput sequencing has enabled newexperimental approaches that have uncovered a wealth ofgenetic elements with putative regulatory roles across tissues(ENCODE Project Consortium 2012 Andersson et al 2014Romanoski et al 2015) However identifying the precise bio-logical functions of these elements remains a challenge Evenbeyond noncoding elements the precise biological roles ofmany protein-coding genes are still poorly understood andmany genes with statistical disease associations still lack amechanistic explanation (Pennacchio et al 2013 Radivojacet al 2013 Sa et al 2013 Shlyueva et al 2014) While exper-imental validation for functional annotation remains chal-lenging there is considerable interest in developing newtools that can use existing data resources to further elucidatethe function of genetic elements These approaches have thepotential to improve the diagnosis of disease susceptibility
and the development of therapeutic interventions (Manolioet al 2009 Esteller 2011)
Computational approaches learning from patterns of con-vergent phenotypic evolution across species provide a com-plementary approach to predict genotypendashphenotypeassociations The natural world is replete with examples ofphenotypic convergence ranging from the independent evo-lution of flight in birds and mammals to diving in species thattransitioned from a terrestrial to marine habitat to loss ofcomplex phenotypes such as eyesight in animals colonizingthe subterranean niche Genome-scale studies aimed at iden-tifying the genetic basis of phenotypic convergence take ad-vantage of the growing availability of whole genomesequences for species across several orders alongside the de-velopment of comparative methods to predict orthologoussequences (Eisen 1998 Pellegrini et al 1999 Li et al 2014) Acommon approach in such studies is to identify convergenceat the molecular level including substitutions at specific nu-cleotide or amino acid sites (Zhang and Kumar 1997 Parkeret al 2013 Stern 2013 Foote et al 2015 Thomas and Hahn2015 Zou and Zhang 2015) An alternative strategy to inves-tigate the genetic basis of convergence is to search for
Article
The Author(s) 2019 Published by Oxford University Press on behalf of the Society for Molecular Biology and EvolutionAll rights reserved For permissions please e-mail journalspermissionsoupcom
Mol Biol Evol 36(8)1817ndash1830 doi101093molbevmsz107 Advance Access publication May 11 2019 1817
Dow
nloaded from httpsacadem
icoupcomm
bearticle-abstract36818175488195 by University of U
tah Eccles Health Sciences Library user on 26 August 2019
convergent changes at the level of larger functional regionsrather than specific nucleotide or amino acid sites Sets ofgenes associated with a phenotype can respond to conver-gent changes in the selective pressure on the phenotypethrough nonidentical changes in the same gene and assuch sites-based methods can fail to detect them Theselimitations have encouraged researchers to search for conver-gent shifts in evolutionary rates of individual protein-codinggenes and more recently conserved noncoding elements(Lartillot and Poujol 2011 Hiller et al 2012 Chikina et al2016 Marcovitz et al 2016 Prudent et al 2016) An increasedselective constraint can manifest as a slower evolutionary ratewhereas faster evolutionary rates can result from a release ofconstraint or from adaptation Thus phenotypic associationsfor genetic elements can be predicted from correlatedchanges in their evolutionary rates on phylogenetic branchescorresponding to the phenotypic change Exampleapproaches based on evolutionary rates include theForwardReverse Genomics methods that have identifiedprotein-coding and noncoding genetic elements showingconvergent regression in subterranean mammals and lossof limb-regulatory elements in snake lineages (Hiller et al2012 Marcovitz et al 2016 Prudent et al 2016 Roscito 2017)
We previously developed an evolutionary-rates-basedmethod to identify genetic elements showing convergentshifts in evolutionary rates associated with two distinct phe-notypic transitions (Chikina et al 2016 Partha et al 2017)Our original method calculates gene-specific evolutionaryrates using a linear model and gene-trait associations areinferred using correlations of these rates with the phenotypeof interest A genome-wide scan using this method to findprotein-coding genes associated with the transition to themarine environment identified hundreds of genes thatshowed accelerated evolutionary rates on three marine mam-mal lineages (Chikina et al 2016) These accelerated geneswere significantly enriched for functional roles in pathwaysimportant for the marine adaptation including muscle phys-iology sensory systems and lipid metabolism More recentlyusing our methods we detected an excess of vision-specificgenes as well as enhancers that showed convergent rate ac-celeration on the branches corresponding to four subterra-nean mammals (Partha et al 2017) Genes showingconvergent rate shifts associated with these two phenotypictransitions typically follow one of the following modes ofchange in the selective pressuremdash1) relaxation of constraintand 2) positive selection Marine-accelerated andsubterranean-accelerated genes identified in earlier scanswere further probed using phylogenetic models of selectivepressure to identify the underlying evolutionary process Inboth cases we found an excess of genes under relaxed con-straint as well as a smaller number of genes under positiveselection Overall genome-scale efforts both from our groupand others to find genetic elements responding to convergentchanges in the selective pressures in their environment aregaining momentum in accurately describing precise gen-otypendashphenotype associations
Our original evolutionary-rates method has an importantstatistical limitation namely strong meanndashvariance trends in
the computed evolutionary rates The distributions of branchlengths of gene trees in phylogenetic data sets are influencedby the choice of species divergence from the most recentcommon ancestor and species-specific properties such asgeneration time in addition to gene-specific constraints onthe sequence evolution These factors cause large differencesin the average lengths as well as the variance of the branchlengths across the branches studied In this article we illus-trate how this limitation can adversely impact the confidencewith which we infer phenotypic associations for genetic ele-ments in particular making them sensitive to certain factorsin phylogenomic analyses including choice of taxonomicgroups and average rates of sequence divergence on phylo-genetic branches showing the convergent phenotype Wedemonstrate how introducing long branches in phylogenetictrees via the inclusion of distantly related species impacts thereliable estimation of evolutionary rates using gene treesacross mammals as well using a first-of-its-kind model forsimulating gene trees We present key improvements toour methods that address these limitations and overcomethem The next section New Approaches presents a detailedwalk-through of our current approach to calculate relativeevolutionary rates the illustration of meanndashvariance trends(heteroscedasticity) in these rates and our methodologicalupdates that correct for the problem of heteroscedasticity inthe rates We subsequently demonstrate the improved reli-ability in relative rate calculations using our updated methodand more importantly in the robust detection of convergentrate shifts across a range of evolutionary scenarios in real andsimulated phylogenetic data sets
New Approaches
Original Relative-Evolutionary-Rates Method forPredicting Phenotypic Associations of GeneticElementsOur method infers genetic elements associated with a con-vergent phenotype of interest based on correlations betweenthat phenotype and the rates of evolution of genetic ele-ments As input the phenotype is encoded as a binary traiton a phylogenetic tree and the evolution of each geneticelement is similarly described by phylogenetic trees withthe same fixed topology Figure 1 provides an illustration ofour method capturing the convergent acceleration of theLens Intrinsic membrane 2 protein Lim2 on four subterraneanmammal branches We use maximum likelihood approachesto estimate the amount of sequence divergence of each ge-netic element on branches of the phylogenetic tree (Yang2007) Using each treersquos branch lengths we calculate the av-erage tree across the individual trees reflecting the expectedamount of divergence on each branch Relative evolutionaryrates (RERs) on individual trees are then calculated as theresiduals of a linear regression analysis where the dependentvariable corresponds to the branch lengths of individual treesand the independent variable corresponds to branch lengthsof the average tree Thus the relative rates reflect the gene-specific rate of divergence in each branch factoring out theexpected divergence on the branch due to genome-wide
Partha et al doi101093molbevmsz107 MBE
1818
Dow
nloaded from httpsacadem
icoupcomm
bearticle-abstract36818175488195 by University of U
tah Eccles Health Sciences Library user on 26 August 2019
effects (such as mutation rate and time since speciation) Therelative rates method works downstream of estimating thetrees and hence considers protein-coding gene trees non-coding genetic element trees and simulated gene trees equiv-alently For the sake of simplicity we refer to the relative rateson the branches of each tree as the gene-specific relative ratethe term gene could in principle be referring to a protein-coding gene noncoding genetic element or a simulated treedepending on the data set being studied
Estimating MeanndashVariance Trends in Relative RatesOur original method calculates the gene-specific rates bycorrecting for the genome-wide effects on branch lengthsusing linear regression Consequently the variance of the rel-ative rates on individual branches strongly depends on theaverage length of the branch illustrated here using an exam-ple protein-coding gene tree for MFNG Manic FringeHomolog Drosophila (fig 2A) We see that longer brancheshave relative rates showing a higher variance as can be in-ferred from the increasing spread of the relative rates Thispattern becomes clearer when we plot the genome-wide var-iance in relative rates for branches of different average lengths(fig 2B) In statistical terms the relative rates are heterosce-dastic meaning they show unequal variance across the rangeof values of the dependent variable here the average branchlength The presence of a nonconstant meanndashvariance trendin the residuals stands in violation of one of the assumptionsunderlying linear regression namely homoscedasticity orconstant variance of residuals with respect to the dependentvariable More importantly we suspect that this heterosce-dasticity of the relative rates adversely affects the confidencewith which we can infer rate shifts on specific branches Forexample the presence of a meanndashvariance trend can increasethe likelihood of observing higher relative rates on longerbranches by chance rather than due to gene-specific changesreflecting changes in selective pressure A potential negative
consequence could be a higher proportion of false positiveswhile inferring convergent rate changes on such branches
Updated Method to Calculate Relative RatesIn this study we present an approach relying on a combina-tion of data transformation and weighted linear regression tocalculate relative evolutionary rates that addresses the statis-tical limitations resulting from relative rates calculated usingnaive linear regression The proposed method updates arebased on the ideas presented in Law et al (2014) who devel-oped new linear modeling strategies to handle issues relatedto meanndashvariance relationship of log-counts in RNA-seqreads (Ritchie et al 2015) We represent the branch lengthson individual gene trees as a matrix Y where rows correspondto individual genes (g) and columns to the branches (b) onthese trees We first transform the branch length data using asquare-root transformation (eq 1)
Y0
gb frac14ffiffiffiffiffiffiYgb
p(1)
Following the transformation we perform a weighted re-gression analysis to calculate the relative evolutionary rates asfollows we calculate the average tree and perform a first-passof linear regression using the transformed branch length ma-trix (eqs 3 and 4)
xb frac14 Y0
b (2)
where xb is the branch length for branch b in the average tree
b frac14 XTXeth THORN1XTY
0(3)
R frac14 Y0 Xb (4)
where b are the coefficients of linear regression and R is theresiduals matrix
A B C
FIG 1 Predicting gene-trait associations using relative rates method (A) Lens Intrinsic Membrane 2 (Lim2) protein-coding gene tree Ourphylogenetic data set is comprised of trees constructed from alignments of protein-coding genes in the mammalian genome across 59 speciesof placental mammals (B) Relative rates on branches of phylogenetic trees are calculated using linear regression (C) Gene-trait associations areidentified using correlations of relative rates of the gene with binary trait of interest
Robust Method for Detecting Convergent Shifts in Evolutionary Rates doi101093molbevmsz107 MBE
1819
Dow
nloaded from httpsacadem
icoupcomm
bearticle-abstract36818175488195 by University of U
tah Eccles Health Sciences Library user on 26 August 2019
We then estimate the meanndashvariance trends in the resid-uals of the linear regression analysis by empirically fitting alocally weighted scatterplot smoothing (LOWESS) functioncapturing the relationship between the log of variance of theresiduals and the branch lengths (eq 5)
log R2eth THORN f Y0
(5)
Subsequent to estimating this function we assign eachgene x branch observation a weight W based on the predictedvalue for the branch obtained from the first pass linear re-gression (eq 6)
W frac14 ef Xbeth THORN (6)
For branches that are shorter on average the variance inthe residuals is smaller thus resulting in a higher weight andvice versa Using the computed weights we perform aweighted regression analysis between the individual branchlength (dependent variable) and the average tree (indepen-dent variable) The weighted regression analysis attempts toremove the heteroscedasticity in the residuals by computingthe residuals after minimizing the weighted sum of squarederrors as opposed to the raw sum of squared errors (eqs 7and 8)
bWLS frac14 XTWXeth THORN1XTWY
0(7)
R frac14 Y0 XbWLS (8)
r0gb frac14
rgbffiffiffiffiffiffiffiwgbp
rb (9)
where rb is the SD of the weighted residuals in branch bSubsequent to the weighted regression analysis the
weighted residuals (r0
gb) are estimated by rescaling the regres-sion residuals (rgb) with the weights and the weighted
residuals are additionally standardized to have unit variancewithin every branch across all genes (eq 9) The weightedresiduals (r
0gb) correspond to the weighted relative rate on
branch b for gene g The differences to the relative rate cal-culations introduced by the updated method result inchanges to the scales of the relative rates computedHowever we note that this scale is arbitrary and the down-stream gene-trait correlations for binary traits estimated usinga MannndashWhitney test (see Materials and Methods) dependonly on the ranks of the relative rates of each branch withinany single gene tree Figure 3 shows the workflows for com-puting relative evolutionary rates using the original andupdated method
Results
Improvements to Relative Evolutionary RatesMethods Mitigate Genome-Wide MeanndashVarianceRelationshipOur updated method to calculate relative rates using datatransformation followed by weighted regression producesnearly homoscedastic relative rates that do not show a sig-nificant global meanndashvariance relationship Figure 4A showsthe relative rates computed for the MFNG protein-codinggene tree using the updated method In comparison to theoriginal method based on naive linear regression (fig 2A) weobserve that the updated method produces relative ratesshowing no apparent increase in the variance of relative rateson longer branches of the tree Plotting the genome-widemeanndashvariance trends of the relative rates across all branchesof all gene trees we observe that the relative rates calculatedfrom transformed-weighted residuals show nearly constantvariance across branches of varying lengths (fig 4B) We ad-ditionally checked the meanndashvariance relationships from in-termediate steps in our method that can estimate relativerates corresponding to two method variants which do not
A B
FIG 2 Heteroscedasticity in the relative rates computed using current method (A) Relative rates on branches of Manic Fringe (MFNG) gene treecalculated using original method Points represent branches of the gene tree with relative rates computed on the branches plotted against thegenome-wide average length Heteroscedasticity in the relative rates can be visualized as the increase in the variance of the relative rates withincreasing average branch length (B) Genome-wide meanndashvariance trends in relative rates The logarithm of the relative rate variance within eachbin is shown where branches are binned based on their average lengths across all gene trees Bin ranges were chosen to provide equal numbers ofobservations per bin Higher variance in relative rates is observed with increasing branch lengths and the extent of this heteroscedasticity iscalculated using the ldquor-squaredrdquo of the quadratic model between the variables plotted
Partha et al doi101093molbevmsz107 MBE
1820
Dow
nloaded from httpsacadem
icoupcomm
bearticle-abstract36818175488195 by University of U
tah Eccles Health Sciences Library user on 26 August 2019
implement data transformation (linear-weighted regime) or aweighted regression (square-root unweighted regime) (sup-plementary fig S1 Supplementary Material online) Howeverwe find that the intermediate regimes utilizing only one ofthe method updates (branch length transformation orweighted regression alone) are less effective at eliminatingmeanndashvariance trends A combination of transformationand weighted regression steps works best at producing ho-moscedastic relative rates
Better Robustness to Inclusion of Distantly RelatedSpeciesIn earlier applications of our relative rates method to detectgenetic elements convergently responding in subterraneanmammals and marine mammals respectively we sampledalignments of placental mammal species to construct phylo-genetic trees for each genetic element (Chikina et al 2016Partha et al 2017) These alignments were derived from theplacental mammal subset of the 100-way vertebrate align-ments made publicly available by the UCSC genome browser(Casper et al 2018) In addition to these placental mammalsthe 100-way alignments include four other species of mam-mals three marsupialsmdashOpossum (monDom5) Wallaby
(macEug2) Tasmanian Devil (sarHar1) and onemonotrememdashPlatypus (ornAna1) Despite deep conserva-tion of many genetic elements in these nonplacental mam-mals human-and-mouse centered phylogenomic studiestend to exclude these species due to the introduction oflong branches in the phylogenetic trees (Parker et al 2013Marcovitz et al 2016 Prudent et al 2016) For instance inprevious applications of our relative rates method we delib-erately excluded these nonplacental mammals since they pro-duce wide variations in relative rates due to the introductionof long branches which would adversely affect the confidencewith which we make inferences of convergent rate accelera-tion in species exhibiting a convergent phenotype (Chikinaet al 2016 Partha et al 2017) However scanning for rate-traitassociations across tree data sets with higher numbers ofspecies would allow for more statistical power and hence arelative rates method that can reliably include such distantlyrelated species offers a clear advantage To this end we testedthe robustness of our updated method to the inclusion ofdistantly related species at inferring convergent rate shifts Wechose two phylogenetic data sets 1 Genome-wide protein-coding gene alignments across 59 placental mammal speciesand 2 across 63 mammals including four nonplacentalmammals in addition to the placentals An example
TransformedGene trees
Genetrees
Square-rootTransformation
Linearregression (Unweighted)
gene relativerates
Weight for eachbranch based onmean-variance
Weightedregression (Weighted)
gene relativerates
FIG 3 Workflow for calculating relative evolutionary rates using the updated method Black areas of the workflow represent steps implemented aspart of current relative rates method and bluegrey areas correspond to methodological updates
A B
FIG 4 Updated method to calculate relative rates shows no apparent trends of heteroscedasticity (A) Manic Fringe (MFNG) gene relative ratescalculated using the updated method In comparison to figure 2A we do not observe an increase in the variance of relative rates of branches withincreasing average branch length (B) Genome-wide meanndashvariance trends for relative rates computed using the updated method show constantvariance with increasing branch lengths Contrasting the trends resulting from the application of original (fig 2B) and updated method (fig 4B) weobserve that the updated method produces nearly homoscedastic relative rates The extent of heteroscedasticity computed as the ldquor-squaredrdquo ofthe quadratic model between the variables plotted is nearly 100-fold lower with the updated method compared with original method
Robust Method for Detecting Convergent Shifts in Evolutionary Rates doi101093molbevmsz107 MBE
1821
Dow
nloaded from httpsacadem
icoupcomm
bearticle-abstract36818175488195 by University of U
tah Eccles Health Sciences Library user on 26 August 2019
demonstration of how our current method to calculate rel-ative rates is sensitive to the inclusion of nonplacental mam-mals is illustrated in figure 5A Using the Peropsin (RRH) genefor illustrative purposes we show that the ranks of relativerates computed using the current method considerably varyupon the inclusion of nonplacental mammals These changesin ranks are observed across many branches on the gene treeincluding one of the four subterranean branches (Capegolden mole) In comparison the updated method displaysa stronger concordance in the ranks of the computed relativerates (fig 5A) Consequently the subterranean accelerationscores for RRH computed using the updated method aremore stable with the inclusion of nonplacental mammals(table 1)
We also performed a larger scale benchmarking of therobustness of our methods to the inclusion of nonplacentalmammals across 55 genes showing eye-specific expressionThese genes were identified based on mouse microarray ex-pression data across 91 tissues (see Materials and Methods)We first compared the estimated concordance in ranks ofrelative rates computed using the original and updated
method in trees including and excluding the nonplacentalmammals For each gene we calculated concordance in ranksusing the mean squared error of residuals of a linear model(see Materials and Methods) where lower MSE values reflectbetter robustness We observed that for 48 (out of 55) eye-specific genes the updated method shows improved concor-dance in the ranks of relative rates across the two sets of genetrees (fig 5B) Using a pairwise Wilcoxon test we comparedthe MSE values obtained using the original versus updatedmethod revealing a statistically significant (P 6e-10) de-crease in MSE values obtained using the updated method
For each of these eye-specific genes we also calculatedsubterranean acceleration scores (see Materials andMethods) reflecting the convergent rate acceleration on thefour subterranean branches independently in gene trees in-cluding and excluding the nonplacental mammals Based onthe relative rates calculated using each method we comparedthe concordance of the subterranean acceleration scoresacross the two tree data sets Ideally we expect the scoresproduced by the methods to be highly consistent across thetwo data sets since the four nonplacental mammals are not
A
B C
FIG 5 Comparison of robustness of methods to inclusion of nonplacental mammals (A) Relative rates of Peropsin (RRH) gene branches for treeswith and without nonplacental mammals using the original versus the updated method The relative rate ranks of terminal lineage brancheswithin the RRH tree are plotted with respect to the inclusion of nonplacental mammals Redgrey points denote subterranean branches Ranks ofrelative rates computed by the original method show wider variation with respect to the inclusion of nonplacental mammals whereas updatedmethods reveal stronger concordance Mean squared sum of residuals (MSE) were calculated based on a linear model between the ranks across thetwo tree data sets with slope coefficient equal to 1 (B) Updated method shows improved concordance in ranks of relative rates across trees withand without nonplacental mammals For 48 out of 55 genes rank concordance is better for relative rates computed using the updated method(MSE(original)-MSE(updated) gt 0) For the other 7 genes the two methods do not show strong differences in the MSE values with the originalmethod outperforming the updated by slight margins (C) Updated method shows improved robustness to inclusion of nonplacental mammals atdetecting subterranean acceleration of eye-specific genes Individual points represent rate acceleration on subterranean branches for each of 55eye-specific genes computed across two data sets using the two methods Based on a linear model between the subterranean acceleration scoresacross the two tree data sets with slope coefficient equal to 1 we calculate the mean squared sum of residuals (MSE) An improved robustness(lower MSE) to the inclusion of nonplacental mammals is observed with the updated method
Partha et al doi101093molbevmsz107 MBE
1822
Dow
nloaded from httpsacadem
icoupcomm
bearticle-abstract36818175488195 by University of U
tah Eccles Health Sciences Library user on 26 August 2019
subterranean with only minor differences arising due to theinclusion of four additional background species The results ofthe analysis revealed that the updated method produces su-perior concordance in the scores across the two tree data setsreflecting its improved ability to handle the long branchesintroduced by the nonplacental mammals (fig 5C)
Improved Power to Detect Convergent Rate Shifts inSimulated TreesIn order to compare the power of our methods to detectconvergent rate shifts in branches across a range of evolu-tionary scenarios we developed a model to simulate individ-ual gene trees Such a model allows us to rigorously examinemethod performance in relation to various parameters inphylogenetic data sets including number of foregroundbranches and length distribution of foreground brancheswhere foreground branches describe branches showing a con-vergent phenotype while background branches do not Thelimited availability of ldquoground truthrdquo examples of conver-gently evolving genetic elements calls for the developmentof biologically realistic simulations of sequence evolutionUsing our model to simulate trees (see Materials andMethods) we compared the power to detect rate shifts inrelation to two factors 1 Average lengths of foregroundbranches in particular extreme foreground branches thatare very short or very long on average 2 Number of fore-ground branches We investigated the performance of theupdated method in detecting rate shifts in such extremebranches assessing the power advantage resulting from cal-culating relative rates that do not suffer from a biased meanndashvariance relationship
Our model to simulate phylogenetic trees allows for ex-plicit control over choosing foreground branches showingconvergent rate acceleration We simulate ldquocontrolrdquo treeswhere all branches are modeled to evolve at their respectiveaverage rates and ldquopositiverdquo trees where the chosen fore-ground branches are modeled to evolve at an acceleratedrate Initially we chose a foreground rate multiplier value of2 which corresponds to foreground branches in positive treesbeing sampled at twice their average rates (see Materials andMethods) We first compared the heteroscedasticity in therelative rates on the branches of the control trees calculatedusing the original and updated methods Similar to the trendsobserved in mammalian gene trees (supplementary fig S1
Supplementary Material online) we observed that theupdated method outperformed the original method at pro-ducing homoscedastic relative rates (supplementary fig S4Supplementary Material online) We then calculated a fore-ground acceleration score for individual simulated trees bothcontrol and positive A more positive value of this score cal-culated as a signed negative logarithm of the P value reflectsstronger convergent rate acceleration on the foregroundbranches (see Materials and Methods) Subsequent to esti-mating these scores we evaluated the performance of thetwo methods based on the power to distinguish the positivetrees from control trees In two independent simulation set-tings with foreground branches of long and short averagelengths we observed that the updated method offers morepower to detect positive trees (fig 6B and see supplementaryfig S5 Supplementary Material online for precision-recallcurves)
We repeated the analyses with more conservative choicesfor modeling foreground acceleration using foreground ratemultiplier values of 15 and 175 to ensure the improvedpower was robust to the choice of foreground rate multiplier(m) Consistent with the original analysis the updatedmethod was more powerful at precise detection of positivetrees for all values of m (supplementary fig S6 SupplementaryMaterial online) We also observed that with increasing valuesof m it becomes easier to detect positive trees (fig 6B andsupplementary fig S6 Supplementary Material online) whichis expected since the foreground branches will be longer forlarger values of m Our choices of foreground rate multipliervalues in simulations (mfrac14 15 175 and 2) represent chal-lenging scenarios for our method in comparison to fore-ground rate multiplier estimates observed in real data Forinstance our simulation choices are lower than the fore-ground rate multiplier estimates for genes showing strongrelaxation of constraint in subterranean mammals andmore comparable to the estimates for genes under positiveselection (see Materials and Methods and table 4) Thisproves the utility of our method at detecting genes showingrate acceleration due to positive selection in addition to re-laxation of constraint
We also performed a control analysis using foregroundacceleration scores computed using four length-matchedcontrol foreground branches that were not the true fore-ground proving that the positive trees were not detecteddue to random chance (supplementary fig S7Supplementary Material online) Finally in addition to thepositive trees with foreground branches that were long orshort we compared the power to detect rate accelerationon foreground branches of intermediate length Consistentwith the findings in shortlong foregrounds we find a modestyet significant improvement offered by the updated method(supplementary fig S8 Supplementary Material online)Overall we find that our updated method to compute rela-tive rates offers a significantly improved power to detect con-vergent rate shifts in simulated trees
We then compared the power to detect rate shifts acrossvarying numbers of foreground branches by simulating pos-itive trees with seven foreground branches of long average
Table 1 Subterranean Acceleration Scores for Peropsin (RRH)Computed Using Two Methods and across Two Data Sets
Data Set Method
Original Updated
Withnonplacentals
270(rho5031 P 50002)
21(rho5027 P 50008)
Placentals only 138(rho5021 P 50041)
20(rho5026 P 5001)
NOTEmdashIn comparison to the original method the updated method shows strongerconsistency in the scores across the two tree data sets with and without the non-placental mammals The subterranean acceleration scores reflect the significance ofconvergent rate acceleration on the four subterranean branches
Robust Method for Detecting Convergent Shifts in Evolutionary Rates doi101093molbevmsz107 MBE
1823
Dow
nloaded from httpsacadem
icoupcomm
bearticle-abstract36818175488195 by University of U
tah Eccles Health Sciences Library user on 26 August 2019
lengths (supplementary fig S9 Supplementary Material on-line) We subsequently generated positive trees with subsetsof n branches (n ranging from 4 to 7) among these sevenforeground branches (supplementary fig S9 SupplementaryMaterial online) Within each of these data sets we calculatedforeground acceleration scores for control and positive treesusing each method independently We observed that theupdated method to calculate relative rates is consistentlymore powerful than the original method at precise detectionof positive trees (fig 7A) We repeated the analysis choosingseven foreground branches that were short on average ratherthan long (supplementary fig S9 Supplementary Materialonline) and observed consistent gains in power using updatedmethod to calculate relative rates (fig 7B)
Applying of our method to simulations with varying con-figurations of foreground branches also revealed that thepower to detect foreground acceleration is higher for longerforeground branches In other words it is easier to detect rateacceleration on longer foreground branches compared withshorter ones (figs 6A vs B and 7A vs B) In terms of sequence
divergence longer branches represent instances of higher se-quence divergence or more changes which are easier to de-tect as the method ranks the rates on branches relative to oneanother The increased power to detect rate accelerationtherefore becomes especially useful in convergent pheno-types involving short foreground branches where theimprovements are nearly 2-fold (fig 7B)
Relative Rates-Based Inference Is Robust to MinorUncertainties in Species Tree TopologyOur method relies on estimating sequence divergence onbranches of phylogenetic trees with a fixed topology Effortsto better resolve the phylogeny of extant mammals haveresulted in continuous updates to the consensus speciestree topology (Murphy et al 2001 2007) Topology treescommonly used in phylogenomic analyses of extant mam-mals include the UCSC genome browserrsquos 100-way tree aswell as the timetrees reported in Meredith et al (2011) andBininda-Emonds et al (2007 Casper et al 2018) Differencesbetween these species tree topologies often involve entire
A
B
FIG 6 Comparison of method performance across simulated phylogenetic trees (A) Branch length distributions for simulating phylogenetic treeswith foreground branches labeled Two independent simulations were performed with foreground branch sets comprised of long foregroundbranches (left panel) and short foreground branches (right panel) respectively (B) Power to detect rate shift in foreground branches of simulatedtrees Across five independent simulations of control trees and positive trees we measured the area under the precision-recall curve (AUPR) toprecisely detect positive trees using the foreground acceleration score The AUPR distributions obtained using the updated method to calculaterelative rates are significantly elevated compared with the original method across simulated scenarios involving foreground sets of long (left) andshort branches (right) respectively
Partha et al doi101093molbevmsz107 MBE
1824
Dow
nloaded from httpsacadem
icoupcomm
bearticle-abstract36818175488195 by University of U
tah Eccles Health Sciences Library user on 26 August 2019
clades and the decision to choose a particular topology treecan potentially strongly influence the outcomes of phyloge-netic analyses Here we benchmarked the robustness of ourrelative rates method to the choice of topology tree Weconstructed protein-coding gene trees based on two differentspecies tree topologies namely the UCSC 100-way tree andour modified Meredith et al (Merediththorn) topology tree (seeMaterials and Methods) The RobinsonndashFoulds metric (cal-culated using the function RFdist in the R packageldquophangornrdquo) between these two phylogenies is 22 reflectingdifferences in 22 partitions of species (Robinson and Foulds1981 Schliep 2011) We observed that both the updated andoriginal methods to calculate relative rates show robust sig-natures of subterranean rate acceleration for eye-specificgenes with respect to the species tree topology used (fig 8)
Comparison of Power to Detect Enriched PathwaysAssociated with Two Independent ConvergentPhenotypesBeyond examining individual genes we further assessed ournew methodrsquos ability to detect pathway enrichments forgenes under relaxation of constraint in subterranean mam-mals and marine mammals (see fig 9 for respective fore-ground branches and supplementary fig S10Supplementary Material online for average rates)Compared with our original method the updated methoddetected more enriched Gene Ontology (GO) terms withaccelerated evolutionary rates in subterranean mammals (ta-ble 2) Additionally the fold enrichment for detected termswas significantly stronger with the updated method (supple-mentary fig S10 and tables S1ndashS6 Supplementary Materialonline) On the other hand the marine system showed mixedresults Both the updated and the original methods showedapproximately equal power to detect enriched GO terms ifwe only consider the number of terms detected (table 3 andsupplementary tables S7ndashS12 Supplementary Material
online) However when comparing the fold enrichment fordetected terms the original method was significantly betterthan the updated method (supplementary fig S10Supplementary Material online) These contrasting resultsfrom the subterranean data set versus the marine data setindicate the importance of tailoring the corrections we havedeveloped to the data set of interest as well as the impor-tance of taking advantage of simulation-based power androbustness assessments to develop methods that are broadlyapplicable to many convergent phenotypes
Implementation and AvailabilityOur method is publicly available as an R package calledRERconverge on GitHub at httpsgithubcomnclark-labRERconverge and described in (Kowalczyk et al 2018) Alsoincluded are extensive vignette walkthroughs to guide usersthrough the software RERconverge requires as input genetrees with branch lengths that represent evolutionary ratesand phenotype information Functions within the packagecan take this input to calculate RERs ancestral phenotypeinformation and statistical associations between phenotypesand evolutionary rates
The RERconverge software is available for any platformand its computational efficiency allows analysis of genome-scale data sets When run on a set of 19149 orthologousgenes in 62 mammal species the full analysis can be com-pleted in 1 h and 18 min on a computer running Windows 10with 16 Gb of RAM and an Intel Core i7-6500U 250GHz CPU(Kowalczyk et al 2018) We hope that these capabilities willenable researchers worldwide to perform analyses to findrelationships between genes and evolutionarily convergenttraits
DiscussionOur original evolutionary-rates-based method to detect ge-nomic elements underlying convergent phenotypes has
A B
FIG 7 Improved power to detect foreground rate shifts using the updated method across different numbers of foreground branches This analysiswas performed across five independent simulations of control trees and positive trees with varying numbers of foreground branches (4ndash7) Withineach simulation we measured the area under the precision-recall curve (AUPR) to precisely detect positive trees using the foreground accelerationscore The AUPR distributions obtained using the updated method to calculate relative rates are consistently elevated compared with the originalmethod across simulations with different numbers of foreground branches These simulations were performed across two scenarios with differentforeground branch sets consisting of short (A) and long branches (B) respectively
Robust Method for Detecting Convergent Shifts in Evolutionary Rates doi101093molbevmsz107 MBE
1825
Dow
nloaded from httpsacadem
icoupcomm
bearticle-abstract36818175488195 by University of U
tah Eccles Health Sciences Library user on 26 August 2019
already proved to be a valuable technique to detectgenes and enhancers associated with transitions to ma-rine and subterranean habitats (Chikina et al 2016Partha et al 2017) However the original method
suffered from reduced power to detect such genomicelements due to a heteroscedastic relationship betweenthe mean and variance of branch lengths for a givenbranch across all gene trees that is branches that are
FIG 8 Comparison of robustness of methods to species tree topology Both the original and updated relative rates methods are robust to choice ofspecies tree topology used to construct individual gene trees Points represent the strength of convergent subterranean acceleration for eye-specific genes whose trees were constructed using the Merediththorn topology (x-axis) and the UCSC topology (y-axis) respectively Based on a linearmodel between the subterranean acceleration scores across the two tree data sets with slope coefficient equal to 1 we calculate the mean squaredsum of residuals (MSE) We observed that the updated method offers a marginal improvement to the robustness as reflected by a lower MSE value
FIG 9 Cladograms describing relationships between 63 mammalian species used for constructing genome-wide maximum likelihood protein-coding gene trees Final version of the tree we modified from the topology reported in Meredith et al (2011) (left) and tree reported in UCSCgenome browser (right) (Casper et al 2018) Key differences between the placement of species are highlighted using black lines Marine species aremanatee walrus seal killer whale and dolphin Subterranean species are cape golden mole star nosed mole naked mole-rat and blind mole-rat
Partha et al doi101093molbevmsz107 MBE
1826
Dow
nloaded from httpsacadem
icoupcomm
bearticle-abstract36818175488195 by University of U
tah Eccles Health Sciences Library user on 26 August 2019
longer on average have higher variance than branchesthat are shorter on average
Here we developed a method using a square-root trans-formation and a weighted regression based on the observedmeanndashvariance relationship to correct for the heteroscedas-ticity While our objective was to develop a method thatrobustly handles meanndashvariance trends in phylogenetic treeswe do not systematically investigate factors underlying thisproperty Previous genome-scale analyses in modern birdshave showed evidence for base composition heterogeneityaffecting variance of branch lengths in exon trees (Jarviset al 2014) However in our phylogenetic data set of mam-malian protein-coding genes we found no evidence for base
composition heterogeneity influencing sequence divergenceat the gene levelmdashwe failed to detect any significant globaltrends between GC-content of our sequences and their rawbranch lengths relative rates computed using our originalmethod or from our new method (supplementary fig S11Supplementary Material online) Further comparative geno-mics analysis is required to better understand factorsinfluencing branch length distribution patterns in phyloge-netic trees
We tested our new method on real and simulated phylog-enies and observed improved robustness to wider ranges ofbranch lengths and increased ability to detect convergentevolutionary rate shifts Our new method offers increasedrobustness to the inclusion of distantly related species withlong branch lengths in our phylogeny namely nonplacentalmammals When we compared results from an analysis usingonly placental mammals and an analysis that included non-placental mammals using both our original and our updatedmethods we found that our new method unlike our originalmethod is unimpaired by the inclusion of nonplacentalmammals By improving our methodrsquos robustness to inclu-sion of long branches we increased the methodrsquos applicabilityto a broader range of species and hence a broader range ofconvergent phenotypes Additionally our new methodrsquos in-creased power could enable us to discover more convergentlyevolving genomic elements One particular incentivizing ex-ample for these improvements is the recent efforts to se-quence the northern marsupial mole a completely blindmammal (Archer et al 2011) When considering using sub-terranean species to find genes and enhancers associated withvision the ability to include the nonplacental marsupial molealong with the other nonplacental mammals in our data setwill allow for more power in a scan for vision-specific geneticelements showing convergent regression in the five blindmammals
In addition to testing our method on real data we alsodeveloped a simulation-based strategy to represent a ldquotruepositiverdquo case of convergent evolution Our simulations followa similar approach to simulating RNA-seq counts where sim-ulated rates are essentially capturing the number of substitu-tions that occur along a branch (Di et al 2011) We showedthat our new method demonstrates improved detection ofrate shifts both when foreground species occupy long high-variance branches and when foreground species occupyshort low-variance branches This allows the method to de-tect convergent rate shifts given a variety of potential config-urations of convergently evolving species The types ofsimulations we developed are essential because relativelyfew concrete instances of sequence-level evolutionary con-vergence exist so biologically accurate simulations of suchevolution are essential to rigorously test methods that detectshifts in evolutionary rates One simplification of our simula-tion method is that all species are present in all simulatedtrees which is not the case in real genomic data because ofgenomic element gain and loss across species Howevermaintaining constant species composition in our simulatedtrees should have little impact on our ability to compare ourmethods because we expect both to be equally impacted by
Table 2 Comparison of Number of Vision-Related Gene OntologyTerms Enriched in Top Subterranean-Accelerated Genes Discoveredby the Original and Updated Methods
topN Number ofTop Accelerated Genes
Subterranean-AcceleratedGO Terms (FDRlt005)
Original Method Updated Method
20 2 9100 11 28200 16 32
NOTEmdashGene Ontology term enrichment analysis was performed individually ontop subterranean accelerated genes discovered by each method Across varyingnumbers of top target genes genes discovered using the updated method wereconsistently enriched for higher numbers of vision-related GO terms
Table 3 Comparison of Number of Gene Ontology Terms Enrichedin Top Marine-Accelerated Genes Discovered by the Original andUpdated Methods
topN Number of TopAccelerated Genes
Marine-AcceleratedGO Terms (FDRlt005)
Original Method Updated Method
50 16 10100 27 31200 59 59
NOTEmdashGene Ontology term enrichment analysis was performed individually ontop marine-accelerated genes discovered by each method Across varying numbersof top target genes neither method showed a clear superiority over the other atdetecting higher numbers of enriched terms We chose the Top50 genes for themarine phenotype instead of Top20 as was the case with the subterranean analysissince no terms were enriched across either method in the Top20 gene list
Table 4 Mole Foreground Multiplier estimates for Genes ShowingStrong Convergent Rate Acceleration on Mole Branches
Gene Mole Foreground RateMultiplier Estimate
Evolutionary Mode
LIM2 863 RelaxedCRYBB3 536 RelaxedCRYBB2 487 RelaxedCRYGC 462 RelaxedCRYBA1 389 RelaxedGPR89B 330 RelaxedKRTAP17-1 322 Positive selectionGNAT1 266 RelaxedROM1 258 RelaxedCOL4A4 170 Positive selection
Robust Method for Detecting Convergent Shifts in Evolutionary Rates doi101093molbevmsz107 MBE
1827
Dow
nloaded from httpsacadem
icoupcomm
bearticle-abstract36818175488195 by University of U
tah Eccles Health Sciences Library user on 26 August 2019
species presence and absence A second simplification is thatwe assume all convergently evolving species have the samephylogenetic relatedness that is each foreground branch isan independent instance of convergent evolutionary ratesWe would like to be able to answer questions about ourmethodrsquos power given more complex phylogenetic configu-rations Developing methods to answer those types of ques-tions will require a much higher degree of complexity in oursimulations but it will also allow us to determine which spe-cies to add to our genomic data sets to increase our power tofind convergently evolving genomic features
Our improved method has proved valuable for detectinggenomic elements associated with two binary traitsmdashsubter-ranean-dwelling or not and marine-dwelling or notmdashand wewill extend our method for use in convergent continuoustraits and nonbinary discrete traits We will also assemblecomplementary analyses to assess the robustness and powerof each method By extending the scope of our method tononbinary traits we will expand the potential search-space ofour method to a plethora of new convergent phenotypesOur overarching goal is to develop an entire suite of methodsthat can utilize any conceivable phenotypes as inputs to ac-curately and robustly identify convergently evolving genomicelements
Materials and Methods
Protein-Coding Gene Trees across 63 MammalianSpeciesWe downloaded the 100-species multiz amino acid align-ments available at the UCSC genome browser and retainedonly alignments with a minimum of ten species We thenpruned each alignment down to the species represented infigure 9 of the proteome-wide average tree We added theblind mole rat ortholog of each gene based on the methodsdescribed in Partha et al (2017) We estimated the branchlengths for each amino acid alignment using the aaml pro-gram from the package PAML (Yang 2007) We estimatedthese branch lengths on a tree topology modified from thetimetree published in Meredith et al We attempted to re-solve conflicts between the topology inferred in Meredithet al (2011) compared with that in Bininda-Emonds et al(2007) based on a consensus of various studies employing afiner scale phylogenetic inference of the species involved Thedifferences between our final topology which we callldquoMerediththornrdquo topology and the Meredith et al topology in-clude setting the star-nosed mole as an outgroup to thehedgehog and shrew cow as an outgroup to the Tibetanantelope sheep and goat and the ursid clade as an outgroupto mustelid and pinniped clades For more details about theliterature surveyed to resolve these differences please refer toMeyer et al (2018) The topology of our final ldquoMerediththornrdquotree compared with the UCSC topology tree is reported infigure 9 In order to perform analyses benchmarking themethod robustness to tree topology we additionally gener-ated the protein-coding gene trees based on the UCSC treetopology
Genes Showing Eye-Specific ExpressionWe identified eye-specific gene sets using microarray expres-sion data from 91 mouse tissues (Su et al 2004) We identifiedgenes specifically expressed in the following tissues of theeyemdashcornea iris lens and retina (including retinal pigmentedepithelium) These genes showed significant differential ex-pression only in the tissue of interest compared with theother tissues at an alpha of 005 (t-test)
Calculating Concordance in Relative Rates Ranksacross Data Sets with and without NonplacentalMammalsTo estimate the robustness of relative rates calculations toinclusion of nonplacental mammals we calculate the concor-dance in relative rates ranks across two phylogenetic data setswith and without the nonplacental mammals respectivelyFor each of the 55 eye-specific genes we rank the extantbranches in trees based on the ordering of relative rates in-dependently in the two data sets We then fit a linear modelbetween the ranks across these two data sets while forcing aslope coefficient of 1 We subsequently estimate the concor-dance in the ranks as the mean squared error of the residualsof this linear model Lower MSE values reflect better concor-dance in the ranks and thus superior robustness We subse-quently compare these MSE values for each eye-specific geneobtained using the original and updated methods to calculaterelative rates A positive MSE originaleth THORN MSEethupdatedTHORNvalue implies the updated method shows improved concor-dance in the ranks of relative rates across data sets with andwithout the nonplacental mammals respectively
Simulating Phylogenetic TreesPhylogenetic branch lengths have units of number of substi-tutions per site and thus can be thought of as normalizedcount data However we find that a Poisson distribution isunsuitable in this case as the real branch length data showconsiderable overdispersion that is the variance is higher thanthe mean (supplementary fig S2 Supplementary Materialonline) We thus model the branch lengths of the simulatedtrees using a negative binomial distribution following ideasfrom studies simulating expression counts for RNAseq anal-ysis (Robinson et al 2009 Di et al 2011 Law et al 2014 Ritchieet al 2015)
We simulated data sets of phylogenetic trees using theUCSC tree topology and branch lengths from the averageproteome-wide tree across 19149 mammalian protein-coding gene trees across 62 mammals Supplementary figureS3 Supplementary Material online describes the tree topol-ogy used for the simulations We simulate the branch lengths(or rates) for every branch (j) on each tree (i) according to thefollowing formula
bij frac14 Poisson Gamma aikj aikj sqrt aikj
where Gamma is parametrized by mean and variance Hereai is a gene-specific scaling term kj is the average rate of thecorresponding branch so that aikj is the expected rate on theijrsquoth branch and the simulated rate is drawn from a Gamma
Partha et al doi101093molbevmsz107 MBE
1828
Dow
nloaded from httpsacadem
icoupcomm
bearticle-abstract36818175488195 by University of U
tah Eccles Health Sciences Library user on 26 August 2019
distribution with that mean The composite Poisson-Gammadistribution is equivalent to the negative binomial distribu-tion and thus in our simulation the mean variance relation-ship has a quadratic component matching what we observein real data (supplementary fig S2 Supplementary Materialonline)
We simulate two classes of trees in every data set based ondifferent input parameters We simulate ldquocontrolrdquo trees treeswhere the kj are simply the average rate on the branch jThese control trees do not show any explicit convergentrate shift on any of the branches We additionally simulateldquopositiverdquo trees showing convergent rate acceleration on fore-ground (fgd) branches by sampling at kpositive
fgd frac14 mkcontrolfgd
only on these branches (mfrac14 15 175 or 2) Thus the fore-ground branches in positive trees are effectively sampled at anaccelerated rate compared with the foreground branches incontrol trees
Estimating Foreground Rate Multiplier (m) for GenesShowing Convergent Rate Acceleration inSubterranean MammalsWe compared our choices for the foreground rate multiplier(mfrac14 15 175 or 2) in simulations to that observed in realdata using branch lengths of ten genes showing strong con-vergent rate acceleration in the four subterranean mammals(moles) Of the 55 genes identified in Partha et al as showingstrongest convergent rate acceleration in the moles we chosethe top eight genes showing relaxation of constraint and twogenes undergoing positive selection on the four molebranches (supplementary table S5 in Partha et al 2017) Foreach of these ten genes we estimated the mole foregroundrate multiplier as follows we first fit a linear model betweenthe gene branch lengths and the average branch lengthsBased on the predicted values for the mole branches fromthis linear model we calculate the foreground rate multiplierfor each mole branch by dividing the real mole branch lengthby their predicted value The mole foreground rate multiplierestimate for each gene is subsequently calculated as the meanof the four individual foreground rate multipliers Table 4shows the mole foreground rate multiplier estimates for theseten genes
Calculating Gene-Trait CorrelationsThe gene-trait correlations are computed under a MannndashWhitney U testing framework over the binary variable offoreground versus background branches In the subterraneanexample the four subterranean branches (fig 1) are desig-nated as foreground We calculate a foreground accelerationscore reflecting the strength of convergent rate accelerationon the foreground branches The value is calculated as thenegative logarithm of the P value of the MannndashWhitney testmultiplied by the direction of the correlation as given by thesign of the rho statistic A positive rho statistic indicates rateacceleration in the foreground species and the negative log-arithm of P value reflects the strength of the convergent rateshift In simulated trees study we generated trees for threesets of foreground branches with different branch length dis-tributionsmdashshort intermediate and long as illustrated in
figure 6 and supplementary figure S5 SupplementaryMaterial online
Foreground acceleration score frac14 Sign Rhoeth THORN log10Pfrac12
where rho and P are the correlation coefficient and statisticalsignificance of the MannndashWhitney test for association be-tween relative rates and binary trait
Gene Ontology Term Enrichment AnalysisWe performed functional enrichment analysis in target genelists using the GOrilla tool (Eden et al 2009) For each analysisGO terms enriched in target gene lists were identified bycomparing to a background gene list with all 19149 genesused to construct gene trees
Supplementary MaterialSupplementary data are available at Molecular Biology andEvolution online
AcknowledgmentsWe thank Dennis Kostka as well as members of the Chikinaand Clark labs for helpful discussion and feedback on earlierversions of this article This work was supported by NIH R01HG009299-01A1 to NLC and MC AK was supported byNIH T32 training grant T32 EB009403 as part of the HHMI-NIBIB Interfaces Initiative
ReferencesAndersson R Gebhard C Miguel-Escalada I Hoof I Bornholdt J Boyd M
Chen Y Zhao X Schmidl C Suzuki T et al 2014 An atlas of activeenhancers across human cell types and tissues Nature507(7493)455ndash461 doi101038nature12787
Archer M Beck R Gott M Hand S Godthelp H Black K 2011 Australiarsquosfirst fossil marsupial mole (Notoryctemorphia) resolves controver-sies about their evolution and palaeoenvironmental origins Proc RSoc B Biol Sci 278(1711)1498ndash1506 doi101098rspb20101943
Casper J Zweig AS Villarreal C Tyner C Speir ML Rosenbloom KRRaney BJ Lee CM Lee BT Karolchik D et al 2018 The UCSCGenome Browser database 2018 update Nucleic Acids Res46(D1)D762ndashD769 doi101093nargkx1020
Chikina M Robinson JD Clark NL 2016 Hundreds of Genes ExperiencedConvergent Shifts in Selective Pressure in Marine Mammals Mol BiolEvol 33(9)2182ndash2192 doi101093molbevmsw112
Di Y Schafer DW Cumbie JS Chang JH 2011 The NBP NegativeBinomial Model for Assessing Differential Gene Expression fromRNA-Seq Stat Appl Genet Mol Biol 10(1)1ndash28 doi1022021544-61151637
Eden E Navon R Steinfeld I Lipson D Yakhini Z 2009 GOrilla A tool fordiscovery and visualization of enriched GO terms in ranked genelists BMC Bioinformatics 10(1)48 doi1011861471-2105-10-48
Eisen JA 1998 Phylogenomics Improving functional predictions foruncharacterized genes by evolutionary analysis Genome Research8(3)163ndash167 doi101101gr83163
Esteller M 2011 Non-coding RNAs in human disease Nature ReviewsGenetics 12(12)861ndash874 doi101038nrg3074
Foote AD Liu Y Thomas GWC Vinar T Alfoldi J Deng J Dugan S VanElk CE Hunter ME Joshi V et al 2015 Convergent evolution of thegenomes of marine mammals Nature Genetics 47(3)272ndash275doi101038ng3198
Hiller M Schaar BT Indjeian VB Kingsley DM Hagey LR Bejerano G2012 A ldquoForward Genomicsrdquo Approach Links Genotype to
Robust Method for Detecting Convergent Shifts in Evolutionary Rates doi101093molbevmsz107 MBE
1829
Dow
nloaded from httpsacadem
icoupcomm
bearticle-abstract36818175488195 by University of U
tah Eccles Health Sciences Library user on 26 August 2019
Phenotype using Independent Phenotypic Losses among RelatedSpecies Cell Reports 2(4)817ndash823 doi101016jcelrep201208032
Jarvis ED Mirarab S Aberer AJ Li B Houde P Li C Ho SYW Faircloth BCNabholz B Howard JT et al 2014 Whole-genome analyses resolveearly branches in the tree of life of modern birds Science346(6215)1320ndash1331
Kowalczyk A et al 2018 RERconverge an R package for associatingevolutionary rates with convergent traits bioRxiv Available athttpbiorxivorgcontentearly20181023451138abstract
Lartillot N Poujol R 2011 A phylogenetic model for investigating cor-related evolution of substitution rates and continuous phenotypiccharacters Mol Biol Evol 28(1)729ndash744
Law CW Chen Y Shi W Smyth GK 2014 voom precision weightsunlock linear model analysis tools for RNA-seq read countsGenome Biol 15(2)R29
Li Y Calvo SE Gutman R Liu JS Mootha VK 2014 Expansion of bio-logical pathways based on evolutionary inference Cell158(1)213ndash225 doi101016jcell201405034
Manolio TA Collins FS Cox NJ Goldstein DB Hindorff LA Hunter DJMcCarthy MI Ramos EM Cardon LR Chakravarti A et al 2009Finding the missing heritability of complex diseases Nature461(7265)747ndash53 doi101038nature08494
Marcovitz A Jia R Bejerano G 2016 ldquoreverse Genomicsrdquo predicts func-tion of human conserved noncoding elements Mol Biol Evol33(5)1358ndash1369
Meredith RW Janecka JE Gatesy J Ryder OA Fisher CA Teeling ECGoodbla A Eizirik E Sim~ao TLL Stadler T et al 2011 Impacts of thecretaceous terrestrial revolution and KPg extinction on mammaldiversification Science 334(6055)521ndash524 doi101126science1211028
Meyer WK Jamison J Richter R Woods SE Partha R Kowalczyk A KronkC Chikina M Bonde RK Crocker DE et al 2018 Ancient convergentlosses of Paraoxonase 1 yield potential risks for modern marinemammals Science 361(6402)591ndash594 doi101126scienceaap7714
Murphy WJ Eizirik E OrsquoBrien SJ Madsen O Scally M Douady CJ TeelingE Ryder OA Stanhope MJ De Jong WW et al 2001 Resolution ofthe early placental mammal radiation using bayesian phylogeneticsScience 294(5550)2348ndash2351 doi101126science1067179
Murphy WJ Pringle TH Crider TA Springer MS Miller W 2007 Usinggenomic data to unravel the root of the placental mammal phylog-eny Genome Research 17(4)413ndash421 doi101101gr5918807
Olaf Bininda-Emonds Cardillo Marcel Jones Kate E MacPhee Ross D EBeck Robin M D Grenyer Richard Price Samantha A Vos Rutger AGittleman JL Purvis A 2007 The delayed rise of present-day mam-mals Nature 446(29)507ndash512
Parker J Tsagkogeorga G Cotton JA Liu Y Provero P Stupka E RossiterSJ 2013 Genome-wide signatures of convergent evolution in echo-locating mammals Nature 502(7470)228ndash231 doi101038nature12511
Partha R Chauhan BK Ferreira Z Robinson JD Lathrop K Nischal KKChikina M Clark NL 2017 Subterranean mammals show conver-gent regression in ocular genes and enhancers along with adapta-tion to tunneling eLife 6e25884 doi107554elife25884
Pellegrini M Marcotte EM Thompson MJ Eisenberg D Yeates TO 1999Assigning protein functions by comparative genome analysis pro-tein phylogenetic profiles Proceedings of the National Academy ofSciences of the United States of America 96(8)4285ndash8
Pennacchio LA Bickmore W Dean A Nobrega MA Bejerano G 2013Enhancers Five essential questions Nature Reviews Genetics14(4)288ndash295 doi101038nrg3458
Prudent X Parra G Schwede P Roscito JG Hiller M 2016 Controlling forphylogenetic relatedness and evolutionary rates improves the dis-covery of associations between speciesrsquo phenotypic and genomicdifferences Mol Biol Evol 33(8)2135ndash2150
Project Consortium TE Consortium EP Bernstein BE Birney E DunhamI Green ED Gunter C Snyder M 2012 An integrated encyclopediaof DNA elements in the human genome Nature 489(7414)57ndash74doi101038nature11247
Radivojac P Clark WT Oron TR Schnoes AM Wittkop T Sokolov AGraim K Funk C Verspoor K Ben-Hur A et al 2013 A large-scaleevaluation of computational protein function prediction NatureMethods 10(3)221ndash227 doi101038nmeth2340
Ritchie ME Phipson B Wu D Hu Y Law CW Shi W Smyth GK 2015limma powers differential expression analyses for RNA-sequencingand microarray studies Nucleic acids research 43(7)e47 doi101093nargkv007
Robinson DF Foulds LR 1981 Comparison of phylogenetic treesMathematical Biosciences 53(1ndash2)131ndash147 doi1010160025-5564(81)90043-2
Robinson MD McCarthy DJ Smyth GK 2009 edgeR A Bioconductorpackage for differential expression analysis of digital gene expressiondata Bioinformatics 26(1)139ndash140 doi101093bioinformaticsbtp616
Romanoski CE Glass CK Stunnenberg HG Wilson L Almouzni G 2015Epigenomics Roadmap for regulation Nature 518(7539)314ndash316doi101038518314a
Roscito JG Sameith K Parra G Langer BE Petzold A Moebius C BickleM Rodrigues MT Hiller M 2018 Phenotype loss is associated withwidespread divergence of the gene regulatory landscape in evolu-tion Nature Communications 9(1) doi101038s41467-018-07122-z
Sanchez Y Huarte M 2015 Long Non-Coding RNAs Challenges forDiagnosis and Therapies Nucleic Acid Therapeutics 23(1)15ndash20doi101089nat20120414
Schliep KP 2011 phangorn Phylogenetic analysis in R Bioinformatics27(4)592ndash593 doi101093bioinformaticsbtq706
Shlyueva D Stampfel G Stark A 2014 Transcriptional enhancers Fromproperties to genome-wide predictions Nature Reviews Genetics15(4)272ndash286 doi101038nrg3682
Stern DL 2013 The genetic causes of convergent evolution Nat RevGenet 14(11)751ndash764
Su AI Wiltshire T Batalov S Lapp H Ching KA Block D Zhang J SodenR Hayakawa M Kreiman G et al 2004 A gene atlas of the mouseand human protein-encoding transcriptomes Proceedings of theNational Academy of Sciences 101(16)6062ndash6067 doi101073pnas0400782101
Thomas GWC Hahn MW 2015 Determining the null model for detect-ing adaptive convergence from genomic data A case study usingecholocating mammals Molecular Biology and Evolution32(5)1232ndash1236 doi101093molbevmsv013
Yang ZH 2007 PAML 4 phylogenetic analysis by maximum likelihoodMol Biol Evol 24(8)1586ndash1591
Zhang J Kumar S 1997 Detection of convergent and parallel evolutionat the amino acid sequence level Molecular Biology and Evolution14(5)527ndash536 doi101093oxfordjournalsmolbeva025789
Zou Z Zhang J 2015 No genome-wide protein sequence convergencefor echolocation Molecular Biology and Evolution 32(5)1237ndash1241doi101093molbevmsv014
Partha et al doi101093molbevmsz107 MBE
1830
Dow
nloaded from httpsacadem
icoupcomm
bearticle-abstract36818175488195 by University of U
tah Eccles Health Sciences Library user on 26 August 2019
- msz107-TF1
- msz107-TF2
- msz107-TF3
-
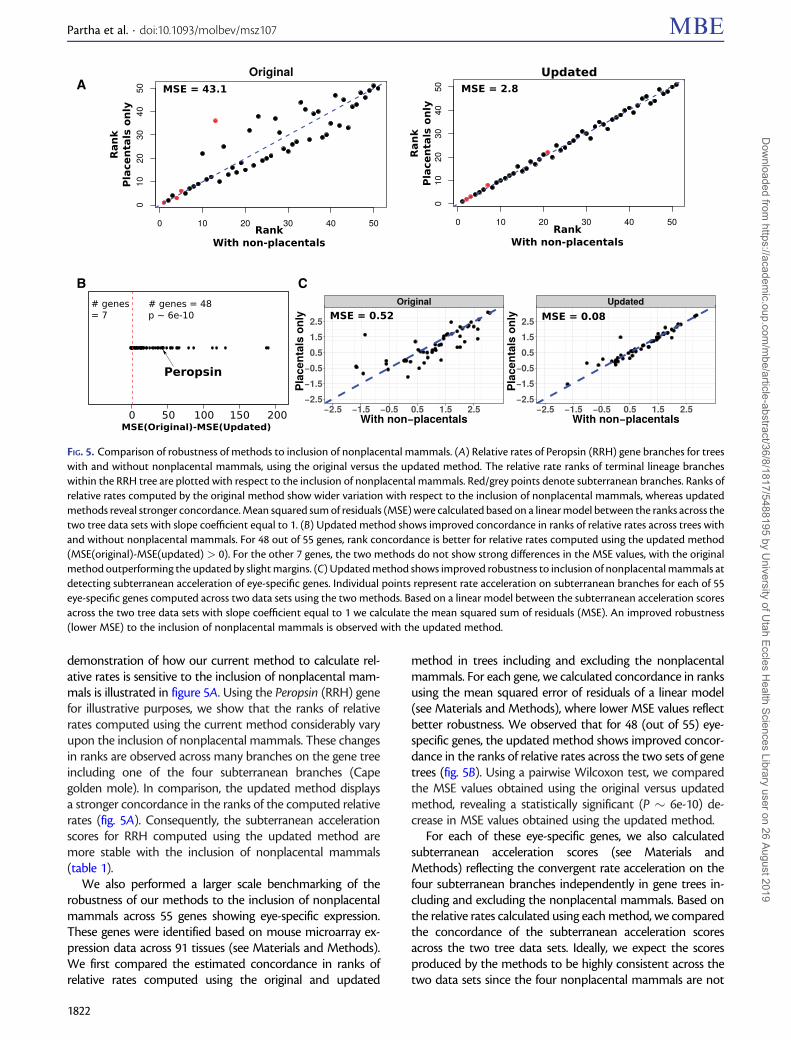