robustifying genomic classifiers to batch effects via
TRANSCRIPT

Robustifying genomic classifiersto batch effects via ensemble learning
Yuqing Zhang1,2, W. Evan Johnson∗1,2,3, and Giovanni
Parmigiani∗4,5
1Division of Computational Biomedicine, Boston University School of Medicine2Graduate Program in Bioinformatics, Boston University
3Department of Biostatistics, Boston University School of Public Health4Department of Data Sciences, Dana-Farber Cancer Institute
5Department of Biostatistics, Harvard T.H. Chan School of Public Health
∗: Joint last authors
1
.CC-BY-NC-ND 4.0 International licenseIt is made available under a was not peer-reviewed) is the author/funder, who has granted bioRxiv a license to display the preprint in perpetuity.
The copyright holder for this preprint (which. http://dx.doi.org/10.1101/703587doi: bioRxiv preprint first posted online Jul. 20, 2019;
The Trial Version

Abstract
Genomic data are often produced in batches due to practical restrictions, whichmay lead to unwanted variation in data caused by discrepancies across processingbatches. Such "batch effects" often have negative impact on downstream biologi-cal analysis and need careful consideration. In practice, batch effects are usuallyaddressed by specifically designed software, which merge the data from differ-ent batches, then estimate batch effects and remove them from the data. Herewe focus on classification and prediction problems, and propose a different strat-egy based on ensemble learning. We first develop prediction models within eachbatch, then integrate them through ensemble weighting methods. In contrast tothe typical approach of removing batch effects from the merged data, our methodintegrates predictions rather than data. We provide a systematic comparison be-tween these two strategies, using studies targeting diverse populations infectedwith tuberculosis. In one study, we simulated increasing levels of heterogeneityacross random subsets of the study, which we treat as simulated batches. We thenuse the two methods to develop a genomic classifier for the binary indicator of dis-ease status. We evaluate the accuracy of prediction in another independent studytargeting a different population cohort. We observed a turning point in the levelof heterogeneity, after which our strategy of integrating predictions yields betterdiscrimination in independent validation than the traditional method of integrat-ing the data. These observations provide practical guidelines for handling batcheffects in the development and evaluation of genomic classifiers.
Keywords: Genomics, Batch Effect Adjustment, Ensemble Learning, BinaryClassification
Introduction
Statistical learning models based on genomic information have been widely usedfor prognostication and prediction across a range of precision medicine applica-
2
.CC-BY-NC-ND 4.0 International licenseIt is made available under a was not peer-reviewed) is the author/funder, who has granted bioRxiv a license to display the preprint in perpetuity.
The copyright holder for this preprint (which. http://dx.doi.org/10.1101/703587doi: bioRxiv preprint first posted online Jul. 20, 2019;
The Trial Version

tions, including cancer (Golub et al. (1999); Riester et al. (2014); Silvestri et al.
(2015); Papaemmanuil et al. (2016)) and infectious diseases (Seib et al. (2009);Leong et al. (2018)), and have shown great potential in facilitating clinical andpreventative decision making (Badani et al. (2015)). To fully achieve such po-tential, it is critical to develop prediction algorithms with generalizable predic-tion performance on independent data, which are transferable to clinical use (Si-mon et al. (2003)). However, the presence of "study effects", or heterogeneityacross genomic studies, makes it challenging to develop generalizable predictionmodels. In particular, it has been established that cross-study validation perfor-mance of genomic classifiers is often inferior to internal cross-validation (Ma et al.
(2014); Chang and Geman (2015); Bernau et al. (2014)), and that this gap cannotbe entirely explained by the most easily identifiable sources of study heterogeneity(Zhang et al. (2018)). Further research is needed to better understand and addressthe impact of heterogeneity on predictor performances.
In this study, we focus on a particular component of study effects, knownas batch effects (Leek et al. (2010)), and aim to address its unwanted impact inbinary classification problems. Batch effects are variation across batches of datadue to differences in technical factors. Existence of batch effects threatens thereproducibility of genomic findings (Kupfer et al. (2012)). And therefore, it isnecessary to develop efficient methods to remove the unfavorable influence ofbatch effects.
Many batch effect adjustment methods have been proposed for gene expres-sion microarray (Leek and Storey (2007); Johnson et al. (2007); Gagnon-Bartschand Speed (2012); Gagnon-Bartsch et al. (2013); Benito et al. (2004)) and se-quencing data (Leek (2014); Risso et al. (2014)). These methods share the gen-eral idea to first merge all batches, estimate parameters representing differencesin batch distributions, and then remove them from the data, resulting in a singleadjusted dataset for downstream analysis. Here we adopt a different perspective,and propose to address batch effects with ensemble learning. Contrary to the tra-ditional batch effect adjustment methods, our proposed framework is based on
3
.CC-BY-NC-ND 4.0 International licenseIt is made available under a was not peer-reviewed) is the author/funder, who has granted bioRxiv a license to display the preprint in perpetuity.
The copyright holder for this preprint (which. http://dx.doi.org/10.1101/703587doi: bioRxiv preprint first posted online Jul. 20, 2019;
The Trial Version

the integration of predictions rather than that of data. This is a simpler task forprediction, as it operates in one dimension rather than many. Also, it is possibleto reward predictors that show good performance across batches and thus alto-gether ignore, rather than trying to repair, features that are preferentially affectedby batch effects.
Although ensemble learning is a well established method, it has only recentlybeen discussed in the context of training replicable predictors. Patil and Parmi-giani (2018) found that ensembles of learners trained on multiple studies gener-ate predictions with more replicable accuracy. In their framework, a cross-studylearner (CSL) is specified by three choices: a) a data subsetting strategy; b) a listof one or more single-study learners (SSLs), which can be any machine learningalgorithm producing a prediction model using a single study; and c) a combina-tion approach utilizing multiple prediction models to deliver a single predictionrule. In our case, we subset the data by batch, and use the same CSL with batchesin place of studies. Guan et al. (2019) provide theoretical insights in the compar-ison between merging and ensembling in training learners from multiple studies,and conclude that although merging studies is better than ensembling when thestudies are relatively homogeneous, ensembling yields better performing modelswhen the level of study heterogeneity is higher.
In this paper, we explore using ensemble learning in the context of batch effectadjustment for the first time. We provide both realistic simulations and real dataexamples to demonstrate the utility of our ensembling framework, and compare itwith traditional merging strategies for addressing batch effects.
Materials and methods
Addressing batch effects via ensemble learning
We structure the problem as follows: in a binary classification problem on ge-nomic data, we have a training set for learning prediction models (Strn), and an-
4
.CC-BY-NC-ND 4.0 International licenseIt is made available under a was not peer-reviewed) is the author/funder, who has granted bioRxiv a license to display the preprint in perpetuity.
The copyright holder for this preprint (which. http://dx.doi.org/10.1101/703587doi: bioRxiv preprint first posted online Jul. 20, 2019;
The Trial Version
other independent test set (Stst) where predictions are to be made. Subjects inthe training set are associated with a binary label indicating their phenotype. Ex-amples of the phenotype could be disease status (e.g. cancer versus normal) orresponse to a treatment. In addition, expressions of genes for all individuals areprofiled for use as predictors. Individuals in the test set also have measured geneexpressions, and the goal is to train a model that can accurately predict the diseaselabel for them based on their gene expression profiles. We assume that the trainingset is generated in B batches S1
trn, S2trn, ..., S
Btrn, possibly due to practical or tech-
nical restrictions. Each batch contains a sufficient number of samples to train aprediction model. We assume both additive and multiplicative batch effects (John-son et al. (2007)), which cause differences in the mean and the variance of geneexpressions across batches.
Consider a collection of L learning algorithms to use for training. Multi-studylearning begins by training each of the algorithms within each of the batches. Thisresults in the collection Y l
b (x) , l = 1, . . . , L and b = 1, . . . B, where Y lb (x) is the
prediction function trained on batch b with learning algorithm l. In the binaryclassification setting, Y are the probabilities of samples belonging to the positiveclass. The final cross-study learner’s (CSL) prediction is calculated by a weightedaverage of predictions from each model, that is:
Y (x) =L∑l=1
B∑b=1
wlbYlb (x) (1)
The performance of a CSL relies critically on the weights wlb, as these have thefunction of rewarding elements of the ensemble which show stable predictive per-formance across batches. We explore five weighting strategies, which fall intothree categories, as described in Patil and Parmigiani (2018). The first is sam-ple size weights, which uses scaled batch sizes as weights for models trained inthe corresponding batches, and makes not effort to reward robustness to batchesvia weights. The second is cross-study weights, for which we evaluate how welleach learned model performs when applied to the other batches within the training
5
.CC-BY-NC-ND 4.0 International licenseIt is made available under a was not peer-reviewed) is the author/funder, who has granted bioRxiv a license to display the preprint in perpetuity.
The copyright holder for this preprint (which. http://dx.doi.org/10.1101/703587doi: bioRxiv preprint first posted online Jul. 20, 2019;
The Trial Version

set, and assign higher weights to models that have better prediction performances.The last category is stacking regression weights (Breiman (1996)), for which weuse each model to make predictions of the training data, and estimate the weightsas regression coefficients between stacked predictions of the training samples andtheir labels. The association coefficients are estimated using non-negative leastsquares. A more detailed description of the weighting strategies is available in theSupplementary Materials.
Data
We use a collection of RNA-Seq and microarray studies targeting subjects infectedwith tuberculosis (TB) to apply and evaluate our ensemble learning method, andmake comparisons with the traditional strategy of batch adjustment followed bymerging (for short "merging"). Subjects involved in this collection of studies canbe divided in three phenotypes based on their disease progression status: 1) la-tent infection / non-progressing, 2) in “progression”, or those that will progressto disease in the near future, and 3) active TB disease. For simplicity and sam-ple size considerations, we use two types of patients in each analysis to form abinary classification problem, and focus on different phenotypes for simulationand application of our methods. In simulations, we focus on predicting progres-sors against non-progressors using publically available studies, as this separationyields the largest sample size in the training set. In real data, since there are noknown batch effects within any single study, we aim to separate subjects withlatent infection from those with active disease instead, so we have at least threestudies in the collection. We merge two studies for training while treating the dif-ferences between studies as "batch effects". Table 1 summarizes information onthe samples used in simulation studies and real data analysis.
6
.CC-BY-NC-ND 4.0 International licenseIt is made available under a was not peer-reviewed) is the author/funder, who has granted bioRxiv a license to display the preprint in perpetuity.
The copyright holder for this preprint (which. http://dx.doi.org/10.1101/703587doi: bioRxiv preprint first posted online Jul. 20, 2019;
The Trial Version

Data Platform #Subjects #Pos (Prevalence) Max(Age) References
Simulations Africa (Train) RNA-Seq 181 77 (42.5%) 18 Zak et al. (2016)GC6 (Test) RNA-Seq 399 95 (23.8%) 60 Suliman et al. (2018)
Application Africa RNA-Seq 120 16 (13.3%) 18 Zak et al. (2016)India RNA-Seq 44 25 (56.8%) 70 Leong et al. (2018)US microarray 70 35 (50%) 85 Walter et al. (2016)
Table 1: Summary statistics of the TB datasets used in simulation studiesand real data applications. #Subjects: total number of individuals in each study.#Pos: number of positive samples. They refer to progressors in simulation studies,and active patients in real data application. The negative samples are subjects withlatent infections in both cases. Prevalence: percentage of positive samples in thestudy. Max(Age): the maximum of age among all subjects enrolled in the studies.Note that the Africa study targets only adolescents between ages of 12 and 18,while the remaining studies have a wider range of age. The US study is generatedfrom Affymetrix Human Gene 1.1 ST Array, while the rest are RNA-Seq studies.
Simulation for comparing merging and ensembling
We consider the two datasets collected from the African population reported byZak et al. (2016) and Suliman et al. (2018), as described in Table 1. We useone of the two studies for training, and the other for prediction. For the trainingset only, we randomly assign individuals to disjoint subsets which will be simu-lated to be processing batches, and simulate differences in the moments of geneexpression distributions across batches as described below. No batch effects areadded to the validation set. We train predictors using both merging and ensem-bling on this dataset with simulated batch effects, then make predictions in theother independent study. We evaluate the two approaches using discrimination inthe independent study. Details follow.
Simulation of batch effects
We transformed the sequencing data into logFPKMs, and selected the top 1000genes with the highest variances for building the classifiers. Then, we randomlytook subsets of individuals from the training set to form 3 batches, each batch con-
7
.CC-BY-NC-ND 4.0 International licenseIt is made available under a was not peer-reviewed) is the author/funder, who has granted bioRxiv a license to display the preprint in perpetuity.
The copyright holder for this preprint (which. http://dx.doi.org/10.1101/703587doi: bioRxiv preprint first posted online Jul. 20, 2019;
The Trial Version
taining 10 non-progressors and 10 progressors. We then simulated batch effectsacross the 3 batches.
Our data generating model for batch effects is the linear model assumed in theComBat batch adjustment method (Johnson et al. (2007)). Specifically, we esti-mate two components from the original training data: 1) the expression of geneg among the negative samples, and 2) the biological effect (i.e. the expressionchanges due to biological perturbations or conditions of interest). We then specifybatch effect parameters affecting the mean (γgb) and the variance (δgb) of expres-sion in gene g caused by batch b. Same as in Johnson et al. (2007), γgb and δgb arerandomly drawn from hyper-distributions
γgb ∼ N (ηb, τ2b ), δgb ∼ InvGamma(λb, θb) (2)
ComBat assumes an additive batch effect for the mean, and a multiplicativebatch effect for the variance. To set the hyper-parameters, we first specify a valueto represent the severity of batch effects, as reported in columns "Batch Effecton Mean" (sevmean) and "Batch Effect on Variance" (sevvar) in Table 2. We se-lected 3 severity levels (sevmean ∈ {0, 3, 5}) for batch effect on the mean, and5 levels (sevvar ∈ {1, 2, 3, 4, 5}) for batch effect on variance. Given a severitylevel for batch effects, we fixed values for τbs and θbs, so that the variance ofγgb and δgb over genes are 0.01. We varied the mean of these two parameters, sothat the hyper mean ηb is (−sevmean, 0,+sevmean), and the hyper variance λb is(1/sevvar,
1/sevvar+sevvar2
, sevvar) for the three batches. The parameters are thenadded or multiplied to the expression mean and variance of the original study.The characteristics of simulated batches are also summarized in Table 2. Figure 1shows an example training set where we simulated 3 batches with both mean andvariance differences.
8
.CC-BY-NC-ND 4.0 International licenseIt is made available under a was not peer-reviewed) is the author/funder, who has granted bioRxiv a license to display the preprint in perpetuity.
The copyright holder for this preprint (which. http://dx.doi.org/10.1101/703587doi: bioRxiv preprint first posted online Jul. 20, 2019;
The Trial Version

Batch Effect on Mean (sevmean) Batch 1 mean Batch 2 mean Batch 3 mean
0 3.7 3.7 3.73 0.7 3.7 6.75 -1.3 3.7 8.7
Batch Effect on Variance (sevvar) Batch 1 variance Batch 2 variance Batch 3 variance
1 1.12 1.50 1.292 0.56 1.55 2.813 0.52 2.21 3.194 0.39 2.49 4.815 0.31 3.17 5.98
Table 2: Levels of simulated batch effects in mean and variance of gene ex-pression. We created mean shifts and fold changes (FC) in average variances ofgenes across the three simulated batches. ComBat assumes additive batch effectfor the mean expression. For example, a batch effect on the mean of 3 meansthat we subtract 3 on average from expressions in batch 1, and add 3 on averageto expression values in batch 3. Values in batch 2 are not altered. On the otherhand, batch effect on the variance is multiplicative. So a batch effect of 4 on thevariance means that in batch 1, the average gene variance is reduced to 1/4 of theoriginal variance in data, while in batch 3, the average variance is inflated 4 times.Variance of batch 2 is changed to an intermediate level. The first column recordsthe parameters we used in simulations, and correspond to the titles in Figure 2.The remaining three columns show the moments of distributions from examplesimulated data.
Comparing ensemble learning with merging after batch correction
We then use the dataset with simulated batch effects to train classifiers for predict-ing patient phenotypes. We perform the ensemble learning strategy as describedabove. For the merging strategy, we pooled the three batches together, and ap-plied ComBat to remove batch effects. We then used the whole adjusted data totrain a single model, and make one set of predictions on the independent test set.We trained learners LASSO (Tibshirani (1996)), Random Forest (RF, Breiman(2001)), and Support Vector Machines (SVM, Cortes and Vapnik (1995)), afterperforming the two batch adjustment strategies. In ensemble learning, we evalu-ated aggregating predictions both from a single learning algorithm (L = 1), and
9
.CC-BY-NC-ND 4.0 International licenseIt is made available under a was not peer-reviewed) is the author/funder, who has granted bioRxiv a license to display the preprint in perpetuity.
The copyright holder for this preprint (which. http://dx.doi.org/10.1101/703587doi: bioRxiv preprint first posted online Jul. 20, 2019;
The Trial Version
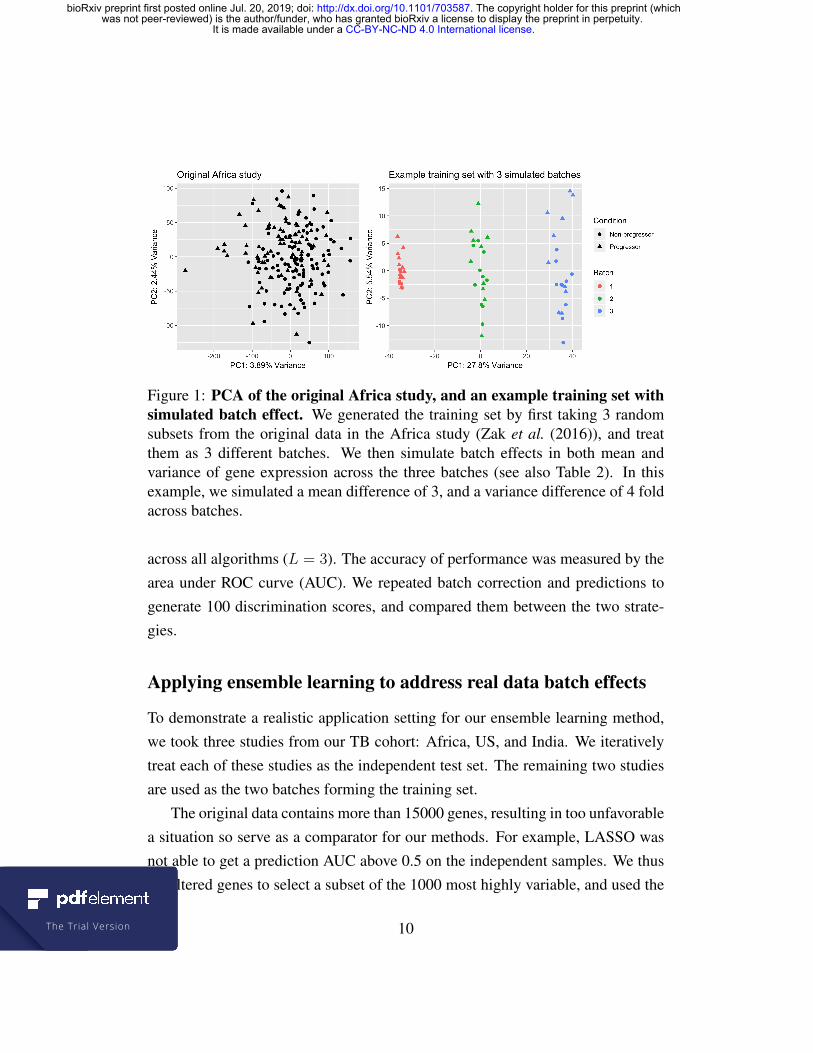
Figure 1: PCA of the original Africa study, and an example training set withsimulated batch effect. We generated the training set by first taking 3 randomsubsets from the original data in the Africa study (Zak et al. (2016)), and treatthem as 3 different batches. We then simulate batch effects in both mean andvariance of gene expression across the three batches (see also Table 2). In thisexample, we simulated a mean difference of 3, and a variance difference of 4 foldacross batches.
across all algorithms (L = 3). The accuracy of performance was measured by thearea under ROC curve (AUC). We repeated batch correction and predictions togenerate 100 discrimination scores, and compared them between the two strate-gies.
Applying ensemble learning to address real data batch effects
To demonstrate a realistic application setting for our ensemble learning method,we took three studies from our TB cohort: Africa, US, and India. We iterativelytreat each of these studies as the independent test set. The remaining two studiesare used as the two batches forming the training set.
The original data contains more than 15000 genes, resulting in too unfavorablea situation so serve as a comparator for our methods. For example, LASSO wasnot able to get a prediction AUC above 0.5 on the independent samples. We thusprefiltered genes to select a subset of the 1000 most highly variable, and used the
10
.CC-BY-NC-ND 4.0 International licenseIt is made available under a was not peer-reviewed) is the author/funder, who has granted bioRxiv a license to display the preprint in perpetuity.
The copyright holder for this preprint (which. http://dx.doi.org/10.1101/703587doi: bioRxiv preprint first posted online Jul. 20, 2019;
The Trial Version

same subsets of genes for both ensembling and merging.We trained 3 learning algorithms: LASSO, RF, and SVM, and integrated pre-
dictions from all three learning algorithms in the ensemble framework. The re-maining methods for batch effect adjustment, predictions, and model evaluationsare the same as those for simulation studies. We performed 100 bootstrap repli-cates on the test set, to obtain a confidence interval for model performance scores.
Results
Impact of mean and variance batch effects on discrimination ofpredictions
Figure 2 summarizes results over 100 simulated datasets, representative of thepatterns we observe across simulation studies. The learner is Random Forests forboth merging and ensembling. On the original training study without simulatedbatch effect, Random Forests achieve a 0.685 AUC on the test set. When addingbatch effects to the data, we observed drops in discrimination in the test set. Meanand variance batch effects affect prediction performance in different ways. Modeldiscrimination is not strongly affected by batch if batch effect only affect the vari-ance. A sufficient size of the mean differences across batches in the training set isnecessary to cause a drop in prediction accuracy. On the other hand, when batchaffects the means, an increase in variance differences across batches will lead to afurther drop in discrimination.
Ensemble learning achieves higher discrimination than mergingafter a turning point on the severity of batch effects
Table 2 shows the levels of batch differences we created in simulation studies,corresponding to the results in Figure 2. We considered ensembling both using asingle learning algorithm, and using all three learning algorithms together, and we
11
.CC-BY-NC-ND 4.0 International licenseIt is made available under a was not peer-reviewed) is the author/funder, who has granted bioRxiv a license to display the preprint in perpetuity.
The copyright holder for this preprint (which. http://dx.doi.org/10.1101/703587doi: bioRxiv preprint first posted online Jul. 20, 2019;
The Trial Version

Figure 2: Comparison between ensembling and merging when using RandomForests. 3 out of our 5 choices of ensembling weights are displayed: batch sizeweights, cross-study weights, and stacking regression weights (See the Methodssection for details). A full comparison using all 5 weighting methods, and a morerefined grid of mean and variance differences, is in Supplementary Figure S3.
observed similar results. At a low level of batch effects, with no mean differenceand a variance fold change smaller than 3, the merging method yields better dis-crimination. However, we observed a turning point in the severity of batch effect,after which ensemble learning starts to achieve higher discrimination.
The turning point in the magnitude of batch effects differs by the selectedlearning algorithms. Supplementary Figures S2, S3 and S4 show the simulation
12
.CC-BY-NC-ND 4.0 International licenseIt is made available under a was not peer-reviewed) is the author/funder, who has granted bioRxiv a license to display the preprint in perpetuity.
The copyright holder for this preprint (which. http://dx.doi.org/10.1101/703587doi: bioRxiv preprint first posted online Jul. 20, 2019;
The Trial Version

results of training with all algorithms. When training with SVM, for example, wesee that discrimination from ensemble learning is already comparable with thatusing the merging method at no mean batch effect and a variance fold change of2, though at this level, merging still out-performs ensembling when training withRandom Forests. Also, at high level of batch discrepancies, stacking regressionweights yield better prediction results than the sample-size weights when buildingensemble with SVM alone, though they are more comparable when using RandomForests.
We also observed that ensembling across different learning algorithms doesnot necessarily improve the final prediction compared to ensembling with a sin-gle algorithm. We see in Figure 2 that ensemble learning across learning algo-rithms generates worse performance than using only Random Forests. The opti-mal weighting approach also depends on the learners involved in the ensemble.When using Random Forests only, the sample-size weights and the stacked re-gression weights generate better accuracy than the cross-study weights. But thelatter is better in integrating across all algorithms. Note that despite the differencein rankings of the three types of weights, all three ensemble weighting methodsout-perform merging and batch correction with ComBat at high level of batchdifferences.
Finally, we repeated the simulations with a larger sample size, and larger num-ber of batches. To increase batch size, we took 3 subsets as batches, each contain-ing 20 non-progressors and 20 progressors, in contrast to our previous resultswhich use 10 individuals per condition per batch. For a larger number of batches,we took 5 subsets of subjects as simulated batches. We observed consistent pat-terns in both situations, as shown in Figure 3 and Supplementary Figure S5.
Application to predicting tuberculosis disease phenotype
We now present a classification case study using real data with batch effects.Specifically, we selected three batches from the TB cohort, and iteratively treatone as test set, and use the other two as two batches for training. We applied both
13
.CC-BY-NC-ND 4.0 International licenseIt is made available under a was not peer-reviewed) is the author/funder, who has granted bioRxiv a license to display the preprint in perpetuity.
The copyright holder for this preprint (which. http://dx.doi.org/10.1101/703587doi: bioRxiv preprint first posted online Jul. 20, 2019;
The Trial Version

Figure 3: Comparison of results between batch sizes N=20 and N=40. In bothcases, we have a completely balanced study design in each of the 3 batches. ForN=20, we randomly sample 10 positive and 10 negative samples. For N=40, wesample 20 in each class. In both sample sizes, we observe that merging out-performs ensembling with smaller batch effects. However, as those increase, en-sembling gains better discrimination.
ensembling and merging to address batch effects, and trained 3 types of learningalgorithms. Ensemble prediction are aggregated from all algorithms. To obtaina confidence interval of model performance, we generated 100 bootstrap samplesfrom the test set.
Figure 4 shows the average AUC across the 100 bootstrap replicates, obtainedfrom predictions in each of the three studies. The error bars in the figure dis-play 95% confidence intervals. We observed that, except for the stacking weightswhen the US is the test set, the average AUC of ensembling using any of the threetypes of weights is better than that of merging in all studies. When using stack-ing weights and US as the test set, we found that ensemble assigns most of the
14
.CC-BY-NC-ND 4.0 International licenseIt is made available under a was not peer-reviewed) is the author/funder, who has granted bioRxiv a license to display the preprint in perpetuity.
The copyright holder for this preprint (which. http://dx.doi.org/10.1101/703587doi: bioRxiv preprint first posted online Jul. 20, 2019;
The Trial Version
weights to the SVM model trained from the Africa study (Supplementary FigureS6). This model achieves accurate discrimination in both Africa and India, thetwo batches for training, while inferior preference in US compared to the othermodels (Supplementary Table S1). As a result, stacking weights generate lessfavorable predictions than cross-study weights, where weights are more evenlyspread across the single learners. Cross-study weights only consider predictionperformance across studies, while stacking weights, at least as implemented here,consider both within and across study performance. With only two studies, theimportance given by stacking weights to cross-study performance is at its mini-mum. As a result this method is more vulnerable to overfitting than cross-studyweighting.
Due to the relatively small sample size in the US and India studies, we alsoobserved a high variance in model performance, especially when Africa is usedas the test set. Therefore, we also compared ensembling against merging withineach bootstrap sample. The proportion of bootstrap samples where ensemblinggenerates strictly higher AUC than merging are summarized in Table 3, whichshows that in all three test sets, addressing batch effects via ensemble learn-ing yields better-performing models with respect to discrimination. Batch-sizeweights, while not explicitly trained to reward cross-study replicability, are moreconsistently outperforming merging than other weights in this dataset, likely be-cause of the challenges in learning weights with a small number of batches. Theseresults are broadly consistent with our observations in simulations that when thereare severe differences across batches, ensemble learning is the better strategy toaddress the impact of batch effects on prediction.
Discussion and Conclusions
We proposed a novel perspective for addressing batch effects when developing ge-nomic classifiers. Our proposal is to use multi-study ensemble learning, treatingbatches as separate studies. We provided both realistic simulations and real data
15
.CC-BY-NC-ND 4.0 International licenseIt is made available under a was not peer-reviewed) is the author/funder, who has granted bioRxiv a license to display the preprint in perpetuity.
The copyright holder for this preprint (which. http://dx.doi.org/10.1101/703587doi: bioRxiv preprint first posted online Jul. 20, 2019;
The Trial Version

Figure 4: Application of ensemble learning to predicting active TB againstlatent infection. We iteratively select one of the three studies in Table 1 as theindependent test study. The remaining two studies are viewed as two "batches" inthe training set. The two batches in this setting represent a strong level of batch ef-fects. We trained LASSO, Random Forest, and SVM, then aggregated predictionsfrom all three algorithms to construct the ensemble. The figure shows averageprediction performance over 100 bootstrap samples of the test data, with errorbars showing 95% confidence intervals of performance measures. Except whenusing stacking weights to predict on the US study, the average performance usingthe three ensemble strategies are better than the merging strategy. Comparisonswithin each bootstrap sample are summarized in Table 3.
Test set Batch size weights Cross-study weights Stacking regression weights
Africa 97% 91% 94%India 84% 48% 76%US 73% 85% 20%
Table 3: Percentages of bootstrap test samples where ensembling yieldsstrictly higher AUC than merging and batch adjustment. Rows indicate vali-dation datasets (see caption to Figure 4) and columns indicate ensembling meth-ods, each compared to merging.
application examples to compare the ensembling method with the traditional ap-proach, which is to analyze all batched together to remove batch effects, and usethe adjusted data for prediction. We observed in both simulations and real datathat, though merging is able to generate better performing models when batch ef-
16
.CC-BY-NC-ND 4.0 International licenseIt is made available under a was not peer-reviewed) is the author/funder, who has granted bioRxiv a license to display the preprint in perpetuity.
The copyright holder for this preprint (which. http://dx.doi.org/10.1101/703587doi: bioRxiv preprint first posted online Jul. 20, 2019;
The Trial Version

fects are modest, ensemble learning achieves better discrimination in independentvalidation after a certain level of severity of batch effects. We explored differenttraining algorithms, different batch sizes and number of batches, and observedconsistent patterns of such transition. The specific level of batch severity wherethe transition happens differs by the algorithm. These observations are consistentwith those described in Guan et al. (2019), which provides theoretical insights intothe comparison between merging and ensembling in training cross-study learners.
The philosophy behind the standard approach of merging and batch adjust-ment is to remove the undesired batch-associated variation from as many of thegenomic features as feasible, and then use the "cleaned" data in classification asthough the batch effects never existed. This has been the standard in the literatureand can be quite successful (Riester et al. (2014); Luo et al. (2010); Engchuanet al. (2016)). Multi-study ensemble learning provides a different perspective:ensemble weights reward prediction functions that, while trained in one batch,continue to predict well in other batches. These are likely to avoid using featuresaffected by batch effect, in contrast to cleaning them.
Our results emphasize the importance of understanding the heterogeneity in-troduced by batches before developing a classifier. Since the approach whichresults in better prediction accuracy changes by the level of heterogeneity, wesuggest careful diagnostics of the level of heterogeneity in the dataset, beforechoosing the learning approach. There are established methods to detect the de-gree of batch effects in data. For example, BatchQC (Manimaran et al. (2016))offers sample and gene-wise statistical tests to explore mean, variance, as wellas higher-order moments in batch distributions, and provides useful visualizationtools to describe the severity of batch effects in data.
In simulations, we compared ensembles based on a single learning algorithm,to one based on multiple algorithms. Though the latter represents the commonperspective of ensemble in practice, we found that integrating across multiplelearning algorithms does not necessarily improve prediction performances thanusing a single algorithm. We also compared five kinds of weighting strategies to
17
.CC-BY-NC-ND 4.0 International licenseIt is made available under a was not peer-reviewed) is the author/funder, who has granted bioRxiv a license to display the preprint in perpetuity.
The copyright holder for this preprint (which. http://dx.doi.org/10.1101/703587doi: bioRxiv preprint first posted online Jul. 20, 2019;
The Trial Version

integrate the predictions. The ranking of performance using different weightingstrategies also depends on the specific dataset and algorithm. Additionally, therecould be ways to further improve the ensemble performance by developing otherweighting methods that are not considered in this study. All ensembles consideredare very small, because the number of batches B and the number or learners L areboth small. Recently Ramchandran et al. (2019) compared an ensemble strategybased on RF to one based on cross-study weighting of the component trees in theRF, showing improvements from direct reweighting of trees. This method mayalso prove effective in our context, as individual trees are more parsimonious thanthe whole forest, and may more effectively avoid features affected by batches.
Our study has several limitations. First, the ensemble learning approach re-quires that each batch contains sufficient samples to train a prediction function.This assumption may limit our approach to sufficiently large datasets. However,most if not all batch effect adjustment strategies require a reasonable number ofsamples in each batch to accurately and robustly estimate batch effects. Havinglimited number of samples in a batch will negatively affect not only our proposedmethods, but also the traditional methods based on merging. We speculate thatmethods like ComBat might, however, be able to effectively operate with smallerbatches than ensembling.
We focused on using ComBat for batch effect adjustment after merging. Com-Bat is not the only option, but remains one of the most popular batch effect ad-justment methods, especially in the case with known sources of batch effect. Oursimulations of batch effects are all based on the generative model of ComBat,which, while plausible, is one among many possible models. Using the samebatch effect model for data generation and analysis provides a lower bound to theeffectiveness of our proposal, as any other data generating approach would be lessfavorable to ComBat than the one we used. In data from other generating mecha-nisms, the advantages of ensembling should be more pronounced, and may set inat lower levels of batch effects.
We provided a realistic application example using the tuberculosis studies. Re-
18
.CC-BY-NC-ND 4.0 International licenseIt is made available under a was not peer-reviewed) is the author/funder, who has granted bioRxiv a license to display the preprint in perpetuity.
The copyright holder for this preprint (which. http://dx.doi.org/10.1101/703587doi: bioRxiv preprint first posted online Jul. 20, 2019;
The Trial Version

stricted by the study design of this collection of studies, we showed an examplewith 2 batches, and relatively small batch sizes in two batches. It would be inter-esting to further explore our approach on data with larger batch sizes, or a largernumber of batches. Ours are somewhat extreme conditions for this type of analy-sis. Larger batches facilitate both the estimation of batch effects and the trainingof batch-specific predictors. A larger number of batches facilitates learning aboutthe higher level distributions in ComBat, and would afford ensemling a better op-portunity to find stable signal across a larger number of batches, a strength of themethod that is not highlighted here.
Related, treating two studies as batches mimics a high level of batch differ-ences, for the discrepancy between the two "batches" in this setting includes bothbiological and technical differences. Thus we include more sources of hetero-geneity than normally considered as batch effect. Specifically, a batch effect isusually defined as variations originated from technical differences across repeatedexperiments performed on the same platform, such as differences in lab environ-ment, protocols or reagents. In our application example, however, each batchtargets a different population, which means there likely exists additional geneticvariations across the groups. Also, the three studies are generated on differentplatforms. The African cohort was sequenced on Illumina HiSeq 2000, the Indianstudy was produced on Illumina NextSeq 500, and the US study used microarray(Affymetrix Human Gene 1.1 ST Array). Differences across these technologiesare also beyond what is typically considered as batch effects. Despite that, webelieve this example is still helpful to illustrate our methodology, and our obser-vations offer valuable practical guidelines in addressing batch effects in genomicclassifier development.
Reproducibility
Code to reproduce the results in this paper is available at https://github.com/zhangyuqing/bea_ensemble.
19
.CC-BY-NC-ND 4.0 International licenseIt is made available under a was not peer-reviewed) is the author/funder, who has granted bioRxiv a license to display the preprint in perpetuity.
The copyright holder for this preprint (which. http://dx.doi.org/10.1101/703587doi: bioRxiv preprint first posted online Jul. 20, 2019;
The Trial Version

Acknowledgement
This work is supported by grants NSF-DMS 1810829 and NIH-NCI 4P30CA006516-51 (Giovanni Parmigiani) and 5R01GM127430-02 (W. Evan Johnson).
References
Badani, K. K., Thompson, D. J., Brown, G., Holmes, D., Kella, N., Albala, D.,Singh, A., Buerki, C., Davicioni, E., and Hornberger, J. (2015). Effect of agenomic classifier test on clinical practice decisions for patients with high-riskprostate cancer after surgery. BJU international, 115(3), 419–429.
Benito, M., Parker, J., Du, Q., Wu, J., Xiang, D., Perou, C. M., and Marron,J. S. (2004). Adjustment of systematic microarray data biases. Bioinformatics,20(1), 105–114.
Bernau, C., Riester, M., Boulesteix, A.-L., Parmigiani, G., Huttenhower, C., Wal-dron, L., and Trippa, L. (2014). Cross-study validation for the assessment ofprediction algorithms. Bioinformatics, 30(12), i105–i112.
Breiman, L. (1996). Stacked regressions. Machine Learning, 24(1), 49–64.
Breiman, L. (2001). Random forests. Machine Learning, 45(1), 5–32.
Chang, L.-B. and Geman, D. (2015). Tracking cross-validated estimates of pre-diction error as studies accumulate. Journal of the American Statistical Associ-
ation, 110(511), 1239–1247.
Cortes, C. and Vapnik, V. (1995). Support-vector networks. Machine learning,20(3), 273–297.
Engchuan, W., Meechai, A., Tongsima, S., and Chan, J. H. (2016). Handlingbatch effects on cross-platform classification of microarray data. International
Journal of Advanced Intelligence Paradigms, 8(1), 59–76.
20
.CC-BY-NC-ND 4.0 International licenseIt is made available under a was not peer-reviewed) is the author/funder, who has granted bioRxiv a license to display the preprint in perpetuity.
The copyright holder for this preprint (which. http://dx.doi.org/10.1101/703587doi: bioRxiv preprint first posted online Jul. 20, 2019;
The Trial Version

Gagnon-Bartsch, J. A. and Speed, T. P. (2012). Using control genes to correct forunwanted variation in microarray data. Biostatistics, 13(3), 539–552.
Gagnon-Bartsch, J. A., Jacob, L., and Speed, T. P. (2013). Removing unwantedvariation from high dimensional data with negative controls. Berkeley: Tech
Reports from Dep Stat Univ California, pages 1–112.
Golub, T. R., Slonim, D. K., Tamayo, P., Huard, C., Gaasenbeek, M., Mesirov,J. P., Coller, H., Loh, M. L., Downing, J. R., Caligiuri, M. A., et al. (1999).Molecular classification of cancer: class discovery and class prediction by geneexpression monitoring. science, 286(5439), 531–537.
Guan, Z., Parmigiani, G., and Patil, P. (2019). Merging versus ensembling inmulti-study machine learning: Theoretical insight from random effects. arXiv
preprint arXiv:1905.07382.
Johnson, W. E., Li, C., and Rabinovic, A. (2007). Adjusting batch effects inmicroarray expression data using empirical bayes methods. Biostatistics, 8(1),118–127.
Kupfer, P., Guthke, R., Pohlers, D., Huber, R., Koczan, D., and Kinne, R. W.(2012). Batch correction of microarray data substantially improves the identifi-cation of genes differentially expressed in rheumatoid arthritis and osteoarthri-tis. BMC medical genomics, 5(1), 23.
Leek, J. T. (2014). Svaseq: removing batch effects and other unwanted noise fromsequencing data. Nucleic acids research, 42(21), e161–e161.
Leek, J. T. and Storey, J. D. (2007). Capturing heterogeneity in gene expressionstudies by surrogate variable analysis. PLoS genetics, 3(9), e161.
Leek, J. T., Scharpf, R. B., Bravo, H. C., Simcha, D., Langmead, B., Johnson,W. E., Geman, D., Baggerly, K., and Irizarry, R. A. (2010). Tackling thewidespread and critical impact of batch effects in high-throughput data. Na-
ture Reviews Genetics, 11(10), 733.
21
.CC-BY-NC-ND 4.0 International licenseIt is made available under a was not peer-reviewed) is the author/funder, who has granted bioRxiv a license to display the preprint in perpetuity.
The copyright holder for this preprint (which. http://dx.doi.org/10.1101/703587doi: bioRxiv preprint first posted online Jul. 20, 2019;
The Trial Version

Leong, S., Zhao, Y., Joseph, N. M., Hochberg, N. S., Sarkar, S., Pleskunas, J.,Hom, D., Lakshminarayanan, S., Horsburgh Jr, C. R., Roy, G., et al. (2018).Existing blood transcriptional classifiers accurately discriminate active tuber-culosis from latent infection in individuals from south india. Tuberculosis, 109,41–51.
Luo, J., Schumacher, M., Scherer, A., Sanoudou, D., Megherbi, D., Davison, T.,Shi, T., Tong, W., Shi, L., Hong, H., et al. (2010). A comparison of batch ef-fect removal methods for enhancement of prediction performance using maqc-iimicroarray gene expression data. The pharmacogenomics journal, 10(4), 278.
Ma, S., Sung, J., Magis, A. T., Wang, Y., Geman, D., and Price, N. D. (2014).Measuring the effect of inter-study variability on estimating prediction error.PloS one, 9(10), e110840.
Manimaran, S., Selby, H. M., Okrah, K., Ruberman, C., Leek, J. T., Quacken-bush, J., Haibe-Kains, B., Bravo, H. C., and Johnson, W. E. (2016). Batchqc:interactive software for evaluating sample and batch effects in genomic data.Bioinformatics, 32(24), 3836–3838.
Papaemmanuil, E., Gerstung, M., Bullinger, L., Gaidzik, V. I., Paschka, P.,Roberts, N. D., Potter, N. E., Heuser, M., Thol, F., Bolli, N., et al. (2016).Genomic classification and prognosis in acute myeloid leukemia. New England
Journal of Medicine, 374(23), 2209–2221.
Patil, P. and Parmigiani, G. (2018). Training replicable predictors in multiplestudies. Proceedings of the National Academy of Sciences, 115(11), 2578–2583.
Ramchandran, M., Patil, P., and Parmigiani, G. (2019). Tree-weighting for multi-study ensemble learners. bioRxiv, 33(1), 698779.
Riester, M., Wei, W., Waldron, L., Culhane, A. C., Trippa, L., Oliva, E., Kim, S.-h., Michor, F., Huttenhower, C., Parmigiani, G., et al. (2014). Risk prediction
22
.CC-BY-NC-ND 4.0 International licenseIt is made available under a was not peer-reviewed) is the author/funder, who has granted bioRxiv a license to display the preprint in perpetuity.
The copyright holder for this preprint (which. http://dx.doi.org/10.1101/703587doi: bioRxiv preprint first posted online Jul. 20, 2019;
The Trial Version

for late-stage ovarian cancer by meta-analysis of 1525 patient samples. JNCI:
Journal of the National Cancer Institute, 106(5).
Risso, D., Dudoit, S., Risso, M. D., Biobase, D., BiocStyle, S., and biocViewsDifferentialExpression, P. (2014). Package ‘ruvseq’.
Seib, K. L., Dougan, G., and Rappuoli, R. (2009). The key role of genomicsin modern vaccine and drug design for emerging infectious diseases. PLoS
genetics, 5(10), e1000612.
Silvestri, G. A., Vachani, A., Whitney, D., Elashoff, M., Porta Smith, K., Fergu-son, J. S., Parsons, E., Mitra, N., Brody, J., Lenburg, M. E., et al. (2015). Abronchial genomic classifier for the diagnostic evaluation of lung cancer. New
England Journal of Medicine, 373(3), 243–251.
Simon, R., Radmacher, M. D., Dobbin, K., and McShane, L. M. (2003). Pitfalls inthe Use of DNA Microarray Data for Diagnostic and Prognostic Classification.Journal of the National Cancer Institute, 95, 14–18.
Suliman, S., Thompson, E. G., Sutherland, J., Weiner 3rd, J., Ota, M. O., Shankar,S., Penn-Nicholson, A., Thiel, B., Erasmus, M., Maertzdorf, J., et al. (2018).Four-gene pan-african blood signature predicts progression to tuberculosis.American journal of respiratory and critical care medicine, 197(9), 1198–1208.
Tibshirani, R. (1996). Regression shrinkage and selection via the lasso. Journal
of the Royal Statistical Society: Series B (Methodological), 58(1), 267–288.
Walter, N. D., Miller, M. A., Vasquez, J., Weiner, M., Chapman, A., Engle, M.,Higgins, M., Quinones, A. M., Rosselli, V., Canono, E., et al. (2016). Bloodtranscriptional biomarkers for active tuberculosis among patients in the unitedstates: a case-control study with systematic cross-classifier evaluation. Journal
of clinical microbiology, 54(2), 274–282.
Zak, D. E., Penn-Nicholson, A., Scriba, T. J., Thompson, E., Suliman, S., Amon,L. M., Mahomed, H., Erasmus, M., Whatney, W., Hussey, G. D., et al. (2016).
23
.CC-BY-NC-ND 4.0 International licenseIt is made available under a was not peer-reviewed) is the author/funder, who has granted bioRxiv a license to display the preprint in perpetuity.
The copyright holder for this preprint (which. http://dx.doi.org/10.1101/703587doi: bioRxiv preprint first posted online Jul. 20, 2019;
The Trial Version
A blood rna signature for tuberculosis disease risk: a prospective cohort study.The Lancet, 387(10035), 2312–2322.
Zhang, Y., Bernau, C., Parmigiani, G., and Waldron, L. (2018). The impact ofdifferent sources of heterogeneity on loss of accuracy from genomic predictionmodels. Biostatistics (Oxford, England).
24
.CC-BY-NC-ND 4.0 International licenseIt is made available under a was not peer-reviewed) is the author/funder, who has granted bioRxiv a license to display the preprint in perpetuity.
The copyright holder for this preprint (which. http://dx.doi.org/10.1101/703587doi: bioRxiv preprint first posted online Jul. 20, 2019;
The Trial Version