robustness b. c. d. culture, context, and the taste for ...luttmer/cultureandredistribution.pdf ·...
TRANSCRIPT

157
American Economic Journal: Economic Policy 3 (February 2011): 157–179http://www.aeaweb.org/articles.php?doi=10.1257/pol.3.1.157
P references for redistribution vary in systematic ways across countries. Individuals in European countries tend to have stronger redistributive prefer-
ences than people in the United States (see e.g., Alberto Alesina, Edward Glaeser, and Bruce Sacerdote 2001; Alesina and Glaeser 2004), and individuals in former socialist countries tend to have stronger preferences than those in Western nations (Giacomo Corneo and Hans P. Grüner 2002). These preferences ultimately underlie the tax and transfer systems chosen by governments, so understanding their deter-minants is of fundamental importance. The persistence of cross-country differences suggests that redistributive preferences may have an important cultural component,1 and this possibility has been noted in the literature (e.g., Corneo 2001; Alesina and Glaeser 2004). However, isolating the effects of culture from contemporaneous effects of the economic and institutional environment is challenging. This paper pro-vides evidence on the effect of culture on preferences for income redistribution by examining the determinants of preferences among immigrants across 32 countries.
1 We follow Luigi Guiso, Paola Sapienza, and Luigi Zingales (2006) in defining culture as “those customary beliefs and values that ethnic, religious, and social groups transmit fairly unchanged from generation to generation.”
* Luttmer: Department of Economics, Dartmouth College, Hanover, NH 03755 (e-mail: [email protected]); Singhal: John F. Kennedy School of Government, Harvard University, 79 John F. Kennedy Street, Cambridge, MA 02138 (e-mail: [email protected]). We thank George Borjas, Paola Giuliano, Ed Glaeser, Rafael Marques, seminar participants at Brown University, Cornell University, Harvard University, the University of Wisconsin, the National Tax Association meetings, the NBER workshop on Income Distribution and Macroeconomics, and two anonymous reviewers for helpful comments. We thank Octavia Foarta, Andra Hibbert, Jill Gentry Leandro, Adam Ruder, and Abdul Tariq for excellent research assistance. Erzo Luttmer gratefully acknowledges funding from the Taubman Center for State and Local Government and the National Institute on Aging through Grant Number T32-AG00186 to the National Bureau of Economic Research. Monica Singhal grate-fully acknowledges funding from the Taubman Center for State and Local Government and the Weatherhead Center for International Affairs. All errors are our own.
† To comment on this article in the online discussion forum, or to view additional materials, visit the article page at http://www.aeaweb.org/articles.php?doi=10.1257/pol.3.1.157.
Culture, Context, and the Taste for Redistribution†
By Erzo F. P. Luttmer and Monica Singhal*
Is culture an important determinant of preferences for redistribution? To separate culture from the economic and institutional environment (“context”), we relate immigrants’ redistributive preferences to the average preference in their birth countries. We find a strong posi-tive relationship that is robust to rich controls for economic factors and cannot easily be explained by selective migration. This effect is as large as that of own household income and appears stronger for those less assimilated into the destination country. Immigrants from high-preference countries are more likely to vote for more pro-redistribution parties. The effect of culture persists strongly into the second generation. (JEL H23, Z13)
ContentsCulture, Context, and the Taste for Redistribution† 157
I. Empirical Strategy 161II. Data 164III. Results 166A. Determinants of Preferences for Redistribution 166B. Robustness Analysis 168C. Heterogeneity 170D. Cultural Effects and Voting Behavior 173E. Intergenerational Transmission of Preferences 174IV. Conclusion 176References 178

158 AmERICAn EConomIC JouRnAL: EConomIC PoLICy FEBRuARy 2011
If preferences were based solely on current context, then the preference for redis-tribution in an immigrant’s country of origin should not matter after controlling for relevant factors in the country of residence. However, it is possible that immigrants take cultural values with them from their countries of origin, and that these cultural values affect preferences for redistribution, regardless of current context.2
Voting patterns during the large waves of immigration into the United States dur-ing the nineteenth century suggest that immigrants were influenced by home country culture. Political allegiances during this time were often sharply split along ethnic lines (Richard L. McCormick 1974), and attitudes toward government did appear to reflect the prevailing attitudes in immigrants’ countries of origin. Lee Benson (1966, 298–299), for example, argues that Dutch immigrants in New York “abided by their fathers’ faith in state rights and negative government” and therefore sup-ported the Democratic Party, which “preached the doctrines of the negative liberal state and state rights.” Immigrants from Scandinavia and Germany were often sup-porters of early progressive movements, such as socialist political parties. Seymour M. Lipset and Gary Marks (2000, 139–140) note that “the leadership of Germans in the American socialist movement has been linked to the political sources of emi-gration from Germany … The German Social Democratic Party was the strongest socialist movement in the world before World War I, and many newcomers brought their ideological sympathies to America.” These anecdotes suggest a persistent cultural component to political preferences. Our empirical analysis formalizes this relationship by relating the preferences of contemporary immigrants to attitudes in their birth countries.
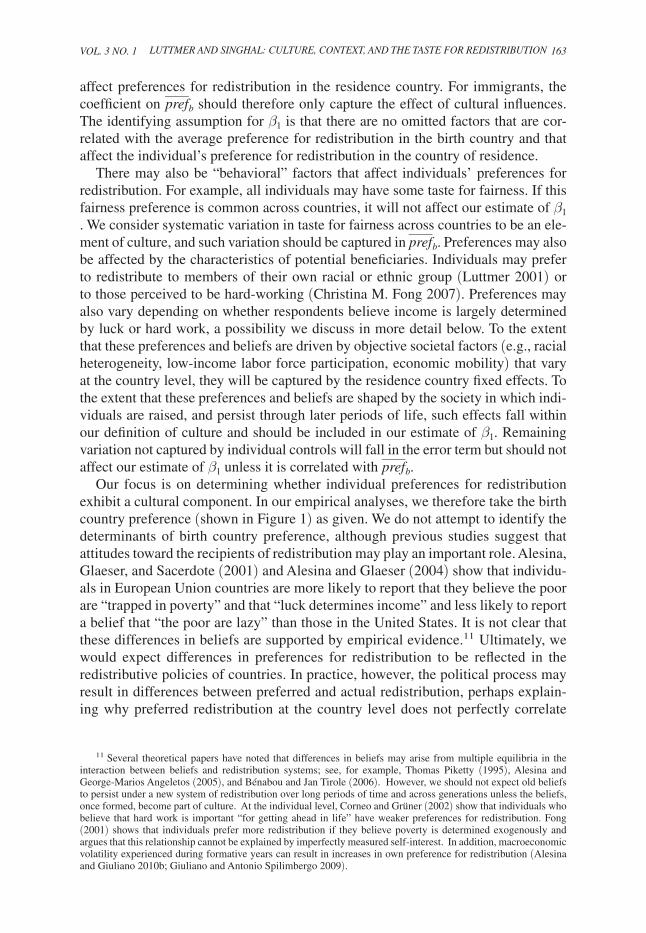
We find that the average preference for redistribution in an immigrant’s country of birth has a large and significant effect on her own preference for redistribution. Our main findings can be illustrated in Figure 1, which plots individual preference for redistribution (in deviation from the mean preference of natives in the country of residence) against the mean preference of natives in the immigrant’s country of birth. Preferences for redistribution are measured on a five-point scale, and each point on the graph represents the average for all immigrants born in a particular country, irrespective of the current country of residence. Immigrants born in a coun-try with a high preference for redistribution tend to have higher preferences for redistribution than the natives of the countries in which they reside.
This relationship is verified in the regression analyses, where we include country of residence dummies and rich controls for economic and demographic character-istics. We find that a one unit increase in the mean preference for redistribution in an immigrant’s country of birth is associated with a 0.34 unit increase in her own preference for redistribution.3 Our estimates imply that the effect of culture
2 Alberto Bisin and Thierry Verdier (2004) identify an alternative channel through which culture can affect the amount of redistribution: the cultural transmission of values associated with “work ethic” will affect the level of redistribution that the political equilibrium can sustain.
3 Note that a possible concern with Figure 1 is that the preferences of natives could potentially be affected by the preferences of immigrants. This is of less concern in the regression analyses: in these specifications, we include residence country fixed effects rather than residence country preferences. The identification of the effect of culture therefore arises from variation in birth country preference across various immigrant groups migrating to the same destination country.

VoL. 3 no. 1 159LuTTmER AnD SIngHAL: CuLTuRE, ConTExT, AnD THE TASTE FoR REDISTRIBuTIon
on own preference for redistribution is approximately as large as the effect of own household income and 60 percent as large as the combined effect of income and education. Although income and education are imperfect proxies for economic self-interest, this indicates that the magnitude of the culture effect is comparable in size to that of other important determinants of preferences for redistribution.
This effect is robust to the choice of economic controls and to a number of sample and specification tests. Overall, the influence of birth country culture appears to be stronger for immigrants who are less politically or socially assimilated into the des-tination country and for immigrants who migrate to more diverse destination coun-tries. We also examine the intergenerational transmission of preferences by looking at individuals born in their country of residence who have an immigrant parent. A higher mean preference for redistribution in the parent’s country of birth is associ-ated with a significantly higher individual preference; the effect is two-thirds as large as the own country of birth effect. The observed heterogeneity in the effect of culture for first-generation immigrants is largely mirrored in the second generation.
These findings have a number of important implications. Individual preferences for income redistribution cannot be fully explained by economic self-interest or by economic, political, or social aspects of the current environment, since individual preferences continue to be influenced by country of origin even in a common envi-ronment. This also suggests that culture may be an important factor in explaining the large observed differences in systems of redistribution across countries. Finally, the inherited cultural values of immigrants can, as the anecdotes above suggest, shape the policies of the societies to which they migrate. Thus, while our primary focus
Denmark
Netherlands
Germany
Czech Republic
Great Britain
Luxembourg
Switzerland
Norway
Sweden
Belgium
Ireland
Austria
Slovakia
Estonia
Finland Romania
Iceland
Poland
Spain
Italy
Ukraine
Cyprus
Israel
Slovenia
France
Russia
Latvia
Portugal
Hungary
Turkey
Greece
Bulgaria
–0.4
–0.3
–0.2
–0.1
0
0.1
0.2
0.3
0.4
0.5
2.8 3 3.2 3.4 3.6 3.8 4 4.2 4.4
Imm
igra
nt p
refe
renc
es fo
r re
dist
ribut
ion
in c
ount
ry o
f res
iden
ce
Average preference for redistribution in immigrant's country of birth
Figure 1. Immigrant Preferences for Redistribution by Preferences in Country of Birth
notes: Immigrant preference for redistribution in country of residence is measured in deviation from the mean pref-erence of natives in the country of residence. It is then averaged over all countries in which immigrants from a given birth country currently reside. Thus, the country labels indicate countries of birth. The size of each circle is propor-tional to the number of immigrants from the indicated country in the ESS dataset. The regression line has a slope of 0.30 with a standard error of 0.08. The adjusted R2 equals 0.40.

160 AmERICAn EConomIC JouRnAL: EConomIC PoLICy FEBRuARy 2011
is on using immigrants as a mechanism to identify the effects of culture, the results also have implications for the political economy of immigration policy.4
We consider several alternative explanations for our findings. First, there may be unobserved economic factors that affect preferences for redistribution both in the birth country and the country of residence. In particular, we might be concerned about selective migration driven by economic self-interest. We demonstrate that the results are robust to rich controls for an individual’s likely gain or loss from redis-tribution and that the results are also evident in several subsamples of countries. A second possibility is that individuals update information about the current context slowly, and our estimates are simply picking up this slow updating rather than a true effect of culture. However, we find strong cultural effects even for immigrants who have lived in their country of residence for more than 20 years, and the effects persist in the second generation. Finally, it is possible that cultural factors only influ-ence the way in which individuals respond to survey questions, but do not affect “true” preferences. We find that a higher mean preference for redistribution in the country of birth is associated with an increased probability of voting for a more pro-redistribution party, indicating that cultural influences do affect real behavior.
Three studies that relate specifically to the current study are Guiso, Sapienza, and Zingales (2006); Alesina and Nicola Fuchs-Schündeln (2007); and Alesina and Paola Giuliano (2010b). We discuss the broader literature on preferences for redistribution in Section I of the paper. Alesina and Fuchs-Schündeln (2007) use the separation and reunification of Germany as a natural experiment to examine how Communism affects preferences. They find that those who lived in the former East Germany more strongly prefer redistribution after reunification.5 The authors convincingly show that living in East Germany, as opposed to West Germany, influ-ences one’s preferences for redistribution. By the nature of their natural experiment, however, it is hard to know whether this effect is driven by cultural differences developed under Communism, Communist indoctrination per se, or another aspect of living in East Germany during this time period. In addition, they focus specifi-cally on the effects of Communism, whereas we examine the effects of culture more broadly. Guiso, Sapienza, and Zingales (2006) explicitly note the potential role of culture in explaining preferences for redistribution. They find that country-of-ances-try fixed effects are significant determinants of preferences for redistribution in the United States General Social Survey. This is suggestive of a lasting effect of culture but, as the authors note, it is difficult to know what exactly is captured by the fixed effects.6 Finally, in independent work, Alesina and Giuliano (2010b) show evidence of an effect of birth country preference for redistribution on own preference among
4 See Rafaela Dancygier and Elizabeth N. Saunders (2006) for a description of differences in preferences for social spending and redistribution between immigrants and natives in Germany and the United Kingdom and a discussion of the implications for nations receiving large flows of immigrants.
5 Corneo (2004) also notes higher preferences for redistribution among East Germans relative to West Germans. 6 Raquel Fernández and Alessandra Fogli (2007) and Giuliano (2007) argue that country of birth dummies
cannot relate individual behavior to a specific determining factor in the country of origin. They therefore proxy for culture using the mean behavior of interest in the country of origin. We follow this approach. Ran Abramitzky (2008) examines the effects of culture/ideology on preferences for redistribution in a different context, demonstrat-ing that Israeli kibbutzim affiliated with socialist political parties are able to sustain higher levels of redistribution.

VoL. 3 no. 1 161LuTTmER AnD SIngHAL: CuLTuRE, ConTExT, AnD THE TASTE FoR REDISTRIBuTIon
US immigrants, consistent with our findings. Our paper demonstrates an effect of culture using data from over 30 countries, and we provide evidence against alter-native explanations of this effect. In particular, we show that this effect is strongly robust to a rich set of controls for selection and to the choice of sample countries.7 We also show that the cultural effect is evident in actual behavior (voting), that it is stronger for those less assimilated into their destination country, and that it persists into the second generation.
The approach of examining immigrant behavior has been used in a growing literature on the economic effects of culture.8 Francine Blau (1992); Christopher D. Carroll, Byung-Kun Rhee, and Changyong Rhee (1994); Robert W. Fairlie and Bruce D. Meyer (1996); and Heather Antecol (2000, 2001) analyze the behavior of immigrant groups to determine the effects of culture on fertility, savings, employ-ment rates, and wage gaps. In their study of women’s work behavior and fertil-ity choices, Fernández and Fogli (2006) advance this literature by formalizing the empirical methodology and more carefully considering issues of selection and omit-ted variable bias. Related studies using variants of this strategy have found strong effects of culture in explaining other aspects of women’s labor supply and fertility (see e.g., Timothy W. Guinnane, Carolyn M. Moehling, and Cormac Ó Gráda 2006; Alesina and Giuliano 2010a; Fernández 2007; Fernández and Fogli 2007), house-hold living arrangements (Alesina and Giuliano 2010a; Giuliano 2007), youth labor force participation and geographic mobility (Alesina and Giuliano 2010a), and trust (Yann Algan and Pierre Cahuc 2010).9 While our basic identification strategy is very similar to the strategy used in these studies, we look at immigrants not only com-ing from multiple source countries but also going to multiple destination countries. This approach limits the scope for selection bias since we would expect the form of selection to differ across different destination countries.
The remainder of the paper proceeds as follows. In Section I, we discuss models of preferences for redistribution and formalize our empirical strategy. Section II describes the data and Section III presents the results. Section IV concludes.
I. Empirical Strategy
Our goal is to examine the extent to which cultural factors influence preferences for redistribution. In this section, we provide an overview of our estimation strat-egy. We first review economic models of preferences and outline the identifying
7 As discussed below, we include very rich controls for economic determinants of preferences, including exten-sive and flexible controls for education, income, and labor market factors, as well as controls for spousal and paren-tal characteristics. We also demonstrate that the results hold in a variety of subsamples of countries.
8 Fernández (2008) provides a detailed discussion of this strategy, which she terms an “epidemiological approach,” as well as an overview of recent literature on culture and economics.
9 Other studies have used similar strategies to identify the effects of culture on behavior. Andrea Ichino and Giovanni Maggi (2000) exploit movement of bank employees across regions in Italy to examine the effect of individual background on shirking behavior. Raymond Fisman and Edward Miguel (2007) show that among dip-lomats in New York City those from more corrupt countries are more likely to commit parking violations. Kaiping Peng and Richard Nisbett (1999), and Ara Norenzayan et al. (2002), run experiments on students with varying backgrounds in the same undergraduate university, and find evidence of cultural differences in reasoning processes between (European) American and East Asian students. In the latter study, Asian American students are found to resemble European Americans, or have outcomes in between those of European American and East Asian subjects.

162 AmERICAn EConomIC JouRnAL: EConomIC PoLICy FEBRuARy 2011
assumptions under which we can estimate the effects of culture separately from economic incentives. We then discuss other models of preferences for redistribution and explain how the factors considered in those models would affect our estimates of culture. In particular, we argue that our method allows us to disentangle elements of preferences that reflect the current economic and institutional environment and those that reflect culture.
Under standard economic models, such as Allan H. Meltzer and Scott F. Richard (1981), an individual’s preference for redistribution is determined exclusively by her expected benefit or loss from redistribution.10 Preferences may also reflect other objective country characteristics, such as inequality, heterogeneity, or institutions. It is possible that an individual’s preference for redistribution may, in addition, be determined by country-specific “cultural influences.” While this channel has been suggested in the literature (e.g., Corneo 2001; Alesina and Glaeser 2004), it is dif-ficult to distinguish empirically the effect of cultural influences from objective coun-try characteristics. Separating the two within a country is especially challenging because institutions at least partially reflect culture (Guido Tabellini 2010).
Examining immigrants provides a way to identify whether cultural influences exist and are important determinants of preferences. If the Meltzer and Richard model is correct and we can control for the relevant economic and institutional fac-tors, we should not expect the birth country preference for redistribution to be an explanatory factor in the preferences of immigrants.
We estimate specifications of the following form for immigrant preferences:
(1) pre fi = β1 ( _
pref b ) + Xi β2 + θr + εi ,
where pre fi denotes immigrant i’s preference for redistribution, _
pref b is the average preference for redistribution among natives in birth country b of immigrant i, Xi is a vector of individual characteristics, θr is a fixed effect for residence country r of immigrant i, and εi denotes the error term. We adjust standard errors to allow for clustering of error terms by birth country. The vector of individual characteristics (Xi) includes demographic characteristics, such as age and gender, as well as mea-sures such as income and education that are meant to capture how much the indi-vidual stands to gain or lose from more redistribution. The residence country fixed effect captures both the effects of objective characteristics of the residence country, such as political institutions, and the effects of cultural influences of the residence country; we cannot separate the two.
The average preference of natives in the birth country, _
pref b , reflects both objec-tive characteristics and cultural influences in the birth country. However, there is no reason that the characteristics of and institutions in the birth country should directly
10 Economic factors have been found to influence preferences and voting in a number of studies, e.g., Martin Ravallion and Michael Lokshin (2000); Corneo and Grüner (2002); Andrew Leigh (2005); and Eric J. Brunner, Stephen L. Ross, and Ebonya L. Washington (forthcoming). Individuals who have an expectation of upward mobil-ity may also prefer less redistribution. This prospect of upward mobility (POUM) hypothesis was proposed by Roland Bénabou and Efe A. Ok (2001) and has found empirical support (Alesina and Eliana La Ferrara 2005).
VoL. 3 no. 1 163LuTTmER AnD SIngHAL: CuLTuRE, ConTExT, AnD THE TASTE FoR REDISTRIBuTIon
affect preferences for redistribution in the residence country. For immigrants, the coefficient on
_pref b should therefore only capture the effect of cultural influences.
The identifying assumption for β1 is that there are no omitted factors that are cor-related with the average preference for redistribution in the birth country and that affect the individual’s preference for redistribution in the country of residence.
There may also be “behavioral” factors that affect individuals’ preferences for redistribution. For example, all individuals may have some taste for fairness. If this fairness preference is common across countries, it will not affect our estimate of β1 . We consider systematic variation in taste for fairness across countries to be an ele-ment of culture, and such variation should be captured in
_pref b . Preferences may also
be affected by the characteristics of potential beneficiaries. Individuals may prefer to redistribute to members of their own racial or ethnic group (Luttmer 2001) or to those perceived to be hard-working (Christina M. Fong 2007). Preferences may also vary depending on whether respondents believe income is largely determined by luck or hard work, a possibility we discuss in more detail below. To the extent that these preferences and beliefs are driven by objective societal factors (e.g., racial heterogeneity, low-income labor force participation, economic mobility) that vary at the country level, they will be captured by the residence country fixed effects. To the extent that these preferences and beliefs are shaped by the society in which indi-viduals are raised, and persist through later periods of life, such effects fall within our definition of culture and should be included in our estimate of β1 . Remaining variation not captured by individual controls will fall in the error term but should not affect our estimate of β1 unless it is correlated with
_pref b .
Our focus is on determining whether individual preferences for redistribution exhibit a cultural component. In our empirical analyses, we therefore take the birth country preference (shown in Figure 1) as given. We do not attempt to identify the determinants of birth country preference, although previous studies suggest that attitudes toward the recipients of redistribution may play an important role. Alesina, Glaeser, and Sacerdote (2001) and Alesina and Glaeser (2004) show that individu-als in European Union countries are more likely to report that they believe the poor are “trapped in poverty” and that “luck determines income” and less likely to report a belief that “the poor are lazy” than those in the United States. It is not clear that these differences in beliefs are supported by empirical evidence.11 Ultimately, we would expect differences in preferences for redistribution to be reflected in the redistributive policies of countries. In practice, however, the political process may result in differences between preferred and actual redistribution, perhaps explain-ing why preferred redistribution at the country level does not perfectly correlate
11 Several theoretical papers have noted that differences in beliefs may arise from multiple equilibria in the interaction between beliefs and redistribution systems; see, for example, Thomas Piketty (1995), Alesina and George-Marios Angeletos (2005), and Bénabou and Jan Tirole (2006). However, we should not expect old beliefs to persist under a new system of redistribution over long periods of time and across generations unless the beliefs, once formed, become part of culture. At the individual level, Corneo and Grüner (2002) show that individuals who believe that hard work is important “for getting ahead in life” have weaker preferences for redistribution. Fong (2001) shows that individuals prefer more redistribution if they believe poverty is determined exogenously and argues that this relationship cannot be explained by imperfectly measured self-interest. In addition, macroeconomic volatility experienced during formative years can result in increases in own preference for redistribution (Alesina and Giuliano 2010b; Giuliano and Antonio Spilimbergo 2009).

164 AmERICAn EConomIC JouRnAL: EConomIC PoLICy FEBRuARy 2011
with aggregate measures of redistribution, such as government spending. Gaining a better understanding of why countries fall where they do in the distribution of redistributive preferences is an important question, but one that lies outside the scope of this paper.
II. Data
We use data from three rounds of the European Social Survey (ESS), a bien-nial cross-sectional survey administered in a large sample of (mostly) European nations. The survey was initiated by the European Science Foundation with the goal of measuring and comparing attitudes and behaviors across countries and over time in a methodologically rigorous way. We use data from three rounds of the survey, conducted in 2002/2003, 2004/2005, and 2006/2007. Thirty-two countries partici-pated in at least one round of the survey, and seventeen countries participated in all three rounds. The countries participating in each round are listed in the first column of Table 1.
Respondents are given the statement “the government should take measures to reduce differences in income levels” and asked if they agree strongly, agree, neither agree nor disagree, disagree, or disagree strongly. We code this question on a five-point scale, with 1 being “disagree strongly” and 5 being “agree strongly.” Although the question does not specify a particular country when it refers to “government,” the question immediately preceding this question asks about policies specifically in the country of residence.12 We define the preference for redistribution in an immi-grant’s birth country as follows: we calculate the mean preference among natives in the birth country in each ESS round, weighted by individual weights, and then average across rounds.13
Our primary sample consists of individuals who are immigrants; that is, individu-als whose country of birth differs from the country of residence. We restrict this immigrant sample to individuals who are 18 years of age or older and whose birth country is an ESS survey country. We drop observations for which the preference for redistribution is missing (3.7 percent of observations in the immigrant sample).14 Demographic characteristics of this sample (n = 6,249) are given in Web Appendix Table A1.
12 In Round 1, the immediately preceding question asks respondents their level of agreement with the following statement: “The less that government intervenes in the economy, the better it is for [country].” In Rounds 2 and 3, the immediately preceding question asks respondents to “please say what you think overall about the state of health services in [country] nowadays” on a scale from extremely bad to extremely good. In both cases, [country] is replaced with the name of the country in which the survey is conducted.
13 If a country did not participate in all rounds of the survey, the birth country preference for that country is defined by the average across the available rounds. In practice, the mean preference for a given country across rounds is almost perfectly correlated. This means that we will retain immigrants from a given birth country in all rounds as long as we observe the birth country in any round. However, we have observations for immigrants to a given destination country in a given round only if the destination country participated in that round.
14 We also drop observations for which age is missing (less than 1 percent of observations) and observations for which gender is missing (less than 0.1 percent of observations). We also drop 12 observations for which individuals reported being born outside the country of residence but country of birth is missing or the birth country and indica-tor for native-born are inconsistent.

VoL. 3 no. 1 165LuTTmER AnD SIngHAL: CuLTuRE, ConTExT, AnD THE TASTE FoR REDISTRIBuTIon
Table 1 summarizes immigrant flows across countries in our immigrant sub-sample of the ESS. The first set of columns tabulates patterns of emigration from countries of birth; the second set of columns tabulates patterns of immigration into countries of residence. For example, 100 individuals in the sample were born in Austria but reside in a different sample country, and 335 individuals resided in Austria at the time of the survey but were born in a different sample country. These numbers are unweighted. The table is meant to illustrate the variation in our sample but is not representative of aggregate immigration flows across the sampled coun-tries. We observe substantial diversity in the sample: each birth country has at least four distinct destination countries. Among the 992 possible country pair cells, we observe individuals in 44 percent of them.
Table 1—Immigration Flows within ESS Sample Countries
Immigration flows by birth country Immigration flows by country of destination
Country:
Number of immigrants
frombirth country
Distinct destination countries
Most prevalent
destination country
Numberimmigrating
to most prevalent country
Number of immigrants
indestination
country
Distinct birth
countries
Most prevalent
birthcountry
Numberimmigrating from most prevalent country
Austria 100 13 Switzerland 54 335 23 Germany 115Belgium 165 18 Luxembourg 93 274 19 France 66Bulgaria+* 60 15 Greece 18 10 4 Romania 4Cyprus+* 13 4 Greece 6 27 9 Greece 14Czech Rep.# 126 14 Slovakia 56 124 8 Slovakia 92Denmark 78 11 Norway 33 88 21 Germany 15Estonia+ 27 6 Finland 13 576 6 Russia 487Finland 158 9 Sweden 131 93 12 Sweden 49France 404 20 Luxembourg 126 169 19 Portugal 46Germany 740 28 Switzerland 213 433 27 Poland 99Great Britain 471 19 Ireland 315 163 23 Ireland 60Greece# 54 16 Cyprus 14 171 19 Germany 50Hungary 91 17 Austria 26 67 6 Romania 49Iceland+# 13 5 Denmark 5 9 3 Denmark 5Ireland 72 8 Great Britain 60 384 15 Great Britain 315Israel*# 9 8 Netherlands 2 282 17 Romania 69Italy# 387 16 Switzerland 140 35 13 Switzerland 7Latvia+* 22 8 Estonia 6 141 5 Russia 117Luxembourg# 8 4 Belgium 4 701 21 Portugal 252Netherlands 160 15 Belgium 53 177 22 Turkey 42Norway 43 10 Sweden 27 169 20 Sweden 34Poland 296 22 Germany 99 43 8 Germany 27Portugal 367 9 Luxembourg 252 69 11 France 37Romania+* 238 22 Israel 69 1 1 Ukraine 1Russia+* 1,142 24 Estonia 487 55 5 Ukraine 47Spain 108 16 Switzerland 27 102 18 Romania 20Slovakia+ 123 11 Czech Rep. 92 76 6 Czech Rep. 56Slovenia 21 7 Austria 9 47 8 Germany 19Sweden 117 12 Finland 49 321 24 Finland 131Switzerland 45 12 Italy 7 719 25 Germany 213Turkey+# 321 14 Germany 88 14 5 Bulgaria 8Ukraine+ 270 19 Estonia 76 374 9 Russia 348
notes: +indicates that the survey was not fielded in the first round of the ESS in that country. * indicates that the survey was not fielded in the second round of the ESS in that country. # indicates that the survey was not fielded in the third round of the ESS in that country.

166 AmERICAn EConomIC JouRnAL: EConomIC PoLICy FEBRuARy 2011
III. Results
A. Determinants of Preferences for Redistribution
In Table 2, we test for the effects of culture on individual preferences for redistri-bution and explore the effects of traditional economic determinants of preferences. A one unit increase in the mean preference for redistribution in the individual’s country of birth, calculated on a 1 to 5 scale, is associated with a 0.36 unit increase in the individual’s own preference for redistribution (column 1). This effect is highly statistically significant (t = 4.08). The specification in column 1 includes country of
Table 2—Predictors of Preferences for Redistribution
Dependent variable: Subjective preference for income redistribution
ImmigrantsImmigrants
—controls onlyNatives
—controls only
Coefficient (SE) Coefficient (SE) Coefficient (SE)Birth country redistribution preferences 0.364*** (0.089)Birth country log GDP per capita 0.190*** (0.064)Age 0.004** (0.002) 0.004** (0.002) 0.003*** (0.001)Female 0.091*** (0.030) 0.087** (0.032) 0.126*** (0.017)Own low education 0.050 (0.056) 0.067 (0.059) 0.058*** (0.016)Own high education −0.088*** (0.026) −0.096*** (0.027) −0.161*** (0.019)Spouse low education 0.059** (0.028) 0.073** (0.030) 0.056*** (0.012)Spouse high education −0.163*** (0.040) −0.160*** (0.037) −0.107*** (0.019)Divorced or separated 0.084 (0.100) 0.090 (0.100) 0.090*** (0.013)Widowed 0.017 (0.071) 0.020 (0.072) −0.003 (0.019)Never married 0.082 (0.064) 0.092 (0.064) 0.052*** (0.014)log household income −0.059* (0.030) −0.062* (0.031) −0.089*** (0.012)Primary income source: Self-employed −0.206*** (0.051) −0.206*** (0.054) −0.179*** (0.025) Pension 0.051 (0.037) 0.046 (0.036) −0.007 (0.019) Unemployment benefits 0.164* (0.088) 0.161* (0.084) 0.107*** (0.038) Social benefits 0.249*** (0.090) 0.234** (0.094) 0.113** (0.040) Investment −0.360** (0.164) −0.340* (0.169) −0.389*** (0.059) Other −0.213 (0.141) −0.224 (0.146) −0.116*** (0.033)log household size 0.017 (0.026) 0.012 (0.024) 0.038*** (0.009)Paid work last week 0.000 (0.033) 0.004 (0.033) 0.006 (0.011)Has a child in the household 0.066* (0.038) 0.075* (0.038) 0.008 (0.010)Ever unemployed for more than 12 months 0.142*** (0.038) 0.138*** (0.035) 0.135*** (0.024)Lives in metropolitan area 0.014 (0.041) 0.019 (0.043) −0.037** (0.018)ESS round 2 −0.003 (0.039) −0.002 (0.038) 0.030 (0.023)ESS round 3 0.111** (0.051) 0.109** (0.049) 0.085*** (0.026)Residence country dummies (32) Yes Yes Yesn 6,249 6,249 118,323Adjusted R2 0.1061 0.1000 0.1324
notes: Robust standard errors adjusted for clustering by birth country are in parentheses. The dependent variable is subjective support for income redistribution. Birth country redistribution preferences are measured as the mean subjective preference for redistribution among natives in the immigrant’s country of birth. log GDP per capita is measured in purchasing power parity US dollars. Low education includes the two categories “Not completed pri-mary education” and “Primary or first stage of basic.” Secondary education is the omitted category and corresponds to the category “Lower secondary or second stage of basic.” High education includes the following four catego-ries: “Upper secondary,” “Post-secondary, non-tertiary,” “First stage of tertiary,” and “Second stage of tertiary.” The omitted marital category is “Married.” The omitted income source is “Salary and wages.” (Unreported) dummies are included for missing regressors.
*** Significant at the 1 percent level. ** Significant at the 5 percent level. * Significant at the 10 percent level.

VoL. 3 no. 1 167LuTTmER AnD SIngHAL: CuLTuRE, ConTExT, AnD THE TASTE FoR REDISTRIBuTIon
residence fixed effects as well as demographic and socioeconomic status controls. We also control for income in the country of birth, measured by the log of purchas-ing power parity adjusted GDP in 2004.
The economic variables affect preferences for redistribution in the direction that is consistent with economic self-interest. Higher-income households have lower pref-erences for redistribution. Similarly, individuals with less than secondary education have a higher preference for redistribution, and individuals with more than second-ary education have a lower preference; the same pattern is observed for spousal edu-cation. Individuals who have ever been unemployed for a twelve month period have a higher preference. We also examine the effects of primary source of income, with the omitted category being wage and salary income. Relative to this group, indi-viduals whose primary source of income is self-employment or investment income have lower preferences for redistribution. Those whose primary source of income is pension, unemployment benefits, or social benefits have a higher preference for redistribution, though the effect of pension income is not statistically significant. Age has a positive effect on preferences, as does being female.
The log of purchasing power parity adjusted GDP in the birth country is included as a control to capture economic differences across countries. To the extent that these differences in economic environment affect the cultural preference for redistri-bution, we are perhaps overcontrolling. However, we wanted to capture differences in birth country culture beyond just simple differences in the level of economic development of the birth country. The GDP coefficient is positive and significant in our base specification, but its magnitude and significance level are sensitive to the choice of sample. Hence, we mainly regard it as a control variable and do not attach an economic interpretation to it. Columns 2 and 3 of the table demonstrate that the effects of our demographic and economic characteristics on preferences are similar for immigrants and natives.15
In order to compare the magnitude of the culture effect directly to the magnitude of economic determinants of preferences, we standardize the preference variable and the explanatory variables and re-run the specification in column 1. The esti-mates imply that a one standard deviation increase in the birth country preference for redistribution is associated with a 0.11 standard deviation increase in the immi-grant’s own preference. In comparison, a one standard deviation increase in the log of household income is associated with a 0.07 standard deviation decrease in own preference. The coefficient on income is somewhat difficult to interpret, since this specification also controls for education and other proxies for income. If we remove the controls for own education, spousal education, source of income, and the indicator for whether the individual had paid work in the last week, then the coef-ficient on culture is 0.13, whereas the coefficient on log household income is − 0.12. Finally, if we re-introduce own education as a linear variable to the previous specifi-cation, the estimates imply that a one standard deviation increase in the birth country
15 The regressions in these columns exclude the birth country preference and GDP measures since these vari-ables cannot be identified separately from the residence country fixed effects in the native sample. We cannot reject the hypothesis that the individual characteristics predicting preferences for redistribution have the same effects for natives and immigrants ( p-value: 0.36).

168 AmERICAn EConomIC JouRnAL: EConomIC PoLICy FEBRuARy 2011
preference for redistribution is associated with a 0.11 standard deviation increase in own preference. Summing the relevant coefficients, the combined effect of a one standard deviation increase in log household income and own education is a 0.18 standard deviation decrease in own preference. It is important to note that income and education are imperfect proxies for true economic self-interest. Nevertheless, the results do suggest that culture is an economically significant determinant of redistributive preferences.
B. Robustness Analysis
A concern when examining the preferences of immigrants is selection. Although cross-country migration decisions are clearly non-random, our primary concern here is whether selective migration could spuriously generate an effect of birth country preference for redistribution on own preference.
One possible type of selection is preference-based (Tiebout) selection. Migrants with high preferences for redistribution (from whichever country they come) may choose to move to high-preference countries, and similarly, those with low prefer-ences may move to low-preference countries. In the extreme case, if all individuals moved to countries exactly aligned with their own preferences, we would not esti-mate any effect of culture even if cultural effects were in fact strong. More gener-ally, such selective migration would attenuate our coefficients, biasing our estimates of culture effects downward.
A second form of selection is economically motivated selective migration. We explore this possibility by testing the sensitivity of our results to the choice of eco-nomic controls (Table 3). In row 1, we regress individual preference for redistribu-tion on the birth country preference, controlling only for residence country fixed effects. The estimated preference coefficient is 0.26 ( p < 0.01). Row 2 presents the same specification as column 1 in Table 2; the preference coefficient is 0.36.
We next include richer control variables (row 3). We define the own education indicators more narrowly, resulting in seven possible educational attainment catego-ries. We include third order polynomials in the log of household income and house-hold size, a quadratic term for age, more detailed controls for employment status and history, indicators for religious affiliation, indicators for the length of residence in the country, and a dummy variable for linguistic minority that is equal to one if the language most commonly spoken at home is not one of the primary residence country languages. The estimated preference coefficient in this specification is 0.34 ( p < 0.01). We define the set of control variables used in row 3 as our baseline set of controls. These controls are included in all further analyses, unless otherwise indicated.
In row 4, we add controls for citizenship, whether the individual voted in the last national election, and frequency of religious attendance. We do not include these variables in the baseline set of controls because they may be partially determined by preferences for redistribution, but their inclusion does not affect the estimate. It is possible that the effects of our income variables on an individual’s gain or loss from redistribution may depend on the tax and transfer systems of the country of residence. We therefore include interactions of income, income squared, and income

VoL. 3 no. 1 169LuTTmER AnD SIngHAL: CuLTuRE, ConTExT, AnD THE TASTE FoR REDISTRIBuTIon
cubed and residence country dummies, allowing the effects of income to vary flex-ibly by country (row 5). The estimated coefficient is 0.32 ( p < 0.01). Finally, we add an even more extensive set of economic controls (row 6), resulting in an esti-mated coefficient of 0.29 ( p < 0.01).16
The estimates in Table 3 demonstrate that the preference effect is robust to the choice of controls for economic factors. Although the point estimates gener-ally decrease slightly as we add more controls, including even the richest set of economic controls results in a large and significant estimate that is similar to the baseline. Selection on unobservables could still be a potential concern if the birth country preference is capturing economic characteristics of immigrants that remain
16 For this set of controls, we include all the controls in rows 4 and 5 and add controls for main economic activ-ity over the last week, union membership, mother’s and father’s education, occupation and industry indicators, and dummies for within-residence country region. We also add the birth country Gini coefficient to address the pos-sibility that the birth country preference measure is affected by inequality in the birth country. There are 96 controls included in the baseline and 459 controls included in the regression with comprehensive controls (row 6).
Table 3—Effect of Birth Country Culture on Immigrants’ Preferences for Redistribution in Residence Country
Dependent variable: subjective preference for income redistribution
Specification:
Coefficient on birth country redistribution preferences (SE) Adjusted R2 n
1. Country dummies as only controls 0.264*** (0.092) 0.0701 6,249
2. Baseline, but fewer controls 0.364*** (0.089) 0.1061 6,249
3. Baseline 0.341*** (0.084) 0.1101 6,249
4. Baseline, but more controls 0.339*** (0.082) 0.1101 6,249
5. Baseline, but interacting a cubic in log household income with country dummies
0.321*** (0.079) 0.1151 6,249
6. Comprehensive controls 0.289*** (0.070) 0.1324 6,249
notes: Robust standard errors adjusted for clustering by birth country are in parentheses. (Unreported) dummies are included for missing regressors. The baseline regression with fewer controls corresponds to Column 1 of Table 2. The baseline regression adds several controls: We include more detailed controls for own education (“not com-pleted primary education,” “primary or first stage of basic,” “lower secondary or second stage of basic,” “upper secondary,” “post-secondary, non-tertiary,” “first stage of tertiary,” and “second stage of tertiary”); third order poly-nomials in the log of household income and household size; a quadratic term for age; indicators for whether the spouse is currently working and whether the respondent has ever had a paid job; a dummy for linguistic minority coded as 1 if the respondent’s primary language spoken at home is spoken at home by less than 30 percent of the native population; a set of five 0/1 dummies to express the length of time a respondent has lived in the residence country; and a set of eight 0/1 dummies to express religious affiliation. The regression with more controls (row 4) adds a dummy equal to 1 if the respondent attends religious services once a month or more, a dummy equal to 1 if the respondent voted in the last national election, and a dummy equal to 1 if the respondent is a citizen of the resi-dence country. Row 6 includes all of the controls in rows 4 and 5 and adds the following additional controls: the Gini coefficient of the birth country (from the UN-WIDER database), a set of 0/1 dummies for main activity over the last week, three 0/1 dummies to indicate union membership, 10 occupational categories, 16 industry categories, moth-er’s and father’s education (defined as in Table 2), and a full set of dummies for within-residence country region.
*** Significant at the 1 percent level. ** Significant at the 5 percent level. * Significant at the 10 percent level.

170 AmERICAn EConomIC JouRnAL: EConomIC PoLICy FEBRuARy 2011
unobserved by us but are relevant for taxes and transfers. This may seem unlikely, given that we found little selection on a rich set of economic observables. However, we cannot completely rule out the possibility of selection on unobservables.
We have also tested the robustness of our results to the choice of sample and specification (Web Appendix Table A2). For example, our results are robust to excluding the two highest-preference and the two lowest-preference birth countries, excluding individuals for whom the birth country is a former Communist country, and to restricting the sample to the EU-15 countries, the 15 member countries of the European Union prior to the 2004 expansions. These results indicate that cultural influences appear to be important determinants of preferences even among countries that are relatively homogeneous. The fact that we observe significant effects of birth country preference across many different subsamples of countries also provides fur-ther suggestive evidence against the selection hypotheses, since we would expect the form of selection to differ in these subsamples. The results are also robust to a number of other specification tests; see Table A2 for details.
C. Heterogeneity
We next explore whether the birth country effect differs for different types of immigrants. We examine heterogeneity in the birth country effect by regressing an immigrant’s preference for redistribution on her birth country mean preference interacted with the relevant indicator variable (Table 4). Each row of the table rep-resents a single regression. However, the direct effect of birth country preference is excluded. Each regression therefore has two coefficients of interest: one measures the average effect of birth country among immigrants for whom the indicator equals one and the other measures the average effect for those for whom the indicator equals zero. The table also reports the p-value on a test of whether the two coef-ficients in each regression are equal.17
Rows 1, 2, and 3 test whether the effect varies based on the length of time the immigrant has lived in the residence country, citizenship, and voting. We con-struct three indicator variables. Tenure is equal to one if the immigrant has lived in the residence country for more than 20 years (which is about the median tenure). Citizenship is equal to one if the individual is a citizen of the residence country, and Voting is equal to one if she voted in the last national election. Individuals with longer tenure, citizens, and voters have smaller effects of birth country preference,18 but the preference effect is still highly significant for each of these groups. The ten-ure effect suggests that the result is unlikely to be driven solely by slow updating of economic information, since birth country preference is a significant determinant of
17 The difference between the two coefficients presented in each regression is identical to the coefficient that would arise on the interaction term in a specification with birth country preference and birth country preference interacted with a dummy for the relevant indicator. The reported p-value is identical to the p-value on the interaction term in such a specification.
18 The differences are significant at the 5 percent level for tenure and voting and just above the 10 percent level for citizenship.

VoL. 3 no. 1 171LuTTmER AnD SIngHAL: CuLTuRE, ConTExT, AnD THE TASTE FoR REDISTRIBuTIon
Table 4—Which First-Generation Immigrants Are Most Influenced by Their Birth Country?
Dependent variable: Subjective preference for income redistribution
Coefficient on birth country preference for income
redistributionSpecification:(SE)
p-value Adjusted R2 n
1. By tenure Has lived in the country for ≤ 20 years 0.482*** (0.132) 0.1108 6,249 Has lived in the country for > 20 years 0.261*** (0.073) p-value on test of equal coefficients 0.033
2. By citizenship non-citizen in residence country 0.416*** (0.114) 0.1107 6,249 Citizen in residence country 0.271*** (0.071) p-value on test of equal coefficients 0.112
3. By voting non-voter in previous national election 0.419*** (0.097) 0.1107 6,249 Voted in previous national election 0.244*** (0.083) p-value on test of equal coefficients 0.026
4. By children in the household Does not have children in the household 0.278*** (0.080) 0.1104 6,249 Has children in the household 0.434*** (0.096) p-value on test of equal coefficients 0.006
5. By linguistic minority Speaks dominant language at home 0.282*** (0.075) 0.1106 6,249 Speaks minority language at home 0.482*** (0.148) p-value on test of equal coefficients 0.130
6. By fraction ethnic minority of immigrant group Fraction below median 0.305*** (0.100) 0.1106 6,249 Fraction above median 0.509*** (0.151) p-value on test of equal coefficients 0.219
7. By population fraction of immigrant group Fraction below median 0.192** (0.087) 0.1131 6,249 Fraction above median 0.683*** (0.105) p-value on test of equal coefficients 0.000
8. By fraction ethnic minority in residence country Fraction below median 0.139 (0.090) 0.1131 6,249 Fraction above median 0.573*** (0.101) p-value on test of equal coefficients 0.001
9. By fraction immigrant in residence country Fraction below median 0.207* (0.105) 0.1112 6,249 Fraction above median 0.474*** (0.087) p-value on test of equal coefficients 0.020
notes: Robust standard errors are adjusted for clustering by birth country. All regressions include the same con-trol variables as the baseline regression reported in row 3 of Table 3. Immigrant groups are defined both by country of birth and by country of residence. Thus, the population fraction of immigrant group is measured as the ratio of immigrants from a particular birth country to the total population in their country of residence. In rows 6 through 9, the median is taken over all immigrants from ESS countries in the ESS dataset. A language is defined as dominant if more than 30 percent of the native population speaks it as a primary language in the home.
*** Significant at the 1 percent level. ** Significant at the 5 percent level. * Significant at the 10 percent level.

172 AmERICAn EConomIC JouRnAL: EConomIC PoLICy FEBRuARy 2011
own preference even among immigrants who have lived in their country of residence for more than twenty years.19
Individuals with children in the household have significantly stronger birth coun-try preference effects (row 4). This result may be somewhat surprising, since we might expect children to hasten the assimilation process. A possible explanation of this finding is that parents want to pass on their birth country culture to their children and that this strengthens the effect on their own preferences.
The effect of birth country preference also varies with social measures of assimi-lation. We examine the effect of being a linguistic minority or a member of an ethnic minority in the residence country. Because self-reported ethnic minority status may be correlated with omitted variables, we instead construct a group level measure, defined as the share of those from the same birth country who define themselves as ethnic minorities in the country of residence. We find that immigrants who are members of linguistic minorities (row 5) or ethnic minorities (row 6) have stronger preference effects, perhaps because they are less easily able to assimilate into the residence country, although these differences are not statistically significant. Row 7 shows that individuals in a residence country with a large population of other immi-grants from the individual’s own birth country have a significantly stronger effect of birth country culture. George J. Borjas (1992) notes the potential importance of an individual’s ethnic group in determining intergenerational earnings mobility; a similar mechanism may reduce assimilation in our case.
These economic and social measures are correlated with each other, so we are not able to separately estimate the partial effect of each measure. Taken together, however, these results do suggest that individuals are less influenced by birth coun-try culture when they are more assimilated into the residence country. This may be because immigrants’ preferences begin to converge to cultural norms in the country of residence or because those who choose to assimilate have preferences that are more divergent from their birth country preferences to begin with.
The effect of culture may also be affected by the characteristics of the receiving country. To investigate this possibility, we measure the fraction of the residence country population that is a member of an ethnic minority and the fraction that is immigrant (non-native born), and we construct dummy variables for whether these fractions are above or below the median across the distribution of receiving coun-tries. We find that the effects of culture are significantly stronger in receiving coun-tries with a high share of ethnic minorities (row 8) and in those with a high share of immigrants (row 9). One interpretation is that there is less pressure for immigrants to assimilate in societies that are more multicultural.
19 Note that our birth country preference measure may be noisy for immigrants with long tenure, since birth country preferences at the time the immigrant migrated may differ from those measured at the time of the survey. Under reasonable assumptions, this would bias the estimated coefficients downward. This could provide an alter-native explanation for the observed differences in the coefficients in row 1 of Table 4, but it should not affect our conclusion that culture has a significant effect on preferences even for immigrants who have lived in the residence country for more than 20 years.

VoL. 3 no. 1 173LuTTmER AnD SIngHAL: CuLTuRE, ConTExT, AnD THE TASTE FoR REDISTRIBuTIon
D. Cultural Effects and Voting Behavior
A question when interpreting these findings is whether culture affects true prefer-ences or only reporting behavior. We therefore examine the effects of birth country preferences on individual voting decisions. This exercise is limited by the fact that only 46 percent of the immigrant sample was eligible and chose to vote in the last national election. As discussed in the last section, the subsample of immigrants who vote are less influenced by their birth country culture.
Party ideologies are classified in two ways. First, we construct a measure of each party’s preference for redistribution by using the voting behavior of the native sam-ple. This party preference variable is defined for each immigrant as the mean prefer-ence for redistribution among natives who voted for the immigrant’s party. A higher value of this variable implies that the party for which the immigrant voted is likely to be more in favor of redistribution. Second, we categorize political parties as right, center, or left using the Database of Political Institutions constructed by Thorsten Beck et al. (2001).20
20 The Beck data were supplemented with data from John Huber and Ronald Inglehart’s (1995) classification of party politics. Please see the notes to Table 5 for more detail.
Table 5—Effect of Birth Country Culture on Immigrants’ Voting Behavior
Dependent variable:
Coefficient on birth country redistribution preferences (SE) Adjusted R2 n
1. Subjective preference for income redistribution using sample for which voting data is available
0.184** (0.090) 0.1123 2,328
2. Redistribution preferences of the party for which the person voted
0.105*** (0.033) 0.5233 2,328
3. Subjective preference for income redistribution using sample for which Beck data is available
0.181* (0.106) 0.1103 1,622
4. Left-right party scale using Beck database 0.253** (0.116) 0.1638 1,622
notes: Robust standard errors adjusted for clustering by birth country are in parentheses. All regressions include the same control variables as the baseline regression reported in row 3 of Table 3. In the first two regressions, the sample is restricted to immigrant respondents who voted in the previous national election and reported the party for which they voted. Political party redistribution preferences is the mean preference for income redistribution among natives voting for the political party for which the respondent voted. In the second two regressions, the sample is restricted to immigrant respondents who voted for a political party that is coded as left, right, or center in the Beck database. The Beck database from the World Bank codes the three largest government political parties and the largest oppo-sition party as left, right, center, or NA. The left-right party scale codes “Right” parties as 1, “Center” parties as 2, and “Left” parties as 3. The Beck data were supplemented with data from the Huber-Inglehart (1995) classification of party politics. These data were the basis of many of the Beck classifications but include parties not coded in the Beck database. Huber-Inglehart classifies parties on a 1–10 left-right scale. Based on the Beck cutoffs, we define parties scored less than 5 as left, those from 5–6 as center, and those above 6 as right. We also added cases where we were able to discern the party match from other sources with confidence; these were generally parties where the left-right classification was clear, but the party was not a main government or opposition party and therefore not included in the Beck database. All party classifications were made prior to running the empirical analyses.
*** Significant at the 1 percent level. ** Significant at the 5 percent level. * Significant at the 10 percent level.

174 AmERICAn EConomIC JouRnAL: EConomIC PoLICy FEBRuARy 2011
Before looking at voting behavior, we examine the effect of birth country prefer-ence on own self-reported preference for the subsample of immigrants for whom party voting data are available. Row 1 of Table 5 presents our baseline specifica-tion for the sample of immigrants for whom our measure of party preference can be constructed. Row 3 presents the specification for the subsample for which the Beck political party classification can be made. The preference effects for these samples are 0.184 ( p < 0.05) and 0.181 ( p < 0.10), respectively. These estimates differ slightly from the effect for all voters estimated in Table 4 because even among immigrants who voted, the political party for which they voted is unavailable in 18 percent of cases. We are unable to match the political party to a Beck database clas-sification in a further 30 percent of cases.
In row 2, we replace the dependent variable with our constructed measure of the redistributive preference of the party for which the immigrant voted. Note that this measure is scaled in a way that makes it directly comparable to the individual prefer-ence measure. We find that immigrants from birth countries with a high preference for redistribution are significantly more likely to vote for a more pro-redistribution political party in their countries of residence. The estimated effect is 0.11, and it is significant at the 1 percent level. The effect is somewhat smaller than the effect on preferences for redistribution for this sample (row 1) but is estimated with greater precision. This finding is not surprising; we would expect a voting-based measure of preferences to be less noisy than the self-reported categorical measure.
We also find that a higher birth country preference is associated with a stronger preference for redistribution when we measure this preference by the Beck clas-sification of the party for which the immigrant voted. An increase of one unit in the birth country mean preference is associated with a 0.25 unit movement to the left on the three-unit Beck scale (row 4), and the effect is significant at the 5 percent level. We conclude that Table 5 provides strong evidence against the concern that the esti-mated effects of culture only capture reporting behavior rather than true preferences.
E. Intergenerational Transmission of Preferences
In Rounds 2 and 3 of the ESS, individuals are asked not only their own country of birth but also the country of birth of their mother and father. We construct the sample of individuals who are residing in their own country of birth but who have at least one parent who was born in a different ESS survey country. This sample consists of 4,632 individuals. Of these, 2,920 have a mother and 2,958 have a father who was born in a different ESS survey country.
We first examine the effect of the mean preference for redistribution in the par-ent birth country, where the parent could be the mother or the father. We define the parent birth country mean preference as the average of the mean preferences in each parent’s country of birth. A slight majority of individuals in this sample has one par-ent who is a native in the country of residence and another parent who emigrated from an ESS survey country. We include the birth country preference of the native parent in the average to correctly scale the cultural effect of the immigrant parent, but this does not drive the estimates because we capture the direct effect of the native parent’s birth country preference by the residence country fixed effects.

VoL. 3 no. 1 175LuTTmER AnD SIngHAL: CuLTuRE, ConTExT, AnD THE TASTE FoR REDISTRIBuTIon
A one unit increase in the parent birth country preference is associated with an increase of 0.23 in the individual preference, and the effect is statistically significant at the 5 percent level (Table 6, row 1). This effect is approximately two-thirds as large as the own country of birth effect. In row 2, we include an interaction of the mean preference in the parent birth country with a dummy variable that equals one if both parents come from the same birth country.21 The base effect (for those whose parents do not come from the same birth country) is 0.171 ( p < 0.10). The marginal effect of having a common parental birth country is 0.173 (not significant). This suggests that having two parents from the same birth country amplifies the cultural effect, although the interaction is not estimated with precision. It is also possible that individuals with a strong desire to transmit their cultural values to their chil-dren select partners who share these values. In this case, the common birth country effect could partially reflect preference intensity by a single parent rather than a true amplification effect. The country of origin effect appears to be stronger for immi-grant mothers: the effect of mother’s birth country preference is 0.16 ( p < 0.05) and the effect of father’s birth country preference is 0.12 (not significant).22 However, we cannot reject the hypothesis that the mother’s and father’s effect are equally strong.
21 This indicator is equal to one for 23 percent of our sample. The effect on the interaction term is essentially a comparison of those with one immigrant parent and those with two immigrant parents from the same birth country; only 3.3 percent of our second-generation sample has immigrant parents coming from two different ESS countries and only 2.5 percent of our second-generation sample has one immigrant parent from an ESS country and one immigrant parent from a non-ESS country. It is therefore not possible to exploit this variation to examine the relative influence of mother and father when both parents are immigrants.
22 The sample in row 3 consists of natives with an immigrant mother from an ESS survey country; the sample in row 4 consists of natives with an immigrant father from an ESS survey country. These samples overlap slightly, since some individuals have immigrant parents from the same ESS source country. The preference variables in these specifications are the birth country mean preference of the mother and father respectively.
Table 6—The Effect of Parental Birth Country Culture on Second-Generation Immigrants
Dependent variable: Subjective preference for income distribution
Coefficient on parental
birth country redistribution preferences (SE) Adjusted R2 n
1. Parental birth country preferences for income redistribution 0.230** (0.088) 0.1219 4,632
2. Parental birth country preferences for income redistribution 0.171* (0.098) 0.1218 4,632
Interaction on parental birth country preference and both parents emigrating from the same country
0.173 (0.151)
3. Mother’s birth country preferences for income redistribution 0.164** (0.069) 0.1356 2,916
4. Father’s birth country preferences for income redistribution 0.117 (0.092) 0.1203 2,944
notes: Robust standard errors adjusted for clustering by birth country are in parentheses. All regressions include the same control variables as the baseline regression reported in row 3 of Table 3.
*** Significant at the 1 percent level. ** Significant at the 5 percent level. * Significant at the 10 percent level.

176 AmERICAn EConomIC JouRnAL: EConomIC PoLICy FEBRuARy 2011
These results suggest that cultural effects persist strongly at least into the sec-ond generation, a finding that is consistent with previous work on the intergenera-tional transmission of preferences and with research documenting cultural effects of country of ancestry among second-generation immigrants in the United States.23 These results also provide evidence against the selective migration and slow updat-ing hypotheses, since the samples consist of individuals born in their country of residence.
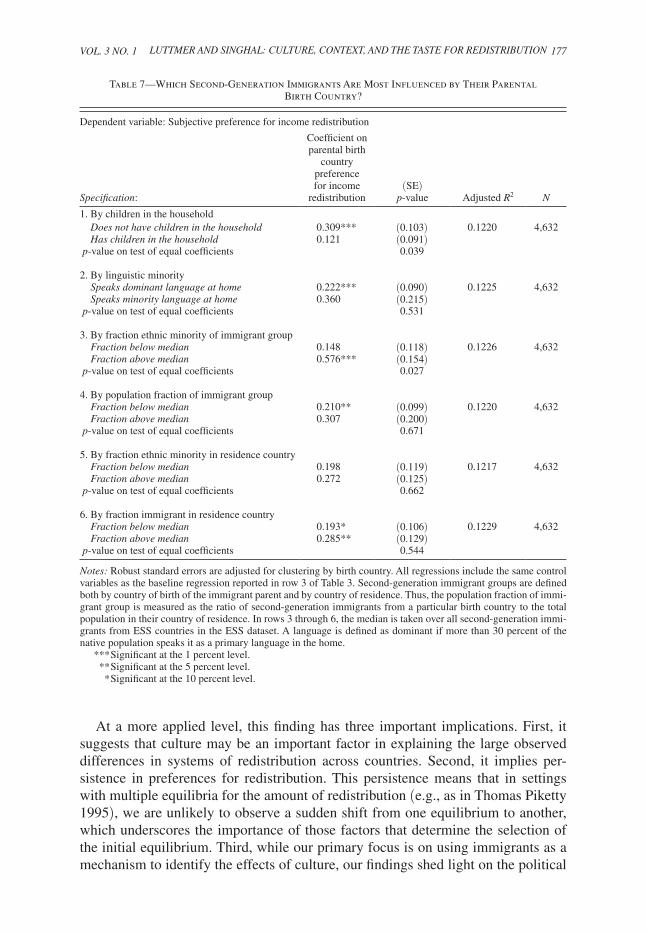
We also examine heterogeneity in the effect of culture for second-generation immigrants (Table 7). The patterns for linguistic minority, ethnic minority, immi-grant group density, and fraction ethnic minority and fraction immigrant in the resi-dence country all mirror those for first-generation immigrants, although the effects are not generally statistically significant.24 The notable exception to this pattern is the presence of children in the household (row 1). For first-generation immigrants, this is associated with a significantly larger effect of culture; for second-generation immigrants, it is associated with a significantly smaller effect. It may be that first-generation immigrants make a strong effort to pass along culture to their children, but assimilation of second generation immigrants (who are likely to be married to natives) is accelerated by having children.
IV. Conclusion
By studying immigrants, we are able to credibly disentangle cultural determinants of preferences for redistribution from economic and institutional determinants. We find that individuals’ preferences for redistribution are strongly affected by prefer-ences in their countries of birth: the average preference for income redistribution in the culture where an immigrant is raised continues to have an effect once they emigrate. This effect is highly statistically significant, economically important, and robust to rich controls for economic factors and to the choice of sample and speci-fication. Our results show that these cultural influences also affect real behaviors, such as voting. Cultural determinants of preferences for redistribution appear to be strongly persistent across generations. We also find that the cultural effect is stron-ger for immigrants who are less politically or socially assimilated into the destina-tion country and for immigrants who migrate to more diverse destination countries.
At a fundamental level, this paper provides evidence on the nature of prefer-ences for redistribution. We find that these preferences cannot be fully explained by economic self-interest or by economic, political, or social aspects of the current environment, since individual preferences continue to be influenced by country of origin even in a common environment. We take this as evidence that culture is an important determinant of preferences for redistribution.
23 See, e.g., Bisin and Verdier (2008) for a brief and lucid overview of models and evidence of cultural trans-mission. Guiso, Sapienza, and Zingales (2008) present evidence of cultural effects persisting over a period of well over 500 years.
24 The effects for age (closest proxy for tenure), citizenship, and voting in the last election are not reported but the patterns are also similar to those for first-generation immigrants.
VoL. 3 no. 1 177LuTTmER AnD SIngHAL: CuLTuRE, ConTExT, AnD THE TASTE FoR REDISTRIBuTIon
At a more applied level, this finding has three important implications. First, it suggests that culture may be an important factor in explaining the large observed differences in systems of redistribution across countries. Second, it implies per-sistence in preferences for redistribution. This persistence means that in settings with multiple equilibria for the amount of redistribution (e.g., as in Thomas Piketty 1995), we are unlikely to observe a sudden shift from one equilibrium to another, which underscores the importance of those factors that determine the selection of the initial equilibrium. Third, while our primary focus is on using immigrants as a mechanism to identify the effects of culture, our findings shed light on the political
Table 7—Which Second-Generation Immigrants Are Most Influenced by Their Parental Birth Country?
Dependent variable: Subjective preference for income redistribution
Coefficient on parental birth
country preference for income
redistributionSpecification:(SE)
p-value Adjusted R2 n
1. By children in the household Does not have children in the household 0.309*** (0.103) 0.1220 4,632 Has children in the household 0.121 (0.091) p-value on test of equal coefficients 0.039
2. By linguistic minority Speaks dominant language at home 0.222*** (0.090) 0.1225 4,632 Speaks minority language at home 0.360 (0.215) p-value on test of equal coefficients 0.531
3. By fraction ethnic minority of immigrant group Fraction below median 0.148 (0.118) 0.1226 4,632 Fraction above median 0.576*** (0.154) p-value on test of equal coefficients 0.027
4. By population fraction of immigrant group Fraction below median 0.210** (0.099) 0.1220 4,632 Fraction above median 0.307 (0.200) p-value on test of equal coefficients 0.671
5. By fraction ethnic minority in residence country Fraction below median 0.198 (0.119) 0.1217 4,632 Fraction above median 0.272 (0.125) p-value on test of equal coefficients 0.662
6. By fraction immigrant in residence country Fraction below median 0.193* (0.106) 0.1229 4,632 Fraction above median 0.285** (0.129) p-value on test of equal coefficients 0.544
notes: Robust standard errors are adjusted for clustering by birth country. All regressions include the same control variables as the baseline regression reported in row 3 of Table 3. Second-generation immigrant groups are defined both by country of birth of the immigrant parent and by country of residence. Thus, the population fraction of immi-grant group is measured as the ratio of second-generation immigrants from a particular birth country to the total population in their country of residence. In rows 3 through 6, the median is taken over all second-generation immi-grants from ESS countries in the ESS dataset. A language is defined as dominant if more than 30 percent of the native population speaks it as a primary language in the home.
*** Significant at the 1 percent level. ** Significant at the 5 percent level. * Significant at the 10 percent level.

178 AmERICAn EConomIC JouRnAL: EConomIC PoLICy FEBRuARy 2011
economy of immigration policy because the cultural values that immigrants bring along can shape the social policies of their destination countries well into the future. Even if the immigrants themselves have little effect on current policy (e.g., because they are not allowed to vote), the transmission of their cultural values to their chil-dren can affect future policy and have a lasting impact.
REFERENCES
Abramitzky, Ran. 2008. “The Limits of Equality: Insights from the Israeli Kibbutz.” Quarterly Journal of Economics, 123(3): 1111–59.
Alesina, Alberto, and George-Marios Angeletos. 2005. “Fairness and Redistribution.” American Eco-nomic Review, 95(4): 960–80.
Alesina, Alberto, and Edward L. Glaeser. 2004. Fighting Poverty in the uS and Europe: A World of Difference. Oxford, UK: Oxford University Press.
Alesina, Alberto, Edward Glaeser, and Bruce Sacerdote. 2001. “Why Doesn’t the United States Have a European-Style Welfare State?” Brooking Papers on Economic Activity, 2001(2): 187–254.
Alesina, Alberto, and Paola Giuliano. 2010a. “The Power of the Family.” Journal of Economic growth, 15(2): 93–125.
Alesina, Alberto, and Paola Giuliano. 2010b. “Preferences for Redistribution.” In Handbook of Social Economics, ed. Jess Benhabib, Matthew Jackson, and Alberto Bisin. Amsterdam, The Netherlands: Elsevier.
Alesina, Alberto, and Nicola Fuchs-Schündeln. 2007. “Good-Bye Lenin (or Not?): The Effect of Com-munism on People’s Preferences.” American Economic Review, 97(4): 1507–28.
Alesina, Alberto, and Eliana La Ferrara. 2005. “Preferences for Redistribution in the Land of Oppor-tunities.” Journal of Public Economics, 89(5–6): 897–931.
Algan, Yann, and Pierre Cahuc. 2010. “Inherited Trust and Growth.” American Economic Review, 100(5): 2060–92.
Antecol, Heather. 2000. “An Examination of Cross-Country Differences in the Gender Gap in Labor Force Participation Rates.” Labour Economics, 7(4): 409–26.
Antecol, Heather. 2001. “Why Is There Interethnic Variation in the Gender Wage Gap? The Role of Cultural Factors.” Journal of Human Resources, 36(1): 119–43.
Beck, Thorsten, George Clarke, Alberto Groff, Philip Keefer, and Patrick Walsh. 2001. “New Tools in Comparative Political Economy: The Database of Political Institutions.” World Bank Economic Review, 15(1): 165–76.
Bénabou, Roland, and Efe A. Ok. 2001. “Social Mobility and the Demand for Redistribution: The POUM Hypothesis.” Quarterly Journal of Economics, 116(2): 447–87.
Bénabou, Roland, and Jean Tirole. 2006. “Belief in a Just World and Redistributive Politics.” Quar-terly Journal of Economics, 121(2): 699–746.
Benson, Lee. 1966. The Concept of Jacksonian Democracy: new york as a Test Case. New York, NY: Atheneum.
Bisin, Alberto, and Thierry Verdier. 2004. “Work Ethic and Redistribution: A Cultural Transmission Model of the Welfare State.” http://www.nyu.edu/econ/user/bisina/welfst.pdf.
Bisin, Alberto, and Thierry Verdier. 2008. “Cultural Transmission.” In new Palgrave Dictionary of Economics, 2nd ed., ed. Steven N. Durlauf and Lawrence E. Blume. New York, NY: Palgrave Mac-millan.
Blau, Francine D. 1992. “The Fertility of Immigrant Women: Evidence from High-Fertility Source Countries.” In Immigration and the Workforce: Economic Consequences for the united States and Source Areas, ed. George J. Borjas and Richard B. Freeman, 93–134. Chicago: University of Chi-cago Press.
Borjas, George J. 1992. “Ethnic Capital and Intergenerational Mobility.” Quarterly Journal of Eco-nomics, 107(1): 123–50.
Brunner, Eric J., Stephen L. Ross, and Ebonya L. Washington. Forthcoming. “Economics and Policy Preferences: Causal Evidence of the Impact of Economic Conditions on Support for Redistribution and Other Ballot Proposals.” Review of Economics and Statistics.
Carroll, Christopher D., Byung-Kun Rhee, and Changyong Rhee. 1994. “Are There Cultural Effects on Saving? Some Cross-Sectional Evidence.” Quarterly Journal of Economics, 109(3): 685–99.
Corneo, Giacomo. 2001. “Inequality and the State: Comparing US and German Preferences.” Annales d’Économie et de Statistique, 2001(63/64): 283–96.

VoL. 3 no. 1 179LuTTmER AnD SIngHAL: CuLTuRE, ConTExT, AnD THE TASTE FoR REDISTRIBuTIon
Corneo, Giacomo. 2004. “Wieso Umverteilung? Einsichten aus ökonometrischen Umfrageanalysen.” In Finanzpolitik und umverteilung, ed. B. Genser, 55–88. Berlin, Germany: Duncker and Humblot.
Corneo, Giacomo, and Hans Peter Grüner. 2002. “Individual Preferences for Political Redistribution.” Journal of Public Economics, 83(1): 83–107.
Dancygier, Rafaela, and Elizabeth N. Saunders. 2006. “A New Electorate? Comparing Preferences and Partisanship between Immigrants and Natives.” American Journal of Political Science, 50(4): 962–81.
Fairlie, Robert W., and Bruce D. Meyer. 1996. “Ethnic and Racial Self-Employment Differences and Possible Explanations.” Journal of Human Resources, 31(4): 757–93.
Fernández, Raquel. 2007. “Alfred Marshall Lecture: Women, Work, and Culture.” Journal of the Euro-pean Economic Association, 5(2–3): 305–32.
Fernández, Raquel. 2008. “Culture and Economics.” In new Palgrave Dictionary of Economics, 2nd ed., ed. Steven N. Durlauf and Lawrence E. Blume. New York, NY: Palgrave Macmillan.
Fernández, Raquel, and Alessandra Fogli. 2006. “Fertility: The Role of Culture and Family Experi-ence.” Journal of the European Economic Association, 4(2–3): 552–61.
Fernández, Raquel, and Alessandra Fogli. 2009. “Culture: An Empirical Investigation of Beliefs, Work, and Fertility.” American Economic Journal: macroeconomics, 1(1): 146–77.
Fisman, Raymond, and Edward Miguel. 2007. “Corruption, Norms, and Legal Enforcement: Evidence from Diplomatic Parking Tickets.” Journal of Political Economy, 115(6): 1020–48.
Fong, Christina M. 2001. “Social Preferences, Self-Interest, and the Demand for Redistribution.” Jour-nal of Public Economics, 82(2): 225–46.
Fong, Christina M. 2007. “Evidence from an Experiment on Charity to Welfare Recipients: Reciproc-ity, Altruism and the Empathic Responsiveness Hypothesis.” Economic Journal, 117(522): 1008–24.
Giuliano, Paola. 2007. “Living Arrangements in Western Europe: Does Cultural Origin Matter?” Jour-nal of the European Economic Association, 5(5): 927–52.
Giuliano, Paola, and Antonio Spilimbergo. 2009. “Growing up in a Recession: Beliefs and the Macro-economy.” National Bureau of Economic Research Working Paper 15321.
Guinnane, Timothy W., Carolyn M. Moehling, and Cormac Ó Gráda. 2006. “The Fertility of the Irish in the United States in 1910.” Explorations in Economic History, 43(3): 465–85.
Guiso, Luigi, Paola Sapienza, and Luigi Zingales. 2006. “Does Culture Affect Economic Outcomes?” Journal of Economic Perspectives, 20(2): 23–48.
Guiso, Luigi, Paola Sapienza, and Luigi Zingales. 2008. “Long Term Persistence.” University of Chi-cago Graduate School of Business Working Paper 08-11.
Huber, John, and Ronald Inglehart. 1995. “Expert Interpretations of Party Space and Party Locations in 42 Societies.” Party Politics, 1(1): 73–111.
Ichino, Andrea, and Giovanni Maggi. 2000. “Work Environment and Individual Background: Explain-ing Regional Shirking Differentials in a Large Italian Firm.” Quarterly Journal of Economics, 115(3): 1057–90.
Leigh, Andrew. 2005. “Economic Voting and Electoral Behavior: How Do Individual, Local, and National Factors Affect the Partisan Choice?” Economics and Politics, 17(2): 265–96.
Lipset, Seymour Martin, and Gary Marks. 2000. It Didn’t Happen Here: Why Socialism Failed in the united States. New York, NY: W. W. Norton.
Luttmer, Erzo F. P. 2001. “Group Loyalty and the Taste for Redistribution.” Journal of Political Econ-omy, 109(3): 500–528.
McCormick, Richard L. 1974. “Ethno-Cultural Interpretations of Nineteenth-Century American Vot-ing Behavior.” Political Science Quarterly, 89(2): 351–77.
Meltzer, Allan H., and Scott F. Richard. 1981. “A Rational Theory of the Size of Government.” Journal of Political Economy, 89(5): 914–27.
Norenzayan, Ara, Edward E. Smith, Beom Jun Kim, and Richard E. Nisbett. 2002. “Cultural Prefer-ences for Formal versus Intuitive Reasoning.” Cognitive Science, 26(5): 653–84.
Peng, Kaiping, and Richard E. Nisbett. 1999. “Culture, Dialectics, and Reasoning about Contradic-tion.” American Psychologist, 54(9): 741–54.
Piketty, Thomas. 1995. “Social Mobility and Redistributive Politics.” Quarterly Journal of Econom-ics, 110(3): 551–84.
Ravallion, Martin, and Michael Lokshin. 2000. “Who Wants to Redistribute? The Tunnel Effect in 1990s Russia.” Journal of Public Economics, 76(1): 87–104.
Tabellini, Guido. 2010. “Culture and Institutions: Economic Development in the Regions of Europe.” Journal of the European Economic Association, 8(4): 677–716.

This article has been cited by:
1. Ryo Arawatari, Tetsuo Ono. 2011. Retirement and social security: the roles of self-fulfillingexpectations and educational investments. Economics of Governance . [CrossRef]
2. Alberto Alesina, Paola Giuliano. 2011. FAMILY TIES AND POLITICALPARTICIPATION. Journal of the European Economic Association no-no. [CrossRef]