robustness of rapifluor-ms n-glycan sample preparations and …€¦ · prozyme glykoprep ® rapid...
TRANSCRIPT

1
WAT E R S SO LU T IO NSGlycoWorks™ RapiFluor-MS™ N-Glycan Kit
GlycoWorks HILIC µElution Plate
RapiFluor-MS Glycan Performance Test Standard
RapiFluor-MS Dextran Calibration Ladder
ACQUITY UPLC® Glycan BEH Amide, 130Å Column
XBridge® Glycan BEH Amide, 130Å Column
ACQUITY UPLC H-Class Bio System
ACQUITY® QDa® Mass Detector
Xevo® G2-XS QTof MS
SYNAPT® G2-Si HDMS
K E Y W O R D SGlycoWorks, RapiFluor-MS, RapiGest™ SF, Rapid Tagging, PNGase F, Deglycosylation, ACQUITY UPLC H-Class Bio System, BEH Amide 130Å, Glycans, Glycoproteins, Glycosylation, HILIC, Fluorescence
A P P L I C AT IO N B E N E F I T S ■■ High yield sample preparation with
quantitative recovery to ensure accurate and repeatable profiling of N-glycans
■■ Comparability to historical 2-AB based released glycan analysis approaches
■■ RapiFluor-MS Glycan Performance Test Standard for method familiarization, troubleshooting, and benchmarking
■■ Robust Glycan BEH Amide HILIC separations supported by GU calibration with the novel RapiFluor-MS Dextran Calibration Ladder
IN T RO DU C T IO N
N-glycosylation of proteins is routinely characterized and monitored because
of its significance to the detection of disease states1-3 and the manufacturing
of biopharmaceuticals.4-5 Glycosylation profiles are most often assessed by
means of released glycan analyses, wherein samples are often prepared by
techniques that are notoriously time-consuming or lead to compromises in MS
sensitivity.6-7 With the development of the GlycoWorks RapiFluor-MS N-Glycan
Kit, we have addressed these shortcomings by enabling unprecedented sensitivity
for glycan detection while also improving the throughput of N-glycan sample
preparation.8 Using the GlycoWorks RapiFluor-MS N-Glycan Kit, glycoproteins are
deglycosylated in 10 minutes to produce N-glycosylamines that are then rapidly
reacted with the novel RapiFluor-MS labeling reagent (Figure 1). In a final step,
the resulting labeled glycans are extracted from reaction byproducts by means
of an SPE method that facilitates immediate analysis of samples. As a result, an
analyst can now complete an N-glycan sample preparation, from glycoprotein
to ready-to-analyze sample, in just 30 minutes and be poised to perform high
sensitivity N-glycan profiling using hydrophilic interaction chromatography
(HILIC) and mass spectrometric (MS) or fluorescence (FLR) detection.
Equally important as the efficiency and sensitivity gains afforded by this new
sample preparation approach is its robustness and its ability to produce results
consistent with historical N-glycan profiling. Within this application note, we will
discuss these attributes of the RapiFluor-MS based sample preparation and the
corresponding HILIC-based LC analyses.
Robustness of RapiFluor-MS N-Glycan Sample Preparations and Glycan BEH Amide HILIC Chromatographic SeparationsMatthew A. Lauber,1 Michael F. Morris,1 Darryl W. Brousmiche,1 and Stephan M. Koza1
1 Waters Corporation, Milford, MA, USA
2
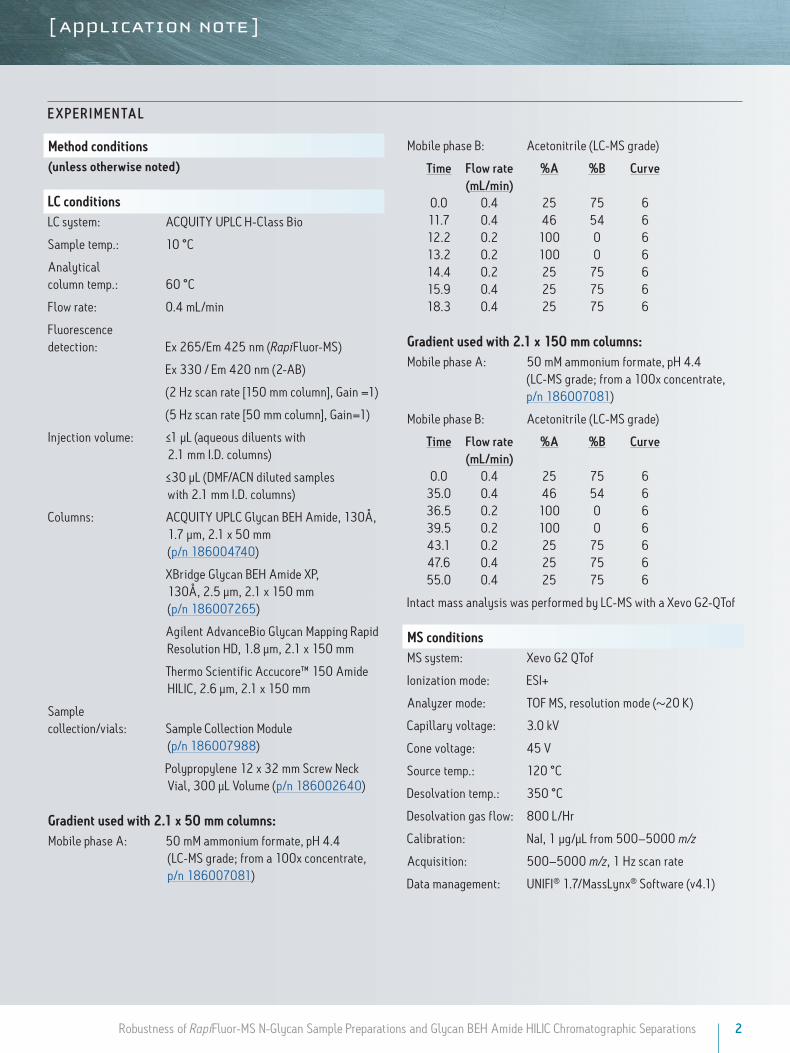
E X P E R IM E N TA L
Method conditions (unless otherwise noted)
LC conditionsLC system: ACQUITY UPLC H-Class Bio
Sample temp.: 10 °C
Analytical column temp.: 60 °C
Flow rate: 0.4 mL/min
Fluorescencedetection: Ex 265/Em 425 nm (RapiFluor-MS)
Ex 330 / Em 420 nm (2-AB)
(2 Hz scan rate [150 mm column], Gain =1)
(5 Hz scan rate [50 mm column], Gain=1)
Injection volume: ≤1 µL (aqueous diluents with 2.1 mm I.D. columns)
≤30 µL (DMF/ACN diluted samples with 2.1 mm I.D. columns)
Columns: ACQUITY UPLC Glycan BEH Amide, 130Å, 1.7 µm, 2.1 x 50 mm (p/n 186004740)
XBridge Glycan BEH Amide XP, 130Å, 2.5 µm, 2.1 x 150 mm (p/n 186007265)
Agilent AdvanceBio Glycan Mapping Rapid Resolution HD, 1.8 µm, 2.1 x 150 mm
Thermo Scientific Accucore™ 150 Amide HILIC, 2.6 µm, 2.1 x 150 mm
Sample collection/vials: Sample Collection Module
(p/n 186007988)
Polypropylene 12 x 32 mm Screw Neck Vial, 300 µL Volume (p/n 186002640)
Gradient used with 2.1 x 50 mm columns:Mobile phase A: 50 mM ammonium formate, pH 4.4
(LC-MS grade; from a 100x concentrate, p/n 186007081)
Mobile phase B: Acetonitrile (LC-MS grade)
Time Flow rate %A %B Curve (mL/min) 0.0 0.4 25 75 6 11.7 0.4 46 54 6 12.2 0.2 100 0 6 13.2 0.2 100 0 6 14.4 0.2 25 75 6 15.9 0.4 25 75 6 18.3 0.4 25 75 6
Gradient used with 2.1 x 150 mm columns:Mobile phase A: 50 mM ammonium formate, pH 4.4
(LC-MS grade; from a 100x concentrate, p/n 186007081)
Mobile phase B: Acetonitrile (LC-MS grade)
Time Flow rate %A %B Curve (mL/min) 0.0 0.4 25 75 6 35.0 0.4 46 54 6 36.5 0.2 100 0 6 39.5 0.2 100 0 6 43.1 0.2 25 75 6 47.6 0.4 25 75 6 55.0 0.4 25 75 6
Intact mass analysis was performed by LC-MS with a Xevo G2-QTof
MS conditionsMS system: Xevo G2 QTof
Ionization mode: ESI+
Analyzer mode: TOF MS, resolution mode (~20 K)
Capillary voltage: 3.0 kV
Cone voltage: 45 V
Source temp.: 120 °C
Desolvation temp.: 350 °C
Desolvation gas flow: 800 L/Hr
Calibration: NaI, 1 µg/µL from 500–5000 m/z
Acquisition: 500–5000 m/z, 1 Hz scan rate
Data management: UNIFI® 1.7/MassLynx® Software (v4.1)
Robustness of RapiFluor-MS N-Glycan Sample Preparations and Glycan BEH Amide HILIC Chromatographic Separations

3
Sample description
RapiFluor-MS labeled N-glycans were prepared from
glycoproteins, including Intact mAb Mass Check
Standard (p/n: 186006552), using a GlycoWorks
RapiFluor-MS N-Glycan Kit (p/n: 176003606)
according to the guidelines provided in its Care
and Use Manual (715004793).
2-AB labeled N-glycans were prepared using a
Prozyme GlykoPrep® Rapid N-Glycan Preparation
with 2-AB Kit according to the manufacturer’s
recommended protocol. In addition, 2-AB labeled
N-glycans were also prepared using an approach
combining the use of a Prozyme GlykoPrep Digestion
Module, an in-house optimized 2-AB labeling
protocol, and a GlykoPrep Cleanup Module
(Prozyme, Hayward, CA).
1.5 x 10⁷ pg IgG1 pmol
150,000 pg
2 pmol glycan
1 pmol IgG
0.45 pmol FA2
1 pmol total glycan pool
10 µL injection
400 µL sample prepared
X X X X = 2.3 pmol
15 min 5 min 10 min
Figure 1. GlycoWorks RapiFluor-MS N-Glycan Kit sample preparation workflow and the chemical structure of the RapiFluor-MS Reagent.
RapiFluor-MS Glycan Performance Test Standard (p/n: 186007983) was reconstituted in 50 µL of water and
injected as a 1 µL volume for chromatographic benchmarking and lifetime testing experiments. RapiFluor-MS
Dextran Calibration Ladder (p/n: 186007982) was reconstituted in 100 µL of water and injected as a 1 µL
volume for retention time calibrations.
Percent yields for the sample preparation workflows were determined by means of quantitative analyses.
Column loads were calibrated using external quantitative standards of 2-AB labeled triacetyl chitotriose
and RapiFluor-MS derivatized propylamine obtained in high purity (confirmed by HPLC and 1H NMR).
To determine percent yields, the measured quantities of FA2 glycan from Intact mAb Mass Check Standard
(p/n: 186006552) were compared to theoretical yields calculated for the preparation. For example, the
theoretical yield for the FA2 glycan resulting from the GlycoWorks RapiFluor-MS N-Glycan Kit was calculated
as follows:
*This calculation is based on the assumption that the sample of Intact mAb Mass Check Standard was 15 μg, that the mAb has a molecular weight of 150 kDa, that there are only 2 N-glycans per one mAb, that the N-glycan profile of the mAb contains the FA2 glycan at a relative abundance of 45%, and that only 2.5% of the sample was analyzed.
Robustness of RapiFluor-MS N-Glycan Sample Preparations and Glycan BEH Amide HILIC Chromatographic Separations

4
R E SU LT S A N D D IS C U S S IO N
Robust sample preparation: Deglycosylation
Each procedural step in the GlycoWorks RapiFluor-MS
N-Glycan Kit has been optimized to be high yielding
and to minimize the introduction of bias to an
N-glycan profile. Previous work based on SDS
PAGE gel shift assays has demonstrated that the
rapid deglycosylation procedure developed for
this kit produces complete deglycosylation of a
diverse set of glycoproteins.8 This completeness of
deglycosylation is also supported by intact mass
analysis using LC-MS, where the deglycosylation of
a monoclonal antibody (mAb) can be readily tracked.
Figure 2 presents deconvoluted ESI mass spectra
for Intact mAb Mass Check Standard, a murine IgG1
mAb. The top spectrum shows the mAb before it had
been subjected to rapid deglycosylation (Figure 2A).
The bottom spectrum meanwhile presents the mAb
after it was processed according to the approach
specified in the GlycoWorks RapiFluor-MS N-Glycan
Kit, wherein glycoproteins are subjected to 1% (w/v)
RapiGest SF Surfactant-assisted heat denaturation
followed by incubation with Rapid PNGase F at
50 °C for 5 minutes (Figure 2B). The masses
observed in these spectra confirm that these
samples differ in terms of glycan occupancy. The
control sample contains the mAb in its doubly
glycosylated, native form (one glycan on each heavy
chain). In contrast, the sample subjected to the
proposed 2-step rapid deglycosylation procedure is
homogenous with an observed molecular weight that
is in agreement with the predicted molecular weight
of the fully deglycosylated mAb (145.3 kDa). And
although high temperatures are employed in this
method for the purpose of heat denaturation,
no detrimental effects on an N-glycan profile have
been observed. To this point, notice that there
are no differences in an N-glycan profile prepared
from pooled human IgG when using an excessive
20 minute heat denaturation at 90 °C versus the
rapid 3 minute procedure (Figure 3).
145000 150000
145000 150000
148.4 kDa
145.3 kDa
No PNGase F
3 min≥90˚C
5 min50˚C
A
B
Pooled hIgG90 ˚C3 min denaturation
Pooled hIgG90 ˚C20 min denaturation
Recommended procedure
No significant change to the glycan profile
A
B
Figure 2. Intact mass analysis of Intact mAb Mass Check Standard (A) before and (B) after rapid deglycosylation with the GlycoWorks RapiFluor-MS N-Glycan Kit.
Figure 3. Testing the effects of subjecting human IgG and its N-glycans to heat denaturation. (A) The RapiFluor-MS N-glycan profile as observed using the recommended 3-minute heat denaturation versus (B) the RapiFluor-MS N-glycan profile as observed using a 20-minute heat denaturation.
Robustness of RapiFluor-MS N-Glycan Sample Preparations and Glycan BEH Amide HILIC Chromatographic Separations

5
Robust sample preparation: Rapid labeling
The efficiency of the sample preparation carries
over from deglycosylation to RapiFluor-MS labeling.
A primary concern in this step is the relative stability
of the PNGase F released N-glycosylamines, which
are required for RapiFluor-MS labeling, in the pH
7.9 GlycoWorks Rapid Buffer. A time-course study
involving varying delays between deglycosylation
and RapiFluor-MS labeling steps has shown that the
N-glycosylamines have a relatively long half-life of
approximately 2 hours at 50 °C (Figure 4). That is,
with our 5 minute deglycosylation step, there should
be little concern over sample loss (< 3% loss) due to
hydrolysis of the glycosylamine. In addition, sample
losses from the labeling reaction are minimal. Many
experimental parameters were explored during the
development of the rapid labeling reaction specified
in the RapiFluor-MS N-Glycan Kit, including pH,
temperature, ionic strength, time, buffer components,
and reagent molar excess. Figure 5 shows an example
of optimizing the reagent molar excess as needed to
maximize labeling yield. Fluorescence chromatograms
for labeled, released N-glycans from Intact mAb Mass
Check Standard are stacked on the left (Figure 5A).
Note that with the GlycoWorks RapiFluor-MS N-Glycan
Kit proteins are purposely not depleted from the
sample after deglycosylation to save time and to give
better control over the labeling. The RapiFluor-MS
Reagent is therefore used in a molar excess over all
of the nucleophiles from the glycoprotein, which for
an IgG corresponds to approximately seventy five
protein amines and two N-glycosylamines. Each of the
corresponding samples was obtained from labeling
a fixed glycoprotein concentration of 0.36 mg/mL
with RapiFluor-MS Reagent at concentrations varying
from 18 to 108 mM. As shown in Figure 5B,
plotting of the fluorescence peak areas for the
resulting N-glycan profile indicates that labeling
is maximized near a RapiFluor-MS Reagent
concentration of 36 mM, the conditions designed
into the GlycoWorks RapiFluor-MS N-Glycan Kit.
Moreover, molar excess conditions both higher and
lower than the 36 mM reagent condition produced
comparable fluorescence profiles, underscoring the
robustness of RapiFluor-MS labeling.
FA2
FA2
5 m in
1 0 m in
2 0 m in
4 0 m in
1st Order 2nd Order
50 ˚C 100 min 120 min
37 ˚C 200 min 240 min
RT 400 min 480 min
E s tim a ted t1/2
I ncuba tion tim e pr ior to ra pid la beling
A
B
Figure 4. Estimating the half-life of N-glycosylamine hydrolysis through a time-course on deglycosylation incubation. (A) Fluorescence traces for RapiFluor-MS labeled FA2 from Intact mAb Mass Check Standard observed after implementing varying incubation times for deglycosylation (50˚C incubations). (B) Approximation of the N-glycosylamine half-life assuming 1st or 2nd order reaction kinetics.
Figure 5. Optimization of labeling reagent molar excess for the GlycoWorks RapiFluor-MS N-Glycan Kit. (A) Fluorescence chromatograms for labeled glycans obtained by titration of 0.36 mg/mL deglycosylated Intact mAb Mass Check Standard with varying concentrations of RapiFluor-MS Reagent. Separations were performed with labeled glycans from 0.4 μg of glycoprotein and an ACQUITY UPLC Glycan BEH Amide, 130Å, 1.7 μm, 2.1 x 50 mm Column. (B) Fluorescence peak area as a function of RapiFluor-MS Reagent concentration.
Reagent Concentration (mM)
RapiFluor-MS Concentration
0.0E+0
1.6E+5
0 50 100
FA2
Fluo
resc
ence
Pea
k Are
a
RapiFluor-MS Reagent Concentration (mM)
18 mM
36 mM
54 mM
72 mM
108 mM
4 9 min
A B Maximized yield
Robustness of RapiFluor-MS N-Glycan Sample Preparations and Glycan BEH Amide HILIC Chromatographic Separations
6
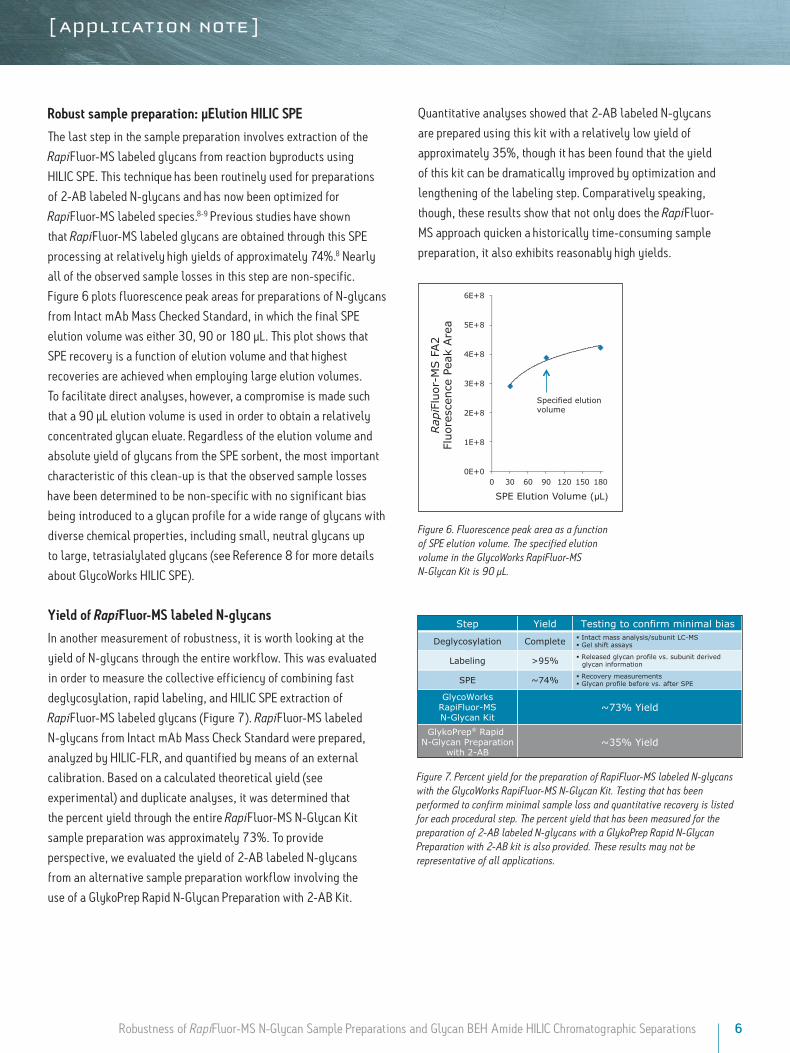
Robust sample preparation: μElution HILIC SPE
The last step in the sample preparation involves extraction of the
RapiFluor-MS labeled glycans from reaction byproducts using
HILIC SPE. This technique has been routinely used for preparations
of 2-AB labeled N-glycans and has now been optimized for
RapiFluor-MS labeled species.8-9 Previous studies have shown
that RapiFluor-MS labeled glycans are obtained through this SPE
processing at relatively high yields of approximately 74%.8 Nearly
all of the observed sample losses in this step are non-specific.
Figure 6 plots fluorescence peak areas for preparations of N-glycans
from Intact mAb Mass Checked Standard, in which the final SPE
elution volume was either 30, 90 or 180 µL. This plot shows that
SPE recovery is a function of elution volume and that highest
recoveries are achieved when employing large elution volumes.
To facilitate direct analyses, however, a compromise is made such
that a 90 µL elution volume is used in order to obtain a relatively
concentrated glycan eluate. Regardless of the elution volume and
absolute yield of glycans from the SPE sorbent, the most important
characteristic of this clean-up is that the observed sample losses
have been determined to be non-specific with no significant bias
being introduced to a glycan profile for a wide range of glycans with
diverse chemical properties, including small, neutral glycans up
to large, tetrasialylated glycans (see Reference 8 for more details
about GlycoWorks HILIC SPE).
Yield of RapiFluor-MS labeled N-glycans
In another measurement of robustness, it is worth looking at the
yield of N-glycans through the entire workflow. This was evaluated
in order to measure the collective efficiency of combining fast
deglycosylation, rapid labeling, and HILIC SPE extraction of
RapiFluor-MS labeled glycans (Figure 7). RapiFluor-MS labeled
N-glycans from Intact mAb Mass Check Standard were prepared,
analyzed by HILIC-FLR, and quantified by means of an external
calibration. Based on a calculated theoretical yield (see
experimental) and duplicate analyses, it was determined that
the percent yield through the entire RapiFluor-MS N-Glycan Kit
sample preparation was approximately 73%. To provide
perspective, we evaluated the yield of 2-AB labeled N-glycans
from an alternative sample preparation workflow involving the
use of a GlykoPrep Rapid N-Glycan Preparation with 2-AB Kit.
0E+0
1E+8
2E+8
3E+8
4E+8
5E+8
6E+8
0 30 60 90 120 150 180
Rap
iFlu
or-M
S F
A2
Fl
uore
scen
ce P
eak
Are
a
SPE Elution Volume ( L)
Specified elution volume
Figure 6. Fluorescence peak area as a function of SPE elution volume. The specified elution volume in the GlycoWorks RapiFluor-MS N-Glycan Kit is 90 μL.
Figure 7. Percent yield for the preparation of RapiFluor-MS labeled N-glycans with the GlycoWorks RapiFluor-MS N-Glycan Kit. Testing that has been performed to confirm minimal sample loss and quantitative recovery is listed for each procedural step. The percent yield that has been measured for the preparation of 2-AB labeled N-glycans with a GlykoPrep Rapid N-Glycan Preparation with 2-AB kit is also provided. These results may not be representative of all applications.
FA2 Rep #1 1.6 pmol Rep #2 1.7 pmol 100% Theoretical Yield = 2.3 pmol
Step Yield Testing to confirm minimal bias
Deglycosylation Complete Intact mass analysis/subunit LC-MS Gel shift assays
Labeling >95% Released glycan profile vs. subunit derived glycan information
SPE ~74% Recovery measurements Glycan profile before vs. after SPE
GlycoWorks RapiFluor-MS N-Glycan Kit
~73% Yield
GlykoPrep® Rapid N-Glycan Preparation
with 2-AB ~35% Yield
1
2
3
Quantitative analyses showed that 2-AB labeled N-glycans
are prepared using this kit with a relatively low yield of
approximately 35%, though it has been found that the yield
of this kit can be dramatically improved by optimization and
lengthening of the labeling step. Comparatively speaking,
though, these results show that not only does the RapiFluor-
MS approach quicken a historically time-consuming sample
preparation, it also exhibits reasonably high yields.
Robustness of RapiFluor-MS N-Glycan Sample Preparations and Glycan BEH Amide HILIC Chromatographic Separations

7
Minimal impact to glycan profiling with reagent batch variation
Lastly, sample preparations with the GlycoWorks
RapiFluor-MS N-Glycan Kit have proven to be robust
with respect to reagent manufacturing. A robustness
study was performed to test the impact of changing
the batches of each reagent that plays a critical
role in the preparation of RapiFluor-MS labeled
N-glycans, namely RapiGest SF, GlycoWorks Rapid
Buffer, GlycoWorks Rapid PNGase F, RapiFluor-MS
Reagent, DMF Reagent Solvent, GlycoWorks µElution
SPE Plate, and the SPE Elution Buffer. Three sets of
these reagents, each varying by batch, were tested
in their application to profiling the N-glycans from
Intact mAb Mass Check Standard. Average relative
abundances observed for the glycan species in
this standard with the three different reaction sets
are presented in Figure 8. Relative abundances of
N-glycans were observed to be largely comparable
across the different preparations with an average
RSD for the labeled N-glycan species being 2.3%.
Comparability to 2-AB N-glycan profiling
Another critical aspect to the RapiFluor-MS
N-glycan sample preparation is that it can be used
in place of legacy 2-AB methods without requiring
significant adaptations to existing analytical
techniques. With the speed of the sample preparation
and the enhanced method sensitivity afforded
by the RapiFluor-MS tag,8 the task of analyzing
N-glycosylation is in fact made significantly easier.
Just like 2-AB labeled glycans, RapiFluor-MS
labeled glycans are ideally suited for HILIC
separations with an amide bonded stationary
phase, such as that found in the Waters Glycan
BEH Amide Columns. Figure 9 shows example
separations for 2-AB and RapiFluor-MS labeled
glycans obtained from Intact mAb Mass Check
Standard. The 2-AB labeled glycans, in this case,
were prepared using the previously mentioned
GlykoPrep Kit and an approximately 3.5 hour
protocol, whereas the RapiFluor-MS labeled
glycans were prepared in less than 30 minutes
using a GlycoWorks RapiFluor-MS N-Glycan Kit.
Reac�on setSpecies 1 2 3 Avg Std Dev RSD
A2 1.23 1.25 1.21 1.23 0.021 1.70 FA2 44.54 43.95 43.29 43.93 0.622 1.42
FA2G1 19.81 20.01 19.95 19.92 0.101 0.51 FA2G1 22.54 22.86 22.91 22.77 0.199 0.87 FA2G2 8.93 9.02 9.42 9.12 0.264 2.90
FA2G2Sg1/FA2G2Ga2 0.92 0.82 0.94 0.89 0.060 6.71
Percent Abundance (%) 50
45
40
35
30
25
20
15
10
5
0
Reac�on set 1
Reac�on set 2
Reac�on set 3
Perc
ent
Abu
ndan
ce (
%)
A2
FA2
FA2G
1 FA
2G1’
FA
2G2
FA2G
2Sg1
/
FA2G
2Ga2
For each reaction set: unique batches of RapiGest SF, Rapid Buffer, Rapid PNGase F, RapiFluor-MS Reagent, DMF Reagent Solvent, GlycoWorks Elution SPE plate, SPE Elution Buffer.
2-AB
RapiFluor-MS
1 2 3
4
5 6
7 8
9 10
11
12 13 14 15 16 17 18
Peak Glycan Name
1 A1 2 FA1 3 A2 4 FA2 5 A2G1 6 A2G1 7 FA2G1 8 FA2G1 9 FA2BG1 10 FA2BG1 11 FA2G2 12 FA2G1Ga1 13 FA2G2Ga1 14 FA2G2Sg1 15 FA2G2Sg1 16 FA2G2Ga2 17 FA2G2GaSg1 18 FA2G2Ga1Sg1
Figure 8. Characterization of batch-to-batch variation in the RapiFluor-MS sample preparation. Percent abundances were measured for the preparation of RapiFluor-MS labeled N-glycans from Intact mAb Mass Check Standard using three different sets of materials. Each reaction set was represented by unique batches of RapiGest SF, Rapid Buffer, Rapid PNGase F, RapiFluor-MS Reagent, DMF Reagent Solvent, GlycoWorks μElution SPE plate, SPE Elution Buffer. Testing was performed in triplicate. FA2G1’ denotes the structural isomer of FA2G1.
Figure 9. Similarity between 2-AB and RapiFluor-MS N-glycan HILIC profiles for a typical mAb. Fluorescence chromatograms for labeled glycans from Intact mAb Mass Check Standard using an ACQUITY UPLC BEH Amide, 130Å, 1.7 μm, 2.1 x 150 mm Column. Peak identifications for the RapiFluor-MS labeled N-glycans are provided. 2-AB labeled N-glycans were prepared using a GlykoPrep Rapid N-Glycan Preparation with 2-AB kit. (') denotes a structural isomer.
Robustness of RapiFluor-MS N-Glycan Sample Preparations and Glycan BEH Amide HILIC Chromatographic Separations
8
So that chromatograms exhibiting equivalent signal-to-noise could be compared, the RapiFluor-MS sample was
analyzed in this study at a significantly lower mass load than the 2-AB labeled sample. Despite being prepared
by different approaches, it can be seen that the labeled N-glycans are resolved by the HILIC separation into
very similar profiles. For a typical mAb profile, RapiFluor-MS and 2-AB labeling both yield HILIC glycan
separations with similar selectivity. However, as a result of its additional hydrogen bonding donors/acceptors,
the RapiFluor-MS label introduces a slight shift of the mAb N-glycan profile to higher retention times. This
change in the absolute retention window of an N-glycan profile is predictable and can therefore be easily
accounted for when transitioning from 2-AB to RapiFluor-MS based methods.
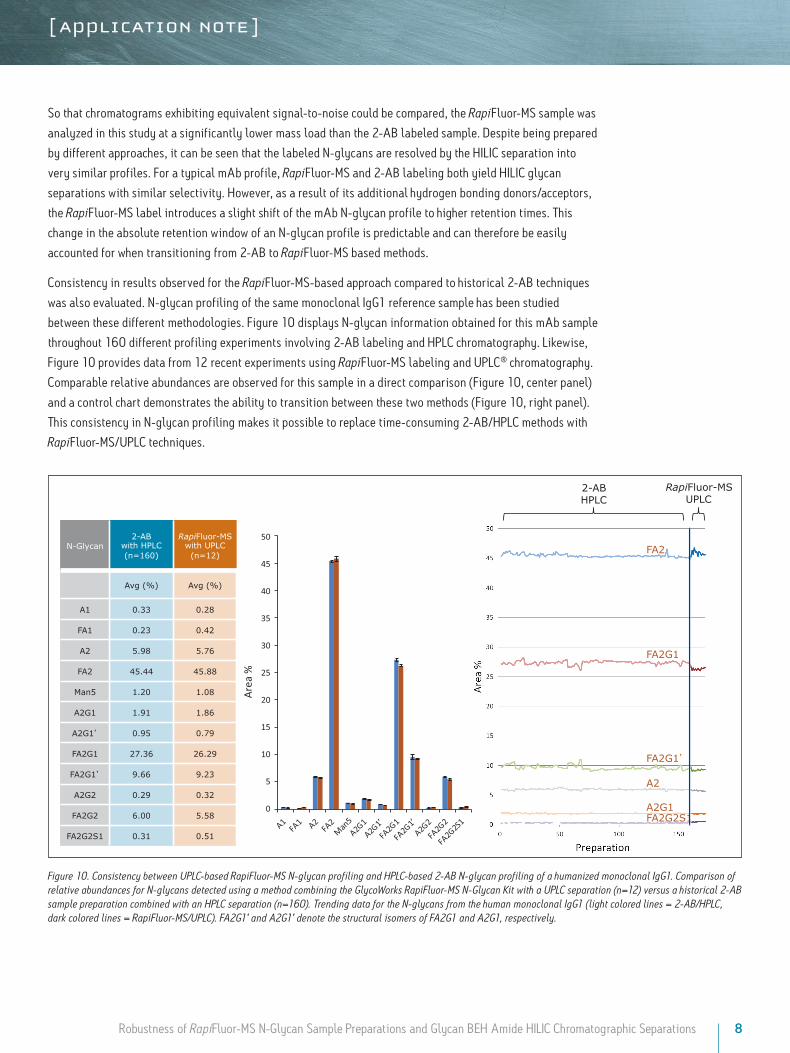
Consistency in results observed for the RapiFluor-MS-based approach compared to historical 2-AB techniques
was also evaluated. N-glycan profiling of the same monoclonal IgG1 reference sample has been studied
between these different methodologies. Figure 10 displays N-glycan information obtained for this mAb sample
throughout 160 different profiling experiments involving 2-AB labeling and HPLC chromatography. Likewise,
Figure 10 provides data from 12 recent experiments using RapiFluor-MS labeling and UPLC® chromatography.
Comparable relative abundances are observed for this sample in a direct comparison (Figure 10, center panel)
and a control chart demonstrates the ability to transition between these two methods (Figure 10, right panel).
This consistency in N-glycan profiling makes it possible to replace time-consuming 2-AB/HPLC methods with
RapiFluor-MS/UPLC techniques.
N-Glycan 2-AB
with HPLC (n=160)
RapiFluor-MS with UPLC
(n=12)
Avg (%) Avg (%)
A1 0.33 0.28
FA1 0.23 0.42
A2 5.98 5.76
FA2 45.44 45.88
Man5 1.20 1.08
A2G1 1.91 1.86
A2G1 0.95 0.79
FA2G1 27.36 26.29
FA2G1 9.66 9.23
A2G2 0.29 0.32
FA2G2 6.00 5.58
FA2G2S1 0.31 0.51
FA2
FA2G1
FA2G1
A2
A2G1 FA2G2S1
2-AB HPLC
RapiFluor-MS UPLC
Are
a %
50
45
40
35
30
25
20
15
10
5
0
Figure 10. Consistency between UPLC-based RapiFluor-MS N-glycan profiling and HPLC-based 2-AB N-glycan profiling of a humanized monoclonal IgG1. Comparison of relative abundances for N-glycans detected using a method combining the GlycoWorks RapiFluor-MS N-Glycan Kit with a UPLC separation (n=12) versus a historical 2-AB sample preparation combined with an HPLC separation (n=160). Trending data for the N-glycans from the human monoclonal IgG1 (light colored lines = 2-AB/HPLC, dark colored lines = RapiFluor-MS/UPLC). FA2G1' and A2G1' denote the structural isomers of FA2G1 and A2G1, respectively.
Robustness of RapiFluor-MS N-Glycan Sample Preparations and Glycan BEH Amide HILIC Chromatographic Separations

9
Robustness of RapiFluor-MS N-glycan separations with glycan BEH amide columns
The robustness and resolving power of the HILIC column chromatography is critically important to successfully
implementing this methodology. To this end, a test standard called RapiFluor-MS Glycan Performance Test
Standard is available for method familiarization, system suitability, troubleshooting, and benchmarking
studies. This standard contains a complex mixture of RapiFluor-MS N-glycans from human IgG that has been
isolated from pooled human serum. Its composition of approximately 20 different major constituents makes it
useful for evaluating the resolving power of a separation and the sensitivity of detection methods (Figure 11).
1
2
3
4 5
6
7
8
9 10
11
12 13
14
15 16 17
Glycan Labeled Glycan RapiFluor-MS
Composition Mi (Da) Mavg (Da)
1 A2 C67H105O37N9 1627.6611 1628.5887 2 FA2 C73H115O41N9 1773.7190 1774.7299 3 FA2B C81H128O46N10 1976.7984 1977.9224 4 A2G1 C73H115O42N9 1789.7140 1790.7293 5 A2G1 C73H115O42N9 1789.7140 1790.7293 6 FA2G1 C79H125O46N9 1935.7719 1936.8705 7 FA2G1 C79H125O46N9 1935.7719 1936.8705 8 FA2BG1 C87H138O51N10 2138.8512 2140.0630 9 FA2BG1 C87H138O51N10 2138.8512 2140.0630 10 A2G2 C79H125O47N9 1951.7668 1952.8699 11 FA2G2 C85H135O51N9 2097.8247 2099.0111 12 FA2BG2 C93H148O56N10 2300.9041 2302.2036 13 FA2G1S1 C90H142O54N10 2226.8673 2228.1251 14 FA2G2S1 C96H152O59N10 2388.9201 2390.2657 15 FA2BG2S1 C104H165O64N11 2591.9995 2593.4582 16 FA2G2S2 C107H169O67N11 2680.0150 2681.5203 17 FA2BG2S2 C115H182O72N12 2883.0949 2884.7128
RapiFluor-MS Glycan Performance Test Standard
Figure 11. RapiFluor-MS Glycan Performance Test Standard. An example fluorescence chromatogram obtained from an 8 pmole load of the standard and a separation with an ACQUITY UPLC Glycan BEH Amide, 130Å, 1.7 μm, 2.1 x 150 mm Column. Peak identifications are provided. FA2G1', A2G1', and FA2BG1' denote the structural isomers of FA2G1, A2G1, and FA2BG1 respectively.
In line with its intended purpose, we have used the RapiFluor-MS Glycan Performance Test Standard to
benchmark the chromatographic performance of four different columns containing amide bonded stationary
phases designed for glycan separations. Two of the columns were UPLC-based and contained sub-2-µm
particles while the remaining two were intended for use on HPLC instrumentation and contained 2.5 µm
and 2.6 µm particles. Figure 12 shows representative chromatograms obtained with each of these columns
run under equivalent conditions and linear velocities. Four glycan species spread across these separations
were monitored to measure retention windows, average peak widths, and peak capacities. Notice that whether
performing a separation with a phase intended for UPLC or HPLC chromatography, Glycan BEH Amide Columns
provide exemplary resolving power and comparable selectivities thereby enabling the seamless transfer of this
glycan separation between HPLC and UPLC platforms.10
Robustness of RapiFluor-MS N-Glycan Sample Preparations and Glycan BEH Amide HILIC Chromatographic Separations

10
Figure 12. Chromatographic benchmarking of HILIC columns containing amide bonded stationary phases designed for glycan separations. Fluorescence chromatograms of the RapiFluor-MS Glycan Performance Test Standard were obtained from an 8 pmole load of the standard and separations with 2.1 x 150 mm columns. All separations were performed at the same linear velocity on an ACQUITY UPLC H-Class Bio System. Four glycan species spread across the separations were monitored to measure retention windows, average peak widths, and peak capacities.
Agilent AdvanceBio Glycan Mapping, 1.8 m
ACQUITY UPLCGlycan BEH Amide,130Å, 1.7 µm
Thermo Accucore Amide, 150Å, 2.6 m
XBridge Glycan BEH Amide XP , 130Å, 2.5 m
Pc* = 94
RT1,4 = 12.39 min Wh,avg = 7.87 sec
Pc* = 83
RT1,4 = 12.80 min Wh,avg = 9.28 sec
Pc* = 82
RT1,4 = 12.91 min Wh,avg = 9.48 sec
Pc* = 76
RT1,4 = 10.57 min W
Comparative separations may not be representative of all applications.
h,avg = 8.40 sec
1
2
3
4 1
2
3
4
1
2
3
4 4
3
2
1
3 - FA2G2S1
2 – FA2G1
1 – A2
4 – FA2BG2S2
3 - FA2G2S1FF
2 – FA2G1FF
4 – FA2BG2S2FF
Separations of RapiFluor-MS labeled glycans with glycan BEH amide columns have also proven to be very
robust. In demonstration of this, a single Glycan BEH Amide, 130Å, 1.7 μm Column was subjected to lifetime
testing and 300 sequential runs. At every 20th run, RapiFluor-MS Glycan Performance Test Standard was
separated in order to track any changes in the retentivity and selectivity of the column.
Chromatograms corresponding to the 1st and 300th runs are provided in Figures 13A and 13B, respectively.
Quite clearly, near identical separations were obtained at the onset as well as at the end of this approximately
2-week constant use scenario, with no significant shifts in retention times of the labeled N-glycans having
been observed throughout the testing (Figure 13C).
y = 6E-5x + 5.4777R = 0.09
y = 4E-5x + 6.5806R = 0.03
y = 2E-5x + 8.6452R = 0.01
y = -3E-5x + 9.9527R = 0.02
4
5
6
7
8
9
10
11
0 100 200 300
GU
Val
ue
Run
5
10
15
20
25
30
0 100 200 300
Ret
ention
Tim
e (m
in)
Run
300th Run RapiFluor-MS Glycan Performance Test Standard (after 12 days, 10° C)
1st Run RapiFluor-MS Glycan Performance Test Standard (Initial)
1
2
3
4
3 – FA2G2S1
2 – FA2G1
1 – A2
4 – FA2BG2S2
3 – FA2G2S1
2 – FA2G1
1 – A2
4 – FA2BG2S2
1
2
3
4
A
B
C
D
Glycan BEH Amide, 130Å, 1.7 m
Figure 13. Robustness testing of an ACQUITY UPLC Glycan BEH Amide, 130Å, 1.7 μm 2.1 x 150 mm Column for separations of RapiFluor-MS labeled N-glycans. Fluorescence chromatograms of the RapiFluor-MS Glycan Performance Test Standard were obtained at every 20th run from an 8 pmole load of the standard. Four glycan species spread across the separations were monitored to track the retentivity of the stationary phase and column. Fluorescence chromatograms are shown for the (A) 1st run and the (B) 300th run with the column. (C) Retention times as a function of run. (D) Glucose unit (GU) values as a function of run.
Robustness of RapiFluor-MS N-Glycan Sample Preparations and Glycan BEH Amide HILIC Chromatographic Separations

11
In this testing, LC calibrations were performed after every
separation of the glycan mixture through application of a dextran
ladder and assignment of glucose unit (GU) values. Separations
with glycan BEH amide columns can be used in conjunction with
glucose unit (GU) values as a means to calibrate HILIC-based
glycan separations. Use of GU values minimizes subtle retention
time variations between runs and between different instruments
by expressing chromatographic retention in terms of standardized
GU values.11 To assign GU values, a dextran ladder (comprised of
glucose multimers of increasing length) is used as an external
calibrant. The retention times of the glucose multimers are then
used via cubic spline fitting to convert glycan retention times
into GU values.
The development of a dextran calibration ladder suitable for use
with RapiFluor-MS labeled glycans was essential yet technically
challenging. Given that dextran is a reducing sugar without a strong
nucleophile, it cannot, unlike N-glycosylamines, be readily labeled
with RapiFluor-MS Reagent. Because of the distinctive urea linkage
imparted to N-glycans upon their derivatization with rapid tagging
reagents, RapiFluor-MS labeled N-glycans have very unique
fluorescence maxima at approximately 265 nm (excitation) and
425 nm (emission) (Figure 14A). In a novel labeling approach, we
have prepared a RapiFluor-MS Dextran Calibration Ladder by first
reductively aminating dextran with ethanolamine and then labeling
it with RapiFluor-MS.
The resulting urea-linked dextran derivatives exhibit identical
fluorescence properties to those of RapiFluor-MS labeled
N-glycans. Furthermore, the obtained dextran is tuned for
desired HILIC retention because of the hydroxyl group being
incorporated through ethanolamine. A representative fluorescence
chromatogram for this novel dextran ladder is provided in Figure
14B, and an example cubic spline fit of the retention data is shown
in Figure 14C.
The impact of implementing GU value calibration is exemplified in
Figure 13D, where the retention time data throughout the Glycan
BEH Amide lifetime testing are reported in GU values. In comparing
the retention time data shown in Figure 13C to the GU data in
Figure 13D, one can see that the subtle fluctuations in retention
times across the 2-week lifetime testing are compensated for by
the GU calibration. In fact, RSDs for the GU value data are reduced
by a factor of 2 compared to the RSDs in the retention time data.
Also, linear regression analysis of the GU value data shows that
there is essentially no drifting in the HILIC retention data once
calibrated using a dextran ladder. This analysis therefore clearly
demonstrates the value of GU calibration with respect to improving
the quality of reported data.
Emission Wavelength (nm)
235 nm
240 nm
245 nm
250 nm
255 nm
260 nm
265 nm
270 nm
275 nm
280 nm
285 nm
290 nm
295 nm
Excitation,Max=265 nm
Emission,Max=425 nm Ex 265 nmEm 425 nm
Reductive AminationWith an Analog
400 500 nm 400 500 nm 400 500 nm
x x
!#$%%$&'()*+,-,'./0(1'#2
&'$()*
+&$()*
+,!()*x
!#$%%$&'()*+,-,'./0(1'#2
RapiFluor-MS Labeled N-Glycans
Ex 265 nmEm 425 nm
Ex 370 nmEm 480 nm
Dextran
Novel Dextran Ladder
DextranGlycan
A
B C
GU 3
GU 7
GU 11
GU 15 Cubic Spline Fit
Figure 14. Assignment of Glucose Unit (GU) values with RapiFluor-MS labeling. (A) Chemical structures and fluorescence spectra of RapiFluor-MS labeled N-glycans versus dextrans derivatized with RapiFluor-MS-like labels. The novel dextran ladder that has been commercialized as the RapiFluor-MS Dextran Calibration Ladder is highlighted. (B) An example fluorescence chromatogram for the RapiFluor-MS Dextran Calibration obtained for a 0.5 μg mass load with an ACQUITY UPLC Glycan BEH Amide, 130Å, 1.7 μm, 2.1 x 150 mm Column. (C) Calibration curve resulting from cubic spline fitting.
Robustness of RapiFluor-MS N-Glycan Sample Preparations and Glycan BEH Amide HILIC Chromatographic Separations

Waters Corporation 34 Maple Street Milford, MA 01757 U.S.A. T: 1 508 478 2000 F: 1 508 872 1990 www.waters.com
Waters, The Science of What’s Possible, ACQUITY UPLC, XBridge, ACQUITY, UPLC, QDa, Xevo, SYNAPT, UNIFI, and MassLynx are registered trademarks of Waters Corporation. GlycoWorks, RapiFluor-MS, and RapiGest are trademarks of Waters Corporation. All other trademarks are property of their respective owners.
©2015 Waters Corporation. Produced in the U.S.A. May 2015 720005370EN AG-PDF
CO N C LU S IO NS
In this application note, we have demonstrated the robustness of RapiFluor-MS
N-glycan preparations and Glycan BEH Amide HILIC Column chromatography.
The RapiFluor-MS N-Glycan Kit enables analysts to perform a high yielding
sample preparation with quantitative recovery that ensures accurate and
repeatable profiling of N-glycans that is highly comparable to HPLC, 2-AB based
methodologies. Moreover, it has been demonstrated that Glycan BEH Amide
Columns afford exemplary resolving power and ruggedness for separations of
RapiFluor-MS labeled N-glycans. Additionally, this separation can be readily
transferred between UPLC and HPLC platforms. To further ensure success with
these new methodologies, two standards have been commercialized, and their
use to facilitate RapiFluor-MS analyses has been demonstrated. The RapiFluor-MS
Glycan Performance Test Standard has been used for benchmarking studies,
while the novel RapiFluor-MS Dextran Calibration Ladder has been employed to
enhance the reproducibility of chromatographic retention time data. In summary,
the GlycoWorks RapiFluor-MS N-Glycan Kit and supporting standards and columns
can significantly reduce the burdens associated with N-glycan profiling while
providing accurate, reproducible, and sensitive analyses.
AcknowledgementWe would like to thank Peter De Vreugd and Mark Eggink from Synthon
Biopharmaceuticals BV for providing data on the comparability of released
N-glycan analyses with RapiFluor-MS and UPLC versus 2-AB and HPLC.
References
1. Ohtsubo, K.; Marth, J. D., Glycosylation in cellular mechanisms of health and disease. Cell 2006, 126 (5), 855–67.
2. Mechref, Y.; Hu, Y.; Garcia, A.; Zhou, S.; Desantos-Garcia, J. L.; Hussein, A., Defining putative glycan cancer biomarkers by MS. Bioanalysis 2012, 4 (20), 2457–69.
3. Ruhaak, L. R.; Miyamoto, S.; Lebrilla, C. B., Developments in the identification of glycan biomarkers for the detection of cancer. Mol Cell Proteomics 2013, 12 (4), 846–55.
4. Dalziel, M.; Crispin, M.; Scanlan, C. N.; Zitzmann, N.; Dwek, R. A., Emerging principles for the therapeutic exploitation of glycosylation. Science 2014, 343 (6166), 1235681.
5. Beck, A.; Wagner-Rousset, E.; Ayoub, D.; Van Dorsselaer, A.; Sanglier-Cianferani, S., Characterization of therapeutic antibodies and related products. Anal Chem 2013, 85 (2), 715–36.
6. Mechref, Y.; Hu, Y.; Desantos-Garcia, J. L.; Hussein, A.; Tang, H., Quantitative glycomics strategies. Mol Cell Proteomics 2013, 12 (4), 874–84.
7. Ruhaak, L. R.; Zauner, G.; Huhn, C.; Bruggink, C.; Deelder, A. M.; Wuhrer, M., Glycan labeling strategies and their use in identification and quantification. Anal Bioanal Chem 2010, 397 (8), 3457–81.
8. Lauber, M. A.; Brousmiche, D. W.; Hua, Z.; Koza, S. M.; Guthrie, E.; Magnelli, P.; Taron, C. H.; Fountain, K. J., Rapid Preparation of Released N-Glycans for HILIC Analysis Using a Novel Fluorescence and MS-Active Labeling Reagent. Waters Application Note 720005275EN 2015.
9. Yu, Y. Q.; Gilar, M.; Kaska, J.; Gebler, J. C., A rapid sample preparation method for mass spectrometric characterization of N-linked glycans. Rapid Commun Mass Spectrom 2005, 19 (16), 2331–6.
10. Koza, S. M.; Lauber, M. A.; Fountain, K. J., Successful Transfer of Size-Exclusion Separations between HPLC and UPLC. Waters Application Note 720005214EN 2015.
11. Campbell, M. P.; Royle, L.; Radcliffe, C. M.; Dwek, R. A.; Rudd, P. M., GlycoBase and autoGU: tools for HPLC-based glycan analysis. Bioinformatics 2008, 24 (9), 1214–6.