rodale manufacturing site emmaus, pennsylvania · feasibility study for the rodale manufacturing...
TRANSCRIPT

R E P () R T
Feasibility Study for theRodale Manufacturing SiteEmmaus, Pennsylvania
Square D CompanyPalatine, Illinois
February 1999
BBLBLASLAND, BOUCK & LEE, INC.engineers & scientists
TECHNICAL REPORT
1SBLBLASLAND. BOUCK & LEE. INC.
Feasibility Study for theRodale Manufacturing SiteEmmaus, Pennsylvania
Square D CompanyPalatine, Illinois
February 1999
engineer* & tclantltti
6723 Towpath Road, P.O. Box 66Syracuse, New York, 13214-0066(315)446-9120
;H.i!i()535

Table of Contents
Section 1. Introduction ............................................ 1 -1
1.1 Feasibility Study Objectives and Organization ofReport . . . . . . . . . . . . . . . . . . . . . . . . . . . . . . . . . . . . . . . . . . 1-1
1.2 Background Information ............................ 1-21.2.1 Study Area Description ............................. 1-21.2.2 Site History . . . . . . . . . . . . . . . . . . . . . . . . . . . . . . . . . . . . . . 1-21.2.3 Physical Setting . . . . . . . . . . . . . . . . . . . . . . . . . . . . . . . . . . . 1-41.2.3.1 General . . . . . . . . . . . . . . . . . . . . . . . . . . . . . . . . . . . . . . . . . 1-51.2.3.2 Regional Geology/Hydrogeology . . . . . . . . . . . . . . . . . . . . . 1-51.2.3.3 Regional Surface-Water Hydrology . . . . . . . . . . . . . . . . . . . 1-61.3 Site Investigations . . . . . . . . . . . . . . . . . . . . . . . . . . . . . . . . . 1-71.3.1 Summary of Pre-RI Investigations . . . . . . . . . . . . . . . . . . . . 1-71.3.2 Remedial Investigation . . . . . . . . . . . . . . . . . . . . . . . . . . . . . 1-81.3.3 Risk Assessment . . . . . . . . . . . . . . . . . . . . . . . . . . . . . . . . 1-121.3.4 Other Source Areas . . . . . . . . . . . . . . . . . . . . . . . . . . . . . . 1-161.4 Completed Remedial Activities . . . . . . . . . . . . . . . . . . . . . . 1-171.4.1 Ground-Water Treatment System (GWTS) . . . . . . . . . . . . 1-171.5 Technical Impracticability Evaluation Summary ......... 1-181.5.1 Applicability of a Tl Evaluation . . . . . . . . . . . . . . . . . . . . . . 1-181.5.2 Summary of the Tl Evaluation . . . . . . . . . . . . . . . . . . . . . . . 1-181.5.3 Alternate Remedial Strategy . . . . . . . . . . . . . . . . . . . . . . . . 1-20
Section 2. Identification of Standards, Criteria, and Guidance ........... 2-1
2.1 Potential Applicable or Relevant and AppropriateRequirements (ARARs) and To Be ConsideredMaterials (TBCs) .. . . . . . . . . . . . . . . . . . . . . . . . . . . . . . . . . 2-1
2.1.1 Potential Chemical-Specific ARARs and TBCs . . . . . . . . . . 2-12.1.2 Potential Location-Specific ARARs and TBCs ... . . . . . . . . 2-12.1.3 Potential Action-Specific ARARs and TBCs .. . . . . . . . . . . . 2-22.2 Waiver of ARARs ................................. 2-2
Section 3. Remedial Action Objectives .............................. 3-1
3.1 Remedial Action Objectives (RAOs) . . . . . . . . . . . . . . . . . . . 3-13.2 General Response Actions (GRAs) ................... 3-2
~ 3.3 Areas and Volumes of Media to Which RemedialAction May Apply .................................. 3-3
Section 4. Identification and Screening of Technologies and Process Options...................................................... 4-1
4.1 General ......................................... 4-14.2 Identification and Screening of Technologies and
Process Options .................................. 4-1
•___________________________ BLASLAND, BOUCK & LEE. INC.____________________________________engineers & scientists 1
MR.UI0536
Section 5.
Section 6.
Section 7.
Section 8.
4.3 Evaluation and Screening of RepresentativeTechnologies/Process Options ....................... 4-2
4.4 Retained Technologies/Process Options . . . . . . . . . . . . . . . 4-74.5 Treatability Testing . . . . . . . . . . . . . . . . . . . . . . . . . . . . . . . . 4-8
Development and Screening of Remedial Alternatives ........ 5-1
5.1 General . . . . . . . . . . . . . . . . . . . . . . . . . . . . . . . . . . . . . . . . . 5-15.2 Development of Remedial Alternatives . . . . . . . . . . . . . . . . 5-15.3 Preliminary Screening of Ground-Water
Remedial Alternatives .............................. 5-25.3.1 No Action .... . . . . . . . . . . . . . . . . . . . . . . . . . . . . . . . . . . . . 5-25.3.2 Institutional Controls . . . . . . . . . . . . . . . . . . . . . . . . . . . . . . . 5-25.3.3 Natural Attenuation . . . . . . . . . . . . . . . . . . . . . . . . . . . . . . . . 5-35.3.4 Ground-Water Extraction with Conventional
Treatment . . . . . . . . . . . . . . . . . . . . . . . . . . . . . . . . . . . . . . . 5-45.3.5 Ground-Water Extraction with UvOx Treatment.......... 5-55.3.6 Ground-Water Extraction with Fenton's Reagent
Treatment . . . . . . . . . . . . . . . . . . . . . . . . . . . . . . . . . . . . . . . 5-75.3.7 In-Situ Injection of Oxidants and Ground-Water
Extraction with Treatment . . . . . . . . . . . . . . . . . . . . . . . . . . . 5-85.4 Preliminary Screening Results . . . . . . . . . . . . . . . . . . . . . . . 5-9
Detailed Analysis of Alternatives .......................... 6-1
6.1 General . . . . . . . . . . . . . . . . . . . . . . . . . . . . . . . . . . . . . . . . . 6-16.2 Description of Evaluation Criteria ..................... 6-16.3 Detailed Analysis of Ground-Water Remedial
Alternatives . . . . . . . . . . . . . . . . . . . . . . . . . . . . . . . . . . . . . . 6-36.3.1 Alternative GW-1 - No Action . . . . . . . . . . . . . . . . . . . . . . . . 6-36.3.2 Alternative GW-2 - Natural Attenuation . . . . . . . . . . . . . . . . 6-56.3.3 Alternative GW-3 - Ground-Water Extraction with
Conventional Treatment .. . . . . . . . . . . . . . . . . . . . . . . . . . . 6-7
Comparative Analysis of Alternatives ...................... 7-1
7.1 General ......................................... 7-17.2 Ground-Water Remedial Alternatives .................. 7-1
References ............................................ 8-1
. BOUCK & LEE, INC.engineers A scientists
(R,iii0537

Tables 1
Figures
-
Appendices
2345678
123456
7
8
AB
Ground-Water Treatment System Permitted Effluent LimitsChemical-Specific ARARs and TBCsChemical-Specific ARARs and TBCs for each COCLocation-Specific ARARs and TBCsAction-Specific ARARs and TBCsAlternative No. 1 : No Action CostAlternative No. 2: Natural Attenuation CostAlternative No. 3: Ground-Water Extraction and ConventionalTreatment Cost
Site LocationSite Plan /Well Location MapSite Vicinity and Potential Off-Site SourcesDissolved TCE Distribution and Ground-Water Flow DirectionProbable DNAPL ZonePotentiometric Surface Deep Wells (-300 feet Depth), March 1 1 ,1997Potentiometric Surface Deep Wells (~300 feet Depth), October 1 ,1997Potentiometric Surface Deep Wells (-300 feet Depth), July 20,1998
VLEACH Modeling ResultsTechnical Impracticability Evaluation Report
8LASLAND. BOUCK& LEE, INC.engineers & scientists
i\ R :< u 0538

1. Introduction
1.1 Feasibility Study Objectives and Organization of Report
The objectives of this Feasibility Study (FS) are to identity, screen and evaluate potential remedial alternatives foraddressing the chemical constituents present in the soil vadose zone and ground water at the Rodale ManufacturingSite ("the site") located in Emmaus, Pennsylvania. The FS identifies remedial action objectives (RAOs) based onRemedial Investigation (RI) and Risk Assessment (RA) data (BBL, March 1998; BBL, February 1999), and developsgeneral response actions (GRAs) for each medium of interest, identifies and screens available remedial technologies,and concludes with a comparative analysis of feasible and cost-effective remedial alternatives to address site-relatedconstituents present in the subsurface at the site.
As discussed in the Remedial Investigation/Feasibility Study (RI/FS) Work Plan Addendum (BBL, May 1996), anddetailed in the RI Report (BBL, March 1998), the presence of dissolved-phase and dense non-aqueous phase liquids(DNAPLs) within the subsurface at the site has been characterized. The location and extent of these zones has beencharacterized in the RI Report based on available data and are evaluated in the FS for remediation herein (mediaconsidered in this study includes the bedrock and overburden ground water and the vadose zone soils).
This FS has been prepared in accordance with the Scope of Work (SOW) issued by the United States EnvironmentalProtection Agency (USEPA) as part of an Administrative Order on Consent (AOC) between the USEPA and SquareD Company (Square D), effective September 21, 1992. This report has been prepared based on guidance presentedin the USEPA's "Guidance for Conducting Remedial Investigations and Feasibility Studies under CERCLA"(USEPA, October 1988), "Guidance for Evaluating the Technical Impracticability of Ground-Water Restoration"(USEPA, September 1993) and the National Oil and Hazardous Substances Pollution Contingency Plan (NCP) (40CFR Part 300).
This report is organized into the following eight sections:
SectionSection 1.0 -
Section 2.0 -
Section 3.0 -
Introduction
Identification of Standards,Criteria -and Guidance
Remedial ActionObjectives (RAOs)
Purpose
Presents a summary of information from the RI report regardingsite description, site history, physical setting, previousinvestigations, nature and extent of contamination, other sourceareas, completed remedial activities, and a summary of the Tlevaluation.
Presents the standards, criteria, and guidance that will be consideredin selecting an appropriate course of action for each impactedmedium, including the identification of Applicable or Relevant andAppropriate Requirements (ARARs) based on chemical-, location-,and action-specific factors.
Develops and presents media-specific RAOs, GRAs, and estimatesof the volumes of each medium of interest that may requireremediation.
BLASLAND. BOUCK & LEE, INCengineers A scientists 1-1
:tR.Hi0539

Section
Section 4.0 -
Section 5.0 -
Section 6.0 -
Section 7.0 -
Section 8.0 -
Identification andScreening of Technologiesand Process Options
Development andScreening of RemedialAlternatives
Detailed Analysis ofAlternatives
Comparative Analysis ofAlternatives
References
Purpose
Presents an analysis and screening of technologies/process optionsto be considered, and identifies the anticipated need for treatabilitytesting of technologies/process options considered for applicationat the site.
Provides a rationale for combining individual technologies intoapplicable remedial alternatives. Provides a preliminary screeningof the remedial alternatives, and identifies those to be retained fordetailed analysis.
Presents evaluation criteria and an analysis of each remedialalternative for each medium of interest.
Summarizes the results of the detailed analyses of the remedialalternatives.
Provides complete references for all materials used in thedevelopment and evaluation of the FS.
1.2 Background Information
1.2.1 Study Area Description
The site is located on approximately one acre of land at Sixth and Minor Streets in the Borough of Emmaus, LehighCounty, Pennsylvania, about five miles south of the City of Allentown, as shown on Figure 1. The approximate sitegeographic coordinates are Latitude 40° 31' 53" N, Longitude 75° 29' 37"W. The site is bordered by Minor Streetto the north, Sixth Street to the west, an alleyway to the east, and the Perkiomen railroad line to the south. Land usein the area surrounding the site includes residential as well as industrial and commercial facilities.
1.2.2 Site History
This section presents a brief summary of historical site operations and general environmental information. Unlessotherwise noted, this information was obtained from sources referenced in the report "Site History and LaboratoryResults for the Rodale Manufacturing Site" (GEC, October 1991). Further details regarding the previousinvestigation activities identified below are presented in Section 2.0 of this report.
The site property had been used for commercial or manufacturing purposes since at least the 1920s. Prior to the1930s, the site was occupied by the D.G. Dery Silk Corporation and later by Amalgamated Silk Corporation.According to annual versions of the Pennsylvania Industrial Directory, Rodale Press, a publishing and printingbusiness, occupied portions of the building from at least 1938 until 1959 (Pennsylvania Department of Health, 1991).From the late 1950s until 1975, the site was operated by Rodale Manufacturing to make wiring devices and electricalconnectors. The manufacturing process included various electroplating techniques. In 1975, the site was sold to BellElectric, a wholly-owned subsidiary of Square D, which manufactured similar electrical components. In 1986, Square
______ BLASLAND. BOUCK& LEE. INC._________________________________B H g I n 8 6 T S & S C I 6 n 11 $ t S 1-2

D closed manufacturing operations at the site. Buildings at the site were partially demolished in 1989; the remainingportions were demolished in 1993. Previously-used waste disposal wells were identified during demolition activities.
Activities Under Rodale Operation of Facility
Specific operational practices prior to 1961 are largely unknown. Pennsylvania Department of EnvironmentalProtection (PADEP) files indicate that under Rodale Manufacturing's operation of the facility, several wells were usedfor disposal of various wastes. PADEP files indicated that in 1962, approximately 3,000 gallons per day (gpd) ofwastewater, including rinse water from copper and zinc plating and acid brass dipping, were discharged to a 452-footdeep borehole (subsequently identified as Well 1) located in the former Courtyard Area (Figure 2). Borough ofEmmaus files indicate that the electroplating room was connected to the sanitary sewer by January 1967. Rodale'soperation continued until 1975 when the business was sold to Bell Electric.
Activities Under Square D Operation of Facility
Past disposal practices were first identified by Square D in March 1981, when a capped borehole (Well 1) wasdiscovered"during the installation of new equipment. Long-time employees of Rodale Manufacturing indicated thattwo other wells (Well 2 and Well 3) were also used for disposal purposes, and the locations of these wells wereidentified (Figure 2). From June to September 1981, Square D arranged for liquid wastes and some impacted groundwater to be removed from Wells 1, 2, and 3, and disposed of by licensed haulers at licensed disposal facilities. Amonitoring well (Well 4) was installed to a depth of 342 feet below ground surface (bgs) in June 1981 by GillEnterprises on behalf of Square D. Water samples collected from the monitoring well and the three identifieddisposal wells revealed the presence of varying concentrations of volatile organic compounds (VOCs), metals, andcyanide.
In addition to the three disposal wells (Wells 1, 2, and 3), two additional wells (Wells 5 and 6) were also identifiedby Square D at the site in the early 1980s. Well 5, a shallow cistern, was discovered in late 1981. Well 6, locatedat the west end of the courtyard, was apparently used for makeup cooling water and not for disposal purposes.
In 1984, operation of an air-stripping tower commenced for removal of VOCs from ground-water pumped from Well1. A National Pollutant Discharge Elimination System (NPDES) permit for surface discharge of treated ground waterwas issued by the PADEP. The pumping and air-stripping activities continued until 1989 when Square D proceededwith demolition of Building D and discontinued operation of the interim ground-water pumping and air strippingprogram. Ground-water monitoring results obtained between 1981 and 1988 indicated that the pumping and air-stripping activities were effective in lowering VOC concentrations in Well 1 from hundreds of parts per million (ppm)to less than 1 ppm (SNR, March 1989).
Following closure of the facility by Square D in 1986, investigative and remedial activities continued. In 1988,Square D retained SNR Company (SNR) of Laguna Hills, California to prepare a Ground Water Monitoring Plan.During preparation of the plan, SNR installed four ground-water monitoring wells (originally designated SW-Athrough SW-D but now referred to as MW-1 through MW-4) around the perimeter of the facility. The wells werescreened near the water table. In 1989, the south wing (Building D) was demolished to provide space for additionalremedial activities. During demolition, a well (designated WW-08, 6 feet in diameter and approximately 55 feet indepth) was discovered. Two fuel oil underground storage tanks (USTs) were also removed (Figure 2).
BLASLAND, BOUCK & LEE. INC.____________________________________engineers & scientists 1-3

Comprehensive Environmental Response. Compensation, and Liability Act of 1980 fCERCLA) Response Actionand Subsequent Activities
In January 1989, NUS Corporation conducted a Site Inspection (SI) on behalf of the USEPA at the site (NUS,November 1989). The SI consisted of the collection of water samples from the three former on-site disposal wells,four) on-site monitoring wells, three of the six Borough of Emmaus water supply wells, and three residential wells.In November 1989, the PADEP collected several water samples from wells located downgradient of the study area,including one Borough of Emmaus water supply well (PSW-7) and five downgradient private wells in LowerMacungie Township. A hydrogeologic investigation was completed by Roy F. Weston, Inc. (Weston) during 1989.In 1990, a monitoring/recovery well (RW-1) was installed at the site and another monitoring/recovery well (RW-2)was partially completed with the installation of surface casing. Final completion was to be based on the anticipateduse of the well. The locations of all known disposal, production, recovery, and monitoring wells at the site areindicated on Figure 2. The significant findings of these investigations are summarized in Section 1.3.1 of this report.
On July 29, 1991, following the Hazard Ranking System review process by the USEPA, the site was proposed forplacement on the National Priorities List (NPL). An AOC to conduct the RI/FS was subsequently executed betweenthe USEPA and Square D (effective September 21, 1992).
In 1993, Geo-Environmental Consultants, Inc. (GEC), a consultant to Square D, supervised the demolition of theremaining portion of the buildings; During demolition, two additional site features were identified:
• Well 7, which is believed to have been used for septic disposal; and• Tank 1, which is a closed-bottom cistern possibly used for fuel oil storage.
The locations of both features are illustrated on Figure 2.
GEC implemented two additional phases of investigation, which were reported in the "Well Survey EvaluationReport" (GEC, September 1994) and the "Time-Critical Investigation Report" (GEC, October 1995).
A separate AOC for Removal Response Action (RRA) (USEPA Docket No. 111-94-15-DC) for a site ground-waterpump and treat treatment system (GWTS) and related tasks was also executed between the USEPA and Square D,effective September 30, 1994. The document entitled "Supplement I to the Time-Critical Work Plan for the RodaleManufacturing Site, (GEC, February 1995)" which includes a conceptual design for the ground-water pump-and-treatsystem was prepared and submitted to the USEPA pursuant to this AOC. Supplement I also included a presentationof site conditions, an evaluation and screening of treatment technologies, and the conceptual design of thesubsequently constructed ground-water pump-and-treat system.
1.2.3 Physical Setting
Prior to final demolition in 1993, the site consisted of a three-story building that occupied most of the site (designatedas three inter-connected sections: Buildings A, B, and C) which served as a manufacturing, warehouse, and officefacility on a parcel of property. An exterior, open-space courtyard area existed on the south side of the facility. Thisopen area was expanded in 1989 as a result of an earlier demolition of the southern wing of Building D. The disposalwells (Wells 1, 2, and 3) were located in the open area, along with several other wells and cisterns (Figure 2). Finaldemolition activities, overseen by GEC, were conducted at the site from August to December 1993.
___________BLASLAND, BOUCK & LEE, INC.____________________________________|TOC»v0646i«)M90H6WPO-Z/ifcW 3 n Q I n & g T S & S C I 6 H 11S t S 1-4
.-•|R.<ii05U2

Following demolition in 1993, the site was graded with quarry fill and #2A modified stone. The basement underBuilding A, which measured approximately 170 feet in length (north-south direction) by 50 feet in width (east-westdirection), was backfilled with clean quarry fill prior to the final grade-level application of #2A modified stone. Thefill materials were certified as clean based on laboratory analyses. The walls were left in place, and the floor of thebasement broken up prior to backfilling to allow for proper drainage.
Currently the only remaining on-site structures are the newly constructed GWTS building (described in Section 1.4.1below) and recovery well protective enclosures. Water is supplied by a 2-inch water service connection to two firehydrants on the north side of the site. A storm-water catch basin near the southwest corner is connected to the stormsewer along Sixth Street. The site is bounded by a 6-foot high chain-link security fence on the south property line,and an 8-foot high red cedar security fence on the north, east, and west sides. The site is accessible through lockinggates on the east and west sides of the site.
1.2.3.1 General
Topography
Topography in the Borough of Emmaus varies from between 350 feet and 500 feet above mean sea level (AMSL)(USGS, 1992). The most prominent topographic feature in the vicinity of the site is South Mountain to the south andsoutheast with gently sloping hills and stream valleys to the west, north, and northwest. The peaks of South Mountainextend as high as 1,000 feet AMSL. Topographic features in the vicinity of the site include: the Lehigh Creek;Leibert, Little Lehigh, Swabia, and Cedar Creeks; Chestnut Hill; Lock Ridge; and Bauer Rock. Elevations acrossthe 1.2-acre site range from 460 to 470 feet AMSL, with the lowest point located within the central portion of thenorthern half of the site.
The infiltration rate of precipitation into the ground is limited by the rate at which water can be transmitted throughthe various soil strata. Specifically, the physical condition of the surface and its covering vegetation will impact thepermeability of the soil. Given the observed site topography and the fact that the entire site surface is covered withcrushed stone, runoff coefficients and infiltration rates for soil groups indicate that nearly 100 percent of theprecipitation to the site would be expected to infiltrate into the subsurface during most rain events, and no significantrunoff would be anticipated from the site.
1.2.3.2 Regional Geology/Hydrogeology
Geology
The regional geology in the area of the site is characterized by the crystalline rock units forming South Mountain tothe east and south of the site, and the Cambrian and Ordovician sedimentary units of the Little Lehigh Creek basinextending north and west of South Mountain. The site is situated directly over the subcrop of the LeithsvilleFormation. The Leithsville Formation is composed predominantly of gray to yellowish, thin bedded dolomites thatgrade locally into sericitic shales, with some massive beds of blue dolomite (Wood, et al., 1972). Deep sections ofweathered carbonate residual deposits (saprolite) occur above the competent bedrock of the carbonate units of LittleLehigh Creek basin, overlain in some areas by glacial drift deposits, and generally capped with a soil loam horizon.
BLASLAND, BOUCK & LEE. INCengineers & scientists 1-5
;iR.i 1105(4 3
Abundant evidence and literature describes the area as extensively faulted. Wood, et. al. (1972) describe the thicksequence of extensively fractured and weathered Cambrian to Ordovician Age carbonate rock in the area. Sloto, et.al. (1991) present a geologic map illustrating the positions of several high-angle fault contacts within a one-miledistance east and south of the site, generally trending parallel and perpendicular to the strike of South Mountain.Faults also commonly separate geologic units in the Lehigh Valley.
Hvdrogeologv of the Little Lehigh Creek Basin
Ground-water is encountered at a depth of approximately 105 to 115 feet below ground surface (bgs) within theimmediate vicinity of the site. Ground-water flow within the Little Lehigh Creek Basin is generally from the areasof high elevation defining the valley's margin towards Little Lehigh Creek. South of Little Lehigh Creek, ground-water flow is from the crystalline rocks of the Reading Prong (locally forming South Mountain), defining topographicand ground-water divides along the southern margin of the Little Lehigh Creek Valley, to the northwest beneath thesite and towards Little Lehigh Creek. This general direction of ground-water flow is approximately perpendicularto the strike of South Mountain. Ground water within the Little Lehigh Creek Basin discharges to Little LehighCreek, which eventually discharges to the Lehigh Creek. Ground-water discharge is the main source of water forLehigh Creek (Wood, et. al., 1972).
Ground-water flow through the "highly-deformed" carbonate bedrock of the valley floor along the flow path fromthe topographic highs to the Little Lehigh Creek most likely follows a circuitous route through the solution-enhancedfractures of the carbonate bedrock. Due to similarities in composition, as well as structural history and resultantfaulting episodes, the Leithsville Formation and the Allentown Dolomite are essentially considered as a singlehydrogeologic unit (Wood, et. al., 1972; Sloto, et. al., 1991). A ground-water flow gradient has been calculated asapproximately 27 feet per mile from the base of South Mountain to Little Lehigh Creek, utilizing regional ground-water study data (Wood, et. al., 1972). Both confined and unconfined ground-water conditions are present in theLeithsville Formation and the Allentown Dolomite.
Bedrock ground water provides the Borough of Emmaus and the Little Lehigh Creek basin with approximately 60percent of its potable water supply (Wood, et. al., 1972). The permeable nature of the overlying soil and theweathered bedrock (saprolite) horizon above competent bedrock allows the majority of precipitation above thecarbonate units to recharge the ground-water system and not directly discharge via surface-water routes. TheLeithsville Formation and the Allentown Dolomite are locally the most important water-bearing units. Four of thesix public water supply wells for the Borough of Emmaus are completed in the Leithsville Formation (PSW-I, PSW-2, PSW-3, and PSW-4). These wells range in depth from 183 feet to 526 feet, and range in yield approximately123,000 to 244,000 gpd each. One public supply well (PSW- 7) was installed within the Allentown Dolomite. Thiswell was completed to a depth of approximately 400 feet and provided a daily yield of approximately 119,000 gallons.The remaining public supply well (PSW-6) was completed within the Hardyston Quartzite, yielding approximately460,000 gpd at a total depth of 358 feet (Wood, et. al., 1972). The crystalline rocks of the Reading Prong also canbe a source of water for domestic use, especially along the slope of South Mountain where fractures are prevalent.
1.2.3.3 Regional Surface-Water Hydrology
Little Lehigh Creek is the primary drainage feature in the study area. Little Lehigh Creek is located in northwestBorough of Emmaus (about 1.5 miles northwest of the site) and flows generally from southwest to northeast (FigureI) toward the City of Allentown where it discharges to the Lehigh River. Leibert Creek is a tributary to Little Lehigh
BLASLAND. BOUCK& LEE, INC.____________________________________engineers & scientists 1-6
D5UI4
Creek approximately one mile west of the site. Leibert Creek flows generally from south to north and discharges toLittle Lehigh Creek northwest of the Borough of Emmaus (Figure 1).
Leibert Creek has two main tributaries:
• An unnamed tributary, flowing northeasterly through Vera Cruz in Upper Milford Township and discharging toLeibert Creek near Quarry Lane; and
• An unnamed intermittent tributary, flowing northward through the southwest portion of the Borough of Emmausand discharging to Leibert Creek west of Route 29 near Emmaus High School.
In addition, an unnamed intermittent tributary (designated as the north intermittent tributary) discharges directly toLittle Lehigh Creek in Salisbury Township near Kick's Bridge (Keystone Road). The north intermittent tributary wasmodified as a runoff channel for storm water from the Borough of Emmaus and was observed to flow only aftersignificant rainfall.
The flow of Little Lehigh Creek east of its juncture with Leibert Creek is most likely controlled by a fracture/jointsystem within the near surface of the Allentown Dolomite and the Leithsville Formation. This is evident by theabrupt high-angle turns evident in the surface flow path of the Little Lehigh Creek northwest of the site (Figure 1).The orientation of the turns in the flow of the creek are likely indicative of the orientation of major joints and/orfractures in the bedrock.
1.3 Site Investigations
1.3.1 Summary of Pre-RI Investigations
A number of investigations have been implemented in connection with this site prior to commencing work on theRI/FS. The data generated through these previous investigations includes information regarding the physical sitecharacterization as well as the nature and extent of constituents detected at the site. These investigations include aGround-Water Investigation (SNR, March 1989), Site Inspection (NUS, January 1989); Private Well Sampling(PADEP, November 1989); Hydrogeologic Investigation (Weston, November 1989); Well Survey Evaluation (GEC,September 1994); and a Time-Critical Investigation (GEC, October 1995). The significant findings of these studiesinclude:
• Ground-water data indicates a historical presence of VOCs [predominantly trichloroethene (TCE)], semi-volatileorganic compounds (SVOCs), metals and cyanide at concentrations above regulatory guidance values andstandards. The ground-water contamination observed is predominantly related to the suspected presence ofDNAPL located deep within the underlying bedrock (USEPA, January 1989; SNR, March 1989).
• Soil sampling from the soil vadose zone revealed two detectable VOCs (toluene and TCE) and one SVOC (bis(2-ethylhexyl)phthalate), and cyanide (in one sample). Metals were within or below levels naturally occurring in soil(SNR, March 1989).
• Off-site sampling of a water supply well and private wells revealed TCE in three of the wells, with two of thedetections being above the federal and state drinking water maximum contaminant limits (MCLs), andCommonwealth of Pennsylvania Statewide Human Health Standard for ground water (PADEP, November 1989).
____________________________________BLASLAND, BOUCK& LEE. INC.____________________________________j\DOC99fl6*6i\On'»OH*WPD--J/iB«9 e n g I H 8 e FS & S C I 8 n 11 S t S 1-7

• A hydrogeologic study identified an apparent primary set of fractures trending nearly east-west, and a secondaryset trending approximately north-south in the vicinity of the site (Weston, November 1989).
• A regional distribution of low concentrations of VOCs at five supply wells upgradient or cross-gradient from thesite suggests additional sources of dissoived-phase TCE exist in the Borough of Emmaus. Potential additionalsource areas for TCE were identified and are presented in Figure 3 (Weston, November 1989).
• Off-site sampling of Borough of Emmaus and private wells revealed that cyanide and lead in one ground-watersample exceeded federal and state drinking water MCLs. However, the dissolved lead concentration was belowdetection limit and not believed to be indicative of a regional lead-related water quality problem (GEC, September1994).
• Off-site surface water sampling results indicated that no contaminants were present above the respective federalor state MCL (GEC, September 1994).
• Low concentrations of arsenic were detected in all off-site stream sediment samples taken (GEC, August 1994).
• Chromium and zinc were detected in all samples taken from the south intermittent tributary and two locations inthe Little Lehigh Creek (GEC, September 1994).
• Results of soil samples taken from 19 on-site borings indicated that VOC concentrations were relatively low in allbut one boring (SB-7) that was located near a former disposal well. Some soil samples had SVOCs. Metalsconcentrations were very low in all samples (GEC, Setpember 1994).
1.3.2 Remedial Investigation
The RI program was implemented in accordance with the "Work Plan for a Remedial Investigation/Feasibility Study(RI/FS) at the Rodale Manufacturing Site ("RI/FS Work Plan") (GEC, August 1 995), as modified by the RemedialInvestigation/Feasibility Study Work Plan Addendum" (RI/FS Work Plan Addendum) (BBL, May 1 996). The RI/FSWork Plan Addendum was prepared to allow for additional characterization of site conditions, and to allow for thecollection of appropriate data to support a "front-end" Tl Evaluation as allowed for by the USEPA as part of the FS(USEPA, September 1993; USEPA, January 1995). A front-end Tl Evaluation of ground-water restoration for thissite is considered appropriate based on the likely presence of dense non-aqueous phase liquid (DNAPL) deep infractured bedrock at the site.
The overall objectives otthe RI at the site included the following:
• Further characterize the DNAPL zone;
• Further characterize the site geologic conditions (e.g., heterogeneity, hydraulic conductivity, bedrock structure);
• Further characterize the regional ground-water flow regime;
• Obtain data to support solute- transport evaluations in the bedrock;
BLASLAND, 6OUCK & LEE. INC. ____________________________________,\DOC*»«XH*IVOI -TO.** wro-.yiifl'* engineers & scientists 1-8

• Further delineate the dissolved-phase constituents related to the site and distinguish it from other potentialdissolved constituents associated with separate, unrelated source areas;
• Provide data needed to assess potential risks to human health and/or the environment associated with the site; and
• Provide data needed to evaluate the feasibility of alternative remedial approaches that may be considered for thissite.
Nature and Extent of Contamination
An evaluation of the nature and extent of contamination was made for all environmental media at the Rodale siteupon completion of the remedial investigations. A summary of the findings is presented below:
• Ambient air sampling results obtained during the RI identified only a single compound (toluene) at concentrationsranging from 2.4 to 3.7 parts per billion (ppb) volume per volume (v/v). These results were consistent fromupwind to downwind locations and do not appear to be site-related. Therefore, the results of the RI confirm thelack of environmental risk associated with air exposures at the site.
• Surface soil sampling results indicated no concentrations above their respective Pennsylvania (PA) Interim CleanupStandards. In addition, all organic compounds and nearly all inorganic compounds were detected at concentrationsless than the residential health-based screening levels (HBSLs). Inorganic compounds with detections greater thanresidential HBSLs include aluminum, arsenic, iron, manganese, and thallium. Both organic and inorganiccompounds detected fell below industrial HBSLs with the exception of arsenic and iron. Furthermore, noincidental direct contact risk is present due to these soils being covered with a layer of gravel and the relatively lowconcentrations present.
• Subsurface soil sampling results indicate the presence of TCE and other constituents at concentrations above thePA Act 2 Standards. Contaminant concentrations were observed to increase at the 12-14 feet depth. Of the 16VOC exceedances observed, 14 of these exceedances occurred between the depths of 40 feet and 90 feet withinsoil borings which are situated in the immediate vicinity of former Injection/Disposal Well 2. These resultsdemonstrate that the extent of impacts to the subsurface soil are limited to small area within the center of the site.Furthermore, all organic compounds and nearly all inorganic compounds were detected at concentrations less thanthe residential health-based screening levels (HBSLs). Inorganic compounds with detections greater thanresidential HBSLs include aluminum, arsenic, iron, manganese, and thallium. Both organic and inorganiccompounds detected fell below industrial HBSLs with the exception of arsenic and iron.
• Dissolved TCE concentrations were observed to exceed 1 percent of TCE's single-component solubility (1 percentof 1,100,000 micrograms per liter [ug/L] = 11,000 ug/L) in six of the on-site wells including RW-3 (490,000ug/L), Well 2 (420,000 ug/L), Well 4 (140,000 ug/L), Well 3 (100,000 ug/L), MW-4 (45,000 ug/L), and MW-1(17,000 ug/L). These dissolved TCE concentrations are indicative of the presence of DNAPL in the immediatevicinity of these wells (USEPA, January I992a).
• Dissolved TCE concentrations observed in the ground-water samples from the off-site monitoring wells were allat or below the USEPA maximum concentration limit (MCL) of 5 ug/L, with the exception of the samples fromthe shallow and deep wells at the MW-9 cluster, which contained 22 ug/L and 1,000 ug/L, respectively. However,the dissolved-phase constituents observed in the monitoring wells at the MW-9 monitoring well cluster do not
____________________________________BLASLAND. 8OUCK& LEE, INC.____________________________________i8,'w engineers & scientists 1-9
•'iR.<Hfl5U7
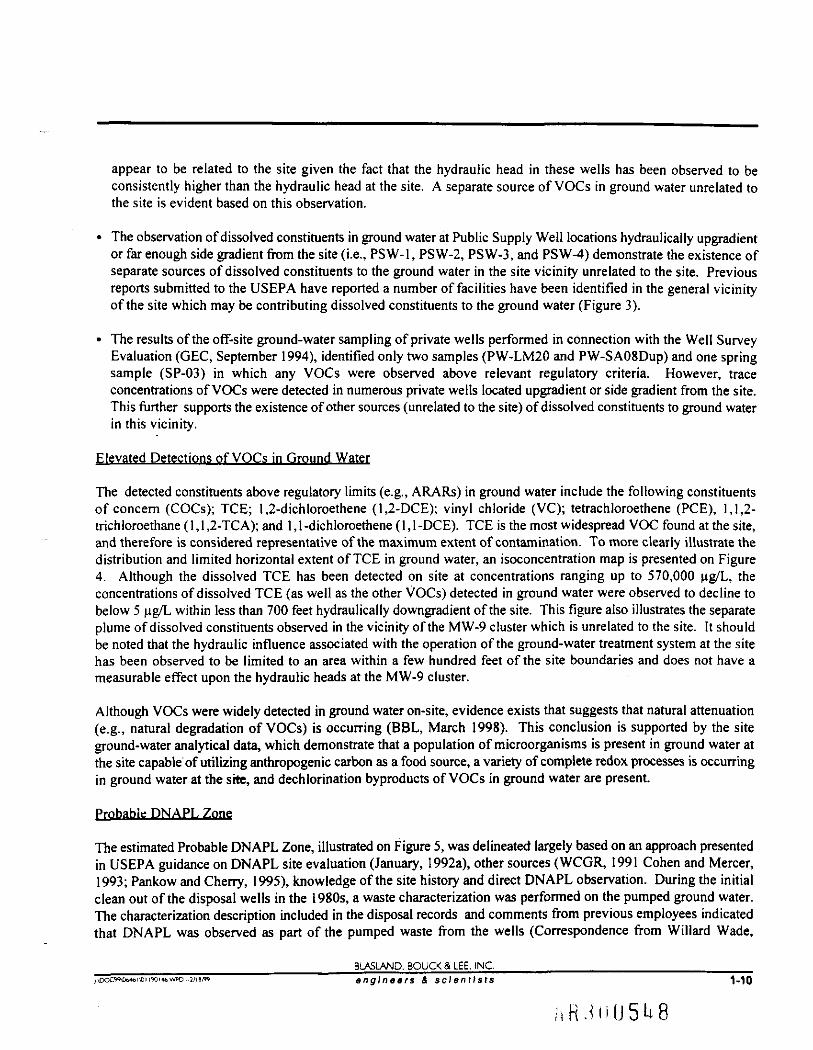
appear to be related to the site given the fact that the hydraulic head in these wells has been observed to beconsistently higher than the hydraulic head at the site. A separate source of VOCs in ground water unrelated tothe site is evident based on this observation.
• The observation of dissolved constituents in ground water at Public Supply Well locations hydraulically upgradientor far enough side gradient from the site (i.e., PSW-1, PSW-2, PSW-3, and PSW-4) demonstrate the existence ofseparate sources of dissolved constituents to the ground water in the site vicinity unrelated to the site. Previousreports submitted to the USEPA have reported a number of facilities have been identified in the general vicinityof the site which may be contributing dissolved constituents to the ground water (Figure 3).
• The results of the off-site ground-water sampling of private wells performed in connection with the Well SurveyEvaluation (GEC, September 1994), identified only two samples (PW-LM20 and PW-SA08Dup) and one springsample (SP-03) in which any VOCs were observed above relevant regulatory criteria. However, traceconcentrations of VOCs were detected in numerous private wells located upgradient or side gradient from the site.This further supports the existence of other sources (unrelated to the site) of dissolved constituents to ground waterin this vicinity.
Elevated Detections of VOCs in Ground Water
The detected constituents above regulatory limits (e.g., ARARs) in ground water include the following constituentsof concern (COCs); TCE; 1,2-dichloroethene (1,2-DCE); vinyl chloride (VC); tetrachloroethene (PCE), 1,1,2-trichloroethane (1,1,2-TCA); and 1,1-dichloroethene (1,1-DCE). TCE is the most widespread VOC found at the site,and therefore is considered representative of the maximum extent of contamination. To more clearly illustrate thedistribution and limited horizontal extent of TCE in ground water, an isoconcentration map is presented on Figure4. Although the dissolved TCE has been detected on site at concentrations ranging up to 570,000 ug/L, theconcentrations of dissolved TCE (as well as the other VOCs) detected in ground water were observed to decline tobelow 5 ug/L within less than 700 feet hydraulically downgradient of the site. This figure also illustrates the separateplume of dissolved constituents observed in the vicinity of the MW-9 cluster which is unrelated to the site. It shouldbe noted that the hydraulic influence associated with the operation of the ground-water treatment system at the sitehas been observed to be limited to an area within a few hundred feet of the site boundaries and does not have ameasurable effect upon the hydraulic heads at the MW-9 cluster.
Although VOCs were widely detected in ground water on-site, evidence exists that suggests that natural attenuation(e.g., natural degradation of VOCs) is occurring (BBL, March 1998). This conclusion is supported by the siteground-water analytical data, which demonstrate that a population of microorganisms is present in ground water atthe site capable of utilizing anthropogenic carbon as a food source, a variety of complete redox processes is occurringin ground water at the site, and dechlorination byproducts of VOCs in ground water are present.
Probable DNAPL Zone
The estimated Probable DNAPL Zone, illustrated on Figure 5, was delineated largely based on an approach presentedin USEPA guidance on DNAPL site evaluation (January, !992a), other sources (WCGR, 1991 Cohen and Mercer,1993; Pankow and Cherry, 1995), knowledge of the site history and direct DNAPL observation. During the initialclean out of the disposal wells in the 1980s, a waste characterization was performed on the pumped ground water.The characterization description included in the disposal records and comments from previous employees indicatedthat DNAPL was observed as part of the pumped waste from the wells (Correspondence from Willard Wade,
_______________________________ BLASLAND. BOUCK & LEE, INC. ___________________________engineers & scientists 1-10

Gilbert/Commonwealth Engineers and Consultants, to Alien Williams, Foley and Larder, dated October 16, 1981).Moreover, DNAPL presence is strongly suggested and can reasonably be expected to occur in immediate proximityto any monitoring well exhibiting VOC concentrations greater than 1 percent of the VOC effective solubility limit(WCGR, 1991; USEPA, January 1992a; Cohen and Mercer, 1993; Pankow and Cherry, 1995).
Regardless of the dimensions of the Probable DNAPL Zone estimated in overburden and bedrock during the RI(Figure 5), DNAPL can be reasonably assumed to have migrated beyond the Probable DNAPL Zones within anumber of isolated geologic laminae, strata, lenses, channels, or fractures near the periphery of the Probable DNAPLZone. While such incidences may represent a relatively minor fraction of the total DNAPL volume at the site,DNAPL within these zones can substantially impact the practicability of ground-water restoration within thesurrounding formation.
Contaminant Fate and Transport
The results of the RI and previous investigations at the site provide a basis on which to characterize the possibleroutes of constituent migration from the site as well as the potential receptors that may be impacted by site-relatedconstituents. A more detailed evaluation of constituent fate and transport issues is presented in the Risk AssessmentReport for this site (BBL, June 1998).
Possible routes of constituent migration include volatilization to the air, migration from the site with surface-waterrunoff, and transport of dissolved constituents within ground water migrating downgradient of the site. Based on anevaluation of the available data, the only potential route for constituents to be transported from the site wasdetermined to be through the migration of constituents downgradient of the site with ground water.
Although the elevated concentrations of VOCs delineated within the vadose zone soil beneath the site would beanticipated to contribute to the dissolved constituents in ground water, the relative contribution associated withleaching from these impacted soils, in comparison to the potential contribution associated with dissolution of DNAPLidentified in association with the site, is relatively small. The USEPA-published leaching model, VLEACH, was usedto determine the relative impacts of vadose zone soil VOCs upon the ground water beneath the site. VLEACH,Version 2.2a (Ravi and Johnson, 1996), is a one-dimensional vadose zone teaching model computer code forestimating the impact due to the mobilization and migration of a sorbed organic compound located in the vadose zoneupon ground water. These results indicate that the initial net flux of TCE to ground-water from the vadose zonewould be approximately 0.55 kg/yr with a total TCE mass contribution of 361.2 kg in 99 years. In comparison, themass of dissolved TCE in bedrock ground water is estimated at 7,800 kg. DNAPL volume estimates range from148,100 to 592,400 kg. The results of the VLEACH modeling is presented in Appendix A. Given the data presentedabove, the VLEACH model shows that the mass flux of TCE from the vadose zone soil to ground-water isinsignificant relative to the estimated mass within bedrock ground-water.
Ground-water quality data generated in connection with the RI and previous investigations indicate that dissolvedconstituents have migrated advectively within ground water toward the northwest [BBL, March 1998]. Based on theregional hydrogeologic setting, ground water from the site vicinity would be anticipated to migrate toward the north-northwest and ultimately discharge to the Leibert Creek and/or Little Lehigh Creek. Data collected indicates supportof the ecological assessment, including surface-water and sediment sampling results, no evidence of adverse impactsto these surface water bodies have been identified.
BLASLAND. BOUCK & LEE. INC.____________________________________engineers & scientists 1-11
;lR.H)05U9

1.3.3 Risk Assessment
A risk assessment (RA) for the site was conducted by BBL on behalf of Square D (BBL, February 1999), performedin accordance with the USEPA-approved Work Plan, dated August 1995, and submitted to the USEPA in May 1998.Both human health risk and ecological assessments were conducted in accordance with pertinent USEPA guidance.
Human Health Risk
The human health risk assessment (HHRA) was conducted to assess potential risks to human health associated withexposure to chemicals of potential interest (COPI) associated with the site under current or hypothetical futureconditions. BBL selected COPI for the various media associated with the site through the use of USEPA Region IIIrisk-based screening concentrations (USEPA, April 1998). For the purposes of the HHRA only, the ground waterassessment was segmented into on-site and off-site, site-related and non-site-related ground water. Based on theseevaluations, COPI were identified for on-site and off-site ground water, surface and subsurface soil, surface water,and sediment. No COPI were selected for air because exposure to this media is not significant.
The exposure assessment of the HHRA reviewed the environmental setting of the site, identified pathways of humanexposure, and quantifies exposure for selected potentially complete pathways. Pathways evaluated for the HHRAincluded:
• incidental ingestion of soil;• dermal contact with soil;• inhalation of fugitive dust particles generated by wind erosion of soil;• ingestion of ground water;• dermal contact with ground water;• inhalation of VOCs from ground water;• incidental ingestion of surface water during recreational activities; and* incidental ingestion of sediment during recreational activities.
The conclusions regarding risk characterization which are supported based on the results of this HHRA with respectto COPI are presented separately for each environmental medium: soil, ground water, surface water and sediment.
Soil
• On-site soil quality is within acceptable limits established by the USEPA as being protective of human health. Thisincludes potential risks associated with ingestion, dermal contact, and inhalation exposure by on-site workers andteenage trespassers (current land use), and hypothetical adults and children residing on site (future land use).
Ground Water
A ground-water assessment was performed separately for on-site monitoring wells and off-site potable supply wells,monitoring wells, and springs. Off-site ground water was separated into potentially site-related and non-site-related.
• On-site ground-water quality is not within acceptable limits established by the USEPA as being protective ofhuman health. This stems from potential risks associated with the hypothetical potable use of on-site ground water
_____________________________ BLASLAND. BOUCK & LEE. INC.____________________________________t \Docw0M4nDn WI««WPO..]/HJ« engineers A scientists 1-12
:iR.Hi055n

as represented by the current quality in monitoring wells. Modeling also predicts that total lead in on-site groundwater could result in blood lead levels in some children that are greater than the USEPA recommended limit.
Off-site ground-water quality in some of the potentially site-related potable supply wells is not within acceptablelimits established by the USEPA as being protective of human health. Most of these wells contain concentrationsof total metals (antimony, thallium, and manganese) that may pose a non-carcinogenic hazard to children throughingestion and dermal contact, and to adults through dermal contact. Modeling also predicts that total lead in onewell (PW-LM28) could result in blood lead levels in some children that are greater than the USEPA recommendedlimit. One well (PW-SA08) contains tetrachloroethene at a concentration (5.1 ug/l) that is slightly greater than theMCL (5.0 ug/l), and that may pose a potential carcinogenic risk (2E-04) greater than the USEPA's acceptable riskrange (IE-04 to IE-06) through dermal contact by adults.
Off-site ground-water quality in potentially site-related monitoring wells is within acceptable limits established bythe USEPA as being protective of human health, with the exception of monitoring well MW-5D. This wellcontains the only detection of carbon tetrachloride, which occurs at a concentration that may be pose a potentialnon-carcinogenic hazard through dermal contact by adults and children.
Off-site ground-water quality in several of the non-site-related potable supply wells is not within acceptable limitsestablished by the USEPA as being protective of human health. Some of these wells contain a mixture of totalmetals (antimony, barium, selenium, cadmium, thallium, and zinc) and VOCs (carbon tetrachloride,trichloroethene, and tetrachloroethene) at concentrations that may pose a non-carcinogenic hazard to children andadults through ingestion and dermal contact. Modeling also predicts that total lead concentrations could result inblood lead levels in some children that are greater than the USEPA recommended limit. Some of these wells alsocontain tetrachloroethene at concentrations that may pose a potential carcinogenic risk greater than the USEPA'sacceptable risk range (1E-04 to 1E-06) through dermal contact and ingestion by adults and children. These riskestimates are based on repeated exposure to concentrations of constituents reported in samples collected by GECin 1993.
Off-site ground-water quality in non-site-related monitoring wells is not within acceptable limits established bythe USEPA as being protective of human health. Some of these wells contain VOCs (carbon tetrachloride,chloroform, cis-l,2-dichloroethene, trichloroethene, and tetrachloroethene) at concentrations that may pose a non-carcinogenic hazard to children and adults through ingestion and dermal contact. Some of these wells also containcarbon tetrachloride and trichloroethene at concentrations that may pose a potential carcinogenic risk greater thanthe USEPA's acceptable risk range (IE-04 to IE-06) through dermal contact and ingestion by adults and children.(Total metal concentrations in these wells are unknown).
Off-site ground-water quality in springs is within acceptable limits established by the USEPA as being protectiveof human health, with the exception of spring SP-03. A sample from spring SP-03 contained trichloroethene andtetrachloroethene at concentrations that may pose a potential non-carcinogenic hazard through dermal contact byadults and children. The tetrachloroethene concentration reported in spring SP-03 may also pose a potentialcarcinogenic risk greater than the USEPA's acceptable risk range (IE-04 to 1 E-06) through dermal contact andingestion by adults and children.
8LASLAND, BOUCK & LEE. INC.engineers & scientists 1-13
i K . i i i ( 1 5 5 I
Surface Water and Sediment
• Surface-water and sediment quality in the unnamed tributary, Liebert Run, and Little Leigh Creek are withinacceptable limits established by the USEPA as being protective of human health. This includes potential risksassociated with ingestion exposure through recreational activities by adults, teenagers, and smaller children.
Ecological Risk
The EA followed the procedures set forth in the USEPA "Ecological Risk Assessment Guidance for Superfund:Process for Designing and Conducting Ecological Risk Assessments" (USEPA, 1994) and "Framework for EcologicalRisk Assessment" (USEPA, 1992).
The objective of the EA was to provide a screen ing-level analysis to identify whether potential site-related risks mayexist that merit further assessment. The EA also addresses the comments provided by the USEPA's BiologicalTechnical Assistance Group (BTAG) issued on August 29, 1997, December 21, 1997, and August 4, 1998 inresponse to the draft Remedial Investigation Report (which was approved with modification by USEPA on April 1,1998; the final report was issued in February 1999).
The conclusions of the EA for the site, presented separately for each environmental medium (soil, ground water and'springs/seeps, surface water, and sediment) and include the following:
Soil
• All VOC, organochlorine pesticide, and PCB compounds identified in surface soil samples were detected atconcentrations within acceptable limits established by the USEPA as being protective of ecological receptors.
• Inorganic constituents identified in surface soil samples were detected at concentrations within acceptable limitsestablished by the USEPA as being protective of ecological receptors with the exception of certain detections ofaluminum, antimony, beryllium, chromium, copper, iron, lead, magnesium, manganese, mercury, nickel, thallium,vanadium, and zinc. These detections do not merit further evaluation because the potential for receptor exposureto these naturally-occurring inorganic constituents is effectively mitigated by the presence of 6 to 24 inches ofgravel that covers the soil surface.
Ground Water
• Potential direct exposure to ground water flowing beneath the site will not occur because the depth to ground wateris greater than 100 feel bgs.
• Hydrogeologic data indicate that the Little Lehigh Creek is a regional ground-water discharge point, but ground-water discharge to Liebert Run or the unnamed tributary is unlikely.
• VOCs identified in ground-water samples from potable wells were detected at concentrations within acceptablelimits established by the USEPA as being protective of aquatic organisms.
• Inorganic constituents identified in ground-water samples from potable wells were detected at concentrationswithin acceptable limits established by the USEPA as being protective of aquatic organisms, with the exception
_____BLASLAND, 6OUCK& LEE. INC,____________________________________WMt WPQ..I/II,W engineers A scientists 1-14

of certain detections of aluminum, copper, iron, lead, mercury, silver, and zinc. These detections do not appearto warrant further evaluation because:
- Natural distribution and potential contributions from water distribution systems may be responsible for somethese detections;
- Inconsistencies between total and dissolved metals concentrations raises uncertainty in the numerical results;and
- Majority of dissolved metals concentrations (the transportable and bioavailable form) are within the USEPA'sacceptable limits for samples with a totals metals concentration greater than the acceptable limits.
Springs/Seeps
• Ground-water seeps/springs along the south bank of Little Lehigh Creek may receive a contribution of flow fromthe site, but seeps/springs along the south bank are generated by ground-water flow originating from locations otherthan the site.
• VOCs identified in ground-water samples from all seeps/springs were detected at concentrations within acceptablelimits established by the USEPA as being protective of aquatic organisms.
• Inorganic constituents identified in seep/spring samples along the south bank of the Little Lehigh Creek weredetected at concentrations within acceptable limits established by the USEPA as being protective of aquaticorganisms, with the exception of one detection of total aluminum. The absence of metals in springs/seeps thatwere identified as PCOCs in ground-water samples from potable wells underscores the limited potential fortransport of metals and the need for no further evaluation.
• Inorganic constituents identified in seep/spring samples along the north bank of the Little Lehigh Creek weredetected at concentrations within acceptable limits established by the USEPA as being protective of aquaticorganisms, with the exception of one detection of dissolved lead. Seeps/springs along the north bank do not receiveground-water flow from the site.
Surface Water
• Ground-water and spring/seep discharge to Little Lehigh Creek is the primary transport mechanism for PCOCsidentified in site ground water. Transport to the unnamed tributary and Liebert Run is limited to a storm waterdischarge from the site which enters the unnamed tributary (along with other storm water discharges from the sitevicinity) downstream of Broad Street.
• VOCs identified in surface water samples were detected at concentrations within acceptable limits established bythe USEPA as being protective of aquatic organisms. This absence of impact is corroborated by the results for thesamples from potable wells and springs/seeps along the south bank of the Little Lehigh Creek, which alsocontained VOC concentrations within the USEPA's acceptable limits. •
• Inorganic constituents identified in surface water samples were detected at concentrations within acceptable limitsestablished by the USEPA as being protective of aquatic organisms, with the exception of certain detections ofaluminum, cadmium, copper, iron, lead, mercury, silver, and zinc. These detections do not appear to warrantfurther evaluation because:
•_______________________________BLASLAND. BOUCK & LEE. INC.____________________________________j\DocwoM6iflM9oi46WPD.-!/!*/» engineers A scientists 1-15
iR.iii0553
- Natural distribution may be responsible for some these detections, as shown by the aluminum, copper, iron, andzinc detections upstream and downstream of the site storm water discharge;
- Inconsistencies between total and dissolved metals concentrations raises uncertainty in the numerical results;and
- Majority of dissolved metals concentrations (the transportable and bioavailable form) are less than acceptablelimits for samples with a totals metals concentration greater than the acceptable limits.
Sediments
• VOCs identified in sediment samples were detected at concentrations within acceptable limits established by theUSEPA as being protective of aquatic organisms, indicating that ground-water discharge has minimal (if any) effectin sediment quality.
• Inorganic constituents identified in sediment samples were detected at concentrations within acceptable limitsestablished by the USEPA as being protective of aquatic organisms, with the exception of certain detections ofantimony, cadmium, chromium, lead, nickel, silver, and zinc. These detections do not identify a site-relatedimpact which warrants further evaluation because:
- Natural distribution may be responsible for some these detections, as shown by the cadmium, copper, andchromium detections upstream and downstream of the site storm water discharge.
- A sediment sample collected from the unnamed tributary downstream of the storm water discharges from thesite and Broad Street area contained the most PCOC detections greater than the USEPA acceptable limits.
- Seven of the eight sediment PCOCs had greater maximum values in sediment samples than in site surface soilsamples (the eighth PCOC was not analyzed for in soil), indicating that a source other than the site is having agreater influence on sediment quality.
Based on the results of the EA, further ecological assessment activities are not warranted in connection with this site.
1.3.4 Other Source Areas
Ground-water contamination has been documented regionally and not solely in the vicinity of, and hydraulicallydowngradient of, the site. Contamination was observed hydraulically upgradient, side-gradient, and downgradientof the site during the Hydiogeologic Investigation of the site (Weston, November 1989). The investigation concludedthat the presence of contaminants (TCE) in supply wells upgradient and/or sidegradient of the site suggests thatadditional sources of dissolved-phase TCE, other than those at the site exist (Figure 3). The results of the off-siteground-water sampling of private wells performed in connection with the "Well Survey Evaluation" (GEC,September 1994), also identified trace concentrations of VOCs in numerous private wells located upgradient or sidegradient from the site. This further supports the existence of other sources (unrelated to the site) of dissolvedconstituents to ground water in this vicinity (Figure 3).
Weston (November 1989) presented a list of possible contributors to the presence of TCE in ground water in thegeneral vicinity of the site. This list includes Air Products and Chemicals, Inc., Buckeye Pipeline Company, General
BLASLAND. BOUCK & LEE. INC.____________________________________engineers & scientists 1-16

Machine Company, Uniform Rental, Electro Chemical Engineering Company, Superior Combustion, Volney FeltMills (including a suspected area of felt waste disposal), and a possible old brick operation. The locations of thesefacilities are illustrated on Figure 3.
The Weston report concludes by stating that much additional work would be necessary to define relationshipsbetween the regional distribution of dissolved TCE in ground water and the various potential TCE sources.
1.4 Completed Remedial Activities
1.4.1 Ground-Water Treatment System (GWTS)
Square D Company has implemented a Non-Time Critical Interim Response Action pursuant to an AOC for theRemoval Response Action (RRA). This RRA involved the design, installation and startup of a GWTS at the site thatutilizes four existing wells as ground-water extraction points.
The construction of the GWTS was completed and an initial period of system start up was implemented betweenAugust 19"and 21,1996, during which BBL performed continuous water level monitoring for aquifer characterizationpurposes. The aquifer testing activities and results associated with the GWTS start-up period is discussed in detailin the RI Report for the site (BBL, March 1998). The GWTS is currently operational.
The ground-water treatment system was constructed at the site to treat the ground water recovered from the fourexisting wells Well 3, Well 4, RW-3, and MW-4 (referred to within the context of the GWTS as EXWP-1, EXWP-2,EXWP-3, and EXWP-4, respectively). The GWTS is designed based on an average flow rate of 45 gpm and amaximum flow rate of 90 gpm. The GWTS includes the following components:
• an equalization tank;• a liquid/solid separation unit and sludge handling equipment;• an air stripper;• liquid phase granular activated carbon units; and• a regenerative vapor phase adsorber unit (Thermatrix™ Unit).
Treated ground water is discharged to a storm sewer located on-site which discharges to the Unnamed tributary toLiebert Creek pursuant to a NPDES permit issued by PADEP. The GWTS permitted effluent limits are presentedin Table 1.
GWTS Operation
The GWTS has been in operation under automatic conditions as of February 5,1997. Ground-water extraction ratesmaintained since the system went into operation have typically ranged from approximately 30 to 45 gpm. The fourthextraction point, MW-4, is a 4-inch diameter monitoring well which was selected as an extraction well becauseelevated concentrations of VOCs were detected at this location; however, the minimal saturated thickness screenedby this well results in a relatively low yield (<1 gpm). Therefore, MW-4 (EXW-4) has not been operated regularlyand the majority of the water handled by the GWTS is extracted from Well 3 (EXW-1), Well 4 (EXW-2), and RW-3(EXW-3).
BLASLAND, BOUCK & LEE, INC.____________________________________engineers A scientists 1-17
(RJIHJ555

Hydraulic Containment
The existing GWTS is currently providing hydraulic containment of the dissolved-phase plume at the site. Thecomprehensive rounds of water level measurements obtained on March 11,1997, October 1,1997, and July 20,1998(Figures 6, 7, and 8, respectively) were taken during pumping conditions and illustrate the existence of potentiometricdrawdown in the aquifer associated with the operation of the GWTS. The control of groundwater at shallower depthsis less clearly understood. The existing groundwater treatment system and the area of hydraulic containment will bebetter understood following the installation of an additional monitoring well and the replacement of pumping wellMW-4 as part of the remedial action for the site.
1.5 Technical Impracticability Evaluation Summary
1.5.1 Applicability of a Tl Evaluation
Most saturated overburden and bedrock deposits contaminated by DNAPLs cannot be remediated to typicalconcentration-based cleanup goals (USEPA, September 1993). Research and experience acquired during the past10 years have shown that while partial DNAPL removal may be possible at some sites, removing sufficient DNAPLto achieve concentration-based cleanup goals is not technically practicable. Removal is generally not practicable dueto technological inability to hydraulically collect residual and pooled DNAPL in the subsurface. This situation isfurther complicated by the site's complex geology, the presence of preferential flow fractures, and the inability ofinduced ground-water gradients to effectively move DNAPLs to recovery wells. In fractured media, the process ofmatrix diffusion impedes the effectiveness of remedial technologies.
The technical challenges associated with remediating contaminated ground water include many complex factorsrelated to site hydrogeology and chemistry. One of the most difficult of these challenges is the problem presented byDNAPLs. A USEPA study indicates that DNAPLs may be present at up to 60 percent of NPL sites, are often verydifficult to locate and remove from the subsurface environment, and may continue to contaminate ground water formany hundreds of years despite best efforts to remedy them (USEPA, September 1993). The prevalence andintractability of DNAPL contamination are among the principal reasons the Tl guidance document was developedby the USEPA (USEPA, September 1993).
A Tl Evaluation is appropriate for the site because of the presence of slowly dissolving DNAPLs in the saturatedzone, the heterogeneous nature and low permeability of the geologic media underlying the site, and the likelyinfluence of matrix diffusion in bedrock. The presence of DNAPLs in the subsurface will substantially limit the site'srestoration potential. A Tl Evaluation was developed for ground water within the potential DNAPL zone, the zonewhere extensive matrix diffusion of VOCs has occurred into the geologic media, and the downgradient extent ofhydraulic capture achieved by the ground-water containment system.
1.5.2 Summary of the Tl Evaluation
The purpose of this evaluation is to assess the practicability of achieving ARARs with regard to restoration of groundwater within a time frame that is reasonable given the circumstances of this particular site. The principal issues ofconcern in connection with this evaluation is the practicability of achieving the relevant ground water cleanupstandards (i.e., MCLs) for certain VOCs.
BLASLAND, 8OUCK & LEE, INC.____________________________________engineers A scientists 1-18
;iR.Ui(J556

The Tl Evaluation describes: 1) the estimated three-dimensional volume of the bedrock NAPL zones; and 2) theestimated total VOC mass dissolved, sorbed, or present as NAPLs in the bedrock. Data were obtained during the RIto support a "front-end" Tl decision for the site, in accordance with Section 4.2 of the Tl guidance document(USEPA, September 1993). A front-end Tl decision is made before implementing the overall site remedy and appliesin certain cases when adequate, detailed site characterization has been performed. In accordance with the Tl guidancedocument (USEPA, September 1993), site characterization requires an assessment of the most critical limitations toground-water restoration, including the presence, quantity, distribution, and properties of DNAPL, geologic formationheterogeneity and solute transport characteristics, and bedrock fracture characteristics.
A Tl determination is appropriate for the Rodale Site due to the presence of substantial quantities of NAPL in thesubsurface, the highly heterogeneous nature of the geologic formations at the site, and the influence of bedrock matrixdiffusion. The NAPL zone at this site covers approximately 1.2 acres. The NAPL zone extends to an estimateddepth of up to 420 feet below ground surface. The estimated volume of the NAPL zone is approximately 830,000cy.
VOC mass calculations indicate the estimated total subsurface VOC mass may range up to 647,000 kilograms (kg),with up to'592,000 kg in the form of NAPLs, and the remainder of the mass is in dissolved, sorbed, or vapor phase.
Detailed hydrogeologic characterization of the overburden and bedrock units, including their structure and hydraulicconductivity, indicate that these units are highly heterogeneous and complex at a small scale. The bedrock matrixporosity represents a significant storage capacity for VOCs that diffuse into the matrix from the fractures, asconfirmed by bedrock matrix VOC analysis. Matrix diffusion reduces the migration rate of the bedrock VOC plumesby a factor of approximately 40. However, matrix diffusion will also significantly hinder efforts to restore bedrockground-water quality. Preliminary matrix diffusion calculations performed by Professor Bemie Kueper of QueensUniversity indicate that diffusion of VOCs back out of the bedrock matrix, after the extended period required for thedissolution of NAPL, will take an additional 30 years assuming average homogeneous bedrock conditions. However,the process of matrix diffusion would be expected to require much longer time periods within portions of the bedrockgiven the observed variability of bedrock characteristics including fracture frequency, fracture apertures and hydraulicconductivity.
While the data and evaluations presented herein are provided to support a "front-end" (pre-Record of Decision)TIdetermination on the part of the USEPA, two years of operating data from the existing ground-water recovery andtreatment system empirically support the impracticability of ground-water restoration at the site. Over the two yearsof ground-water extraction and treatment, approximately 21 million gallons have been pumped, while ground-waterconcentrations of influent pumped by the system are showing approximately asymptotic levels approximately threeorders of magnitude above regulatory criteria. These findings are consistent with the large volume of NAPLcontained within the NAPL zone. Estimates of the time required to dissolve the NAPL range up to 2,370 years atcurrent mass-removal rates.
The proposed Tl zone includes:
• The probable NAPL zone;
• The zone where VOCs have diffused into the bedrock matrix to the degree that removal from the matrix cannotbe achieved within an acceptable time frame (matrix diffusion zone); and
____________________________________BLASLAND, BOUCK & LEE. INC. ___________________________________t\DocwoM6i*!iron*wpo~2/iw» engineers A scientists 1-19
,iR.ii)0557

• The portion of the VOC plume immediately downgradient of the two above-listed zones and extending the limitsof the containment area that will be achieved by the ground-water remedy, which will be specified in the ROD toaddress the off-site regulatory VOC plume.
No existing technology is capable of remediating the Tl zone at the Rodale Site to ground-water ARARs. Someemerging technologies could rernqve some mass, but they pose unacceptable risks. Technologies focusing onhydraulic removal via pumping with or without reducing NAPL-water interfacial tension (e.g., surfactants, alcohols,etc.) would pose unacceptable risk that NAPL would remobilize in unpredictable directions and spread beyond itscurrent boundaries. Technologies focusing on mass removal via solubility enhancement would pose unacceptableexposure-based risk, and would drive more chemical mass into low-permeability zones through molecular diffusion.Any in-situ remedial technology would need many closely spaced pumping, injection, and/or treatment wells, up to420 feet deep, to attempt to overcome the extreme heterogeneity of the overburden and bedrock formations. Suchefforts would require an immense and costly infrastructure, and would pose unacceptable risk of drilling throughNAPL and remobilizing NAPL deeper into the bedrock. Any ex-situ technology involving excavation would subjectexcavation workers and the public to inordinate short-term health risks. On balance, it appears that the risks posedby available technologies may far outweigh any limited benefit each may offer.
The detailed Tl Evaluation is presented as Appendix B.
1.5.3 Alternate Remedial Strategy
Because complete restoration of ground water is believed to be technically impracticable for the site, an alternativeremedial strategy that is technically practicable and protective of human health and the environment may beappropriate, as discussed in USEPA's "Guidance for Evaluating the Technical Impracticability of Ground-WaterRestoration" (USEPA, September 1993).
Alternative remedial strategies typically address three types of problems: prevention of exposure to contaminatedground water; control and remediation of contamination sources; and remediation of aqueous contaminant plumes.As detailed in the Tl Evaluation (Appendix B), remediation of the contamination source and remediation of theaqueous contaminant plume within the Tl Zone is not practicable and will not be evaluated in the FS. Preventionof exposure to the aqueous contaminant plume outside the Tl Zone (the dissolved-phase plume) is practicable andis considered in this FS. The area and volume of media to be considered for remediation is discussed in Section 3.4of this report.
Minimizing the risk of NAPL mobilization is an appropriate remedial action objective, and is the primarymanagement objective for the Tl zone. The NAPL and geologic characteristics at the site suggest that the NAPL iscurrently in a stable distribution, and will remain in that state unless it is disturbed (such as by drilling or because ofchemical or hydraulic gradient changes).
The proposed remedial strategy for the Tl zone will minimize the potential for NAPL remobilization. It includeshydraulic containment of the dissolved-phase plumes emanating from the NAPL zones, and institutional controls tolimit exposure-based risk. This remedial strategy will provide exposure control by means of institutional controls,source control by means of hydraulic containment, and aqueous plume remediation by allowing the furthest,downgradient end of the regulatory VOC plumes to naturally attenuate. The remedy will also provide treatment forany extracted ground water. This proposed remedial alternative will be revisited as part of the Five-Year ReviewProcess.
______BLASLAND, BOUCK & LEE, INC, _______________________________engineers A scientists 1-20
iR.iniJ558
2. Identification of Standards, Criteria, and Guidance
2.1 Potential Applicable or Relevant and Appropriate Requirements (ARARs) and To BeConsidered Materials (TBCs)
This section presents a discussion of potential ARARs for consideration throughout the identification, screening, andevaluation of remedial alternatives during the FS.
ARARs are promulgated, enforceable federal and state environmental or public health requirements, which fit intoeither of two categories: "applicable requirements" and "relevant and appropriate requirements." Applicablerequirements are those cleanup standards, standards of control, and other substantive environmental protectionrequirements, criteria, or limitations promulgated under federal or state law that specifically address a hazardoussubstance, pollutant, contaminant, remedial action, location, or other circumstance at a CERCLA site. Relevant andappropriate requirements are those cleanup standards, standards of control, and other substantive environmentalprotection requirements, criteria, or limitations promulgated under federal or state law that, while not legallyapplicable to a hazardous substance, pollutant, contaminant, remedial action, location, or other circumstance at aCERCLA site, address problems or situations sufficiently similar to those encountered at the CERCLA site that theiruse is well suited to the particular site or actions at the site.
The USEPA and the states have also identified certain guidance as "to be considered" criteria (TBCs). TBCs are non-promulgated advisories or guidance issued by federal or state government that are not legally binding and do not havethe status of potential ARARs. Along with ARARs, TBCs may be used to develop the remedial action limitsnecessary to protect human health and the environment.
The USEPA categorizes ARARs and TBCs as chemical-specific, location-specific, or action-specific. These ARARcategories are described below.
2.1.1 Potential Chemical-Specific ARARs and TBCs
Chemical-specific ARARs and TBCs are usually health- or risk-based values that may define acceptable exposurelevels and, therefore, may be used in establishing remediation goals. In general, chemical-specific ARARs are setfor a single chemical or a closely related group of chemicals. A preliminary listing of potential chemical-specificARARs is included in Tables 2 and 3. No chemical-specific TBCs have been identified for the site.
2.1.2 Potential Location-Specific ARARs and TBCs
Location-specific ARARs and TBCs are restrictions placed on the concentrations of hazardous substances or theconduct of activities solely because they are in specific areas. Examples of areas that would potential be effected byfederal and state ARAR»-include wetlands, floodplains or navigable waters.
The site is graded and covered with quarry fill and #2A modified stone. The remaining structure on site includes abuilding that houses the ground-water treatment system, and recovery well protective enclosures. No streams,wetlands or water bodies exist on the site and the site is not located within the 100-year flood plain. A review ofpotential location-specific ARARs and TBCs were made with no ARARs identified as being applicable for the site.
A listing of potential location-specific TBCs is included in Table 4.
BLASLAND, BOUCK & LEE. INC.____________________________________engineers A scientists 2-1

2.1.3 Potential Action-Specific ARARs and TBCs
Action-specific ARARs and TBCs are usually technology- or activity-based requirements or limitations on actionstaken with respect to hazardous wastes. These requirements generally focus on actions taken to remediate, handle,treat, transport, or dispose of hazardous wastes. These action-specific requirements do not in themselves determinethe remedial alternative; rather, they indicate how a selected alternative must be achieved. The general types ofpotential action-specific ARARs that may be applied to the site are briefly described below.
The Clean Water Act (CWA) requires that any point source discharge to waters of the U.S. meets all applicablerequirements under the NPDES program. These requirements would apply if the remedial alternatives evaluatedduring the FS involve point source discharges to the nearby stream. The CWA Pretreatment Regulations state thatall discharges to a publicly owned treatment works (POTW) must be treated to prevent interference with operationof the POTW, pass-through of pollutants, and violations of local limits. These regulations would be ARARs if theremedial alternatives for the site include discharge to a POTW.
Various requirements under the Clean Air Act would also be potential ARARs, if the remedial alternatives to beevaluated "as part of the FS involve air emissions. The National Ambient Air Quality Standards (NAAQS) setmaximum primary and secondary 24-hour concentrations for six criteria pollutants in the ambient air.
The RCRA facility standards address the design, facility operations, manifesting and record keeping, treatment,disposal, ground-water monitoring, and closure for certain types of waste management facilities.
Ambient Water Quality Criteria (AWQC) have been developed under the CWA as guidelines for the protection offreshwater aquatic life and human health, based on ingestion of water and fish consumption. These standards wouldbe used to develop effluent discharge limits for those alternatives that require discharges to the nearby stream.
A preliminary listing of potential action-specific ARARs and TBCs is included In Table 5.
These lists of ARARs and TBCs will be revised and refined throughout the development of the FS. The final ARARsand TBCs will be used in the detailed analysis of the effectiveness of remedial alternatives, and will be factored intothe development of performance standards to be included in the Record of Decision (ROD) for the site.
2.2 Waiver of ARARs
Under certain circumstances, a remedial alternative that does not meet an ARAR may be selected, and a waiver ofthe necessity to comply with the ARAR may be granted. Of the six sets of circumstances described in Section300.430(f)(t)00(c) of th* NCP for which waivers may be granted, one is considered applicable to the site:
"Compliance with the requirements is technically impracticable from an engineering perspective."
Several of the ARARs presented above are designed to require restoration of ground water to background or drinkingwater quality levels. However, it has been documented that DNAPL is present in ground water at the site [BBL,1998]. According to the USEPA document (USEPA, January 1992a) "Estimating Potential for Occurrence ofDNAPL at Superfund Sites." Although many DNAPL removal strategies are currently being tested, to date therehave been no field demonstrations where sufficient DNAPL has been successfully recovered from the subsurface to
BLASLAND, BOUCK & LEE. INC.____________________________________engineers A scientists 2-2
iR.11)0560

return the aquifer to drinking water quality. As a result, it may be necessary to invoke a waiver under CERCLASection 121 (d)(4) of those ARARs related to aquifer restoration."
All ARARs listed above will be evaluated with regard to the applicability of the waiver mechanisms in the NCP aspart of the FS. The Tl ARAR waiver has been evaluated pursuant to the USEPA's "Guidance for Evaluating theTechnical Impracticability of Groundwater Restoration" (USEPA, September 1993).
BLASLAND. 6OUCK & LEE, INC.|sDOC9*OW*l\OllTOI4tWPD.-2/IBi« e ft Q IH B 8 f S A S C I 0 n 11 St S ' 2-3
3. Remedial Action Objectives
3.1 Remedial Action Objectives (RAOs)
The HHRA was conducted to assess potential risks to human health associated with exposure to COPI associated withthe site under both current and hypothetical future conditions. Conclusions regarding the risk characterizationinclude:
Soil
• On-site soil quality is within acceptable limits established by the USEPA as being protective of human health.
Ground Water
A ground-water assessment was performed separately for on-site monitoring wells and off-site potable supply wells,monitoring wells, and springs. Off-site ground water was separated into potentially site-related and non-site-related.
• Ground-water quality in site-related wells is not within acceptable limits established by the USEPA as beingprotective of human health.
• Ground-water quality in some of the potentially site-related potable supply wells is not within acceptable limitsestablished by the USEPA as being protective of human health. Ground-water quality in potentially site-relatedmonitoring wells is within acceptable limits established by the USEPA as being protective of human health, withthe exception of monitoring well MW-5D.
• Ground-water quality in several of the non-site-related potable supply wells is not within acceptable limitsestablished by the USEPA as being protective of human health. Ground-water quality in non-site-relatedmonitoring wells is not within acceptable limits established by the USEPA as being protective of human health.
• Ground-water quality in springs is within acceptable limits established by the USEPA as being protective of humanhealth, with the exception of spring SP-03.
Surface Water and Sediment
• Surface-water and sediment quality in the unnamed tributary, Liebert Run, and Little Leigh Creek are withinacceptable limits established by the USEPA as being protective of human health.
The ecological risk assessment for the site concluded the no further ecological assessment activities are warrantedin connection with the site.
RAOs for the site have been developed in consideration of the potential human health risks associated with exposureto ground water, the lack of risk associated surface and subsurface soils, sediment, and surface water, the technicalimpracticability of remediating the NAPL zone (i.e., the contaminant source) and alternative remedial strategies. TheRAO for dissolved-phase ground water is presented below:
• Limit potential future exposure, through ingestion, direct contact and inhalation, to dissolved-phase ground waterand restore ground water to the extent practicable.
BLASLAND, BOUCK & LEE, INC.______________________i«wPo--2/iw* engineers A scientists 3-1
.< R.I M 0562
Although it is recognized that subsurface soil impacts are present at the site, a soil RAO has not been developed forthe following reasons. The risk assessment concluded that no risks are associated with the impacted soil; theimpacted soil is very limited in extent and, based on VLEACH modeling, is expected to be a relatively minor sourceof VOCs to ground water in comparison to the dissolution of DNAPL; and the remediation of vadose zone soils willnot benefit ground-water remediation at the site due to the presence of subsurface DNAPL. The latter point isspecifically recognized in USEPA's guidance entitled, "Rules of Thumb for Superrund Remedy Selection" (USEPA,August 1997) where the following is stated relative to the relationship between ground-water RAOs and soilpreliminary remediation goals (PRGs):
"At many sites, soil PRGs are set at levels that are needed to achieve long-term RAOs for ground water. As aresult, these soil PRGs may need to be more stringent than would otherwise be necessary given the reasonablyanticipated future land use. However, stringent soil PRGs intended to protect ground water generally will beinappropriate for site areas where the primary source of ground-water contamination is located below the soil (e.g.,DNAPLs below the water table) and restoration of ground water is determined to be technically impracticable.Therefore, both reasonably anticipated future land use and potential future ground-water uses must be consideredwhen developing the overall remediation strategy."
Since remediation of vadose zone soils will not provide a reduction of risk to human health and the environment, avadose zone soil RAO has not been developed.
3.2 General Response Actions (GRAs)
GRAs are non-specific remedial strategies for achieving the remedial action objectives identified for the site. Indeveloping the GRAs for dissolved-phase ground water, it has been assumed that remediation of the probable NAPLzone and matrix diffusion zone will be deemed technically impracticable, thus the source of dissolved-phasecontaminants will not be remediated. In accordance with USEPA's Tl guidance, containment of the Tl zone isevaluated in the Tl Evaluation included in Appendix B. Because source zone remediation is considered technicallyimpracticable, the GRAs have been developed in consideration of an alternative remedial strategy with a focus onexposure control and aqueous plume remediation outside the Tl zone.
Dissolved-Phase Ground Water
The GRAs developed for addressing the dissolved-phase ground water include the following:
No ActionInstitutional ControlsAccess Controls —Natural AttenuationAlternate Public Waler SupplyHydraulic ContainmentIn-Situ TreatmentEx-Situ Treatment
BLASLAND, BOUCK& LEE, INC.engineers A scientists 3-2
3.3 Areas and Volumes of Media to Which Remedial Action May Apply
As documented in the Tl Evaluation, the probable DNAPL zone is considered technically impracticable to restoreto ARARs and are not further evaluated is part of this FS.
As documented in the RI, surface soils do not exceed applicable standards and do not present a risk to human healthand the environment and thus remediation of surface soil is not considered as part of this FS. As discussed aboveand in the RI and RA, impacts to subsurface soil (i.e., soil concentrations exceeding PA Act 2 Standards) are isolatedto an area near former Injection/Disposal Well 2 at depths ranging from 30 to 90 feet below ground surface and donot present a unacceptable risk to human health or the environment. Modeling shows that TCE leaching from thevadose zone soil is contributing to shallow ground-water contamination. However, the results of the model indicatethat the mass flux of TCE from the vadose zone soil is insignificant relative to the mass estimated to already bepresent in ground-water. Because of the limited and isolated nature of the subsurface soil impacts, the impacted soilsare expected to provide a minor source of VOCs to ground water in comparison to the expected VOC contributionfrom the DNAPL. The remediation of subsurface soils will not provide a reduction in risk to human health or theenvironment and will not benefit the remediation of ground water, thus remediation of soil at the site is not consideredas part of this FS.
Dissolved-phase ground water at the site (i.e., on-site ground water) does present a potential human health risk andthus will be evaluated as part of the FS.
Dissolved-Phase Ground Water
In consultation with the USEPA, dissolved-phase ground water has been divided into the following two categories:
• Site-related ground water - comprised of ground water represented by on-site monitoring wells (see Figure 2),including MW-1, MW-2, MW-3, MW-4, RW-3, Well 1, Well 2, Well 3, Well 4, Well 6 and Well 7; and by off-sitemonitoring wells located in locations that could be hydrologically influenced by the site, including nine monitoringwells installed as part of the site investigation (MW-5S, MW-5D, MW-8S, MW-8D, MW-10S, MW-10I, MW-1OD, MW-11S, MW-11 D), eight private wells (EM08, EM09, LM20, LM21, LM23, LM28, SA07 and SA08) andone public supply well (PSW-7); and
* Non-site-related ground water - comprised of ground water represented by monitoring wells in off-site locationsthat are not hydrologically influenced by the site (see Figure 3), including seven monitoring wells (MW-6, MW-7S,MW-7D, MW-9S, MW-9D, MW-12S, and MW-12D), 23 private wells(0351,1942,1501, LE311, LE312, LE411,LE677, LE1293, LM10, LM26, LM27, SA05, SA09, UM40, UM43, UM45, UM58, UM59, UM60, UM61,UM62, UM63 and UM64) and five public supply wells (PSW-1, PSW-2, PSW-3, PSW-4 and PSW-6).
Based on the analysis of VOC mass distribution, and local hydrogeology presented in the RI Report, the areal extentof impacted ground water is approximately 3 acres. It should be noted that most of this area is expected to fall withinthe Tl Zone. Non-site related ground water is considered a regional contamination issue unrelated to the site and isnot considered for remediation as part of the FS for this site.
BLASLAND, BOUCK & LEE. INC.engineers A scientists 3-3
(R.<n056U

4. Identification and Screening of Technologies andProcess Options
4.1 General
The methodology used to identify potential technologies and process options for addressing dissolved-phase ground-water is discussed below. Each identified technology/process option is described and evaluated against preliminaryscreening criteria. This approach is used to determine if a particular technology is applicable for remediation ofdissolved-phase ground water. Process options will be eliminated or retained for incorporation into treatmentalternatives (Section 5). Remedial alternatives that are not retained through the preliminary screening will not bereviewed as part of the detailed analysis of alternatives to be developed.
Remedial technologies and process options were identified based on a review of available literature, including thefollowing USEPA documents:
• "Remedial Action at Waste Disposal Sites Handbook" (USEPA, October 1985);• 'Treatment Technologies" (USEPA, August 1991);• USEPA Superfund Innovative Technology Evaluation (SITE) program literature (various dates);• "Innovative Treatment Technologies" (USEPA, October 1991); and• "Remediation Technologies Screening Matrix and Reference Guide" (USEPA, July 1993).
In addition, select technology/process option vendor information was consulted to identify additional candidatetechnologies that may be applicable for addressing the potential chemicals of concern in the dissolved-phase groundwater.
4.2 Identification and Screening of Technologies and Process Options
The following technologies and process options have been identified for the site.
Dissolved-Phase Ground Water
No Action
• No Action
Institutional and/or Limited Control Measures
- Deed Restrictions —• Alternate Concentration Limits• Ground-water Rectification• Monitoring
Natural Attenuation
• Natural Attenuation
BLASLAND. BOUCK& LEE. INC._________________________________engineers & scientists 4-1
•(R.1U0565

Containment
• Hydraulic Containment• Physical Containment
In-Situ Treatment
• Biological• Separation• Passive Reaction Walls
Ex-Situ Treatment
• Biological• Separation• Conventional Treatment
4.3 Evaluation and Screening of Representative Technologies/Process Options
A brief technical description of each of the remedial technologies for the media considered in this evaluation follows.
No Action
Under the no action alternative operation of the existing ground-water extraction and treatment system would ceaseand the site would be allowed to remain in its current condition. The no action alternative would not actively reducethe toxicity, mobility, or volume of the chemical constituents present the site. The no action alternative could beimplemented at the site if no risk were present.
The NCP requires that the no action alternative be considered during the FS process. Therefore, the no actionalternative will be retained for further evaluation during the detailed analysis of remedial alternatives. The no actionalternative will serve as a baseline for comparing the effectiveness of other remedial alternatives to be developed fordissolved-phase ground water.
Institutional and/or Limited Control Measures
Deed Restriction
Impacted ground-water at the site is not currently used for potable consumption and is not expected to be usedbecause residential development of this industrial/commercial property is unlikely. Furthermore, a municipal watersupply is available to provide potable water should the site be redeveloped. However, deed restrictions could beimplemented to ensure that in the unlikely event that the site is developed, ground-water would not be used forpotable consumption. This technology will be retained for further evaluation.
BLASLAND, BOUCK& LEE. INCengineers A scientists 4-2
.(R.iiiU566

Monitoring
Monitoring involves the collection and analysis of ground-water samples to document changes in ground-waterquality over time and to evaluate the effectiveness of the selected remedial action. This technology will be retainedfor further evaluation during the FS process.
Ground-Water Reclassification
This technology involves requesting that the state of Pennsylvania reclassify ground-water at, and downgradient of,the site from a potable to a non-potable drinking water source. This technology would eliminate the human healthrisk associated with potential future residential development and ground-water consumption, however, because ofthe close proximity (<'/2 mile) to water supply well PSW-3, PADEP would not approve a rectification for this site.Thus, this technology will not be retained for further evaluation.
Alternate Concentration Limits
In accordance with USEPA's Tl guidance, to qualify for use of an alternate concentration limit (ACL), the site mustmeet the following three requirements:
• There must be known points of entry of the contaminated ground-water into surface water;
• There must be no statistically significant increases of the contaminant concentrations in the surface water orcontaminant accumulations in downstream sediments; and
• Enforceable measures can be put into place to prevent exposure to the contaminated ground-water.
USEPA generally considers ACLs appropriate only where cleanup to ARARs is impracticable, based on an analysisof the "balancing" and "modifying" evaluation criteria in the NCP (i.e., long-term effectiveness; reduction ofmobility, toxicity, or volume; short-term effectiveness; implementability; cost; and state or community acceptance).Where an ACL is established, an ARAR waiver is not necessary. Because source area control and attainment ofARARs for the entire dissolved-phase ground-water may not be practicable, this alternative will be retained for furtherevaluation.
Natural Attenuation
Natural Attenuation
Natural attenuation (also known as intrinsic degradation) relies on the ground-water's natural restorative abilitythrough physical, chemical, and biological processes. Attenuative processes include dilution, dispersion,volatilization, biodegradation, adsorption, and chemical reactions with subsurface materials. The biodegradative andchemical reactions induce electron transfer with consequent molecular transformation to reduce toxicity, whiledilution, dispersion and volatilization are physical processes that also help to reduce the toxicity of affected groundwater.
The ability of naturally occurring microbial communities to effectively degrade fuel hydrocarbons has been welldocumented (Buschek et. al., 1995). More recently, however, it has been established that certain types of
_____________________________ BLASLAND. 6OUCK & LEE, INC____________________________________engineers A scientists 4-3
MR .H) 056 7

mirocoorganisms will, under specific conditions, degrade or transform halogenated compounds such as PCE, TCE,1,1,1-TCA, and related compounds. Anaerobic processes such as reductive dehalogenation and aerobic processessuch as co-metabolism are effective as a bioremedial treatment train for chlorinated ethenes and ethanes when appliedin sequential combination. (USEPA, 1995)
Natural attenuation is generally a moderate- to long-term process that may be effective in addressing dissolved-phaseconstituents in ground water in combination with control of the source of the constituents. Although constituentsource (i.e., DNAPL) remediation at the site is considered technically impracticable, natural attenuation processeswill continue to address the dissolved-phase VOCs. Because the source of dissolved VOCs to ground-water cannotbe effectively remediated or completely contained, natural attenuation should be considered as a viable technologyin conjunction with institutional actions (e.g., deed restrictions) in order to provide exposure control and be protectiveof human health and the environment. Natural attenuation is an ongoing process that will effectively address ground-water constituents. Moreover, this technology can be used in conjunction with other remedial technologies (e.g.,institutional controls, hydraulic containment, etc.) to provide an effective alternative remedial strategy. Thistechnology will be retained for further evaluation.
Containment Technologies
Hydraulic Containment
Hydraulic containment is typically used to control the migration of dissolved-phase plume and is typically providedby conventional pumping (e.g., submersible pumps) in conjunction with either vertical wells or a vertical collectiontrench. Because it would not be technically feasible to install trenches to the depths required for hydrauliccontainment (i.e., greater than 100 feet) collection trenches will not be retained for further evaluation. The hydrauliccontainment technology which will be retained for further consideration will be comprised of extraction wells andconventional pumping.
Hydraulic containment of the dissolved-phase ground water is currently being provided by the existing ground-watercollection and treatment system which was installed and is operated in accordance with the RRA. The purpose ofthe existing treatment system is to control the off-site migration of dissolved-phase VOCs. The ground-watercollection and treatment system was designed to utilize four existing wells as ground-water extraction points; thetreatment system components are discussed below as part of the ex-situ treatment technologies. The existing systemwas put into operation in August 1996 and continues to operate. Ground-water extraction rates maintained since thesystem startup have typically ranged from approximately 30 to 45 gpm. Because of the minimal saturated thicknessscreened by one of the extraction wells (i.e., MW-4), it provides a relatively low yield (< 1 gpm); thus, pumping fromMW-4 has ceased. Recent ground-water elevation measurements collected during periods of consistent pumping (i.e.,March 1997, October 1997 and July 1998) indicate the existence of substantial potentiometric head drawdown, thushydraulic containment, in the aquifer associated with the ground-water collection system.
Hydraulic containment of the dissolved-phase VOC plume, to the extent practical, is currently being provided by theexisting GWTS. This technology will be retained for further evaluation.
Physical Containment
Physical containment technologies include surficial capping used as a source control measure, and subsurfacecontainment systems used to physically limit further migration of the dissolved-phase ground-water plume.
________ _______________________ BLASLAND, SOUCK& LEE, INC. _____________________________engineers A scientists 4-4
iR,(H0568

Capping involves the construction of a low permeability cap (e.g., asphalt pavement, clay cap, geosynthetic cap) overpotential source areas. The cap would reduce or eliminate infiltration of precipitation through the site soils, whichwould reduce the leaching of constituents to ground-water. At the site, leaching of VOCs from the soils is consideredto be an insignificant contributor to ground-water impacts in comparison to the mass of VOCs in the saturated zonein the form of NAPL. Surficial capping is not expected to significantly reduce constituent migration to ground waterand will not be retained for further evaluation.
Subsurface containment involves the installation of a low permeability barrier (e.g., sheet piles, slurry wall, groutcurtains) to contain the dissolved-phase plume. Typically, physical subsurface containment technologies need to beimplemented in conjunction with hydraulic controls to mitigate the potentially outward flow of ground-water fromthe containment area. Because dissolved-phase contaminants are present within bedrock, a subsurface containmentsystem would have to be installed through the overburden and into the bedrock to be effective. The installation ofan in situ containment system into fractured bedrock would not be effective and may actually influence the furtherdownward migration of contaminants by creating additional bedrock fractures during installation. In-situ physicalcontainment will not be retained for further evaluation as a dissolved-phase ground-water remedy.
In-Situ Treatment
Biological Treatment
Biological treatment at the site would be performed using enhanced bioremediation. This technology involvesaltering subsurface environmental conditions to enhance microbial metabolism of select organic constituents.Enhancement would typically involve the introduction of oxygen and/or select nutrients through a series of injectionwells. An analysis of geochemical parameters presented in the RI indicates that biodegradation is occurring withinthe dissolved-phase plume. Treatability studies may be needed to determine how the existing biological activity canbe enhanced. For this technology to be effective, nutrients must be supplied to a large portion of the dissolved-phaseground-water plume as degradation of the predominant VOC (TCE) does not occur under anaerobic conditions.However, it is expected that the heterogenous and highly fractured nature of the subsurface materials, which providepreferential flow pathways, would inhibit the distribution of nutrients in ground water, and thus limit the effectivenessof this technology. This technology will not be retained for further evaluation.
Passive Treatment Walls
The use of this technology to address dissolved chlorinated compounds in ground water typically involves directingground-water flow through a passive treatment zone that uses reductive halogenation triggered by a metal catalyst(i.e., zero valent iron). The in-situ application of this technology may include a "funnel and gate" system, whichinvolves construction of* low permeability wall (the "funnel") to passively direct ground-water flow toward a highpermeability zone (the "gate") that contains zero valent iron. As water flows through the iron wall, contaminants aredegraded, sorbed, or precipitated, depending on the oxidation-reduction reaction that occurs when the chlorinatedsolvents contact the metallic iron in the absence of oxygen. The result is a non-toxic chloride and simplehydrocarbons, such as methane, ethane, and ethene, that are further reduced naturally through biodegradation.
Because impacted ground water has been observed to depth in excess of 400 feet within the fractured bedrock, thereaction wall would require installation into the bedrock to depths of greater than 400 feet in order to successfullyremediate the ground-water plume. Installation of a reaction wall into bedrock is not considered practical due to
BLASLAND, BOUCK & LEE. INC.____________________________________engineers A scientists 4-5
;K iiil)569

depth and the difficulty of installation and the variability of flow pathways within fractured bedrock. Thus, thistechnology will not be retained for further evaluation as an in situ treatment technology.
Injection ofOxidants
This technology employs chemical oxidation as a means of in-situ mass reduction of contaminants. Chemicaloxidation of contaminants may be achieved through injection of hydrogen peroxide and a catalyst formulation(metallic salts) into the affected media under controlled conditions. The oxidant and catalyst are injected at apredetermined rate to the contaminated region by an injection system designed to maximize dispersion and diffusionof the reagent through the soil and/or affected aquifer.
During the reaction, the organic compounds are mineralized to non-hazardous, naturally occurring substances, andultimately further degraded into carbon dioxide and water by subsequent reactions. The actual oxidation, or Fenton'sreaction chemistry, is driven by the formation of a free hydroxyl radical. The hydroxyl free radical (OH") is a verystrong oxidizer of organic compounds, and is produced as a result of the decomposition of hydrogen peroxide in thepresence of soluble metal ions (Fe4"2). Residual hydrogen peroxide, due to its unstable characteristics, rapidlydecomposes to water and oxygen in the subsurface environment. Soluble metallic ions (Fe*2) added to the aquiferin trace quantities are precipitated out during conversion to their reduced state (ferric iron).
Treatability studies would be necessary to determine the rate of reagent injection and injection pressure, andappropriate injection well placement. The former disposal wells may be an appropriate location for injection of thereagent and may allow the oxidants to follow the same preferential flow pathways that the injected waste materialsfollowed, however, additional wells may be necessary to provide an adequate area of influence. This technology maybe effective in partially reducing the contaminant mass and therefore will be retained for further evaluation.
Ex-Situ Treatment
Presented below are potentially applicable treatment technologies that may be used in conjunction with the ground-water extraction technology described above. Potentially applicable ex situ treatment technologies include thefollowing: ultraviolet oxidation (UvOx); conventional treatment; biological treatment; and zero valent iron. Eachof these technologies is described in more detail below.
Conventional Treatment
Conventional treatment technologies include flow equalization, metals pretreatment, sedimentation/filtration, oil/waterseparation, air stripping, and carbon adsorption. These technologies are common water treatment technologies thatwould be combined as needed to provide an effective treatment train.
Conventional treatment is currently utilized by the existing ground-water treatment system. The existing treatmenttrain consists of: an equalization tank; a liquid/solid separation unit and sludge handling equipment; an air stripper;liquid phase granular activated carbon polishing units; and a vapor phase regenerative off-gas treatment unit. Theexisting GWTS is operating at approximately 30 to 45 gpm and is effectively reducing dissolved-phase contaminantconcentrations (particularly TCE) to concentrations below PADEP-established discharge limitations.
Because conventional treatment is currently being used at the facility and is providing effective treatment of thedissolved-phase ground water, conventional treatment will be retained for further evaluation.
____________________________________BLASLAND, BOUCK & LEE, INC.____________________________________engineers A scientists 4-6
UvOx
UvOx uses ultraviolet light in conjunction with standard oxidants such as hydrogen peroxide and ozone to achievegreatly increased treatment performance over that obtained by hydrogen peroxide or ozone alone. Ultraviolet lightis used to split the hydrogen peroxide or ozone molecules and produce a highly reactive hydroxyl radical. Thehydroxyl radicals then quickly react with organic contaminants in the water to break down (i.e., mineralize) theorganics into carbon dioxide and water.
UvOx will be retained for further evaluation in the detailed analysis of alternatives.
Fenton 's Reagent Technology
Fenton's reagent technology is a chemical oxidation technology, similar to UvOx, although Fenton's technologygenerates hydroxyl radicals through the catalysis of hydrogen peroxide by iron. As with UvOx, the hydroxyl radicalsquickly react with organic contaminants in the water to mineralize the organics into carbon dioxide and water.Although Fenton's reagent technology is not widely used in commercial treatment systems, it may be an applicabletechnology for the site and will be retained for further evaluation.
Zero Valent Iron
As with its previously discussed use in connection with the in situ treatment wall, this technology involves directingground-water flow through a passive treatment zone which uses reductive halogenation triggered by a metal catalyst(i.e., zero valent iron). The ex situ application would allow extracted ground-water to percolate through an aboveground zero valent iron "treatment cell." As water flows through the metallic cell, contaminants are degraded, sorbed,or precipitated, depending on the oxidation-reduction reaction that occurs when the chlorinated solvents contact themetallic iron. The result is a non-toxic chloride and simple hydrocarbons, such as methane, ethane and ethene, thatare further reduced naturally through biodegradation. Because zero valent iron is proven effective at dechlorinatingVOCs, ex-situ zero valent iron technology will be retained for further evaluation.
4.4 Retained Technologies/Process Options
Based upon the results presented herein of the identification, evaluation, and screening of candidate treatmenttechnologies to be considered for implementation at the site, the following technologies were retained based on theirexpected effectiveness and technical implementability.
Dissolved-Phase Ground Water
No Action
• No Action
Institutional and/or Limited Control Measures
• Deed Restrictions• Monitoring• Ground-water Reclassification
____________________________________BLASLAND. BOUCK & LEE. INC.____________________________________engineers A scientists 4-7
,H.HI057 I

• Alternate Concentration Limits
Natural Attenuation
• Natural Attenuation
Hydraulic Containment
• Extraction Wells
In-Situ Treatment Technologies
• Injection of Oxidants
Ex-Situ Treatment Technologies
• Conventional Treatment• UvOx« Fenton's Reagent Technology• Zero Valent Iron
4.5 Trestability Testing
Dissolved-Phase Ground Water
Following the results of preliminary screening of remedial alternatives, treatability testing is often conducted forseveral ground-water remedial technologies being further considered. Treatability testing is not necessary at this sitedue to the current in-place treatment train of the GWTS that has been designed for site conditions, and has provento be successful.
BLASLAND, BOUCK & LEE. INC,engineers A scientists 4-8
5. Development and Screening of RemedialAlternatives
5.1 General
This section of the FS assembles the remedial technologies/process options retained during the preliminary screening(Section 4.3) into remedial alternatives which may be appropriate to attain the RAOs. The assembled remedialalternatives are screened based on effectiveness, implementability, and relative cost.
The effectiveness screening of each alternative considers its ability to protect human health and the environmentthrough a reduction in the toxicity, mobility, or volume of COCs. The implementability screening considers both thetechnical and administrative feasibility of construction, operation, and maintenance of the alternative relative to site-specific conditions. Technical feasibility includes the ability to successfully construct and operate the remedial actionto meet the objectives. Administrative feasibility includes the ability to successfully obtain inter-agency approval toperform the remedial action. The cost evaluation includes capital costs and annual operation and maintenance costs.
Alternatives with the most favorable composite evaluation of all screening factors are retained for furtherconsideration during the detailed analysis of alternatives. An attempt is made to preserve the range of treatment andcontainment technologies and alternatives initially developed.
5.2 Development of Remedial Alternatives
Dissolved-Phase Ground Water
In order to limit potential future human exposure through ingestion, direct contact, and inhalation, and to restoreground-water to the extent practicable, the alternatives listed below have been developed.
• No Action• Institutional Controls• Natural Attenuation• Ground-Water Extraction with Conventional Treatment• Ground-Water Extraction with UvOx Treatment• Ground-Water Extraction with Fenton's Reagent Treatment• In-Situ Injection of Oxidants and Ground-Water Extraction with Treatment
As discussed, these alternatives will be considered to address dissolved-phase ground water which includes site-related ground water present off-site. Non-site related ground water is not being considered for remediation as partof the FS. As detailed in the Tl Evaluation, remediation of the contaminant source (i.e., DNAPL) and dissolved-phase ground water \vithft the Tl Zone is technically impracticable, thus these alternatives will be considered in termsof their ability to provide an alternate remedial strategy including exposure control and contaminant plume (i.e.,dissolved-phase VOC plume) remediation.
BLASLAND, BOUCK & LEE, INC.engineers A scientists 5-1
5.3 Preliminary Screening of Ground-Water Remedial Alternatives
5.3.1 No Action
Technical Description
Under this alternative, operation of the existing ground-water treatment system would cease and no actions wouldbe taken to address the dissolved-phase ground-water. However, natural subsurface processes that reduce theconcentrations of chemical constituents would continue to take place. These attenuative processes include dilution,volatilization, biodegradation, adsorption and chemical reactions with subsurface materials. Geochemical parametersmeasured at the site indicate evidence for biodegradation of chlorinated organics at the site. Long-term monitoringof the ground-water VOC plume would be implemented, using the existing monitoring wells. Additional monitoringwells may be installed as necessary to provide adequate data on the effectiveness of the remedial action.
Effectiveness
Under the current exposure scenario there are no risks associated with human exposure to dissolved-phase ground-water. However, a potential risk exists with the hypothetical future exposure to on-site ground water. The no actionalternative will not actively reduce the risk associated with the future exposure to on-site ground water and wouldnot actively reduce the toxicity, mobility or volume of COCs in ground water.Implementabilitv
There are no technical or administrative limitations associated with this alternative.
Costs
There are no capital costs associated with this alternative. Operation and maintenance costs associated with thisalternative are expected to be low.
Screening Summary
This alternative will be retained for purposes of comparison in accordance with the requirements of the NCP.
5.3.2 Institutional Controls
Technical Description
Under this alternative a series of institutional controls would be instituted to limit potential future exposure to on-siteground water (i.e., exposure control). As with the no action alterative this alternative assumes that operation of theexisting ground water extraction and treatment system would cease. Institutional controls may include the following:implementing a deed restrictions to restrict ground-water usage at the site; reclassifying ground water usage at thesite from potable to non-potable; and instituting alternate concentration limits. As with the no action alternative, aground-water monitoring program would be implemented using the existing monitoring wells.
BLASLAND, BOUCK& LEE, INC.engineers A scientists 5-2
;R.UIU57U

Effectiveness
This alternative is expected to be effective in providing exposure control and thus addressing potential human healthrisks associated with exposure to on-site ground water. This alternative would not actively reduce the toxicity,mobility, or volume of COCs in ground water.
Implementabilitv
There are no technical limitations associated with this alternative. Ground-water reclassification and alternateconcentration limits would require approval by the PADEP and possibly the town. It is not anticipated that PADEPwould approve ground-water reclassification for this site because of the close proximity (<Vi mile) of water supplywell PSW-3. This would preclude the use of this alternative.
Costs
The costs associated with this alternative are expected to be low.
Screening Summary
Although this alternative would not actively address dissolved-phase COCs, this alternative would provide exposurecontrol which would reduce risks associated with future hypothetical human exposure to affected ground-water.Since institutional controls alone would not provide an effective alternative remedial strategy, institutional controlswill not be retained as an independent alternative for detailed evaluation. However, since institutional controls doprovide exposure control, which is necessary for an effective alternate remedial strategy, institutional controls willbe considered in conjunction with other remedial alternatives, as appropriate.
5.3.3 Natural Attenuation
Technical Description
Under this alternative, natural subsurface processes that reduce the concentration of chemical constituents would beallowed to continue to take place. As with the no action alternative, this alternative assumes that operation of theexisting ground-water extraction and treatment system would cease. Attenuative processes include dilution,volatilization, biodegradation, adsorption and chemical reactions with subsurface materials. To evaluate the progressof these processes a ground-water monitoring program consistent with USEPA's guidance "Use of Monitored NaturalAttenuation at Superfund, RCRA Corrective Action, and Underground Storage Tank Sites" (USEPA, November1997) would be developed and implemented. In addition, institutional actions such as deed restrictions would beincorporated to provide exposure control for on-site ground water. Since, potentially site-related off-site ground waterdoes not present a human health risk, deed restrictions for off-site areas are not needed.
Effectiveness
The ability of naturally occurring microbial communities to address VOC-impacted ground water is well documented.Also, the existing ground-water analytical data indicates that natural attenuation processes are on-going.
BLASLAND, BOUCK & LEE, INC.____________________________________engineers A scientists 5-3
.R.JU0575

Deed restrictions which limit the future usage of the site and underlying ground water are considered effective inlimiting exposure to impacted ground water.
Implementabilitv
Natural attenuation processes are on-going and there are no technical or administrative limitations. Implementationof the ground-water monitoring program would employ the existing ground-water monitoring wells.
Costs
Costs associated with this alternative include ground-water monitoring, evaluation, and reporting. The costs of thisalternative are expected to be low to moderate.
Screening Summary
Natural attenuation processes are on-going and will reduce the toxicity, mobility and volume of COCs. Incombination with institutional controls this alternative will provide exposure control and thus address the hypotheticalhuman health risk associated with on-site ground water. This alternative has been retained for further evaluation.
5.3.4 Ground-Water Extraction with Conventional Treatment
Technical Description
In addition to the institutional controls described above, this alternative would involve extracting water from a seriesof on-site extraction wells within the dissolved-phase plume, treating the extracted ground water on-site usingconventional treatment processes and discharging the treated ground water. As discussed above, ground-waterextraction and conventional treatment is currently being conducted on-site as part of the RRA. This alternativeassumes that the existing ground-water extraction and treatment system would continue to be operated.
The existing ground-water extraction system was designed and installed to extract ground water from four on-sitemonitoring wells (Well 3, Well 4, RW-3 and MW-4). Because ground-water extraction from MW-4 provedmarginally effective (flow rate of < 1 gpm), ground-water extraction from MW-4 has been eliminated. Thus, on-siteground-water extraction (flow rate of approximately 30 to 45 gpm) is being provided by submersible pumps placedwithin recovery wells Well 3, Well 4, and RW-3. Recent ground-water elevation data collected during operation ofthe GWTS indicates that the system is providing hydraulic containment of the dissolved-phase VOC plume presentat, and near, the site. However, due to the discontinued use of MW-4 and the highly fractured and heterogenousnature of the bedrock, which provides preferential flow pathways, the ground-water extraction may not providecomplete hydraulic containment of the on-site dissolved-phase VOC plume. Thus, this alternative includes a naturalattenuation component to address that portion of the dissolved-phase VOC plume which is not hydraulically containedor is located downgradient of the hydraulic containment (i.e., the severed portion of the dissolved-phase VOC plume).In the absence of non-site related VOC sources, natural attenuation processes are expected to ultimately restoreground-water quality within the severed portion of the dissolved-phase plume to achieve the RAOs. As discussedabove, RI data indicate that natural attenuation processes are on-going.
The existing ground-water treatment system uses conventional treatment processes including: flow equalization;liquid/solid separation; sludge handling; air stripping; liquid phase granular activated carbon adsorption; and a vapor
BLASLAND, BOUCK & LEE, INC _______________________j\Doc99\D644i\oii*oi46wpo--2/Ii« engineers A scientists 5-4
i l i . i i J O S 76

phase regenerative off-gas treatment unit. The ground-water treatment system has been in operation since August1996 and based on operational data, effectively treats ground water to meet current PADEP discharge limitations.
Effectiveness
The existing ground-water extraction and treatment system is effective in reducing the toxicity and volume of COCsin the extracted dissolved-phase ground-water. With this alternative, the dissolved-phase constituents downgradientof the hydraulic capture zone would be restored through natural attenuation. Ground-water extraction is an effectivehydraulic containment technology which would reduce the mobility of the on-site dissolved-phase plume.
Implementabilitv
The components of this alternative have been installed and are currently operational. Because there is a continualsource of VOCs to ground-water, a time frame for the operation and maintenance of the ground-water extraction andtreatment system cannot be predicted. Discharge of treated water requires substantive compliance with therequirements of a NPDES permit. This alternative is considered technically and administratively feasible.
Costs
The capital costs of this alternative,-including investigation, design and construction, have already been incurred andthus are not included in this cost estimate. Annual operation and maintenance costs as well as monitoring costs aremoderate.
Screening Summary
This technology is currently providing substantial hydraulic containment of the dissolved-phase ground water andis providing effective treatment of the extracted ground water. In the absence of non-site related VOC sources, thesevered portion of the dissolved-phase plume (i.e., ground water downgradient of the hydraulic control) willultimately be restored through natural attenuation. Institutional controls to be employed under this alternative wouldprovide exposure control. This alternative will provide exposure control and hydraulic containment of the dissolved-phase containment (to the extent practicable) which provides an effective alternative remedial strategy, thus, thisalternative will be retained for further evaluation.
5.3.5 Ground-Water Extraction with UvOx Treatment
Technical Description
In addition to the institutional controls described above, this alternative would involve extracting water from a seriesof on-site extraction wells within the dissolved-phase plume, treating the extracting ground water on-site using UvOxtreatment processes and discharging the treated ground water. As discussed above, ground-water extraction andconventional treatment is currently being operated on-site as part of the RRA. This alternative assumes that theexisting ground-water extraction system would continue to be operated and that the primary treatment componentsof the conventional treatment system (i.e., the air stripper and carbon adsorption units) would be replaced with aUvOx treatment system. The elimination of the air stripper would also allow the elimination of vapor phase treatmentfrom the existing treatment system. The pre-treatment components of the existing system (i.e., equalization,solid/liquid separation, and sludge handling) would be used in conjunction with the UvOx treatment system. As with
____________________________________BLA5LAND, BOUCK & LEE. INC. _________________________________j\Docwow«noiiTOn<>wro--2/iw» engineers A scientists 5-5
MR.100577
Screening Summary
This technology is expected to provide hydraulic containment and, in the absence of other non-site-relatedcontaminant sources, ultimately restore the severed portion of the dissolved-phase VOC plume through naturalattenuation processes. Because of the long-term operation and maintenance that would be required due to thepresence of an un-remediated source the cost of Fenton's Reagent treatment is expected to be significantly higher thanconventional treatment without additional risk reduction. Because this alternative would not provide additional riskreduction relative to existing ground-water extraction with conventional treatment, this alternative will not be retainedfor further evaluation.
5.3.7 In-Situ Injection of Oxidants and Ground-Water Extraction with Treatment
Technical Description
In addition to the institutional controls described above, this alternative would involve installing an oxidant/catalystinjection system and injection wells, as necessary, to chemically oxidize contaminants of the dissolved phase plumein-situ, and downgradient of the Tl zone. In conjunction with this treatment technique, ground-water would continueto be extracted from a series of on-site extraction wells to hydraulically contain the source area and prevent furthermigration of contaminants downgradient of the site. The extracted ground-water would be treated ex-situ as discussedone of the previously presented alternatives.
This technology would require treatability and pilot testing to determine the delivery rate of hydrogen peroxiderequired to oxidize the contaminants, and the appropriate injection pressure to ensure that the reagents are widelydispersed in the subsurface. The former disposal wells may be an appropriate location for injection of the reagent,as these wells were the initial point of contaminants entering the subsurface. However, the close proximity of theGWTS extraction wells to the disposal wells will influence the ground-water flow in this vicinity and would createpreferential flow pathways which would short-circuit the distribution of reagent in ground-water. Therefore,additional wells may be required to adequately impact the area of contamination outside the influence of theextraction wells.
As with the ground-water extraction and conventional treatment alternative, this alternative relies on naturalattenuation to address the severed portion of the dissolved-phase plume. In the absence of non-site related VOCsources, natural attenuation processes are expected to ultimately restore the severed portion of the dissolved-phaseplume. RI data indicate that natural attenuation processes are on-going. A ground-water monitoring program whichutilized select existing wells would be developed and implemented.
Effectiveness —
This technology may result in partial mass reduction of contaminants at the site, however, it would net reduce thetechnical impracticability of restoring ground-water quality. The use of injected oxidants is considered effective inreducing the toxicity and volume of COCs in the dissolved-phase ground-water. However, on-going naturalattenuative processes would also accomplish this goal. Furthermore, because it will be necessary to continue tooperate the ground-water extraction system to maintain hydraulic containment of the source area, preferentialpathways for ground-water flow in the vicinity of these wells is expected. This will reduce the ability of the injectedoxidants to effectively contact all portions of the dissolved-phase ground-water plume and residual DNAPL. Theinstallation of additional injection wells may assist in improving the area of influence.
__________________________________BLASLAND. 6OUCK& LEE, INC__________________________________i-*9WPO--2/iB)W engineers A scientists 5_8
..R tuO580

Implementabilitv
This alternative could be implemented using standard techniques and readily available equipment. A treatability andpilot test would be required prior to design of the injection system. The time frame for aquifer restorationdowngradient of the Tl zone may be better understood following completion of the treatability study for the oxidantinjection system. Because there is a continual source of VOCs to ground-water, a time frame for the operation andmaintenance of the ground-water extraction and treatment system cannot be predicted. Discharge of treated waterwould require substantive compliance with the requirements of a NPDES permit. This technology is consideredtechnically and administratively feasible.
Cost
The estimated capital cost of this alternative include pre-design investigations, design, and oxidant injection systeminstallation. Operation and maintenance costs will include system operation and ground-water monitoring. Incomparison to the existing ground-water extraction and conventional treatment system the costs associated with thisalternative are expected to be moderate to high.
Screening Summary
This technology is expected to provide hydraulic containment and, in the absence of other non-site-relatedcontaminant sources, accelerate the restoration of the severed portion of the dissolved-phase plume by oxidation ofcontaminants. Because of the long-term operation and maintenance that would be required due to the presence ofan un-remediated source, and the cost of installing and operating an additional remedial technology, the cost ofimplementing an oxidant injection system is expected to be significantly higher than the cost for ground-waterextraction and conventional treatment alone. Because this alternative would not provide additional risk reductionrelative to existing ground-water extraction with conventional treatment, this alternative will not be retained forfurther evaluation.
5.4 Preliminary Screening Results
Seven alternatives were identified to address dissolved-phase ground-water impacts. Those remedial alternatives thatwere identified as potentially applicable to meet the RAOs underwent a preliminary screening to identify thosealternatives that warrant a more detailed analysis. The alternatives were screened based on the anticipatedeffectiveness, implementability and cost with respect to site conditions. Based on the results of the preliminaryscreening process the remedial alternatives listed below have been retained for detailed evaluation.
Dissolved-Phase Ground Water
• Alternative GW-1: No Action• Alternative GW-2: Natural Attenuation• Alternative GW-3: Ground-Water Extraction with Conventional Treatment
BLASLAND, BOUCK 8. LEE. INC.engineers A scientists 5-9
.R < 1)058 I

6. Detailed Analysis of Alternatives
6.1 General
This section of the FS presents a detailed analysis of those remedial alternatives that were selected following thepreliminary screening presented in Section 3.0. The purpose of this detailed analysis is to assess each alternativerelative to certain evaluation criteria, so that a comparison of each alternative's performance can be made to supportthe selection of a preferred remedy for the site. The remedial alternatives under each component that remainedfollowing the screening in Section 3.0 and are subject to detailed analysis in this section are as follows:
• Alternative GW-1: No Action• Alternative GW-2: Natural Attenuation• Alternative GW-3: Ground-Water Extraction with Conventional Treatment
The detailed analysis has been prepared in accordance with the NCP. The analysis consists of a detailed technicaldescription of each alternative, followed by an assessment of each of the remedial alternatives against the followingseven NCP evaluation criteria as described in 40 CFR 300.43(e)(9)(iii):
• Overall Protection of Human Health and the Environment;• Compliance with ARARs;• Long-Term Effectiveness and Permanence;• Reduction of Toxicity, Mobility, or Volume Through Treatment;• Short-Term Effectiveness;• Implementability; and• Cost
Two additional NCP evaluation criteria, State Acceptance and Community Acceptance, will be factored into theanalysis of alternatives by the USEPA following its review and comment on the FS.
6.2 Description of Evaluation Criteria
Technical Description
The technical description presents a discussion of the characteristics of the remedial alternative, including any uniqueengineering aspects of the physical components associated with the alternative.
Overall Protection of Human Health and the Environment
This evaluation criterion assesses whether the alternative provides adequate protection of human health and theenvironment. The overall evaluation relies on the assessments conducted under other evaluation criteria includinglong-term effectiveness and permanence, short-term effectiveness, and compliance with ARARs.
Compliance with ARARs
This evaluation criterion evaluates the ability of the remedial alternative to comply with ARARs or to provide groundsfor invoking one of the ARAR waivers. The following items are considered during the evaluation of the remedialalternative:
SLASLAND, BOUCK & LEE. INC-____________________________________engineers A scientists 6-1
• compliance with chemical-specific ARARs;• compliance with location-specific ARARs; and• compliance with action-specific ARARs;
This evaluation also considers whether or not the remedial alternative would be in compliance with TBCs, includingappropriate criteria, advisories, and guidance.
Long-Term Effectiveness and Permanence
The evaluation of each remedial alternative relative to its long-term effectiveness and permanence is made byconsidering the risks that may remain following completion of the remedial alternative. The following factors areassessed in the evaluation of the alternative's long-term effectiveness and permanence:
• magnitude of residual risk remaining from untreated waste or treatment residuals at the completion of the remedialalternative; and
• adequacy and reliability of controls (if any) that will be used to manage treatment residuals and untreated wastes.
Reduction of Contaminant Toxicitv. Mobility, or Volume Through Treatment
This evaluation criterion addresses the degree to which remedial actions will permanently and significantly reducecontaminant toxicity, mobility, and/or volume through removal and/or treatment of the chemical constituents in sitemedia. The evaluation focuses on the following factors:
• the treatment process and materials to be treated;• the degree of expected reduction in toxicity, mobility, and/or volume of waste due to treatment;• the type and quantity of treatment residuals that will remain after treatment;• the amount of hazardous substances, pollutants, or contaminants that will be destroyed or treated;• the degree to which the treatment is irreversible; and• the degree to which treatment reduces inherent hazards posed by principal threats at the site.
Short-Term Effectiveness
The short-term effectiveness of each remedial alternative is evaluated relative to its effect on human health and theenvironment during implementation. The evaluation of the alternative with respect to short-term effectivenessconsiders the following:
• Short-term exposureslhat might be posed to the community during implementation of the alternative;
• Potential impacts to on-site workers during remedial action, and the effectiveness and reliability of protectivemeasures;
• Potential environmental impacts of the remedial action and the effectiveness and reliability of mitigative measuresto be used during implementation; and
• Time until protection is achieved.
BLASLAND, BOUCK & LEE, INC. ________________________________engineers A scientists 6-2
.RUKI583
Implementability
This evaluation criterion assesses the ease or difficulty of implementing the remedial alternatives. The followingfactors are considered during the implementability evaluation.
Technical Feasibility - This factor includes assessment of the technical difficulties and unknowns associated withthe construction and operation of the technology, the reliability of the technology, the ease of undertakingadditional remedial actions, and the ability to monitor remedy effectiveness.
Administrative Feasibility - This factor includes activities needed to coordinate with other offices and agencies,as well as the ability and time required to obtain any necessary approval and permits from other agencies.
Availability of Services and Materials - This factor includes the availability of adequate off-site treatment, storagecapacity, and disposal capacity and services in addition to the availability of prospective technologies, necessaryequipment and specialists, and provisions for necessary additional resources.
Cost
This criterion refers to the total cost to implement the remedial alternative. The total cost of each alternativerepresents the sum of direct capital costs (materials, equipment, and labor), indirect capital costs (engineering,licenses or permits, and the contingency allowances), and operation and maintenance (O&M) costs. O&M mayinclude operating labor, energy, chemicals, and sampling and analysis. These costs are estimated with expectedaccuracies of-30 to +50 percent in accordance with USEPA's "Guidance for Conducting Remedial Investigation andFeasibility Studies Under CERCLA" (USEPA, October 1988). The cost estimates are developed to allow thecomparison of the remedial alternatives. Present worth costs are calculated for alternatives expected to last more thantwo years. In accordance with USEPA guidance, a 5 percent discount rate (before taxes and after inflation) was usedto determine the present worth factor.
6.3 Detailed Analysis of Ground-Water Remedial Alternatives
6.3.1 Alternative GW-1 - No Action
Technical Description
Under this alternative the operation of the existing ground-water extraction and treatment system would cease andthe site would be allowed to remain in its current condition. No actions would be taken to address the dissolved-phase ground-water, however, natural subsurface processes that reduce the concentrations of chemical constituentswould continue to take place. These attenuative processes include dilution, volatilization, biodegradation, adsorption,and chemical reactions with subsurface materials.
Long-term monitoring of the ground-water VOC plume would be implemented, using the existing monitoring wells.Sampling would be conducted annually to monitor the contaminant plume to determine if constituent concentrationsare increasing.
BLASLAND, 6OUCK& LEE, INC.j \DocwvDM6iwiKWi 4« wo-I/I s« engineers A scientists 6-3

Overall Protection of Human Health and the Environment
Under the current exposure scenario no risks are associated with human exposure to ground-water. However, apotential risk exists with the hypothetical future exposure to on-site ground water. The no action alternative wouldnot actively reduce the risk associated with the future exposure scenario. This alternative would not achieve theground-water RAOs of limiting potential future human exposure and restoring ground-water to the extent practicable,nor would it achieve ARARs.
Compliance with ARARS
Chemical-Specific ARARs
Chemical-specific ARARs for this site include Federal Drinking Water Criteria, and Pennsylvania Act 2, Chapter250, Land Recycling Program standards for ground-water. Implementation of this alternative would not achieve theobjectives of these regulations. However, attainment of these objectives would be expected over time as a result ofnatural biodegradative processes.
Location-Specific ARARs
No location-specific ARARs would be associate with the no-action alternative.
Action-Specific ARARs
Action-specific ARARs for this alternative would apply to OSHA regulations for work performed at the site duringmonitoring and maintenance activities. These regulations would include general industry standards (29 CFR 1910),safety and health standards (29 CFR 1926), and record keeping, reporting, and related regulations (29 CFR 1904).Compliance with the OSHA guidelines would be achieved by following a USEPA-approved RemedialDesign/Remedial Action (RD/RA) Work Plan and site-specific Health and Safety Plan (HASP).-
Long-Term Effectiveness and Permanence
Potential risks would be expected to be mitigated over time as a result of natural attenuation processes. COCs wouldcontinue to desorb from the NAPL in the ground water within the fractured bedrock over time, until constituentspresent as NAPL as well as constituents diffused into the matrix are naturally degraded. Ground-water monitoringwould be conducted regularly to make sure that constituent concentrations were not increasing.
Reduction of Toxicitv. Mobility, or Volume Through Treatment
The no action alternative would not actively reduce the toxicity, mobility, or volume of the chemical constituentspresent the site, although the toxicity, mobility, and volume of constituents in the dissolved-phase ground-waterwould be reduced over time through natural attenuation. Ongoing natural attenuation processes would be expectedto reduce the toxicity and volume of COCs in the leading edge of the ground-water plume (i.e., areas farthest fromthe source).
BLASLAND. BOUCK & LEE, INC.engineers A scientists 6-4
iff !II(1585
Short-Term Effectiveness
No remedial actions would be initiated under this alternative; therefore no short-term risks would be posed to thecommunity or on-site workers during implementation. There would also be no short-term environmental impactsassociated with this alternative. Potential exposures to on-site workers conducting monitoring activities would bemitigated by the use of personal protective equipment (PPE), as specified in a site-specific HASP. No short-termenvironmental impacts would be associated with this alternative.
Implementabilitv
There would be no technical or administrative limitations associated with this alternative. It would be technicallyfeasible and could be readily implemented at the site.
Cost
There would be no capital costs associated with this alternative. The estimated O&M cost associated with an assumedmonitoring period of 30 years is approximately $740,000. The actual duration of long-term monitoring would bedetermined based on the results of periodic (five year) review of monitoring results.
6.3.2 Alternative GW-2 - Natural Attenuation
Technical Description
Under this alternative, operation of the existing ground-water extraction and treatment system would cease and on-going natural subsurface processes that reduce the concentration of chemical constituents would continue to takeplace. These attenuative processes include dilution, volatilization, biodegradation, adsorption and chemical reactionswith subsurface materials. The potential for on-going biodegradation and abiotic chemical reactions within thesubsurface materials was investigated and evaluated as part of the RI. These biodegradative and chemical reactionsinclude electron transfer with consequent molecular transformation to reduce toxicity.
The RI data indicate the presence of relatively diverse microbial population whose biomass varies across the site incorrelation with the availability of VOCs which are used as the substrate (food source) for metabolic activity. Themeasurement of a number of geochemical parameters (e.g., dissolved oxygen, nitrate, sulfate, etc.) at locationsupgradient, on-site and downgradient and the presence and distribution of electron acceptors and metabolicbyproducts in ground water near and downgradient of the source area within the dissolved-phase plume suggest thata number of redox reactions are occurring, including: aerobic respiration; denitrification; sulfate reduction; andmethanogenesis. Data from ground-water samples collected downgradient of the source area indicate that theseprocesses are reducing PCE and TCE to the "daughter" products DCE and VC. The specific natural attenuationprocesses are detailed in the RI Report.
The natural attenuation alternative will involve the routine monitoring pursuant to current USEPA guidance (USEPA,November 1997) of constituent concentrations as well as bioindicator parameters, to allow an assessment of theprogress of the degradation processes. Parameters which will be included in the monitoring program include VOCs,dissolved oxygen, nitrate, iron, sulfate, methane, ethane, ethene, alkalinity, redox potential, pH, temperature,conductivity, chloride, and total organic carbon.
______________________________ BLASLAND. 6OUCK & LEE. INC. ____________________________j\Doc9W5646i\oiiwi**wPD.-2/iwi engineers A scientists 6-5
ifMuii586
Institutional controls, comprised of deed restrictions to restrict the future usage of the site and use of site groundwater, would be employed under this alternative to provide exposure control. As required by the NCP for sites whereimpacts have not been permanently remediated, five-year site reviews would be performed to evaluate protection ofhuman health and the environment.
Effectiveness
The ability of naturally occurring microbial communities to address VOC impacted ground water is well documented.Also, the existing ground-water analytical data indicates that natural attenuation processes are on-going.
Deed restrictions which limit the future usage of the site and underlying ground water are considered effectiveproviding exposure control to impacted ground water.
Implementabilitv
Natural attenuation processes are on-going and there are no technical or administrative limitations. Implementationof the ground-water monitoring program would employ the existing ground-water monitoring wells.
Overall Protection of Human Health and the Environment
Under the current exposure scenario no risks are associated with human exposure to dissolved-phase ground-water.However, a potential risk exists with the hypothetical future exposure to the dissolved-phase ground water presenton-site. The natural attenuation alternative would address risk associated with the future exposure scenario by theuse of institutional controls which will restrict site and ground-water usage. Natural attenuation processes willaddress dissolved-phase constituents at the leading edge of the dissolved-phase plume (i.e., farthest from the sourcearea), however due to the continued presence of an unrecoverable VOC source (e.g, DNAPL) the time frame torestore the aquifer cannot be estimated.
Compliance with ARARS
Chemical-Specific ARARs
Chemical-specific ARARs for this site include Federal Drinking Water Criteria, and Pennsylvania Act 2, Chapter250 Land Recycling Program standards for ground-water. Implementation of this alternative would not achieve theobjectives of these regulations. However, attainment of these objectives would be expected over time as a result ofnatural biodegradative processes.
Location-Specific ARARs
No location-specific ARARs would be associate with the natural attenuation alternative.
Action-Specific ARARs
Action-specific ARARs for this alternative would include Pennsylvania Act 2, Chapter 250, Administration of theLand Recycling Program, Section 250.204(g) monitoring and reporting requirements for natural attenuation; andOSHA regulations for work performed at the site during monitoring and maintenance activities. The OSHA
_______________________________ BLASLAND. BOUCK & LEE, INC.____________________________________engineers A scientists 64
i fU ii058 7

regulations would include general industry standards (29 CFR 1910), safety and health standards (29 CFR 1926),and record keeping, reporting, and related regulations (29 CFR 1904). Compliance with the OSHA guidelines wouldbe achieved by following a USEPA-approved RD/RA work plan and site-specific HASP.
Long-Term Effectiveness and Permanence
Potential risks would be expected to be mitigated over time as a result of natural attenuation processes. COCs wouldcontinue to desorb from the NAPL in the probable NAPL zone over time, until constituents present as NAPL as wellas constituents which are diffused into the matrix are naturally degraded. Ground-water monitoring would beconducted regularly to make sure that constituent concentrations were not increasing.
Reduction of Toxicitv. Mobility, or Volume Through Treatment
The natural attenuation alternative would not actively reduce the toxicity, mobility, or volume of the chemicalconstituents present the site, although the toxicity, mobility, and volume of constituents in the dissolved-phaseground-water would be reduced over time through natural attenuation. Ongoing natural attenuation processes wouldbe expected to reduce the toxicity and volume of COCs in the leading edge of the ground-water plume (i.e., areasfarthest from the source).
Short-Term Effectiveness
No remedial actions would be initiated under this alternative; therefore no short-term risks would be posed to thecommunity or on-site workers during implementation. There would also be no short-term environmental impactsassociated with this alternative. Potential exposures to on-site workers conducting monitoring activities would bemitigated by the use of PPE, as specified in a site-specific HASP. No short-term environmental impacts would beassociated with this alternative.
Implementabilitv
There would be no technical or administrative limitations associated with this alternative. It would be technicallyfeasible and could be readily implemented at the site.
Cost
The estimated capital and O&M costs associated with an assumed monitoring period of 30 years is $1,410,000. Theduration of long-term monitoring would be determined based on the results of periodic (five year) review ofmonitoring results. —
6.3.3 Alternative GW-3 - Ground-Water Extraction with Conventional Treatment
Technical Description
In addition to the institutional controls described above, this alternative would involve extracting water from a seriesof on-site extraction wells within the dissolved-phase plume, treating the extracted ground water on-site using existingconventional treatment processes and discharging the treated ground water. As discussed above, ground-waterextraction and conventional treatment is currently being operated on-site as part of the RRA. This alternative assumes
____________________________________BLASLAND. 6OUCK & LEE. INC.____________________________________i \ooc99\0646i*! 190144 WFD..WI,W engineers A scientists 6-7
.K <i.-U588

that the existing GWTS would continue to be operated. This alternative also includes a natural attenuationcomponent to address the dissolved-phase plume hydraulically downgradient of the site, beyond the capture zone ofthe GWTS.
The RRA GWTS was designed and installed to extract ground water from four on-site wells (Well 3, Well 4, RW-3and MW-4). Because ground-water extraction from MW-4 proved marginally effective (flow rate of < 1 gpm), areplacement recovery well with an appropriate length of screen will be installed and added to the site GWTS, as partof the RD/RA activities (the specific location depth and design of the well will be developed with USEPA approval).Thus, site ground-water extraction (flow rate of approximately 30 to 45 gpm) will be provided by submersible pumpsplaced within Well 3, Well 4, RW-3, and MW-4 (replacement). Recent ground-water elevation data collected duringoperation of the GWTS indicates that the system is providing substantial potentiometric drawdown and thus,hydraulic containment (Figures 6 through 8).
As discussed with USEPA, this alternative also includes the installation and sampling of an additional monitoringwell to supplement the existing ground-water monitoring network in the vicinity of the linear ground-depressionlocated to the north-northwest of the site. This feature may provide a preferential flow pathway for the migration ofground water.
The existing ground-water treatment system and the area of hydraulic containment will be better understood followingthe installation of the additional monitoring well and the replacement of pumping well MW-4 as part of the remedialaction for the site. Upon completion of these wells, the system would be reevaluated and modified, if necessary, toensure that the required hydraulic containment would be achieved. Long term monitoring would be performed toensure that containment is maintained, and to provide the necessary data to support completion of the remedial actionand closure of the site.
The existing GWTS using conventional treatment processes including: flow equalization; liquid/solid separation;sludge handling; air stripping; liquid phase granular activated carbon adsorption; and a vapor phase granular activatedcarbon adsorption for off-gas treatment. The ground-water treatment system has been in operation since August 1996and based on operational data, effectively treats ground water to meet PADEP-established discharge limitations. Theoperational data indicate that VOC levels (as indicated by TCE concentrations) in the un-treated ground water(measured at the treatment plant influent) have decreased significantly since system startup. It is expected that theTCE influent concentration will continue to decrease over time as the high concentration portion of the dissolved-phase plume (that portion of the plume nearest the source) is captured and treated. TCE concentrations would beexpected to decrease to a level at which the dissolved-phase plume concentrations equal the matrix diffusionconcentrations at the NAPL zone. At which time the influent VOC concentration becomes asymptotic with time,operation of the ground-water extraction and treat system should be re-evaluated to determine whether hydrauliccontainment of the on-site dissolved-phase plume is providing a beneficial use and determine if an alternate remedy(e.g., natural attenuation) may be appropriate for the un-remediated dissolved-phase VOC plume.
This alternative relies on natural attenuation to address that portion of the dissolved-phase plume which is presentoutside (downgradient) of the hydraulic containment. As discussed above, data collected and evaluated as part ofthe RI indicate that natural attenuation is ongoing and is capable of complete mineralization of the dissolved-phaseVOCs. In the absence of non-site related VOC sources, natural attenuation processes are expected to ultimatelyrestore the downgradient dissolved-phase plume outside of the hydraulic containment.
BLASLAND. BOUCK & LEE, INC.___________________________________engineers A scientists 6-8
in 1111)589

A ground-water monitoring program which utilized select on-site monitoring wells would be developed and institutedto monitor the hydraulic containment and constituent concentrations.
Effectiveness
The existing ground-water extraction and treatment system is effective in reducing the toxicity and volume of COCsin the extracted dissolved-phase ground water. With this alternative, the dissolved-phase constituents downgradientof the hydraulic capture zone would be restored through natural attenuation. Ground-water extraction is an effectivehydraulic containment technology which would reduce the mobility of the on-site dissolved-phase ground-water VOCplume.
Implementabilitv
This alternative is installed and operational at the site. Because there is a continual source of VOCs to ground-water,a time frame for the operation and maintenance of the ground-water extraction and treatment system cannot bepredicted. Discharge of treated water requires substantive compliance with the requirements of a NPDES permit.This alternative is considered technically and administratively feasible.
Overall Protection of Human Health and the Environment
Under the current exposure scenario no risks are associated with human exposure to ground water. However, apotential risk exists with the hypothetical future exposure to on-site ground water. The ground-water extraction andconventional treatment alternative would address risk associated with on-site ground water by the use of institutionalcontrols which will restrict site and ground-water usage. In the absence of non-site related VOC sources the aquiferdowngradient of the hydraulic containment is expected to be restored.
Compliance with ARARs
Chemical-Specific ARARs
Chemical-specific ARARs for this site include Federal Drinking Water Standards (40 CFR Part 141), andPennsylvania Act 2, Chapter 250, Land Recycling Program standards for ground-water. In the absence of non-siterelated VOC sources, implementation of this alternative would achieve the objectives of these regulations over timethrough natural attenuation of the dissolved-phase plume downgradient of the hydraulic containment.
Location-Specific ARARs
The site is not located within a flood plain, wetland or other environmentally sensitive areas, thus, location specificARARs are limited to local zoning ordinances.
Action-Specific ARARs
Since the ground-water extraction system is constructed and operational, action-specific ARARs for this alternativewould include Federal Clean Water Standards (40 CFR Parts 122 and 131); and the Pennsylvania 25PA CodeChapters 93 and 16 (Water Quality Standards) and Chapter 92 (NPDES discharge limits and monitoringrequirements); and OSHA regulations for work performed at the site during monitoring and maintenance activities.
____________________________________BLASLAND, BOUCK& LEE, INC.____________________________________engineers A scientists 6-9
(R.JU0590

The OSHA regulations would include general industry standards (29 CFR 1910), safety and health standards (29 CFR1926), and record keeping, reporting, and related regulations (29 CFR 1904). RCRA requirements for transportation,treatment and disposal of treatment system residuals would also apply. Compliance with the OSHA guidelines wouldbe achieved by following a USEPA-approved RD/RA Work Plan and site-specific HASP.
Long-Term Effectiveness and Permanence
This alternative would be expected to provide hydraulic containment of the on-site dissolved-phase plume whichwould allow the dissolved-phase plume downgradient of the hydraulic containment to be restored through naturalattenuation. In addition, institutional controls would be employed to restrict future site and ground-water usage andthus provide exposure control for on-site ground water. Extraction, treatment, and discharge of affected on-sitedissolved-phase ground-water would reduce or prevent off-site migration of impacted ground-water, thus minimizingrisks to future potential users of potable ground-water. However, COCs would continue to desorb from the DNAPLin the Tl zone over time, resulting in constituent concentration "rebound" upon the cessation of pumping. Thiscondition would be present until constituents diffused into the matrix are naturally degraded, a process that wouldoccur over time (even in the absence of pumping). Ground-water monitoring would be conducted regularly to makesure that constituent concentrations were not increasing.
Reduction of Toxicitv. Mobility, or Volume Through Treatment
The ground-extraction and treatment system will actively reduce the toxicity, mobility and volume of on-sitedissolved-phase constituents. Further, natural attenuation processes will reduce the toxicity, mobility and volumeof dissolved-phase constituent downgradient of the hydraulic containment.
Short-Term Effectiveness
Since the ground-water extraction and treatment system is in-place and operational and no additional remedial actionswould be initiated under this alternative, no short-term risks would be posed to the community or on-site workersduring implementation. There would also be no short-term environmental impacts associated with this alternative.Potential exposures to on-site workers responsible for operation, maintenance and monitoring of the existing systemwould be mitigated by the use of PPE, as specified in a site-specific HASP. No short-term environmental impactswould be associated with this alternative.
Implementabilitv
There would be no technical or administrative limitations associated with this alternative. It would be technicallyfeasible and could be readily implemented at the site.
Costs
The estimated capital and O&M costs of this alternative is $4,240,000. Because the ground-water extraction andtreatment system is in-place and operational, the capital costs associated with this alternative are limited to theinstallation of a replacement extraction well and a limited PDI to further evaluate the location of a linear ground-waterdepression which provides a preferential flow pathway.
BLASLAND. BOUCK& LEE, INC.____________________________________i«oi4*wpD.-2/u/M engineers A scientists 6-10
<R.ni059 I

7. Comparative Analysis of Alternatives
7.1 General
This section presents a comparative analysis of each remedial alternative, using the seven evaluation criteria identifiedin Section 4.0. The comparative analysis identifies the advantages and disadvantages of each alternative relative toeach other to highlight the differences. The results of the comparative analysis will be used as the basis for selectingremedial alternatives to address site ground-water impacts.
7.2 Ground-Water Remedial Alternatives
Overall Protection of Human Health and the Environment
Under current exposure scenarios, ground water does «et~pi=esen a rick to human health and the environment,however, on site ground water dogs present a potential human exposure risk.
Alternatives GW-3 ranks highest of the three ground-water treatment alternatives in terms of overall protection ofhuman health and the environment. Alternative GW-3 consists of institutional controls, hydraulic containment andtreatment of the on-site dissolved-phase plume and natural attenuation of the downgradient plume. Alternative GW-3will provide protection of human health by restricting future site and ground-water usage thereby providing exposurecontrol. This alternative will also eliminate, to the extent practicable, the continued off-site discharge of thedissolved-phase plume thus allowing the downgradient plume to be remediated via natural attenuation.
Alternative GW-2 will also provide protection of human health by using institutional controls to provide exposurecontrol. Under this alternative hydraulic containment would not be provided thus dissolved-phase ground waterwould be allowed to continue to migrate off-site. Although, natural attenuation processes would continue tomineralize constituents the time frame to restore the aquifer could not be predicted due to the continue discharge ofdissolved-phase constituents from the site.
Alternative GW-1, no action, ranks lowest in terms of overall protection of human health and the environment sinceit does not provide exposure control for the potential future human exposure to ground water. Under the no actionalternative on-going natural attenuation processes would continue to mineralize dissolved-phase constituents.
Compliance with ARARs
Alternatives GW-1, GW-2 and GW-3 would achieve ARARs for the dissolved-phase plume. Since GW-3 includeshydraulic control, chemical-specific ARARs for the dissolved-phase plume are expected to be achieved more quickly.
Long-Term Effectivene« and Permanence
Each alternative relies on natural attenuation to address the dissolved-phase plume. Natural attenuation is an effectiveand permanent remedy. However, Alternative GW-3 control the continued discharge of VOCs to the downgradientaquifer, thus may be consider a more effective remedy.
Reduction of Toxicitv. Mobility, or Volume Through Treatment
Alternative GW-3 ranks the highest in terms of reduction of toxicity, mobility, and/or volume through treatment sinceit addresses containment and treatment of the on-site dissolved-phase ground water and treatment of the downgradient
•'____________________________BLASLAND, 6OUCK& LEE, INC_________________________________engineers A scientists 7-1
:iR,ii)H59?
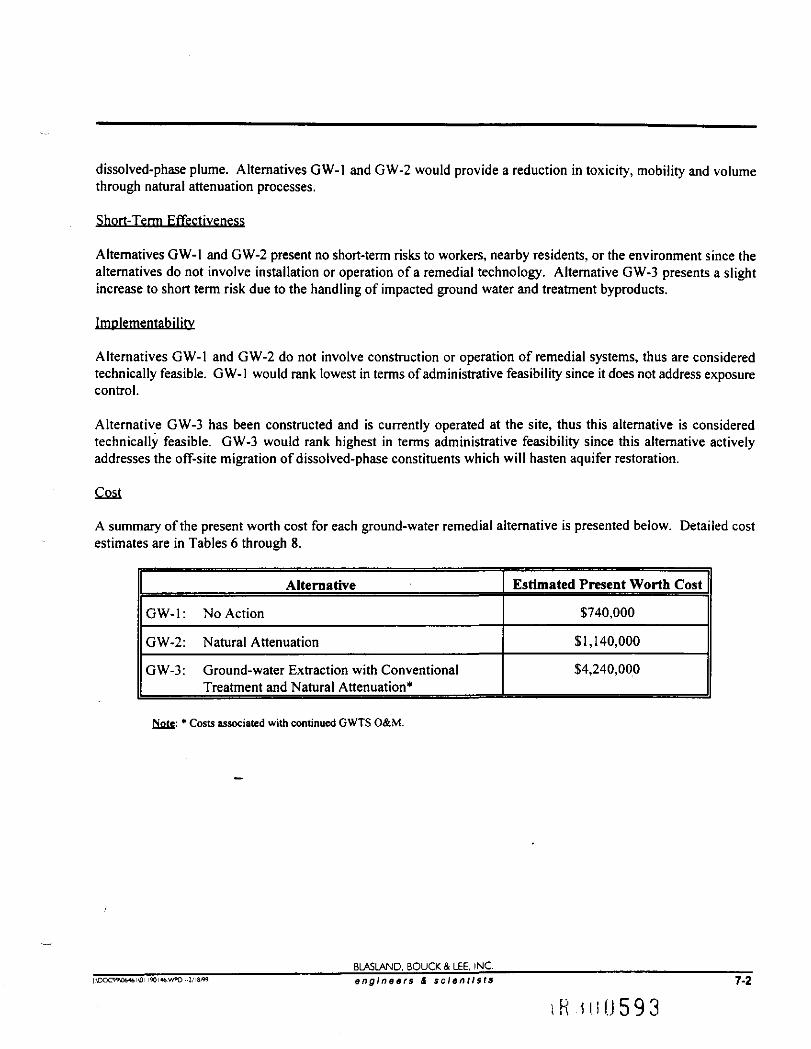
dissolved-phase plume. Alternatives GW-1 and GW-2 would provide a reduction in toxicity, mobility and volumethrough natural attenuation processes.
Short-Term Effectiveness
Alternatives GW-1 and GW-2 present no short-term risks to workers, nearby residents, or the environment since thealternatives do not involve installation or operation of a remedial technology. Alternative GW-3 presents a slightincrease to short term risk due to the handling of impacted ground water and treatment byproducts.
Implementabilitv
Alternatives GW-1 and GW-2 do not involve construction or operation of remedial systems, thus are consideredtechnically feasible. GW-1 would rank lowest in terms of administrative feasibility since it does not address exposurecontrol.
Alternative GW-3 has been constructed and is currently operated at the site, thus this alternative is consideredtechnically feasible. GW-3 would rank highest in terms administrative feasibility since this alternative activelyaddresses the off-site migration of dissolved-phase constituents which will hasten aquifer restoration.
Cost
A summary of the present worth cost for each ground-water remedial alternative is presented below. Detailed costestimates are in Tables 6 through 8.
Alternative
GW-1:
GW-2:
GW-3:
No Action
Natural Attenuation
Ground-water Extraction with ConventionalTreatment and Natural Attenuation*
Estimated Present Worth Cost
$740,000
$1,140,000
$4,240,000
Noj{: * Costs associated with continued GWTS O&M.
BLASLAND, BOUCK& LEE, INCengineers A scientists 7-2
iR 1I.HJ593

8. References
Blasland, Bouck & Lee, Inc. (BBL), Remedial Investigation/Feasibility Study Work Plan Addendum at the RodaleManufacturing Site Emmaus, Pennsylvania, May 1996.
BBL, Remedial Investigation Report Rodale Manufacturing Site, Emmaus, Pennsylvania, March 1998.
BBL, Risk Assessment Rodale Manufacturing Site, Emmaus, Pennsylvania, February 1999.
Buscheck, Timothy E., and Celia M. Alcantar, Regression Techniques and Analytical Solutions to DemonstrateIntrinsic Bioremediation, San Diego: Proceedings of the Battelle In Situ and On-Site Bioreclamation Symposium,April 24-27, 1995.
Cohen R. M. and Mercer J. W., DNAPL Site Evaluation. C. K. Smoley, Boca Raton, Florida. 1993.
Geo-Environmental Consultants, Inc. (GEC), Site History and Laboratory Results for the Rodale Manufacturing Site,Emmaus, Pennsylvania, October 23, 1991.
GEC, Well Survey Evaluation Summary Report for the Rodale Manufacturing Site. September 28, 1994.
GEC, Supplement I to the Time-Critical Work Plan for the Rodale Manufacturing Site in Emmaus, Pennsylvania.February 28, 1995.
GEC, Work Plan for a Remedial Investigation/Feasibility Study at the Rodale Manufacturing Site, Emmaus,Pennsylvania. August 31,1995.
GEC, Time-Critical Investigation Report for the Rodale Manufacturing Site, Emmaus, Pennsylvania. October 1995.
NUS Corporation, Superfund Division, Site Inspection of Rodale Manufacturing Company. TDD No. F3-8812-02,EPANo. PA-1276, November 15, 1989.
Pankow, J.F. and Cherry, J. A. Dense Chlorinated Solvents and Other DNAPLs in Ground- Water. WaterlooPress, Portland, Oregon. 1995.
Ravi V. and Johnson, J.A., VLEACH, Version 2.2a, A One-Dimensional Finite Difference Vadose Zone LeachingModel [developed for the USEPA], 1996.
Roy F. Weston, Inc. (Weston), Draft Phase II Hydrogeological Investigation of Rodale Manufacturing Site, Emmaus,Pennsylvania. November 1989.
Sloto, R.A, Cecil, L.D., and Senior, L.A.. Hydrogeology and Ground-Water Flow in the Carbonate Rocks of theLittle Lehigh Creek Basin, Lehigh County, Pennsylvania,. U.S. Geological Survey Water-Resources InvestigationsReport 90-4076, 1991.
SNR Company, Ground Water Monitoring Plan Prepared for Square D Company, Emmaus, Pennsylvania. March17, 1989.
BLASLAND. BOUCK & LEE. INC_________________________________engineers & scientists 8-1
<R -.IJ059U
USEPA, Guidance for Conducting Remedial Investigations and Feasibility Studies Under CERCLA, PublicationEPA/540/G89/004. Office of Solid Waste and Emergency Response (OSWER) Directive 9355.3-01, October 1988.
USEPA Region III, Administrative Order on Consent Executed between USEPA and Square D Company (for theconduct of the RI/FS). Docket No. III-92-1 5-DC, September 1992.
USEPA, Estimating Potential for Occurrence of DNAPL at Superfund Sites, Office of Emergency and RemedialResponse, Publication 9355.4-07FS, January 1992a.
USEPA, Framework for Ecological Risk Assessment, Risk Assessment Forum: EPA/630/R-92/001, Washington,D.C., 1992b.
USE? A, Remediation Technologies Screening Matrix and Reference Guide, Publication: EPA 542/B-93/005. Officeof Solid Waste and Emergency Response. July 1993.
USEPA, Guidance for Evaluating the Technical Impracticability of Ground-Water Restoration, Office of SolidWaste and Emergency Response (OSWER) Directive 9234.2-25, September 1993.
USEPA, Ecological Risk Assessment Guidance for Superfund: Process for Designing and Conducting EcologicalRisk Assessments, Review Draft, Environmental Response Team, Edison, New Jersey, 1994.
USEPA Region III, Administrative Order on Consent Executed between USEPA and Square D Company (for theGWTS), Docket No. 1 1 1 -94- 1 5-DC, effective September 30, 1 994.
USEPA, Vendor Information System for Innovative Treatment Technologies (VISITT), Version 3.0, TechnologyInnovation Office, 1995.
USEPA Memorandum from Roy L. Smith, Toxicologist, to RBC Table Mailing List. "Subject: Updated Risk-BasedConcentration Table." USEPA Region III. Philadelphia, Pennsylvania. March 17, 1997.
USEPA, Rules of Thumb for Superfund Remedy Selection, Office of Solid Waste and Emergency Response,Publication EPA 540-R-97-013 (OSWER Directive 9355.0-69), August 1997.
USEPA, Use of Monitored Natural Attenuation at Superfund, RCRA Corrective Action, and Underground StorageTank Sites, Office of Solid Waste and Emergency Response, OSWER Directive 9200.4-7, November 1997.
U.S. Geological Survey ,~X//e/tf<wn West and Allentown East 7.5 Minute Topographic Quadrangles.
Waterloo Centre for Ground- Water Research (WCGR) Short Course. Dense, Immiscible Phase Liquid Contaminants(DNAPLs) in Porous and Fractured Media. Kitchener, Ontario, Canada. October 7- 1 0, 1 99 1 .
Wood, C.R., Flippo, H.N, Lescinsky, J.B., and Barker, J.L., Water Resources of Lehigh County, Pennsylvania,Commonwealth of Pennsylvania Department of Environmental Resources Water Resource Report 31, 1972.
BLASLAND. 8OUCK & LEE. INC.engineers & scientists 8-2
TablesB L A S L A N D , B O U C K & L E E , INC,e n g i n e e r s & s c i e n t t i t s

TABLE 1
GWTS PERMITTED EFFLUENT LIMITS'
RODALE MANUFACTURING SITEEMMAUS, PENNSYLVANIA
FEASIBILITY STUDY
Parameter
Tetrachloroethylene
Toluene
1 ,2-Trans-Dichloroethylene
1 , 1 ,2-Trichloroethane
Trichloroehtylene
Vinyl" Chloride
Naphthalene
N-Nitrosodi-Phenylamine
Pyrere
Total Iron
Dissolved Iron
MonthlyAverage(mg/L)
0.01
0.01
0.01
0.01
0.01
0.0006
0.01
0.005
0.01
2.0
1.3
DailyMaximum(mg/L)
0.02
0.02
0.02
0.02
0.02
0.0009
0.02
0.01
0.02
4.0
2.0
1 As per January 31, 1995 letter from Dino R. Agustini, Sanatary Engineer, Northeast Regional Office, PA DER,to Jahan Tavagar, Principal, GEC, regarding Industrial Waste, Rodale Manufacturing Superfund Site.
2/17/99J \DOC99\06«1 \01290146 WPD Pasdof, ,|R 11)0597
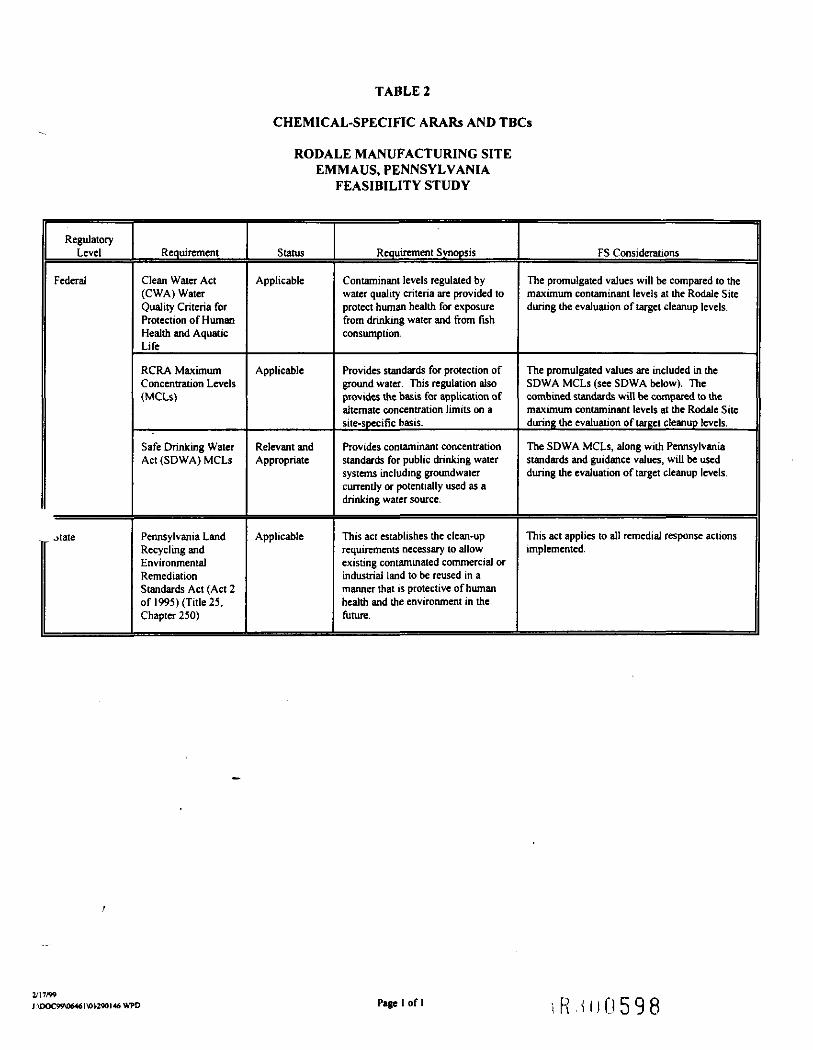
TABLE 2
CHEMICAL-SPECIFIC ARARs AND TBCs
RODALE MANUFACTURING SITEEMMAUS, PENNSYLVANIA
FEASIBILITY STUDY
RegulatoryLevel
Federal
.jtate
Requirement
Clean Water Act(CWA) WaterQuality Criteria forProtection of HumanHealth and AquaticLife
RCRA MaximumConcentration Levels(MCLs)
Safe Drinking WaterAct (SDWA) MCLs
Pennsylvania LandRecycling andEnvironmentalRemediationStandards Act (Act 2of 1995) (Title 25,Chapter 250)
Status
Applicable
Applicable
Relevant andAppropriate
Applicable
Requirement Synopsis
Contaminant levels regulated bywater quality criteria are provided toprotect human health for exposurefrom drinking water and from fishconsumption.
Provides standards for protection ofground water. This regulation alsoprovides the basis for application ofalternate concentration limits on asite-specific basis.
Provides contaminant concentrationstandards for public drinking watersystems including groundwatercurrently or potentially used as adrinking water source.
This act establishes the clean-uprequirements necessary to allowexisting contaminated commercial orindustrial land to be reused in amanner that is protective of humanhealth and the environment in thefuture.
FS Considerations
The promulgated values will be compared to themaximum contaminant levels at the Rodale Siteduring the evaluation of target cleanup levels.
The promulgated values are included in theSDWA MCLs (see SDWA below). Thecombined standards will be compared to themaximum contaminant levels at the Rodale Siteduring the evaluation of target cleanup levels.
The SDWA MCLs, along with Pennsylvaniastandards and guidance values, will be usedduring the evaluation of target cleanup levels.
This act applies to all remedial response actionsimplemented.
S \DOC99\0646IMH290I46WPD Page 1 Of 1 1 R . 1 I J (I 5 9 8
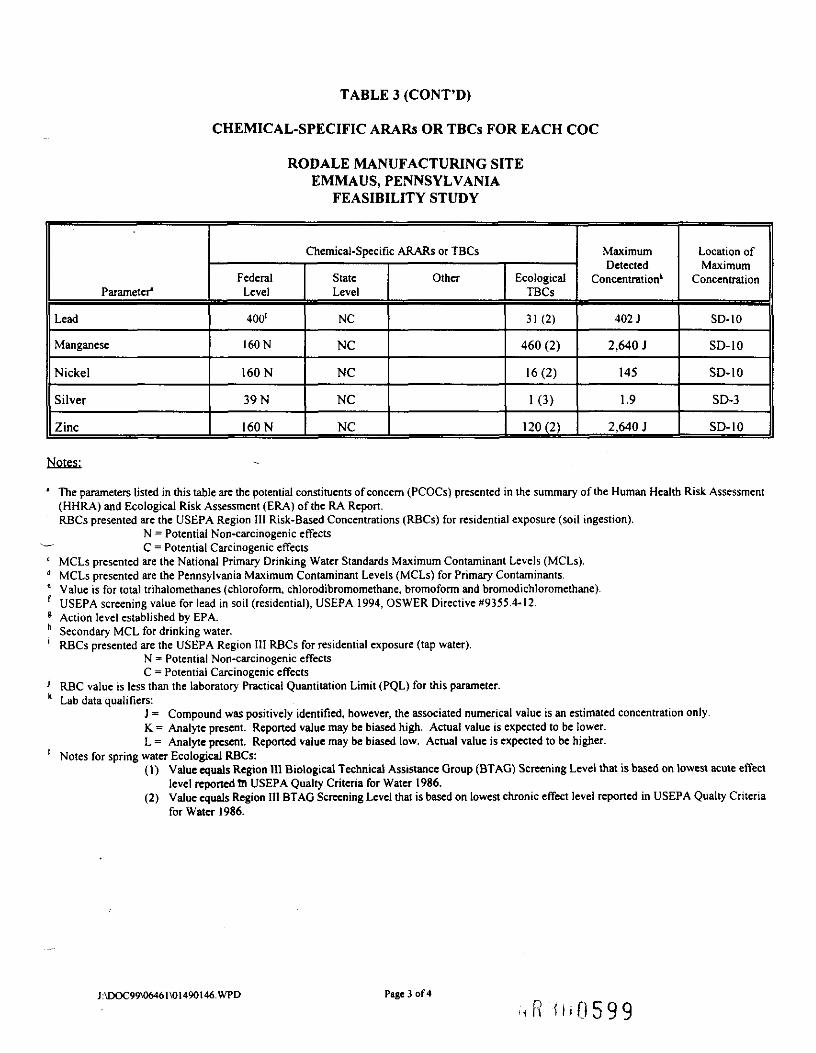
TABLE 3 (CONT'D)
CHEMICAL-SPECIFIC ARARs OR TBCs FOR EACH COC
RODALE MANUFACTURING SITEEMMAUS, PENNSYLVANIA
FEASIBILITY STUDY
Parameter1
Lead
Manganese
Nickel
Silver
Zinc
Chemical-Specific ARARs or TBCs
FederalLevel
400f
160 N
160 N
39 N
160 N
StateLevel
NC
NC
NC
NC
NC
Other EcologicalTBCs
31(2)
460 (2)
16(2)
1(3)
120(2)
MaximumDetected
Concentration*
402 J
2,640 J
145
1.9
2,640 J
Location ofMaximum
Concentration
SD-10
SD-10
SD-10
SD-3
SD-10
Notes:
* The parameters listed in this table are the potential constituents of concern (PCOCs) presented in the summary of the Human Health Risk Assessment(HHRA) and Ecological Risk Assessment (ERA) of the RA Report.RBCs presented are the USEPA Region III Risk-Based Concentrations (RBCs) for residential exposure (soil ingestion).
N = Potential Non-carcinogenic effects~ C = Potential Carcinogenic effects' MCLs presented are the National Primary Drinking Water Standards Maximum Contaminant Levels (MCLs).d MCLs presented are the Pennsylvania Maximum Contaminant Levels (MCLs) for Primary Contaminants.e Value is for total trihalomethanes (chloroform, chlorodibromomethane. bromoform and bromodichloromethane).f USEPA screening value for lead in soil (residential), USEPA 1994, OSWER Directive #9355.4-12.8 Action level established by EPA.
Secondary MCL for drinking water.1 RBCs presented are the USEPA Region III RBCs for residential exposure (tap water).
N = Potential Non-carcinogenic effectsC = Potential Carcinogenic effects
^ RBC value is less than the laboratory Practical Quantitation Limit (PQL) for this parameter.k Lab data qualifiers:
J = Compound was positively identified, however, the associated numerical value is an estimated concentration only.K = Analyte present. Reported value may be biased high. Actual value is expected to be lower.L = Analyte present. Reported value may be biased low. Actual value is expected to be higher.
1 Notes for spring water Ecological RBCs:(1) Value equals Region HI Biological Technical Assistance Group (BTAG) Screening Level that is based on lowest acute effect
level reported tn USEPA Qualty Criteria for Water 1986.(2) Value equals Region III BTAG Screening Level that is based on lowest chronic effect level reported in USEPA Qualty Criteria
for Water 1986.
J \DOC99\06461\01490146.WPD Page 3 of 4
; < R . < i i f J 5 9 9
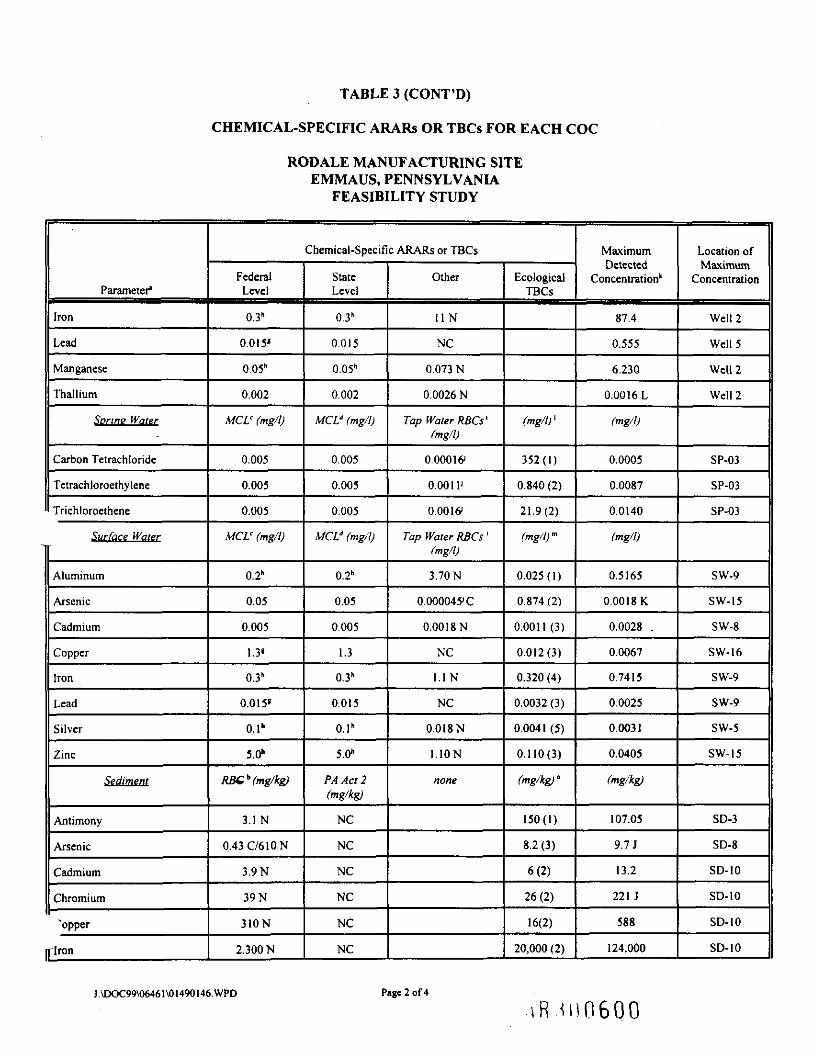
TABLE 3 (CONT'D)
CHEMICAL-SPECIFIC ARARs OR TBCs FOR EACH COC
RODALE MANUFACTURING SITEEMMAUS, PENNSYLVANIA
FEASIBILITY STUDY
Parameter*
Iron
Lead
Manganese
Thallium
Spring Water
Carbon Tetrachloride
Tetrachloroethylene
Trichloroethene
Surface Water
Aluminum
Arsenic
Cadmium
Copper
Iron
Lead
Silver
Zinc
Sediment
Antimony
Arsenic
Cadmium
Chromium
""opper
[plron
Chemical-Specific ARARs or TBCs
FederalLevel
0.3h
0.015'
0.05h
0.002
MCLC (mg/l)
0.005
0.005
0.005
MCU (mg/l)
0.2"
0.05
0.005
1.3"
0.3"
0.015'
0.1"
5.0"
RBG* (mg/kg)
3.1 N
0.43C/610N
3.9 N
39 N
310N
2.300 N
StateLevel
0.3h
0.015
0.05"
0.002
MCLd (mg/l)
0.005
0.005
0.005
MCL" (mg/l)
0.2h
0.05
0.005
1.3
0.3"
0.015
O.Ih
5.0"
PA Act 2(mg/kg)
NC
NC
NC
NC
NC
NC
Other
UN
NC
0.073 N
0.0026 N
Tap Water RBCs1(mg/l)
0.000 161
0.00 11'
0.00 16"
Tap Water RBCs '(mg/l)
3.70 N
0.000042C
0.001 8 N
NC
1.1N
NC
0.018 N
1.10N
none
EcologicalTBCs
(mg/l/
352(1)
0.840(2)
21.9(2)
(mg/l)'
0.025(1)
0.874 (2)
0.0011 (3)
0.012(3)
0.320 (4)
0.0032 (3)
0.0041 (5)
0.110(3)
(mg/kg)*
150(1)
8.2(3)
6(2)
26(2)
16(2)
20,000 (2)
MaximumDetected
Concentration11
87.4
0.555
6.230
O.OOI6L
(mg/l)
0.0005
0.0087
0.0140
(mg/l)
0.5165
0.0018 K
0.0028 .
0.0067
0.7415
0.0025
0.0031
0.0405
(mg/kg)
107.05
9.7 J
13.2
221 J
588
124,000
Location ofMaximum
Concentration
Well 2
Well 5
Well 2
Well 2
SP-03
SP-03
SP-03
SW-9
SW-15
SW-8
SW-16
SW-9
SW-9
SW-5
SW-15
SD-3
SD-8
SD-10
SD-10
SD-10
SD-10
J:\DOC99\06461\01490146.WPD Page 2 of 4

TABLE 3
CHEMICAL-SPECIFIC ARARs OR TBCs FOR EACH COC
RODALE MANUFACTURING SITEEMMAUS, PENNSYLVANIA
FEASIBILITY STUDY
Parameter*
Soil
Aluminum
Arsenic
Iron
Manganese
Thallium
Ground Water
"arbon tetrachloride
Chloroform
Chloromethane
1 ,2-Dichloroethene (cis/trans)
Tetrachloroethylene
Toluene
Trichloroethene
Vinyl Chloride
Ammonia
1 ,4-Dichlorobenzene
4-Methylphenol
B is(2-ethy Ihexy I )phthalate
Pentachlorophenol
Antimony
Arsenic
Chromium (total)
-'opper
Chemical-Specific ARARs or TBCs
FederalLevel
RBCs* (mg/kg)
7,800 N
0.43C/610N
2,300 N
160 N
0.55 N
MClf (mg/l)
0.005
0.100'
NC
0.07/0.10
0.005
1.0
0.005
0.002
NC
0.075
-NC
0.006
0.001
0.006
0.05
0.1
1.3«
StateLevel
m m mm ^ ^ ^ ^ m
PA Act 2(mg/kg)
NC
NC
NC
NC
NC
MCL* (mg/l)
0.005
0.100*
NC
0.07/0.10
0.005
1.00
0.005
0.002
NC
0.075
NC
0.006
NC
0.006
0.05
0.1
1.3
Other
asaa H ^none
Tap Water RBCs*fag/0
0.000 16" C
0.000 15JC
0.00 }5>C
0.061 /0.120N
0.001 PC
0.075 N
0.00 lo^C
0.0000 1 9>C
0.021 N
0.0004? C
O.I8N
0.0048 C
0.00056" C
0.015 N
0.00004y C
37/0.18N/C
0.15N
EcologicalTBCs
MaximumDetected
Concentration11^ — - ............ ... .==
(mg/kg)
22,100
14.4
77.300
2,630
7.8
(mg/l)
0.0005
5.0
2.9 J
_ 43.0 J (total)
3.90
4.85
590.0
3.2
29.3
0.001
58.0
4.9
0.005 J
0.029
O.OIOI
0.174
0.709
Location ofMaximum
Concentration
— -•i— ' ••-(depth, ft bgs)
SB-20(10-12)
SB-20 (10-12)
SB-12 (10-12)
SB-8 (10-12)
SB-8 (10-12)
SP-03
Well 4
Well 4
Well 2
Well 2
Well 3
RW-3
Well-3
Well 2
RW-3
Well 2
Well 3
Well 2
Well 7
Well?
Well?
Well 5
J:\DOC99\0646I\OI490146.WPD Page 1 of 4
,ii UI060 I

TABLE 3 (CONT'D)
CHEMICAL-SPECIFIC ARARs OR TBCs FOR EACH COC
RODALE MANUFACTURING SITEEMMAUS, PENNSYLVANIA
FEASIBILITY STUDY
Notes: (Cont'd)
m Notes for surface water Ecological RBCs:(I) value equals Region HI BTAG Screening Level for chronic toxicity that is based on pH-dependent equation in Ambient Water Quality
Criteria for Aluminum, which is used to calculate water-body specific criteria.(2) value equals Region III BTAG Screening Level that is based on chronic effect level reported for one species of invertebrate (Gammarus
psuedolimnaeus).(3) value equals continuous maximum concentration that is based on hardness-dependent equation (assuming a hardness value of 100 mg/l)
in USEPA 1994 Water Quality Standards Handbook.(4) value equals Region III BTAG Screening Level for chronic toxicity that is based on invertebrate data which are unreferenced
(5) value equals criterion maximum concentration that is based on hardness-dependent equation (assuming a hardness value of 100 mg/l) inUSEPA 1994 Water Quality Standards Handbook.
" Notes for sediment Ecological RBCs:(1) value equals Region III BTAG Screening Level that is based on protection of fauna derived from apparent effects threshold (AET).(2) value equals lowest effects level for Provincial Sediment Quality Guideline for Metals and Nutrients developed by Ontario Ministry of
Environment and Energy.(3) value equals Region III BTAG Screening Level that is based on NOAA Effects Range Low.
NC = No Criteria.
J:\DOC99\06461\OI490146.WPD Page 4 of 4
: U 6 0 2

TABLE 4
LOCATION-SPECIFIC ARARs AND TBCs
RODALE MANUFACTURING SITEEMMAUS, PENNSYLVANIA
FEASIBILITY STUDY
RegulatoryLevel
LocalGovernment(Borough ofEmmaus)
Requirement
Zoning Ordinances
Status
To BeConsidered
Requirement Synopsis
This ordinance addresses newconstruction and discharge tostorm sewers.
FS Considerations
This TBC may apply if the response acitoninvolves constructing additional facilities on siteor discharge of effluent to the storm sewersystem.
J \DOC99W6461W1290I46WPD PagC I Of 1 , L'> ^ M f) £ f] O
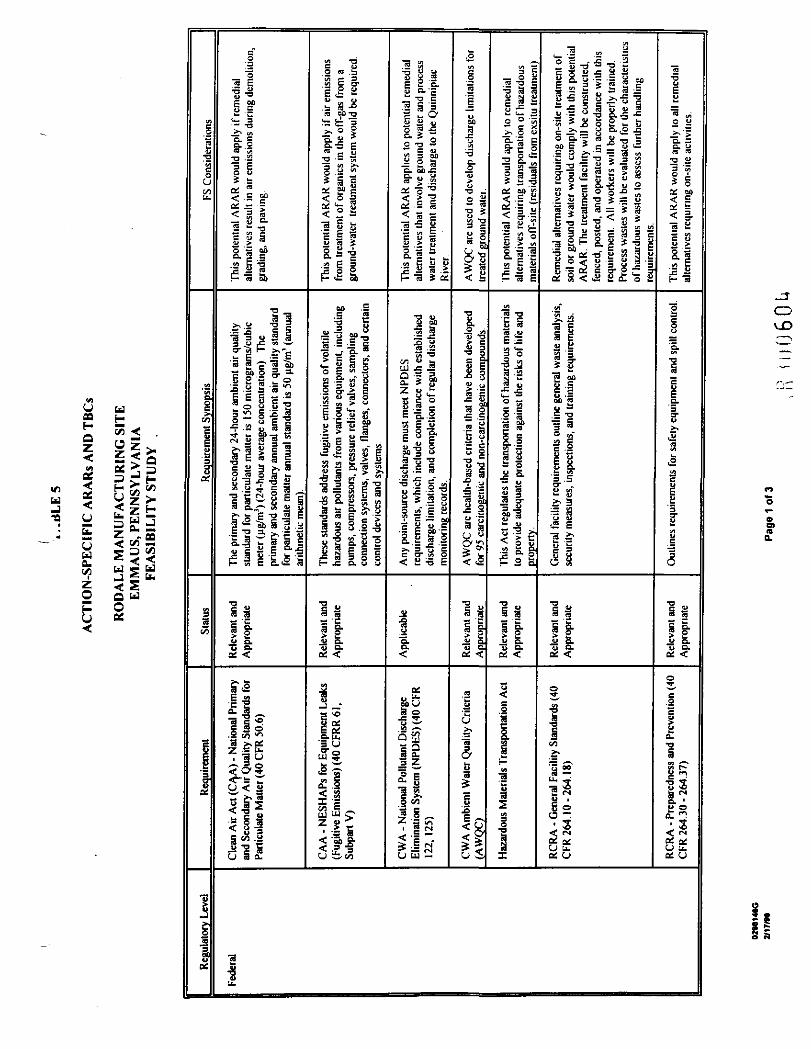
S z ™u WS
O oP OG «
FS Considerations
Requirement Synopsis
33
sin'3Soi
atory Level
J
iE*
c"
"313 E
1|
This
potential ARAR would apply if
alternatives
result in air emissions
du
grading, and
paving.
The primary and secondary 24-hour ambient air quality
standard for paniculate matter is 1 5
0 micrograms/cubic
meter (ug/m3) (24-hour average concentration)
The
primary and secondary annual ambient
air
quality st
andarc
for pa
niculate ma
tter an
nual st
andard is 50 ug/m1 (annual
arithmetic mean).
i a
& f^_3 G.* <
9 [£
£ -3'C CQ_ J3
•g "c 3"S 2 o
• 2 to ""*
z JSj1 3 f*.O1 ,U~^ w— ^5 S*2
5i|s2lr* 1 Su a a.
S ""O C3 .3
K E a-£•— O y
t£ "-
.S a*ra oo -o
This
potential ARAR would
apply if
from
treatment of
organics in the off-
ground-water
treatment system woul
an .5
These standards address
fugiti
ve em
issions of
volat
ilehazardous air p
ollutants from
various equipment,
includin;
pumps,
compressors, pr
essure
relie
f valves, sampling
connection sy
stems,
valves, flanges, connectors, and ce
rta
control devices and systems
-aS &a n
I i"U D.»! s-
13c3*t
C *
i oiO.U.'5 U. ,•2 "£o Sa. .3•rf <4||
1.1 frf -3. S,5££
.2 «-o u o111y °" c
ill
This
potential ARAR
applies lo
potei
alternatives
that involve ground
watei
water treatment and discharge to the '
River
Any point-source discharge must meet NPDES
requirements, which include compliance
with established
discharge limitation, and completion of
regular discharge
monitoring re
cords.
_«
1Q-a<
as.& {j1 9QfS1 z^ a1 S,5 on"J.!~• is< s "* .5 (NuS2
£.051Ak
AWQC are used to develop
dischargi
treated ground
water.
AWQC are health-based
criter
ia th
at have been developed
for 95 carcinogenic and non-carcinogenic compounds
•o5 s11M CLu Qat <
.5SJ'CO>t
^aua*cu
Ig<C 3;
uS
_ o I*> 3 iIII
This
potential ARAR would apply lo
alternatives requiring Ir
ansporlalion o
materials off-site (r
esiduals from exsi
VI
This Act
regulates the
transportation of h
azardous mateha
to pr
ovide adequate
protection ag
ainst the ris
ks of
life
and
property.
i M11.** o."S &•
u<co'ia
£VI"c3
123o•a9
X
S^P 5ll51
Remedial
alternatives re
quiring o
n-sil
soil or ground water would comply w
ARAR.
The treatment
facili
ty will be
fenced, posted, and operated in accor
requirement. A
ll workers
will be pro
Process wastes
will be evaluated
for t
of ha
zardous wastes lo assess
further
requirements.
in"
General
facili
ty requirements
outline g
eneral waste
analysi
security measures, inspections, and training re
quirements.
1 a
114> *-L
"3 0.a: <
oTo"
a•gSCfl>>£ -~s3 -^a 32 *Ns ^5S
^&
2•3uu
^ «
This
potential ARAR would apply lo
alternatives requiring on
-sile aclivitie
"3
Outlines requirements for safely equipment
and
spill
conlr
•oS s
> 2"_u a.
£ <o*>rc.gcs£a.•oi1?"8Ss 7Cu 'u o
2 n^U u.
•a1u.
(J M09 H
W5 C2 ••
5? "
"* ^ * 5 1 •* ? 3 ^ a g s S - a ^ ' G g . a - V u - a g.-= S«O K . a - - r 5 B ^ ; . S = S E S w 2 - 9 ' P - S = u ^ g «f £•nr-f-jPc"^.. o S S S X - S s f e s l R S i a *-« S _O
e
i

Hw <
S? 2J fc ^
z .U < s« Sw S B2a. *• •< <v? u s uz -J 1 fc% < S2 a wH OU c£
'ftcua*cconu.
Requiremenl Synopsis
3&
Requirement
£i3Sof
.5uEhi__
13o w>>'!Q. —CL u« M
2 —3 V)
* ooi BO< S
This
potenlial AR
alternatives re
quir
•au33o
Outlines requirements for emergency procedures
tfollowing e
xplosions,
fires
, etc
.
-a ai g11_U Q.U &•
oirtSr-i
fRCRA
- Co
ntingency Plan and
Emergency Procedures (4
0 CFR
264.56)
*<3•6u§n10 VIo .1£*'>O. ~C. t.& *__ ^
S ?iso: on< .s
This
potential AR
alternatives re
quir
i«ou3SV
Details specific re
quirements fo
r closure an
d post'
hazardous waste
facili
ties.
•a w
11_O Du &as <
oSv
RCRA
- Cl
osure and Post-Closui
CFR 264 1 10 - 264 120)
</ie2SoLMOflj U
3 5-£ 100 •-•g g3 >-o1 ou «t- 4s —> -C
Remedial
aller
nati
would comply
wit
u8S
This
regulation sp
ecifie
s conditions for ha
zardous
storage in co
ntainers.
•o u§ n
11Jj> Q4> &0£ <
^
t_ _ ~*
RCRA
- Use and Management ol
Containers (40 CFR 264
Subparl
2oiJ2iou3U
oo 2.S glio L!t. 3"> STu JJ
Remedial
altemali
comply
with these
5uo"> co ,o
This
regulation ap
plies l
o the us
e of ta
nk sy
stems
treat hazardous wastes.
Specifies design,
instal
latcontainmenl, and operating
crite
ria.
i Hi'S-> 2J> Q*V O»tt <
S(N
RCRA
- Tank Systems (40 CFR
Subpart J)
siif'3 I•— 50 J
3 E_£ 3— uOD SC 3
1 afi"!vl O> *
Remedial
altemati
control equipment
potential AR
AR.
i e !
| So^ « *a
- u
Regulates air pollutant e
missions
for process vent;
vent sy
stems,
control devices for TSDFs,
air/stean
operations when equipment tre
ats id
entifi
ed or
lisl
hazardous wastes.
1 S« ca
11&> f _1> O.Ctf <
?<;
5 cu. g
RCRA
- Air Emission Standards
Process Vents (40 CFR 264
Sub|
c-— 3'- P"S Sb£ "5y ..o S^-g"E. wS an —•a *j2 '•?1 =5 o< .1°
This
potential AR
alternatives re
quir
water or
soil.
S a<— oo .tO C 5
c S J5 .9 -s j
This requirement governs equipment
that contains
contacts hazardous wastes with or
ganic concenlra
least
10 pe
rcenl by we
ight.
Specifies periodic mo
for leaks thai may cause
air em
issions and soecifit
-3i -S3 CO
11o o.~Z &« <
9<3 3
RCRA
- Air Emission Standards
Equipment Leaks (40 CFR 264 S
BB)
•S
i -5oo -„c ^ Q.•9 ES oJ |c 3•— >3 *
££ 5Ert ^^j f^S o
All remedial
aller
rdisposal of
hazard
potential ARAR
£cu
Specifies Ihe recordkeeping and reporting requirer
RCRA
faci
lities
.
i a1 2y CXTJ Q.QC <
P.. c"3fY. C
RCRA
- Manifesting, Recordkee
and Reporting (40 CFR 264.70 -
.2u ra.5 "371 uA Ei>— ^O t_• o"7 sL r"
c^ 52 =
1 i« "3.<• .£
This
potenlial AR,
conducted during
on-site.
oiij>
This
regulation ap
plies t
o health an
d safely measu
work
conducted al a hazardous waste
site.
* w.0u"5,a.<
o
Occupational Sa
fely an
d Health
Administration (OSHA) Re
gulali
a(0

H tQ «Z U
<
r -5 ^ >£ u 21^2 E P£-u^ . z „ CQ
u ^ 3 35& * < <W Ed •$ UZ J S O ^1H OU &
iderations
^cUCOu.
Requiremenl Synopsis
335(0
C
ia
jV
a"3on£
ca
id apply if re
medi
lissio
ns.
g §S >-* =21*£ 3—— U
This
potentia
alternatives
r
"S 2
This
act es
tablishes administrative procedures to be followi
in the
administration and enforcement of th
e CAA, a
nd hz
provisions
lhat meet or exceed CAA requirements
.cn"5.D.<
w**•€Uc
tPennsylvania
Air Pol
lulic
(APCT)
<5 «
Id apply
if on
-site
'organics would
t
g $ 'DO( -5
2 -f•< !/>
This
polenlia
emissions (ai
required.
This
regulation may require permitting for air emissions
above a specified lev
el, dispersion modeling, odor
control
and oth
ers.
.0c3"5.Q."
Q_
(N
Euai00.c
Pennsylvania Ai
r Permill
Code
127.1)
«'
o J3~ 3
te and discharged
:omply
with the s
lation
s.
'1 2 IQ ~?. <-^ o **« = •£S 5 *"•. 0
Ground
watei
surface watei
requirements
•aa* **
This
act establishes administrative procedures to be
foll
owiin
the administration and enforcement of t
he CWA
including NPDES
requirements to provide specific effluen
limitations for a Riven discharge
.0US
~Ci.Q.
<
rT<S
i a_ «r
Pennsylvania Discharge
1Regulations (25 PA Codt
oo.g'3a-u
edial alternatives
§stS '-*SO.Ma.
i
!a \
This
act regulates impairments to wa
ters of
the sta
te.
.0c>"H.o.<
itoJ1
Pennsylvania Cl
ean Sir
es(Title 25. Chapter 93
)
VI
a
dial response
actn
uu—•-aaftu
This
acl
appi;
implemented
This
act establishes the clean-up re
quirements ne
cessary to
allow existing co
ntaminated commercial or i
ndustr
ial la
ndto be
reused in a m
anner tha
t is protective of human
health
and the environment in the future.
-M
"o.O.
"*
•3 tija S
"c "I •=
= C ST! -2 u
Pennsylvania Land Recyi
Environmental Remedial
Acl (Act 2 of 1995) (Ti
ll291)
1 allematives
Ihal
raee tank svstem
2 c^ «c wE s—u o2 aVI ~.** r
This
act appi
incorporate
tlThis
act specifics
spill
prevention an
d lank ha
ndling
activities for al
l storage tank systems.
_u.0w<j1<
S_ Q\
<«"*&•o •«;• Je
Pennsylvania St
orage Tai
Prevenlion Acl
(Titl
e 35,
U^
|
iwater di
scharges
oo
"5.a.f3>,nEiJ aH '5
This acl ad
dresses requiremenls for st
ormwater
management.
.0(9U
"S.Q.
<
U^
Stormwater Management
fri .2 c3 u00 S<S PU 3g ffM a;
-2 '~•a §
lo develop
air em
quiring air emissn
•a uu "S V>w 5= EM
This guidano
controls if a
nselected
Guidance
regarding use of air e
mission controls at CERCL
sites.
•o44um 's
o SP U
:±
oo(S6 H
OSWER
Directive 9355.
Stripper Co
ntrol Guidanc
1>•oSisi
53
U3c:-
ifii

oo'cooEk.«-a
|iooo.2'x
9 (—, k'J !T» W ^ - •— --J - «•^
SH
H
<o 2 >z z 5 j
u
H
IQZ
OU
^wL
aU*•~s
"S
3SatO
eo*c
•-••' i";;,?;
;;_g#<v
",^
o
J•*
9-o•H••*'a.etU
<
o4ft
MOU3a.AUO2
.*•*,V)
A4»
O
1/19
uBaE
'1
E
B.93
OTS9Ee<
CO
oooo"
ooo,o"
3
_
00c"o'co
EH00oJ
—
oooo"
O&M
Subtotal:
ooo.oo"6ft
O&M Contingency (20%):
ooo.oo"s
Estimated Annual O&M:
w-i(Nr-f»*!_
g
o
oaU.j=o—cVV)uCL
O9090.f~.
r-
1 Present Worth
of O&M:
OJ9
(MOU£t?9^'s£D."3'SH
U
o
toOU
'a,aU
o
o00oor-"r-
o<JSO
o
o90OOr-"
Present Worth:
oocct-
Rounded To:
«
cruSc
M CW OO -M &C O D._ ™Z O-oo"«c
a
OO
§ EE 5
0 6 0 7

<5
u O
SI«ibd H
Z
S
u zH ai
zO
^
cU
l_1
U*•"S
*s
_>"a«t3O
a
j3
i,o** ?'' • ..
'%?;"*'K,
iSd
e•M
aS•u'5.U
«
oook/1(N6ft
Ooo_(N6ft
CO
"ol_couac.O3*•«•
—
OOoV)<N6ft
1trtOU"M"5.aU
ooovT6ft
s—\•s(NS—i'
>>Contingenc
ooo*
f*\fcft
tal Cost:
'S.MU•o4>«•OS
W)til"3£
"e01
o
oUufleafl4)
'3
eae•5fla.OT59Ee*
CQ*
Ooo,*n"f w.
6ft
O
6ft
&0
00
O'EospPu
c*o
—
ooo.in"r-6ft
Subtotal:
SO
ooovTH
6ft
?O(N
>»
VI Contingenc
1
o
o"6ft
S8m
timated Annui
VIw
CNP-
•
tf)
O
O
LL.-Ct:o^c
CL
infN
en00rn
6ft
CO&M:
o.er9*'fl«t1/1b.a."3^
inCN
rn"^^__"
5"3
ooGS,C^„ i
C•»
"8•cE99C£
^
R '111.1608

ZU
H•<UQCH
U^H <yo oSu uu 35 <.
00u
«E au.
e
<zccu
If.9U
1•**'E
*Bp
"SM3O
a.9
.9
y «
9ZIMM
3
5~'a.etU
<
o©inrN6ft
©©©,m"fN6ft
-J
V)
SeoU
Instit
utiona
l
~"
©©©.m"fN6ft
©©©m"fN6ft
(/>-J
1—uuuto"H.fie:
to
fN
OO©„m"fN6ft
©©©_m"fN6ft
en_J
.2,3)60
c
Additional
1
en
©©in"r-6ft
o3enoU15'5.a
©©©m"6ft
Contingency (20%)
©©©©"6ft
stimated Capital Co
st:
bd29
^UCOft)
o
I/I9UV
cBWJ5*3
^B*B,9'*•
O9BS<J
CQ
©©o"in6ft
©©©©"m6ft
en-j
•o§c.018.oE
,i» u
Treatment S
Maintenanc
^
©©•/"Tr-6ft
©©m"6ft
cn
00
o.tscoS
o
CN
Oom"(NfN6ft
O&M
Subtotal
©©vT6ft
:M Contingency (20%)
§
©©©©"r-CN6ft
stimated Annual O&M
LU
mfNp-m'
minL.
Oenu.O
' ti.
O
—Cu
ol
in
o*m
6ft
esent Worth of O&M:
£13"5
w-ir-©"
6ft
MOU13o
oecT•t
6ft
Rounded to:
iK.ii)U609

I 11 *§ ^ r se 3 8- S -2
S S i -83 — Q.o _; •- x
H , — c ™4> <*- —— C •— jjy •— O m 3 -a iw V « S 2 J IS S £ • • H A Q D 3 VQ 3 OU CO ^
i flllll |<Z .s'o^^^M-iSO N 'S S. 2 I. e! •—M — ^?a_"'-~ X
Ez ^ § Ii S1 SSg i&g g g-S § «HC ^ — 3 .£ w E cw 5 § - 5 a o 2 t . ' 5S 8 w fe 111 s -|l-*t •*• ( A , '-* I4 '• ^ m PvJ M v4 :i ^ ^ p™ 4. t
i ^i> till fill?.--11 i|gl 5
«otf
i8111 g I SiIMSKI&SlSij1.§8sg
. fiE-g 3a S.-S.2 g g" "
>*S _- OD o 2 i— (L) *^ *—TTO OJ) ff —— S ™ *S C "
5 41 i 11111! «Z 4-5^SJSSf= Kocu
5 1 1 £§81 sl33 IIJ
R.i006IO

REFERENCE: Base Map Source- USGS 7.5 Min. Topo. Quad., Allentown West. PA. & Allentown East, PA (1964. Photoinspected 1963, Revised 1992).
Scale:20001 0 2000'
7/98 SYR-D54-LBR, jvm0«61050/06d61n01 cdr
RODALE MANUFACTURING SITEEMMAUS, PENNSYLVANIA
FEASIBILITY STUDY
SITE LOCATION MAP
, FIGUREBLASLAND, BOUCK & LEE. INC.
. engineers A s c / e n f / s f s 1

3 -a
ING
STVANIA
UDY
NUFA
CS. PENN
IBILITY
M UA
a<2
1 I *]5< , *llu°: :n_j
SITE PLAN/
U3
L
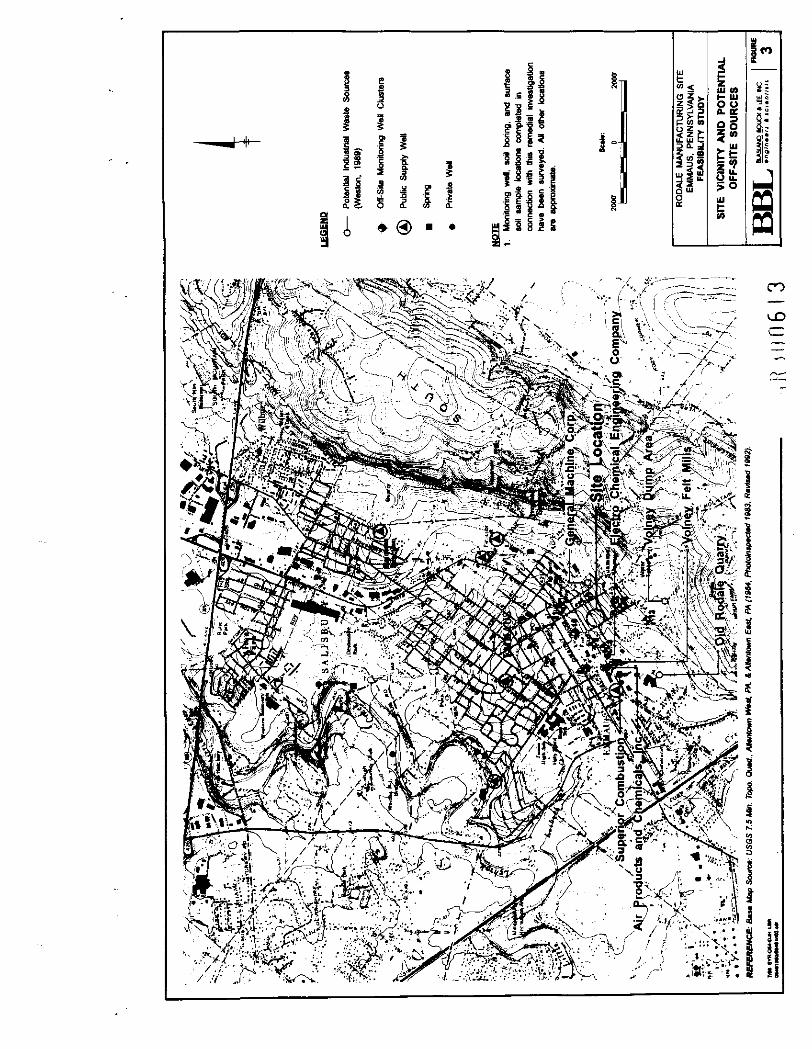
£ = S B3 3 •£ S S3 v , i *
11
i l l 1813 jIf j | i s|i|.
i * ® • • ain§l 5
HI
H UJOOo. oeog83
50
t CC- gCO
• D
§th/ .y- /' ' ' •*:,.. x^. •"«.''*• J i -./ -.---.'• ry- -;• •-T:'-^'-vt'- J f-~ * / '•>• ? =« c Si
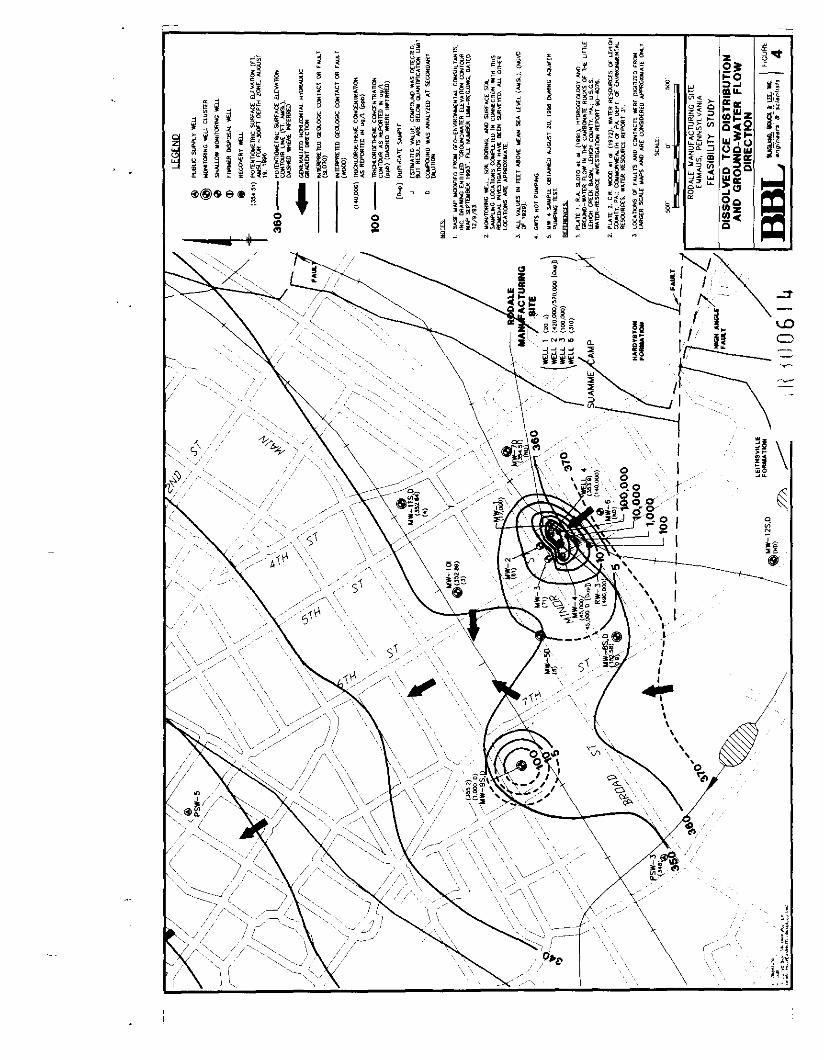
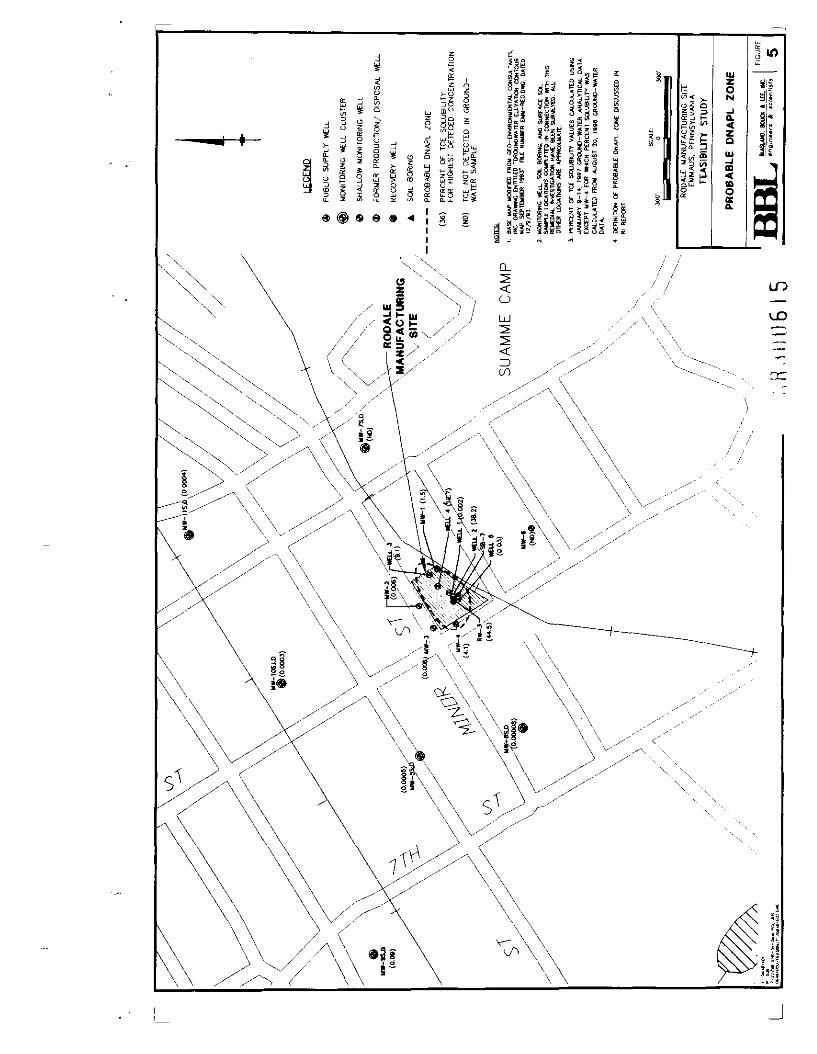
£ d & =§ g sis yi@S ° = o ^| |i|
—*— >; g I y ^ % £5 £L if! g|J|
•" S * or S ^ t-S (-w "S'n n^is:) o O £ w 5 « zg o^ 0§Z S?5l
^I/) < _o ? oS> (t_i i-
£lfl^-ffi35 o53 £auo£E
UlzoN
O.
Z
IU-Jm<uOQCa.
Li_
VS41u
3
d
1
z§
u,
1
>••s
LO
«JO
cc


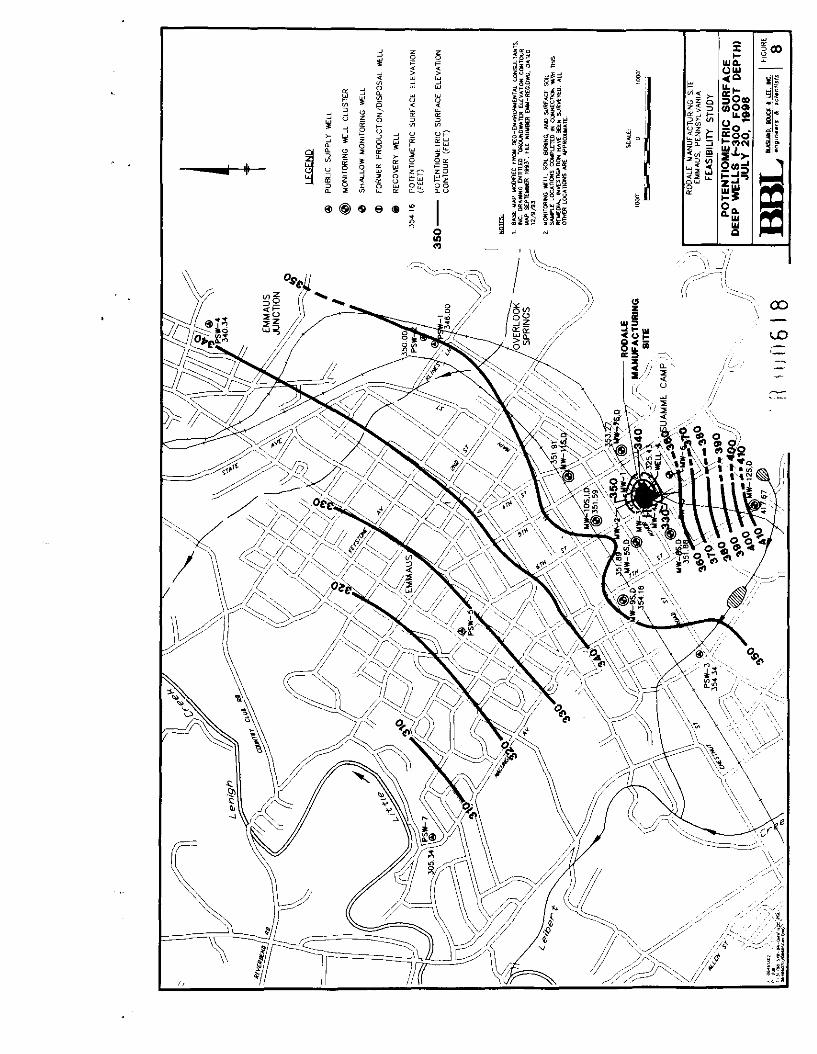
Appendix A
VLEACH Modeling Results
BLASLAND. BOUCK & LEE, INC.* n o i n e e r t ft j e / * n M j f j
. 1 1 1 0 6 1 9

Appendix A - Rodale Manufacturing Site_______VLEACH Modeling Results
The USEPA-published leaching model, VLEACH, was used to determine the relative impacts of vadose zone soil volatileorganic compounds (VOCs) upon the ground water beneath the Rodale Site. VLEACH, Version 2.2a (Ravi and Johnson, 1996)is a one-dimensional vadose zone leaching model computer code for estimating the impact due to the mobilization andmigration of a sorbed organic compound located in the vadose zone upon ground water. VLEACH partitions the compoundinto three phases:
• as a solute dissolved in water;
• as a gas in the vapor phase; and
• as an adsorbed compound in the solid phase.
During each time-step, VLEACH computationally redistributes the contaminated mass according to the mass transportparameters specified by the user. Each time step is solved successively until the final time is reached. Vadose zone transportprocesses computed by VLEACH for the entire vadose zone control volume include:
* advection from non-zero concentration recharge (at upper boundary);
• diffusion into atmosphere (at upper boundary);
• advection into ground water (at lower boundary); and
• diffusion into ground water (at lower boundary).
The VLEACH model of the vadose zone in the vicinity of the VLEACH site incorporated the following assumptions:
• The vadose zone is discretized into independent polygonal volumes (termed polygons throughout this appendix).Homogeneous soil conditions such as dry bulk density, effective porosity, volumetric water content, and total organic carbon,are user-specified constants throughout each polygon. Dry bulk density, effective porosity, and volumetric moisture contentwere obtained from the arithmetic mean of overburden vadose zone data provided. Soil total organic ca/bon was determinedfrom vadose zone samples collected in 1996 by BBL (BBL, March 1988). To maintain simplicity in modeling and recordkeeping, only one polygon was used per model data set.
* Each VLEACH polygon is discretized vertically into cells which have the same planar area. Compound concentrations inthe soil phase can vary between cells. The vadose zone was described in the model using the geometry presented in crosssection S-S', Figure 39 of the RI Report Initial simulations shown in Table 1 used a uniform concentration, which was themaximum for that compound determined in the soil, over the entire height of the vadose zone, roughly 70 feet, with 50-1.4foot cells. In the second set of simulations, the vadose zone was discretized into 50 cells, each 2.5 feet in height.
• Linear isotherms describe the partitioning of the compound between the liquid, vapor, and soil phases. Local orinstantaneous equilibrium between these phases is assumed within each cell. Values obtained from the VLEACH manualwere used for the compound soil partitioning coefficient, and the Henry's Law constant. Values for the compound free airdiffusivity were obtained from Cohen et al (1993), and LaGrega et al (1994).
• The vadose zone water movement is in a state of steady-state downward flux. The recharge rate is constant and uniform.The concentration in the recharge water is constant. The rate and concentration determine the advective flux due to recharge.In our simulations, the recharge was assumed to have zero compound concentration, at a rate of 11-in/yr (one-fourth themean annual precipitation listed in Table 1-3 of the RI Report).
• The ground water at the water table has a constant concentration of zero. Diffusion across the lower boundary is unimpeded.
_________________________________BLASLAND, BOUCK & LEE. INC._________________________________0 3 9 8 M 2 6 M - - 7 / 3 i / 9 8 e n g i n e e r s & scientists A ^ l
• K f.10620
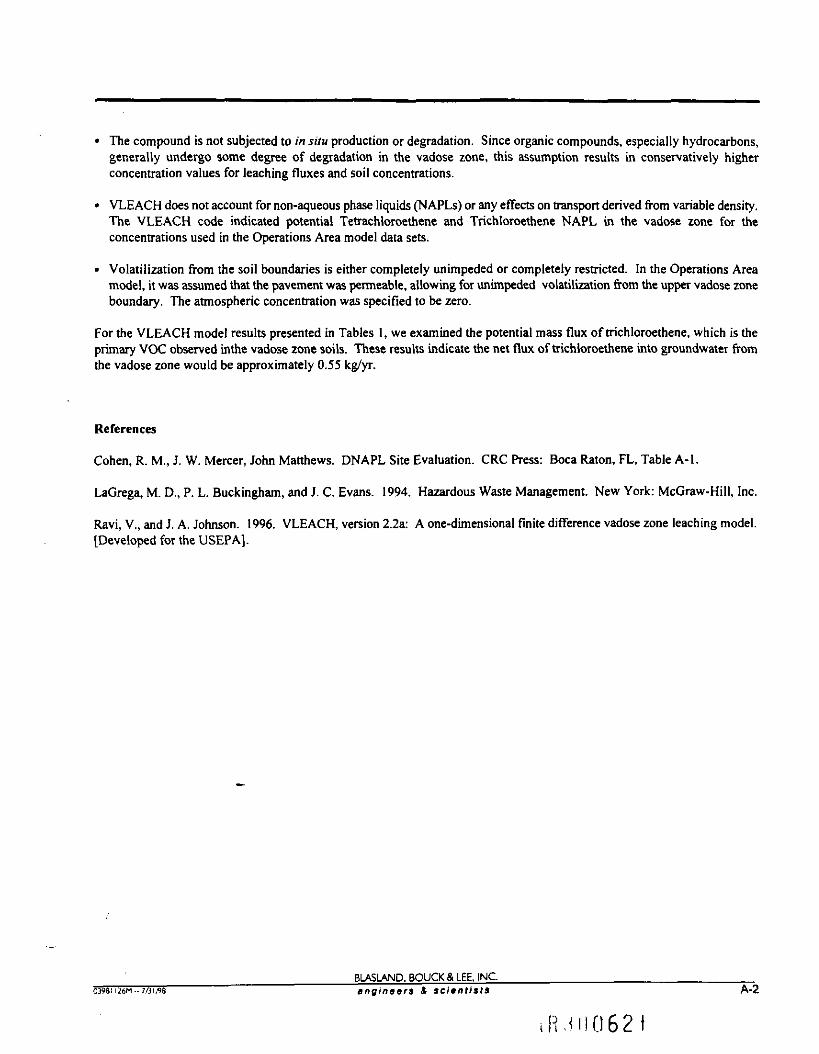
• The compound is not subjected to in situ production or degradation. Since organic compounds, especially hydrocarbons,generally undergo some degree of degradation in the vadose zone, this assumption results in conservatively higherconcentration values for leaching fluxes and soil concentrations.
• VLEACH does not account for non-aqueous phase liquids (NAPLs) or any effects on transport derived from variable density.The VLEACH code indicated potential Tetrachloroethene and Trichloroethene NAPL in the vadose zone for theconcentrations used in the Operations Area model data sets.
• Volatilization from the soil boundaries is either completely unimpeded or completely restricted. In the Operations Areamodel, it was assumed that the pavement was permeable, allowing for unimpeded volatilization from the upper vadose zoneboundary. The atmospheric concentration was specified to be zero.
For the VLEACH model results presented in Tables 1, we examined the potential mass flux of trichloroethene, which is theprimary VOC observed inthe vadose zone soils. These results indicate the net flux of trichloroethene into groundwater fromthe vadose zone would be approximately 0.55 kg/yr.
References
Cohen, R. M., J. W. Mercer, John Matthews. DNAPL Site Evaluation. CRC Press: Boca Raton, FL, Table A-l.
LaGrega, M. D., P. L. Buckingham, and J. C. Evans. 1994. Hazardous Waste Management. New York: McGraw-Hill, Inc.
Ravi, V., and J. A. Johnson. 1996. VLEACH, version 2.2a: A one-dimensional finite difference vadose zone leaching model.[Developed for the USEPA].
BLASLAND. BOUCK & LEE. INC.6398ii26M-7/3tfl8 ~ * angintsrs & scientists A-2
iFUn062 t

TABLE 1
VAOOSE ZONE MASS FLUX CONTRIBUTION
Volatile Organic Compound:3ataset
4umbw of Polygon*:Timestap:Simulation Time:Output Time Interval:>rofile Tima Interval:Organic Carton Distnbution Coeffictent (1 ):Henry's Conitantd):Veter Solubilitv (1)::ree Air Diffusion Coefficient (4. 0):Area (8. 9):Vertical cell dimension (9):lecharoe rate (2):)rv Bulk Density (7):Effective Porosity (7):i/olumatric Water Content (7):Soil Organic Carbon Content (7):Concentration of Recharge WaterMmosphenc Concantrttion:Vatar Table Concentration:Call Number (9):'tot Variable:>lol Time:
Jpper Cell (lesser mtager):.owar Cell (greater integer):nitial Soil Contaminant Concentration in Cells (3):
1 Vadose Zone VOCs Maw Flux
V1.6ACH Detected Concentrations Exceeding Solubility Limit:Estimated Time to Deplation-
rot*l Vadose Zone Mass at t*0yr (6):Total Vadose Zone Mass at t*99yr (6):lotto of 99 to Oyr Masses:
Advective Flux of Leacnate into Ground WaterLIGW 6):jifTunoo into Atmosphere (6):
liffuaion Into Ground Water (Of OW; 8):
M Flux Downward from Vadose into GW (NFD):M Flux of Water from Vadosa into GW
—MCftflte Concentration:
TCEiceZmp
1.0E+001 OE+QO9.9E+01roE+oo10E*011 3E*0236E-011.0E*0372E-011.6E+0325E*0092E-0115E+0043E-01346-01196-04OOE+00OOE-KM0.06*00506*01Ye»
OOE*00
SEE ATTACHEDSEE ATTACHEDSEE ATTACHED
YM506*00
23E+021 3E-03576-06
9.7E-0216E*023.4E-035.5E+0025E-013.96*02
5.5E402156*03426*041.3E+04
Units
<-)(yMri)(ware)(veers)(year*)(mL/g)(-)
(mo/L)(m"2/d><fl*2)(ft)
(fl/yr)(o/cmA3)
(-)SofVtOt
(-)(mofl-l(mo/L)(mfl/L)(-)(y/n)(vws)
(-)(-)
(ug/ko)
(yoare)
(gm*2)(om*2){-)
(O/ft-a/yr)(!>yyr)
(a«-2M)(O r)
(om-2M)(own
(0\rJin-3.Vr)
(LVJ(uort.)
NOW*
(1)R«vi, V..«xlJ. A. Jehnton. 1994, VLEACH: A orw-dlmarakirwl finite dNtaranc* vadOM zora iMcMngmod*, V«ion2.1, DtvMop tar USEPA. April 6, 1994. Version 2.2a updated by RMhid l»Mm. Jun*
(2) 0.25 of annual precipitation i» 11 In/yr.(3) Soil conoantrution dtocratMd b«Md on availabla daU as pnManUd tn atlacrwd Input fto.(4) LaGrtga. M. D., P. L Budungham, end J. C Evan*. 1994. Hazardous Wa*tt M*nag«mant Maw York: M(6) VLEACH Mnulrton nuuKs from initial time slap (f 1 .0 yrs) untus spactfiad otharwiM.(7)OMainadfrorndaDtriignMMr(rian35faat, towthtn lOSfaat, RI Raport Data.(B) Conan, R, M.. J. W htarofr, John Matthawt. DNAPL SHa Evaluation. CRC Prass: Boca Ralon. FL. TaMa(9) Eittnatad using cross wctton S-S', Fig. 39, RI Report. 1997.
J:\RODALE\TIWOOALE3.WB2 P»9« 1 of 1 07/31
,101:0622

PktmpOOO.inp
RODALE FDL VADOSE ZONE LEACHING1
1.0 99. 1.0 10.126. .3630 1000. .7200
PLYGON1600. 2.5 .92 1.510 .4310 .3350 .0001946
0. 0. 0.42Y 0.01 01 15.002 02 14.103 03 12.404 04 10.905 05 09.606 06 08.507 07 07.508 08 07.009 09 10.910 10 26.311 11 63.812 12 154.313 13 240.14 14 273.15 15 353.16 16 457.17 17 520.18 18 542.19 19 588.20 20 638.21 21 692.22 22 751.23 23 815.24 24 885.25 25 960.26 26 1000.27 27 10000.28 28 1400000.29 29 500000.30 30 100000.31 31 50000.32 32 20000.33 33 10000.34 34 3873.35 35 1500.36 36 1 00.37 37 1225.38 38 1000.39 39 1000.40 40 1000.41 41 1000.42 42 1000.
Page 1.R.1H0623
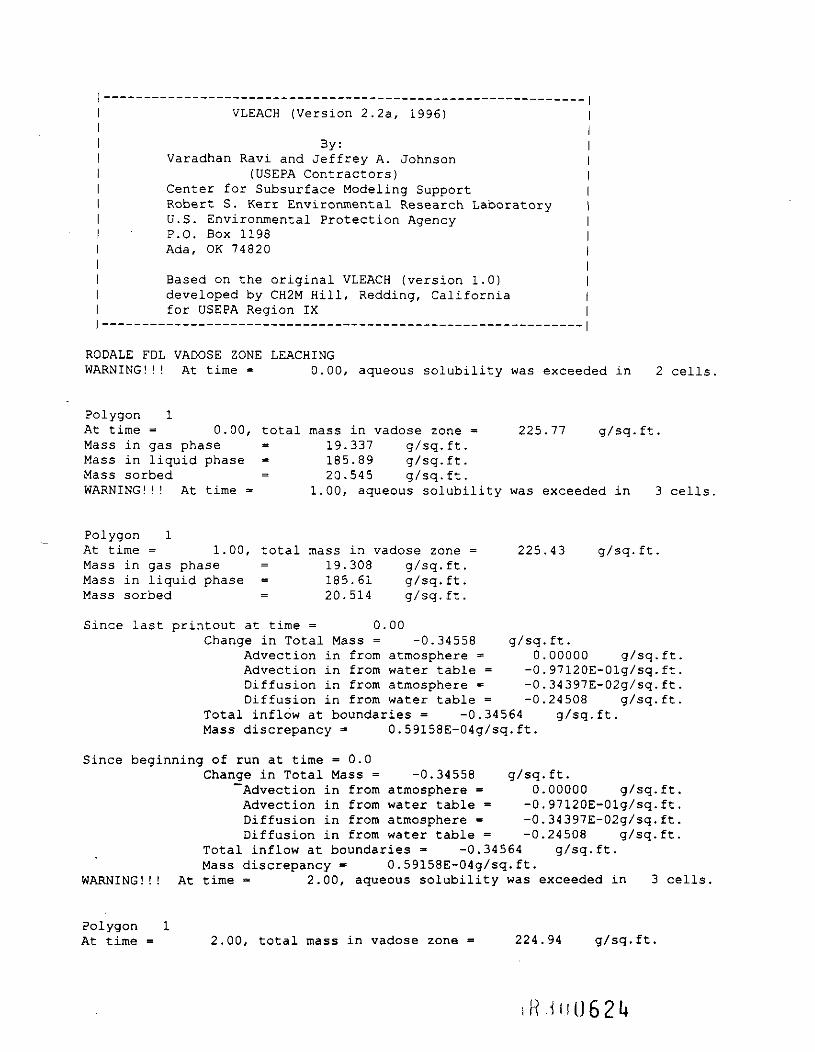
VLEACH (Version 2.2a, 1996)
By:Varadhan Ravi and Jeffrey A. Johnson
(USEPA Contractors)Center for Subsurface Modeling SupportRobert S. Kerr Environmental Research LaboratoryU.S. Environmental Protection AgencyP.O. Box 1198Ada, OK 74820
Based on the original VLEACH (version 1.0)developed by CH2M Hill, Redding, Californiafor USEPA Region IX
RODALE FDL VADOSE ZONE LEACHINGWARNING!!! At time = 0.00, aqueous solubility was exceeded in 2 cells
Polygon 1At time - 0.00, total mass in vadose zone - 225.77 g/sq.ft.Mass in gas phase - 19.337 g/sq.ft.Mass in liquid phase = 185.89 g/sq.ft.Mass sorbed = 20.545 g/sq.ft.WARNING!!! At time = 1.00, aqueous solubility was exceeded in 3 cells,
Polygon 1At time = 1.00, total mass in vadose zone = 225.43 g/sq.ft.Mass in gas phase = 19.308 g/sq.ft.Mass in liquid phase = 185.61 g/sq.ft.Mass sorbed = 20.514 g/sq.ft.
Since last printout at time = 0.00Change in Total Mass = -0.34558 g/sq.ft.
Advection in from atmosphere = 0.00000 g/sq.ft.Advection in from water table = -0.97120E-01g/sq.ft.Diffusion in from atmosphere * -0.34397E-02g/sq.ft.Diffusion in from water table - -0.24508 g/sq.ft.
Total inflow at boundaries = -0.34564 g/sq.ft.Mass discrepancy * 0.59158E-04g/sq.ft.
Since beginning of run at time = 0.0Change in Total Mass = -0.34558 g/sq.ft.
""Advection in from atmosphere = 0.00000 g/sq.ft.Advection in from water table = -0.97120E-01g/sq.ft.Diffusion in from atmosphere * -0.34397E-02g/sq.ft.Diffusion in from water table = -0.24508 g/sq.ft.
Total inflow at boundaries = -0.34564 g/sq.ft.Mass discrepancy - 0.59158E-04g/sq.ft.
WARNING!!! At time - 2.00, aqueous solubility was exceeded in 3 cells.
Polygon 1At time = 2.00, total mass in vadose zone = 224.94 g/sq.ft.

Mass in gas phase = 19.266 g/sq.ft.Mass in liquid phase = 185.21 g/sq.ft.Mass sorbed = 20.469 g/sq.ft.
Since last printout at time = 1.00Change in Total Mass = -0.48898 g/sq.ft.
Advection in from atmosphere = 0.00000 g/sq.ft.Advection in from water table = -0.12839 g/sq.ft.Diffusion in from atmosphere = -0.35560E-02g/sq.ft.Diffusion in from water table = -0.35698 g/sq.ft.
Total inflow at boundaries = -0.48893 g/sq.ft.Mass discrepancy = -0.53823E-04g/sq.ft.
Since beginning of run at time =0.0Change in Total Mass = -0.83456 g/sq.ft.
Advection in from atmosphere = 0.00000 g/sq.ft.Advection in from water table = -0.22551 g/sq.ft.Diffusion in from atmosphere = -0.69957E-02g/sq.ft.Diffusion in from water table = -0.60206 g/sq.ft.
Total inflow at boundaries = -0.83457 g/sq.ft.Mass discrepancy = 0.53644E-05g/sq.ft.
WARNING!!! At time = 3.00, aqueous solubility was exceeded in 3 cells
Polygon 1At time = 3.00, total mass in vadose zone = 224.21 g/sq.ft.Mass in gas phase = 19.203 g/sq.ft.Mass in liquid phase = 184.60 g/sq.ft.Mass sorbed = 20.402 g/sq.ft.
Since last printout at time = 2.00Change in Total Mass = -0.73318 g/sq.ft.
Advection in from atmosphere = 0.00000 g/sq.ft.Advection in from water table = -0.21504 g/sq.ft.Diffusion in from atmosphere = -0.35545E-02g/sq.ft.Diffusion in from water table = -0.51461 g/sq.ft.
Total inflow at boundaries = -0.73320 g/sq.ft.Mass discrepancy = 0.15318E-04g/sq.ft.
Since beginning of run at time = 0.0Change in Total Mass = -1.5677 g/sq.ft.
Advection in from atmosphere * 0.00000 g/sq.ft.Advection in from water table = -0.44055 g/sq.ft.Diffusion in from atmosphere - -0.10550E-01g/sq.ft.Diffusion in from water table - -1.1167 g/sq.ft.
Total inflow at boundaries - -1.5678 g/sq.ft.Mass* discrepancy = 0.20742E-04g/sq.ft.
WARNING!!! At time = 4.00, aqueous solubility was exceeded in 3 cells.
Polygon 1At time = 4.00, total mass in vadose zone = 223.07 g/sq.ft.Mass in gas phase - 19.105 g/sq.ft.Mass in liquid phase = 183.66 g/sq.ft.Mass sorbed = 20.299 g/sq.ft.
Since last printout at time = 3.00
H 1D0625
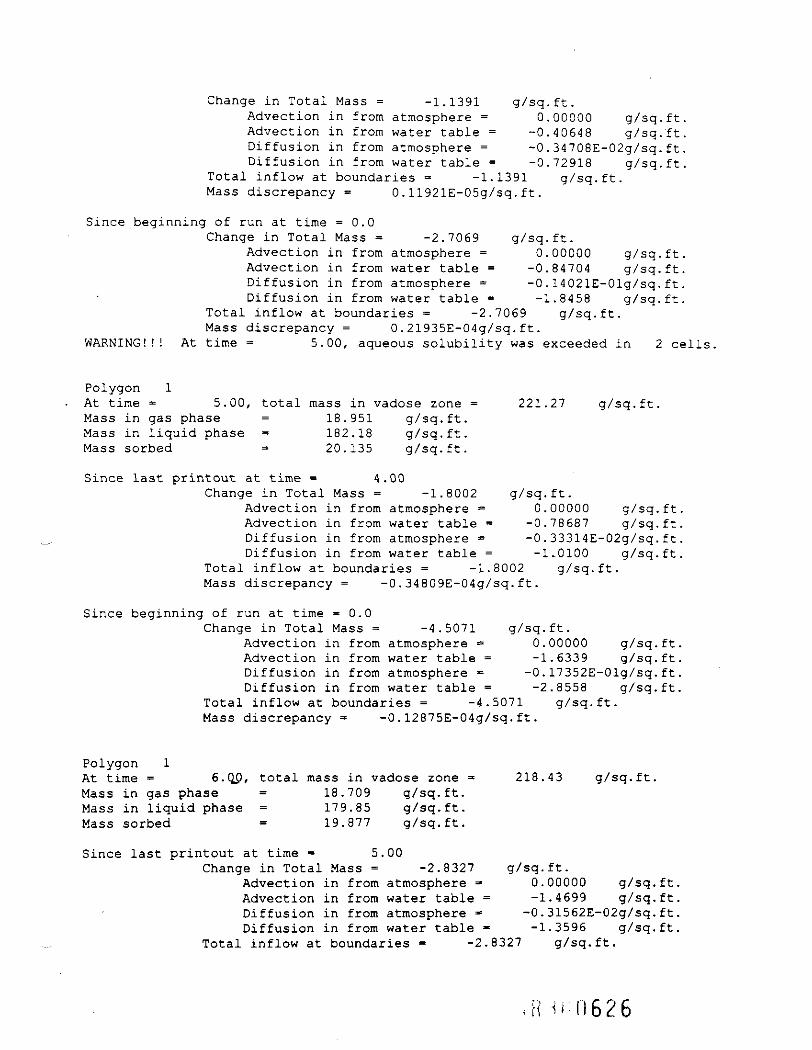
Change in Total Mass = -1.1391 g/sq.ft.Advection in from atmosphere = 0.00000 g/sq.ft.Advection in from water table = -0.40648 g/sq.ft.Diffusion in from atmosphere = -0.34708E-02g/sq.ft.Diffusion in from water table = -0.72918 g/sq.ft.
Total inflow at boundaries = -1.1391 g/sq.ft.Mass discrepancy = 0.11921E-05g/sq.ft.
Since beginning of run at time = 0.0Change in Total Mass = -2.7069 g/sq.ft.
Advection in from atmosphere = 0.00000 g/sq.ft.Advection in from water table = -0.84704 g/sq.ft.Diffusion in from atmosphere = -0.14021E-01g/sq.ft.Diffusion in from water table « -1.8458 g/sq.ft.
Total inflow at boundaries = -2.7069 g/sq.ft.Mass discrepancy = 0.21935E-04g/sq.ft.
WARNING!!! At time = 5.00, aqueous solubility was exceeded in 2 cells
Polygon 1At time = 5.00, total mass in vadose zone = 221.27 g/sq.ft.Mass in gas phase = 18.951 g/sq.ft.Mass in liquid phase = 182.18 g/sq.ft.Mass sorbed = 20.135 g/sq.ft.
Since last printout at time = 4.00Change in Total Mass = -1.8002 g/sq.ft.
Advection in from atmosphere = 0.00000 g/sq.ft.Advection in from water table = -0.78687 g/sq.ft.Diffusion in from atmosphere = -0.33314E-02g/sq.ft.Diffusion in from water table = -1,0100 g/sq.ft.
Total inflow at boundaries = -1.8002 g/sq.ft.Mass discrepancy = -0.34809E-04g/sq.ft.
Since beginning of run at time = 0.0Change in Total Mass = -4.5071 g/sq.ft.
Advection in from atmosphere = 0.00000 g/sq.ft.Advection in from water table = -1.6339 g/sq.ft.Diffusion in from atmosphere = -0.17352E-01g/sq.ft.Diffusion in from water table = -2.8558 g/sq.ft.
Total inflow at boundaries = -4.5071 g/sq.ft.Mass discrepancy = -0.12875E-04g/sq.ft.
Polygon 1At time - 6.0J), total mass in vadose zone =• 218.43 g/sq.ft.Mass in gas phase = 18.709 g/sq.ft.Mass in liquid phase = 179.85 g/sq.ft.Mass sorbed = 19.877 g/sq.ft.
Since last printout at time = 5.00Change in Total Mass = -2.8327 g/sq.ft.
Advection in from atmosphere =• 0.00000 g/sq.ft.Advection in from water table = -1.4699 g/sq.ft.Diffusion in from atmosphere - -0.31562E-02g/sq.ft.Diffusion in from water table - -1.3596 g/sq.ft.
Total inflow at boundaries - -2.8327 g/sq.ft.
626
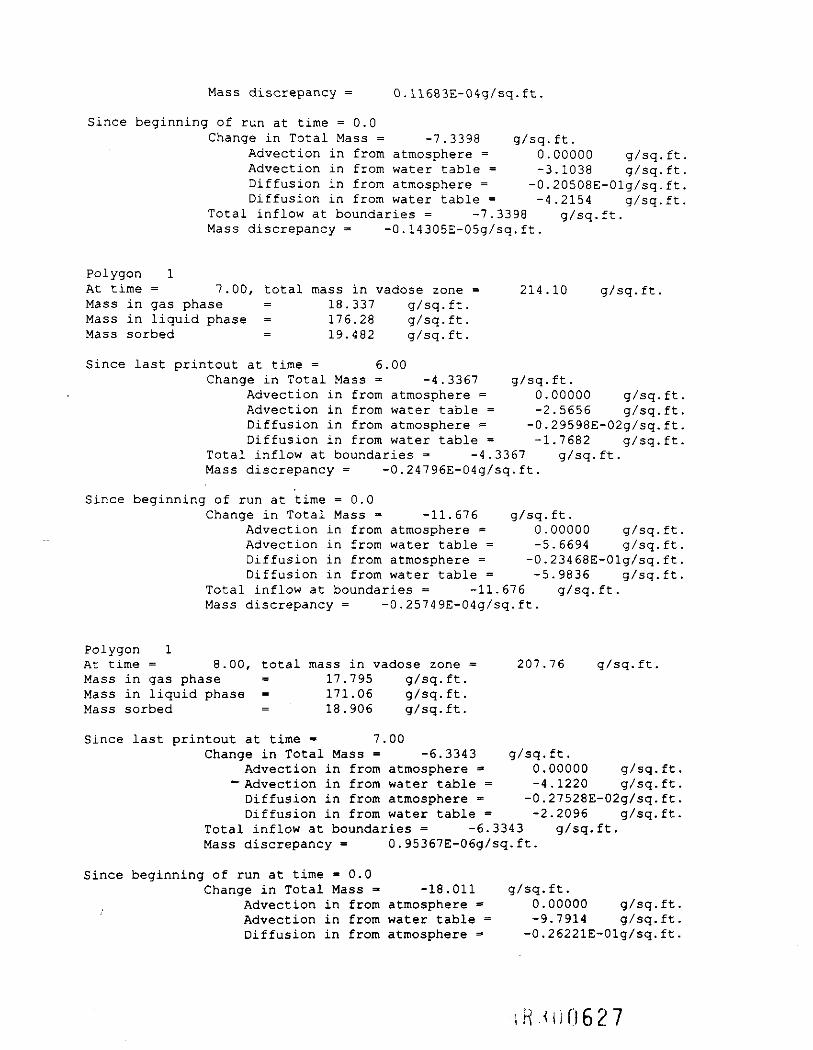
Mass discrepancy = 0.11683E-04g/sq.ft.
Since beginning of run at time =0.0Change in Total Mass = -7.3398 g/sq.ft.
Advection in from atmosphere = 0.00000 g/sq.ftAdvection in from water table = -3.1038 g/sq.ftDiffusion in from atmosphere = -0.20508E-01g/sq.ftDiffusion in from water table = -4.2154 g/sq.ft
Total inflow at boundaries = -7.3398 g/sq.ft.Mass discrepancy = -0.14305E-05g/sq.ft.
Polygon 1At time = 7.00, total mass in vadose zone = 214.10 g/sq.ft.Mass in gas phase = 18.337 g/sq.ft.Mass in liquid phase = 176.28 g/sq.ft.Mass sorbed = 19.482 g/sq.ft.
Since last printout at time = 6.00Change in Total Mass = -4.3367 g/sq.ft.
Advection in from atmosphere = 0.00000 g/sq.ft.Advection in from water table = -2.5656 g/sq.ft.Diffusion in from atmosphere - -0.29598E-02g/sq.ft.Diffusion in from water table = -1.7682 g/sq.ft.
Total inflow at boundaries = -4.3367 g/sq.ft.Mass discrepancy = -0.24796E-04g/sq.ft.
Since beginning of run at time = 0.0Change in Total Mass = -11.676 g/sq.ft.
Advection in from atmosphere * 0.00000 g/sq.ft.Advection in from water table = -5.6694 g/sq.ft.Diffusion in from atmosphere = -0.23468E-01g/sq.ft.Diffusion in from water table = -5.9836 g/sq.ft.
Total inflow at boundaries = -11.676 g/sq.ft.Mass discrepancy = -0.25749E-04g/sq.ft.
Polygon 1At time = 8.00, total mass in vadose zone = 207.76 g/sq.ft.Mass in gas phase = 17.795 g/sq.ft.Mass in liquid phase = 171.06 g/sq.ft.Mass sorbed = 18.906 g/sq.ft.
Since last printout at time = 7.00Change in Total Mass = -6.3343 g/sq.ft.
Advection in from atmosphere * 0.00000 g/sq.ft""Advection in from water table = -4.1220 g/sq.ftDiffusion in from atmosphere = -0.27528E-02g/sq.ftDiffusion in from water table = -2.2096 g/sq.ft.
Total inflow at boundaries = -6.3343 g/sq.ft.Mass discrepancy = 0.95367E-06g/sq.ft.
Since beginning of run at time =0.0Change in Total Mass = -18.011 g/sq.ft.
Advection in from atmosphere - 0.00000 g/sq.ft.Advection in from water table = -9.7914 g/sq.ft.Diffusion in from atmosphere =• -0.26221E-01g/sq.ft.
iR.<D0627
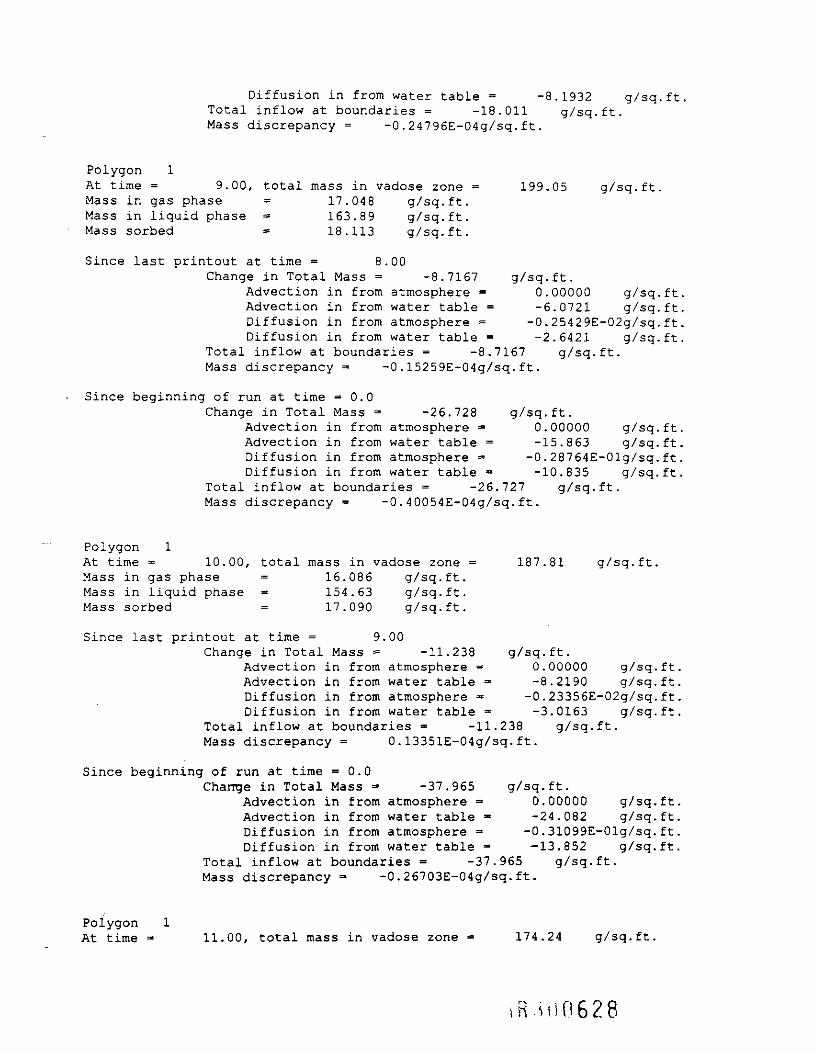
Diffusion in from water table = -8.1932 g/sq.ftTotal inflow at boundaries - -18.011 g/sq.ft.Mass discrepancy = -0.24796E-04g/sq.ft.
Polygon 1At time = 9.00, total mass in vadose zone = 199.05 g/sq.ft.Mass in gas phase = 17.048 g/sq.ft.Mass in liquid phase - 163.89 g/sq.ft.Mass sorbed = 18.113 g/sq.ft.
Since last printout at time = 8.00Change in Total Mass = -8.7167 g/sq.ft.
Advection in from atmosphere = 0.00000 g/sq.ft.Advection in from water table = -6.0721 g/sq.ft.Diffusion in from atmosphere = -0.25429E-02g/sq.ft.Diffusion in from water table = -2.6421 g/sq.ft.
Total inflow at boundaries = -8.7167 g/sq.ft.Mass discrepancy = -0.15259E^04g/sq.ft.
Since beginning of run at time =0.0Change in Total Mass = -26.728 g/sq.ft.
Advection in from atmosphere = 0.00000 g/sq.ft.Advection in from water table = -15.863 g/sq.ft.Diffusion in from atmosphere = -0.28764E-01g/sq.ft.Diffusion in from water table = -10.835 g/sq.ft.
Total inflow at boundaries = -26.727 g/sq.ft.Mass discrepancy = -0.40054E-04g/sq.ft.
Polygon 1At time = 10.00, total mass in vadose zone = 187.81 g/sq.ft.Mass in gas phase = 16.086 g/sq.ft.Mass in liquid phase = 154.63 g/sq.ft.Mass sorbed = 17.090 g/sq.ft.
Since last printout at time = 9.00Change in Total Mass = -11.238 g/sq.ft.
Advection in from atmosphere =* 0 . 00000 g/sq. ft.Advection in from water table = -8.2190 g/sq.ft.Diffusion in from atmosphere = -0.23356E-02g/sq.ft.Diffusion in from water table = -3.0163 g/sq.ft.
Total inflow at boundaries - -11.238 g/sq.ft.Mass discrepancy = 0.13351E-04g/sq.ft.
Since beginning of run at time =0.0Change in Total Mass = -37.965 g/sq.ft.
Advection in from atmosphere = 0.00000 g/sq.ft.Advection in from water table - -24.082 g/sq.ft.Diffusion in from atmosphere = -0.31099E-01g/sq.ft.Diffusion in from water table - -13.852 g/sq.ft.
Total inflow at boundaries = -37.965 g/sq.ft.Mass discrepancy - -0.26703E-04g/sq.ft.
Polygon 1At time =• 11.00, total mass in vadose zone = 174.24 g/sq.ft.
R Hi0628
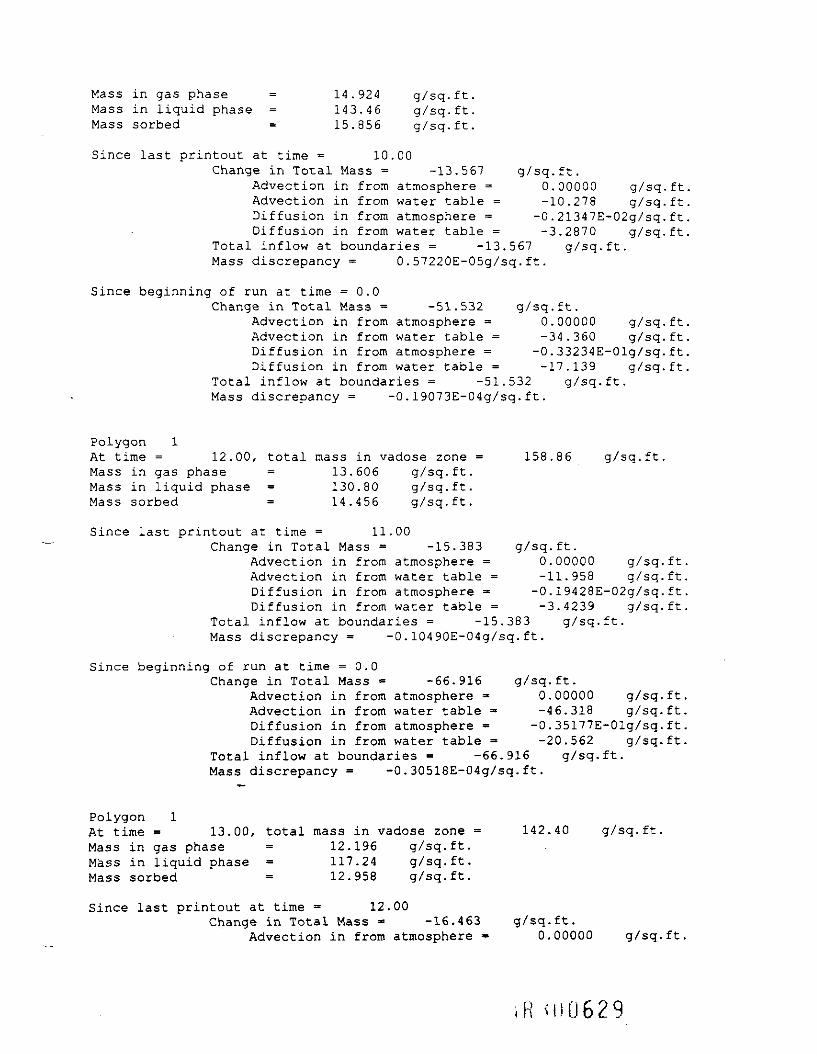
Mass in gas phase = 14.924 g/sq.ft.Mass in liquid phase = 143.46 g/sq.ft.Mass sorbed = 15.856 g/sq.ft.
Since last printout at time = 10.00Change in Total Mass = -13.567 g/sq.ft.
Advection in from atmosphere = 0.00000 g/sq.ftAdvection in from water table = -10.278 g/sq.ftDiffusion in from atmosphere = -0.21347E-02g/sq.ftDiffusion in from water table = -3.2870 g/sq.ft
Total inflow at boundaries = -13.567 g/sq.ft.Mass discrepancy = 0.57220E-05g/sq.ft.
Since beginning of run at time = 0.0Change in Total Mass = -51.532 g/sq.ft.
Advection in from atmosphere = 0.00000 g/sq.ftAdvection in from water table = -34.360 g/sq.ftDiffusion in from atmosphere = -0.33234E-01g/sq.ft,Diffusion in from water table = -17.139 g/sq.ft,
Total inflow at boundaries = -51.532 g/sq.ft.Mass discrepancy = -0.19073E-04g/sq.ft.
Polygon 1At time = 12.00, total mass in vadose zone = 158.86 g/sq.ft.Mass in gas phase = 13.606 g/sq.ft.Mass in liquid phase = 130.80 g/sq.ft.Masssorbed = 14.456 g/sq.ft.
Since last printout at time = 11.00Change in Total Mass = -15.383 g/sq.ft.
Advection in from atmosphere = 0.00000 g/sq.ftAdvection in from water table = -11.958 g/sq.ftDiffusion in from atmosphere - -0.19428E-02g/sq.ftDiffusion in from water table = -3.4239 g/sq.ft
Total inflow at boundaries = -15.383 g/sq.ft.Mass discrepancy = -0.10490E-04g/sq.ft.
Since beginning of run at time = 0.0Change in Total Mass = -66.916 g/sq.ft.
Advection in from atmosphere = 0.00000 g/sq.ft,Advection in from water table * -46.318 g/sq.ft,Diffusion in from atmosphere = -0.35177E-01g/sq.ft.Diffusion in from water table = -20.562 g/sq.ft.
Total inflow at boundaries = -66.916 g/sq.ft.Mass discrepancy = -0.30518E-04g/sq.ft.
Polygon 1At time = 13.00, total mass in vadose zone = 142.40 g/sq.ft.Mass in gas phase = 12.196 g/sq.ft.Mass in liquid phase = 117.24 g/sq.ft.Mass sorbed = 12.958 g/sq.ft.
Since last printout at time = 12.00Change in Total Mass * -16.463 g/sq.ft.
Advection in from atmosphere - 0.00000 g/sq.ft
R (U0629
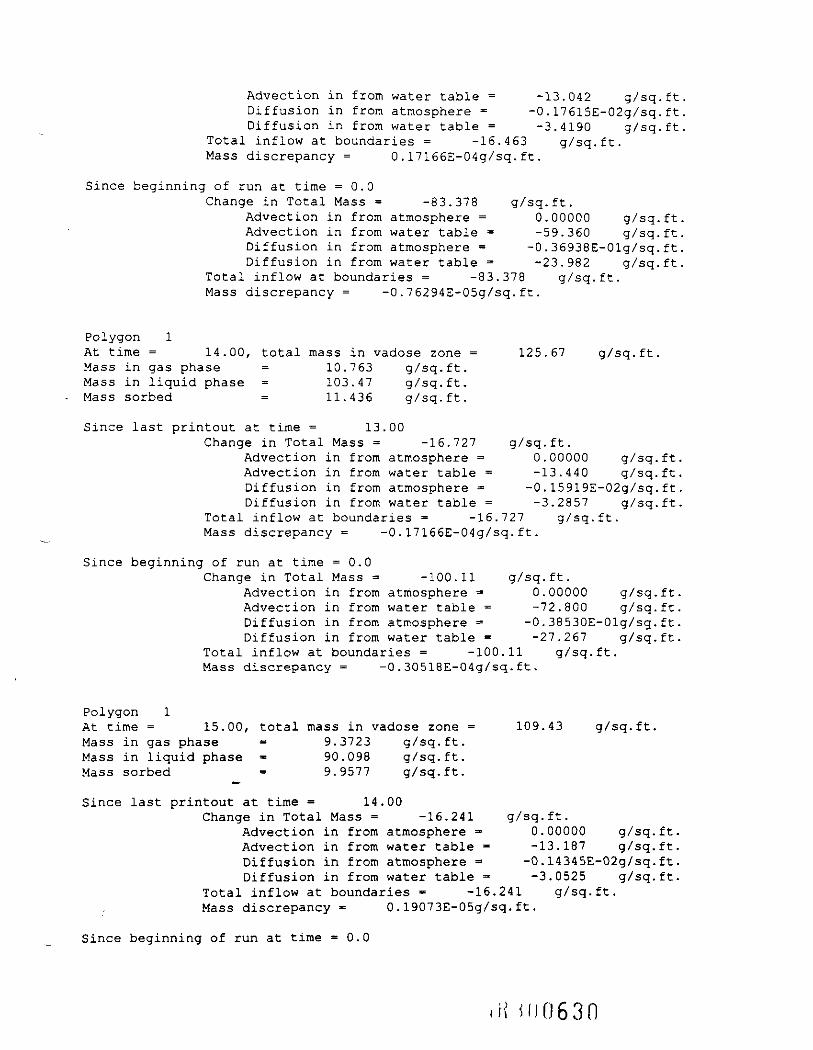
Advection in from water table = -13.042 g/sq.ftDiffusion in from atmosphere = -0.17615E-02g/sq.ftDiffusion in from water table = -3.4190 g/sq.ft
Total inflow at boundaries = -16.463 g/sq.ft.Mass discrepancy = 0.17166E-04g/sq.ft.
Since beginning of run at time =0.0Change in Total Mass = -83.378 g/sq.ft.
Advection in from atmosphere = 0.00000 g/sq.ft.Advection in from water table = -59.360 g/sq.ft.Diffusion in from atmosphere = -0.36938E-01g/sq.ft.Diffusion in from water table = -23.982 g/sq.ft.
Total inflow at boundaries = -83.378 g/sq.ft.Mass discrepancy = -0.76294E-05g/sq.ft.
Polygon 1At time = 14.00, total mass in vadose zone = 125.67 g/sq.ft.Mass in gas phase = 10.763 g/sq.ft.Mass in liquid phase = 103.47 g/sq.ft.Mass sorbed = 11.436 g/sq.ft.
Since last printout at time = 13.00Change in Total Mass = -16.727 g/sq.ft.
Advection in from atmosphere = 0.00000 g/sq.ftAdvection in from water table = -13.440 g/sq.ftDiffusion in from atmosphere = -0.15919E-02g/sq.ftDiffusion in from water table = -3.2857 g/sq.ft
Total inflow at boundaries = -16.727 g/sq.ft.Mass discrepancy = -0.17166E-04g/sq.ft.
Since beginning of run at time = 0.0Change in Total Mass = -100.11 g/sq.ft.
Advection in from atmosphere =* 0.00000 g/sq.ft.Advection in from water table = -72.800 g/sq.ft,Diffusion in from atmosphere = -0.38530E-01g/sq.ft.Diffusion in from water table = -27.267 g/sq.ft.
Total inflow at boundaries = -100.11 g/sq.ft.Mass discrepancy = -0.30518E-04g/sq.ft.
Polygon 1At time = 15.00, total mass in vadose zone = 109.43 g/sq.ft.Mass in gas phase = 9.3723 g/sq.ft.Mass in liquid phase =- 90.098 g/sq.ft.Mass sorbed = 9.9577 g/sq.ft.
Since last printout at time = 14.00Change in Total Mass = -16.241 g/sq.ft.
Advection in from atmosphere =* 0.00000 g/sq.ftAdvection in from water table - -13.187 g/sq.ftDiffusion in from atmosphere = -0.14345E-02g/sq.ftDiffusion in from water table = -3.0525 g/sq.ft
Total inflow at boundaries -= -16.241 g/sq.ft.Mass discrepancy = 0.19073E-05g/sq.ft.
Since beginning of run at time =0.0
ii)0630

Change in Total Mass = -116.35 g/sq.ft.Advection in from atmosphere = 0.00000 g/sq.ftAdvection in from water table = -85.987 g/sq.ftDiffusion in from atmosphere = -0.39965E-01g/sq.ftDiffusion in from water table = -30.320 g/sq.ft
Total inflow at boundaries = -116.35 g/sq.ft.Mass discrepancy = -0.22888E-04g/sq.ft.
Polygon 1At time = 16.00, total mass in vadose zone = 94.259 g/sq.ft.Mass in gas phase = 8.0732 g/sq.ft.Mass in liquid phase = 77.609 g/sq.ft.Mass sorbed = 8.5774 g/sq.ft.
Since last printout at time = 15.00Change in Total Mass = -15.169 g/sq.ft.
Advection in from atmosphere = 0.00000 g/sq.ft.Advection in from water table = -12.412 g/sq.ft.Diffusion in from atmosphere = -0.12893E-02g/sq.ft.Diffusion in from water table = -2.7554 g/sq.ft.
Total inflow at boundaries = -15.169 g/sq.ft.Mass discrepancy = -0.57220E-05g/sq.ft.
Since beginning of run at time = 0.0Change in Total Mass = -131.52 g/sq.ft.
Advection in from atmosphere = 0.00000 g/sq.ft.Advection in from water table = -98.399 g/sq.ft.Diffusion in from atmosphere = -0.41254E-Olg/sq.ft.Diffusion in from water table = -33.075 g/sq.ft.
Total inflow at boundaries = -131.51 g/sq.ft.Mass discrepancy = -0.30518E-04g/sq.ft.
Polygon 1At time = 17.00, total mass in vadose zone = 80.542 g/sq.ft.Mass in gas phase = 6.8983 g/sq.ft.Mass in liquid phase = 66.314 g/sq.ft.Mass sorbed = 7.3291 g/sq.ft.
Since last printout at time = 16.00Change in Total Mass = -13.718 g/sq.ft.
Advection in from atmosphere = 0.00000 g/sq.ft.Advection in from water table = -11.288 g/sq.ft.Diffusion in from atmosphere = -0.11562E-02g/sq.ft.Diffusion in from water table = -2.4290 g/sq.ft.
Total inflow at boundaries = -13.718 g/sq.ft.Mass discrepancy = -0.95367E-06g/sq.ft.
Since beginning of run at time = 0.0Change in Total Mass - -145.23 g/sq.ft.
Advection in from atmosphere = 0.00000 g/sq.ft.Advection in from water table = -109.69 g/sq.ft.Diffusion in from atmosphere = -0.42411E-01g/sq.ft.Diffusion in from water table = -35.504 g/sq.ft.
Total inflow at boundaries = -145.23 g/sq.ft.Mass discrepancy = -0.30518E-04g/sq.ft.
R.UI063
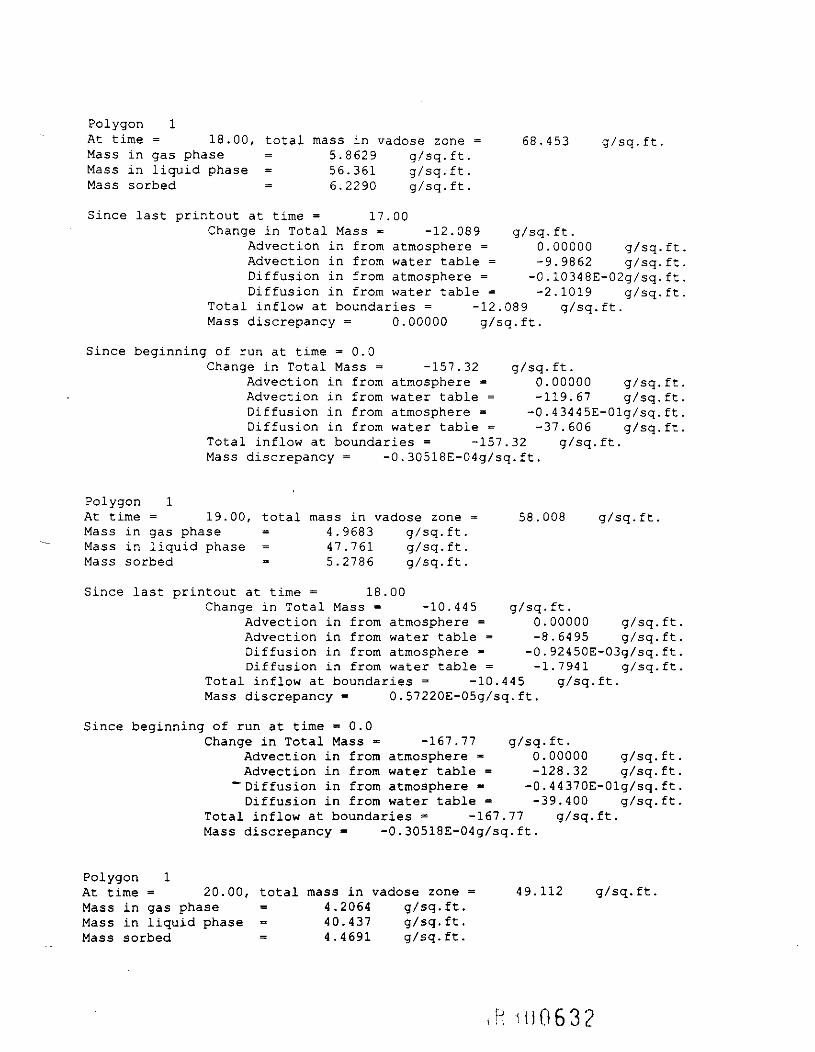
Polygon 1At time = 18.00, total mass in vadose zone = 68.453 g/sq.ft.Mass in gas phase = 5.8629 g/sq.ft.Mass in liquid phase = 56.361 g/sq.ft.Mass sorbed = 6.2290 g/sq.ft.
Since last printout at time = 17.00Change in Total Mass = -12.089 g/sq.ft.
Advection in from atmosphere = 0.00000 g/sq.ftAdvection in from water table = -9.9862 g/sq.ftDiffusion in from atmosphere = -0.10348E-02g/sq.ftDiffusion in from water table = -2.1019 g/sq.ft
Total inflow at boundaries = -12.089 g/sq.ft.Mass discrepancy - 0.00000 g/sq.ft.
Since beginning of run at time =0.0Change in Total Mass = -157.32 g/sq.ft.
Advection in from atmosphere = 0.00000 g/sq.ft,Advection in from water table = -119.67 g/sq.ft,Diffusion in from atmosphere = -0.43445E-01g/sq.ft,Diffusion in from water table = -37.606 g/sq.ft.
Total inflow at boundaries = -157.32 g/sq.ft.Mass discrepancy = -0.30518E-04g/sq.ft.
Polygon 1At time = 19.00, total mass in vadose zone = 58.008 g/sq.ft.Mass in gas phase = 4.9683 g/sq.ft.Mass in liquid phase = 47.761 g/sq.ft.Mass sorbed = 5.2786 g/sq.ft.
Since last printout at time = 18.00Change in Total Mass = -10.445 g/sq.ft.
Advection in from atmosphere = 0.00000 g/sq.ft.Advection in from water table = -8.6495 g/sq.ft.Diffusion in from atmosphere = -0.92450E-03g/sq.ft.Diffusion in from water table = -1.7941 g/sq.ft.
Total inflow at boundaries = -10.445 g/sq.ft.Mass discrepancy = 0.57220E-05g/sq.ft.
Since beginning of run at time = 0.0Change in Total Mass » -167.77 g/sq.ft.
Advection in from atmosphere =• 0.00000 g/sq.ft.Advection in from water table = -128.32 g/sq.ft.
"Diffusion in from atmosphere = -0.44370E-01g/sq. ft.Diffusion in from water table = -39.400 g/sq.ft.
Total inflow at boundaries * -167.77 g/sq.ft.Mass discrepancy - -0.30518E-04g/sq.ft.
Polygon 1At time = 20.00, total mass in vadose zone = 49.112 g/sq.ft.Mass in gas phase = 4.2064 g/sq.ft.Mass in liquid phase = 40.437 g/sq.ft.Mass sorbed = 4.4691 g/sq.ft.
10063?
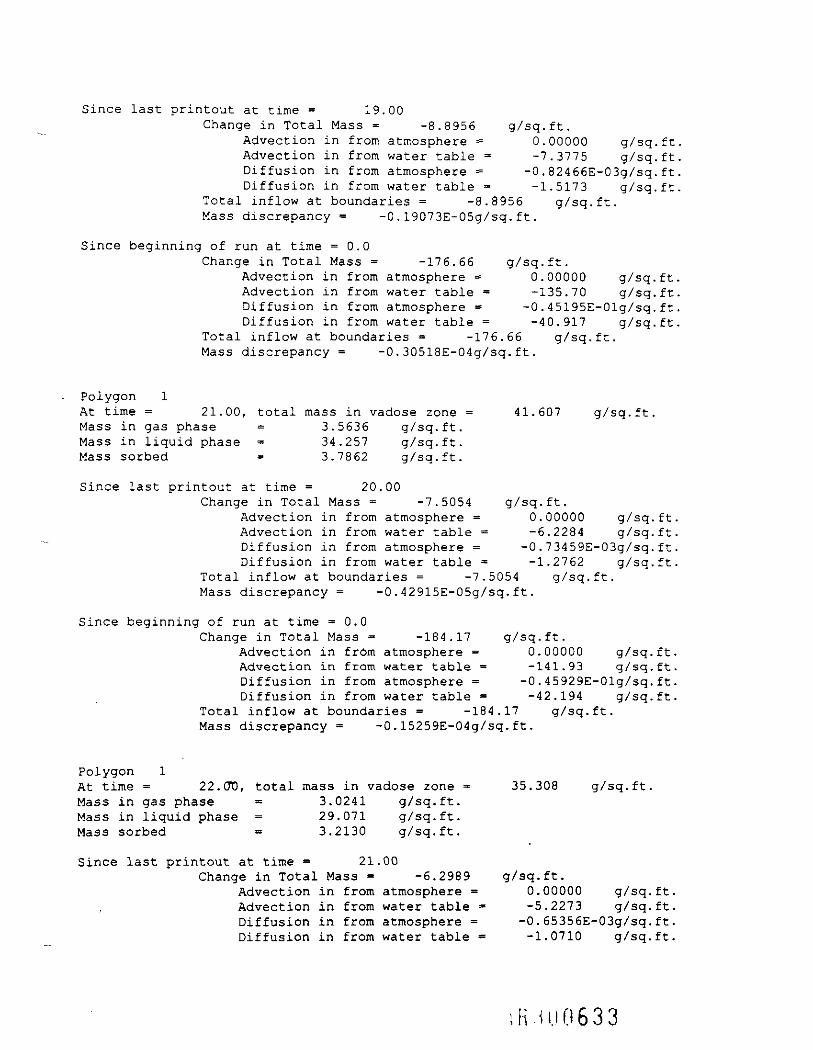
Since last printout at time = 19.00Change in Total Mass = -8.8956 g/sq.ft.
Advection in from atmosphere = 0.00000 g/sq.ftAdvection in from water table = -7.3775 g/sq.ftDiffusion in from atmosphere = -0.82466E-03g/sq.ftDiffusion in from water table = -1.5173 g/sq.ft
Total inflow at boundaries = -8.8956 g/sq.ft.Mass discrepancy = -0.19073E-05g/sq.ft.
Since beginning of run at time = 0.0Change in Total Mass = -176.66 g/sq.ft.
Advection in from atmosphere = 0.00000 g/sq.ft.Advection in from water table = -135.70 g/sq.ft.Diffusion in from atmosphere * -0.45195E-01g/sq.ft,Diffusion in from water table = -40.917 g/sq.ft.
Total inflow at boundaries = -176.66 g/sq.ft.Mass discrepancy = -0.30518E-04g/sq.ft.
Polygon 1At time = 21.00, total mass in vadose zone = 41.607 g/sq.ft.Mass in gas phase = 3.5636 g/sq.ft.Mass in liquid phase = 34.257 g/sq.ft.Mass sorbed = 3.7862 g/sq.ft.
Since last printout at time = 20.00Change in Total Mass = -7.5054 g/sq.ft.
Advection in from atmosphere = 0.00000 g/sq.ft.Advection in from water table = -6.2284 g/sq.ft.Diffusion in from atmosphere = -0.73459E-03g/sq.ft.Diffusion in from water table = -1.2762 g/sq.ft.
Total inflow at boundaries = -7.5054 g/sq.ft.Mass discrepancy = -0.42915E-05g/sq.ft.
Since beginning of run at time = 0.0Change in Total Mass = -184.17 g/sq.ft.
Advection in from atmosphere = 0.00000 g/sq.ft.Advection in from water table = -141.93 g/sq.ft.Diffusion in from atmosphere = -0.45929E-01g/sq.ft.Diffusion in from water table = -42.194 g/sq.ft.
Total inflow at boundaries = -184.17 g/sq.ft.Mass discrepancy = -0.15259E-04g/sq.ft.
Polygon 1At time = 22.OD, total mass in vadose zone = 35.308 g/sq.ft.Mass in gas phase = 3.0241 g/sq.ft.Mass in liquid phase = 29.071 g/sq.ft.Mass sorbed = 3.2130 g/sq.ft.
Since last printout at time = 21.00Change in Total Mass = -6.2989 g/sq.ft.
Advection in from atmosphere = 0.00000 g/sq.ft.Advection in from water table =• -5.2273 g/sq.ft.Diffusion in from atmosphere = -0.65356E-03g/sq.ft.Diffusion in from water table * -1.0710 g/sq.ft.
0633

Total inflow at boundaries = -6.2989 g/sq.ft.Mass discrepancy = 0.95367E-06g/sq.ft.
Since beginning of run at time = 0.0Change in Total Mass = -190.47 g/sq.ft.
Advection in from atmosphere = 0.00000 g/sq.ftAdvection in from water table = -147.16 g/sq.ftDiffusion in from atmosphere = -0.46583E-01g/sq.ftDiffusion in from water table = -43.265 g/sq.ft
Total inflow at boundaries = -190.47 g/sq.ft.Mass discrepancy = -0.30518E-04g/sq.ft.
Polygon 1At time = 23.00, total mass in vadose zone = 30.032 g/sq.ft.Mass in gas phase = 2.5722 g/sq.ft.Mass in liquid phase = 24.727 g/sq.ft.Mass sorbed = 2.7329 g/sq.ft.
Since last printout at time = 22.00Change in Total Mass = -5.2757 g/sq.ft.
Advection in from atmosphere = 0.00000 g/sq.ftAdvection in from water table = -4.3764 g/sq.ftDiffusion in from atmosphere = -0.58084E-03g/sq.ftDiffusion in from water table = -0.89877 g/sq.ft.
Total inflow at boundaries = -5.2757 g/sq.ft.Mass discrepancy = 0.47684E-06g/sq.ft.
Since beginning of run at time = 0.0Change in Total Mass = -195.74 g/sq.ft.
Advection in from atmosphere = 0.00000 g/sq.ft,Advection in from water table = -151.53 g/sq.ft,Diffusion in from atmosphere = -0.47164E-01g/sq.ft,Diffusion in from water table = -44.163 g/sq.ft.
Total inflow at boundaries = -195.74 g/sq.ft.Mass discrepancy = -0.15259E-04g/sq.ft.
Polygon 1At time = 24.00, total mass in vadose zone = 25.612 g/sq.ft.Mass in gas phase = 2.1936 g/sq.ft.Mass in liquid phase = 21.088 g/sq.ft.Mass sorbed = 2.3306 g/sq.ft.
Since last printout at time = 23.00Change in Total Mass - -4.4205 g/sq.ft.
"Advection in from atmosphere = 0.00000 g/sq.ftAdvection in from water table *• -3.6644 g/sq.ftDiffusion in from atmosphere = -0.51572E-03g/sq.ftDiffusion in from water table = -0.75554 g/sq.ft
Total inflow at boundaries = -4.4205 g/sq.ft.Mass discrepancy = -0.23842E-05g/sq.ft.
Since beginning of run at time = 0.0Change in Total Mass = -200.16 g/sq.ft.
Advection in from atmosphere = 0.00000 g/sq.ft,Advection in from water table - -155.20 g/sq.ft,
063(4

Diffusion in from atmosphere = -0.47679E-01g/sq.ftDiffusion in from water table - -44.919 g/sq.ft
Total inflow at boundaries = -200.16 g/sq.ft.Mass discrepancy = -0.30518E-04g/sq.ft.
Polygon 1At time = 25.00, total mass in vadose zone = 21.901 g/sq.ft.Mass in gas phase - 1.8757 g/sq.ft.Mass in liquid phase = 18.032 g/sq.ft.Mass sorbed = 1.9929 g/sq.ft.
Since last printout at time = 24.00Change in Total Mass = -3.7113 g/sq.ft.
Advection in from atmosphere = 0.00000 g/sq.ft.Advection in from water table = -3.0740 g/sq.ft.Diffusion in from atmosphere = -0.45751E-03g/sq.ft.Diffusion in from water table - -0.63684 g/sq.ft.
Total inflow at boundaries = -3.7113 g/sq.ft.Mass discrepancy = 0.16689E-05g/sq.ft.
Since beginning of run at time = 0.0Change in Total Mass = -203.87 g/sq.ft.
Advection in from atmosphere *= 0.00000 g/sq.ft.Advection in from water table = -158.27 g/sq.ft.Diffusion in from atmosphere = -0.48137E-01g/sq.ft.Diffusion in from water table = -45.556 g/sq.ft.
Total inflow at boundaries = -203.87 g/sq.ft.Mass discrepancy = -0.15259E-04g/sq.ft.
Polygon 1At time = 26.00, total mass in vadose zone = 18.775 g/sq.ft.Mass in gas phase = 1.6081 g/sq.ft.Mass in liquid phase = 15.459 g/sq.ft.Mass sorbed = 1.7085 g/sq.ft.
Since last printout at time = 25.00Change in Total Mass = -3.1253 g/sq.ft.
Advection in from atmosphere * 0.00000 g/sq.ft.Advection in from water table = -2.5863 g/sq.ft.Diffusion in from atmosphere * -0.40555E-03g/sq.ft.Diffusion in from water table = -0.53851 g/sq.ft.
Total inflow at boundaries = -3.1253 g/sq.ft.Mass discrepancy = -0.16689E-05g/sq.ft.
Since beginning of tun at time = 0.0Change in Total Mass = -207.00 g/sq.ft.
Advection in from atmosphere - 0.00000 g/sq.ft.Advection in from water table = -160.86 g/sq.ft.Diffusion in from atmosphere =• -0.48542E-01g/sq.ft.Diffusion in from water table = -46.094 g/sq.ft -
Total inflow at boundaries = -207.00 g/sq.ft.Mass discrepancy - -0.15259E-04g/sq.ft.
Polygon
0635
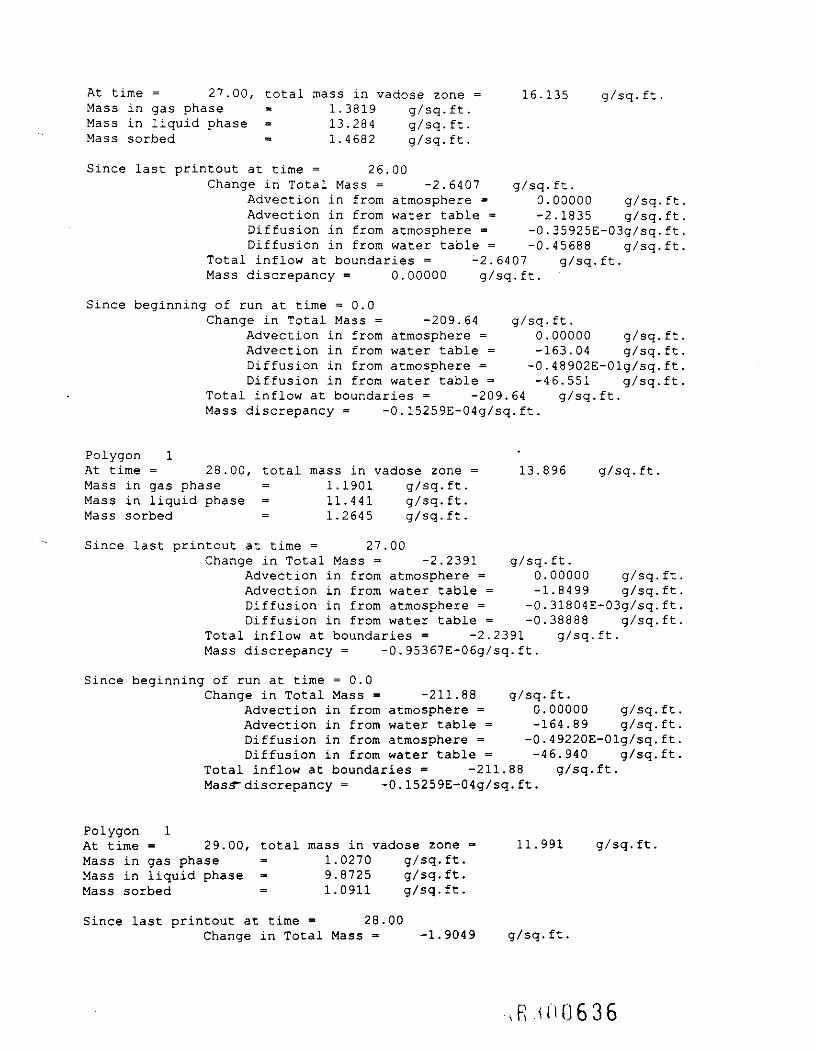
At time = 27.00, total mass in vadose zone = 16.135 g/sq.ft.Mass in gas phase ~ 1.3819 g/sq.ft.Mass in liquid phase = 13.284 g/sq.ft.Mass sorbed = 1.4682 g/sq.ft.
Since last printout at time = 26.00Change in Total Mass = -2.6407 g/sq.ft.
Advection in from atmosphere = 0.00000 g/sq.ftAdvection in from water table = -2.1835 g/sq.ftDiffusion in from atmosphere = -0.35925E-03g/sq.ftDiffusion in from water table = -0.45688 g/sq.ft
Total inflow at boundaries = -2.6407 g/sq.ft.Mass discrepancy = 0.00000 g/sq.ft.
Since beginning of run at time = 0.0Change in Total Mass = -209.64 g/sq.ft.
Advection in from atmosphere = 0.00000 g/sq.ftAdvection in from water table = -163.04 g/sq.ftDiffusion in from atmosphere = -0.48902E-01g/sq.ft,Diffusion in from water table = -46.551 g/sq.ft,
Total inflow at boundaries = -209.64 g/sq.ft.Mass discrepancy = -0.15259E-04g/sq.ft.
Polygon 1At time = 28.00, total mass in vadose zone = 13.896 g/sq.ft.Mass in gas phase = 1.1901 g/sq.ft.Mass in liquid phase = 11.441 g/sq.ft.Mass sorbed = 1.2645 g/sq.ft.
Since last printout at time = 27.00Change in Total Mass = -2.2391 g/sq.ft.
Advection in from atmosphere = 0.00000 g/sq.ft.Advection in from water table = -1.8499 g/sq.ft.Diffusion in from atmosphere = -0.31804E-03g/sq.ft.Diffusion in from water table = -0.38888 g/sq.ft.
Total inflow at boundaries = -2.2391 g/sq.ft.Mass discrepancy = -0.95367E-06g/sq.ft.
Since beginning of run at time = 0.0Change in Total Mass = -211.88 g/sq.ft.
Advection in from atmosphere = 0.00000 g/sq.ft.Advection in from water table = -164.89 g/sq.ft.Diffusion in from atmosphere = -0.49220E-01g/sq.ft.Diffusion in from water table = -46.940 g/sq.ft.
Total inflow at boundaries = -211.88 g/sq.ft.Mass-discrepancy = -0.15259E-04g/sq.ft.
Polygon 1At time = 29.00, total mass in vadose zone = 11.991 g/sq.ftMass in gas phase = 1.0270 g/sq.ft.Mass in liquid phase = 9.8725 g/sq.ft.Mass sorbed = 1.0911 g/sq.ft.
Since last printout at time = 28.00Change in Total Mass = -1.9049 g/sq.ft.
,8,100636

Advection in from atmosphere = 0.00000 g/sq.ftAdvection in from water table = -1.5726 g/sq.ftDiffusion in from atmosphere = -0.28141E-03g/sq.ftDiffusion in from water table = -0.33200 g/sq.ft
Total inflow at boundaries = -1.9049 g/sq.ft.Mass discrepancy = 0.59605E-06g/sq.ft.
Since beginning of run at time =0.0Change in Total Mass = -213.78 g/sq.ft.
Advection in from atmosphere = 0.00000 g/sq.ft.Advection in from water table = -166.46 g/sq.ft,Diffusion in from atmosphere = -0.49501E-01g/sq.ft,Diffusion in from water table - -47.272 g/sq.ft,
Total inflow at boundaries = -213.78 g/sq.ft.Mass discrepancy = -0.15259E-04g/sq.ft.
Polygon 1At time = 30.00, total mass in vadose zone = 10.365 g/sq.ft.Mass in gas phase = 0.88775 g/sq.ft.Mass in liquid phase = 8.5341 g/sq.ft.Mass sorbed = 0.94320 g/sq.ft.
Since last printout at time = 29.00Change in Total Mass = -1.6256 g/sq.ft.
Advection in from atmosphere = 0.00000 g/sq.ft.Advect-ion in from water table = -1.3411 g/sq.ft.Diffusion in from atmosphere = -0.24887E-03g/sq.ft.Diffusion in from water table = -0.28421 g/sq.ft.
Total inflow at boundaries = -1.6256 g/sq.ft.Mass discrepancy = -0.71526E-06g/sq.ft.
Since beginning of run at time = 0.0Change in Total Mass = -215.41 g/sq.ft.
Advection in from atmosphere = 0.00000 g/sq.ft.Advection in from water table = -167.80 g/sq.ft.Diffusion in from atmosphere -' -0.49750E-01g/sq.ft.Diffusion in from water table = -47.556 g/sq.ft.
Total inflow at boundaries = -215.41 g/sq.ft.Mass discrepancy = -0.15259E-04g/sq.ft.
Polygon 1At time = 31.00, total mass in vadose zone = 8.9740 g/sq.ft.Mass in gas phase = 0.76861 g/sq.ft.Mass in liquid phase = 7.3888 g/sq.ft.Mass sorbed " = 0.81662 g/sq.ft.
Since last printout at time = 30.00Change in Total Mass = -1.3911 g/sq.ft.
Advection in from atmosphere = 0.00000 g/sq.ftAdvection in from water table = -1.1469 g/sq.ftDiffusion in from atmosphere = -0.21999E-03g/sq.ftDiffusion in from water table = -0.24391 g/sq.ft
/ Total inflow at boundaries = -1.3911 g/sq.ft.Mass discrepancy - 0.35763E-06g/sq.ft.
R <00637

Since beginning of run at time =0.0Change in Total Mass = -216.80 g/sq.ft.
Advection in from atmosphere = 0.00000 g/sq.ftAdvection in from water table = -168.95 g/sq.ftDiffusion in from atmosphere = -0.49970E-01g/sq.ftDiffusion in from water table = -47.800 g/sq.ft
Total inflow at boundaries = -216.80 g/sq.ft.Mass discrepancy = 0.00000 g/sq.ft.
Polygon 1At time = 32.00, total mass in vadose zone = 7.7807 g/sq.ft.Mass in gas phase = 0.66640 g/sq.ft.Mass in liquid phase = 6.4063 g/sq.ft.Mass sorbed = 0.70803 g/sq.ft.
Since last printout at time = 31.00Change in Total Mass = -1.1933 g/sq.ft.
Advection in from atmosphere = 0.00000 g/sq.ft.Advection in from water table = -0.98338 g/sq.ft.Diffusion in from atmosphere = -0.19439E-03g/sq.ft.Diffusion in from water table = -0.20978 g/sq.ft.
Total inflow at boundaries = -1.1933 g/sq.ft.Mass discrepancy = -0.23842E-06g/sq.ft.
Since beginning of run at time =0.0Change in Total Mass = -217.99 g/sq.ft.
Advection in from atmosphere - 0.00000 g/sq.ft.Advection in from water table = -169.93 g/sq.ft.Diffusion in from atmosphere = -0.50164E-01g/sq.ft.Diffusion in from water table = -48.010 g/sq.ft.
Total inflow at boundaries = -217.99 g/sq.ft.Mass discrepancy = 0.00000 g/sq.ft.
Polygon 1At time = 33.00, total mass in vadose zone - 6.7547 g/sq.ft.Mass in gas phase = 0.57853 g/sq.ft.Mass in liquid phase = 5.5615 g/sq.ft.Mass sorbed = 0.61466 g/sq.ft.
Since last printout at time = 32.00Change in Total Mass = -1.0260 g/sq.ft.
Advection in from atmosphere - 0.00000 g/sq.ftAdvection in from water table - -0.84506 g/sq.ftDiffusion in from atmosphere - -0.17170E-03g/sq.ft
"Diffusion in from water table = -0.18078 g/sq.ftTotal inflow at boundaries = -1.0260 g/sq.ft.Mass discrepancy = -0.11921E-06g/sq.ft.
Since beginning of run at time =0.0Change in Total Mass - -219.02 g/sq.ft.
Advection in from atmosphere =* 0.00000 g/sq.ftAdvection in from water table = -170.78 g/sq.ftDiffusion in from atmosphere - -0.50336E-01g/sq.ftDiffusion in from water table = -48.191 g/sq.ft
Total inflow at boundaries - -219.02 g/sq.ft.
, R .i 0 0638

Mass discrepancy = 0.00000 g/sq.ft.
Polygon 1At time = 34.00, total mass in vadose zone = 5.8708 g/sq.ft.Mass in gas phase = 0.50282 g/sq.ft.Mass in liquid phase = 4.8337 g/sq.ft.Mass sorbed = 0.53423 g/sq.ft.
Since-last printout at time = 33.00Change in Total Mass = -0.88389 g/sq.ft.
Advection in from atmosphere = 0.00000 g/sq.ftAdvection in from water table = -0.72768 g/sq.ftDiffusion in from atmosphere = -0.15161E-03g/sq.ftDiffusion in from water table = -0.15606 g/sq.ft
Total inflow at boundaries = -0.88389 g/sq.ft.Mass discrepancy = 0.71526E-06g/sq.ft.
Since beginning of run at time =0.0Change in Total Mass = -219.90 g/sq.ft.
Advection in from atmosphere = 0.00000 g/sq.ft,Advection in from water table = -171.51 g/sq.ft.Diffusion in from atmosphere - -0.50488E-01g/sq.ft.Diffusion in from water table = -48.347 g/sq.ft.
Total inflow at boundaries = -219.90 g/sq.ft.Mass discrepancy = 0.00000 g/sq.ft.
Polygon 1At time = 35.00, total mass in vadose zone = 5.1080 g/sq.ft.Mass in gas phase = 0.43749 g/sq.ft.Mass in liquid phase = 4.2057 g/sq.ft.Mass sorbed = 0.46482 g/sq.ft.
Since last printout at time = 34.00Change in Total Mass = -0.76281 g/sq.ft.
Advection in from atmosphere = 0.00000 g/sq.ft.Advection in from water table = -0.62774 g/sq.ft.Diffusion in from atmosphere = -0.13384E-03g/sq.ft.Diffusion in from water table = -0.13494 g/sq.ft.
Total inflow at boundaries = -0.76281 g/sq.ft.Mass discrepancy = 0.59605E-07g/sq.ft.
Since beginning of run at time = 0.0Change in Total Mass = -220.67 g/sq.ft.
Advection in from atmosphere = 0.00000 g/sq.ft."Advection in from water table - -172.13 g/sq.ft.Diffusion in from atmosphere - -0.50621E-01g/sq.ft.Diffusion in from water table = -48.482 g/sq.ft.
Total inflow at boundaries = -220.67 g/sq.ft.Mass discrepancy = -0.15259E-04g/sq.ft.
Polygon 1At .time = 36.00, total mass in vadose zone = 4.4486 g/sq.ft.Mass in gas phase = 0.38102 g/sq.ft.Mass in liquid phase =• 3.6628 g/sq.ft.
R 1D0639

Mass sorbed = 0.40481 g/sq.ft.
Since last printout at time = 3 5 . 0 0Change in Total Mass = -0.65938 g/sq.ft.
Advection in from atmosphere = 0.00000 g/sq.ftAdvection in from water table = -0.54241 g/sq.ftDiffusion in from atmosphere = -0.11811E-03g/sq.ftDiffusion in from water table = -0.11685 g/sq.ft
Total inflow at boundaries = -0.65938 g/sq.ft.Mass discrepancy = -0.53644E-06g/sq.ft.
Since beginning of run at time = 0.0Change in Total Mass = -221.33 g/sq.ft.
Advection in from atmosphere = 0.00000 g/sq.ft.Advection in from water table = -172.68 g/sq.ft.Diffusion in from atmosphere = -0.50740E-01g/sq.ft,Diffusion in from water table = -48.598 g/sq.ft,
Total inflow at boundaries = -221.33 g/sq.ft.Mass discrepancy = 0.00000 g/sq.ft.
Polygon 1At time = 37.00, total mass in vadose zone = 3.8778 g/sq.ft.Mass in gas phase = 0.33213 g/sq.ft.Mass in liquid phase = 3.1928 g/sq.ft.Mass sorbed = 0.35287 g/sq.ft.
Since last printout at time = 36.00Change in Total Mass = -0.57081 g/sq.ft.
Advection in from atmosphere = 0.00000 g/sq.ft.Advection in from water table = -0.46939 g/sq.ft.Diffusion in from atmosphere = -0.10421E-03g/sq.ft.Diffusion in from water table = -0.10131 g/sq.ft.
Total inflow at boundaries = -0.57081 g/sq.ft.Mass discrepancy = -0.41723E-06g/sq.ft.
Since beginning of run at time = 0.0Change in Total Mass = -221.90 g/sq.ft.
Advection in from atmosphere = 0.00000 g/sq.ft.Advection in from water table = -173.15 g/sq.ft.Diffusion in from atmosphere = -0.50844E-01g/sq.ft.Diffusion in from water table = -48.700 g/sq.ft.
Total inflow at boundaries = -221.90 g/sq.ft.Mass discrepancy = 0.00000 g/sq.ft.
Polygon 1 —At time = 38.00, total mass in vadose zone = 3.3830 g/sq.ft.Mass in gas phase = 0.28975 g/sq.ft.Mass in liquid phase = 2.7854 g/sq.ft.Mass sorbed = 0.30785 g/sq.ft.
Since last printout at time = 37.00Change in Total Mass = -0.49480 g/sq.ft.
Advection in from atmosphere =• 0.00000 g/sq.ftAdvection in from water table - -0.40675 g/sq.ftDiffusion in from atmosphere = -0.91925E-04g/sq.ft

Diffusion in from water table = -0.87953E-01g/sq.ftTotal inflow at boundaries = -0.49480 g/sq.ft.Mass discrepancy = 0.14901E-06g/sq.ft.
Since beginning of run at time =0.0Change in Total Mass = -222.39 g/sq.ft.
Advection in from atmosphere = 0.00000 g/sq.ft.Advection in from water table = -173.55 g/sq.ftDiffusion in from atmosphere = -0.50936E-01g/sq.ft,Diffusion in from water table = -48.788 g/sq.ft,
Total inflow at boundaries = -222.39 g/sq.ft.Mass discrepancy = -0.15259E-04g/sq.ft.
Polygon 1At time = 39.00, total mass in vadose zone = 2.9536 g/sq.ft.Mass in gas phase = 0.25297 g/sq.ft.Mass in liquid phase = 2.4318 g/sq.ft.Mass sorbed = 0.26877 g/sq.ft.
Since last printout at time = 38.00Change in Total Mass = -0.42944 g/sq.ft.
Advection in from atmosphere * 0.00000 g/sq.ft.Advection in from water table = -0.35292 g/sq.ft.Diffusion in from atmosphere = -0.81072E-04g/sq.ft.Diffusion in from water table = -0.76440E-01g/sq.ft.
Total inflow at boundaries = -0.42944 g/sq.ft.Mass discrepancy = -0.14901E-06g/sq.ft.
Since beginning of run at time = 0.0Change in Total Mass = -222.82 g/sq.ft.
Advection in from atmosphere * 0.00000 g/sq.ft.Advection in from water table = -173.91 g/sq.ft.Diffusion in from atmosphere = -0.51017E-01g/sq.ft.Diffusion in from water table = -48.864 g/sq.ft.
Total inflow at boundaries = -222.82 g/sq.ft.Mass discrepancy = 0.00000 g/sq.ft.
Polygon 1At time = 40.00, total mass in vadose zone = 2.5804 g/sq.ft.Mass in gas phase = 0.22101 g/sq.ft.Mass in liquid phase = 2.1246 g/sq.ft.Mass sorbed = 0.23481 g/sq.ft.
Since last printout at time = 39.00Change in Total Mass = -0.37314 g/sq.ft.
Advection in from atmosphere = 0.00000 g/sq.ft.Advection in from water table = -0.30657 g/sq.ft.Diffusion in from atmosphere = -0.71488E-04g/sq.ft.Diffusion in from water table = -0.66503E-01g/sq.ft.
Total inflow at boundaries = -0.37314 g/sq.ft.Mass discrepancy = 0.59605E-07g/sq.ft.
Since beginning of run at time = 0.0Change in Total Mass = -223.19 g/sq.ft.
Advection in from atmosphere = 0.00000 g/sq.ft.
,R (006UI
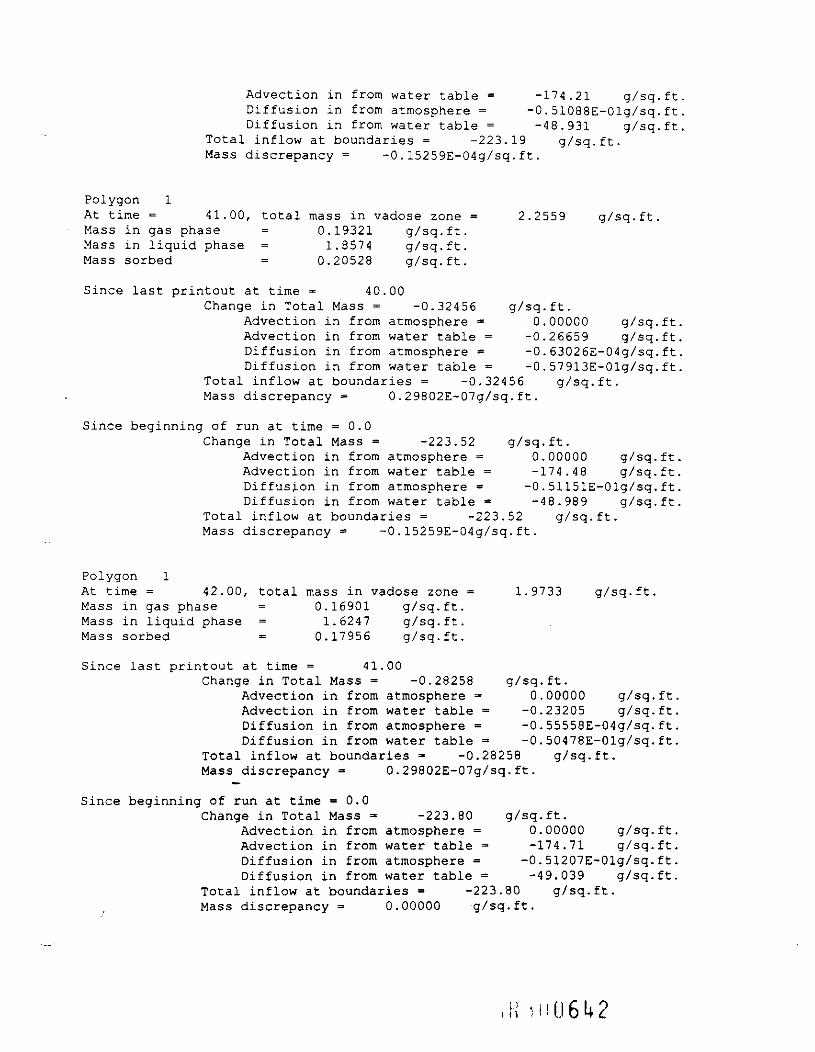
Advection in from water table = -174.21 g/sq.ftDiffusion in from atmosphere = -0.51088E-01g/sq.ftDiffusion in from water table = -48.931 g/sq.ft
Total inflow at boundaries = -223.19 g/sq.ft.Mass discrepancy = -0.15259E-04g/sq.ft.
Polygon 1At time = 41.00, total mass in vadose zone = 2.2559 g/sq.ft.Mass in gas phase = 0.19321 g/sq.ft.Mass in liquid phase = 1.8574 g/sq.ft.Mass sorbed = 0.20528 g/sq.ft.
Since last printout at time = 40.00Change in Total Mass = -0.32456 g/sq.ft.
Advection in from atmosphere * 0.00000 g/sq.ft.Advection in from water table = -0.26659 g/sq.ft.Diffusion in from atmosphere * -0.63026E-04g/sq.ft.Diffusion in from water table = -0.57913E-01g/sq.ft.
Total inflow at boundaries = -0,32456 g/sq.ft.Mass discrepancy = 0.29802E-07g/sq.ft.
Since beginning of run at time = 0.0Change in Total Mass = -223.52 g/sq.ft.
Advection in from atmosphere = 0.00000 g/sq.ft.Advection in from water table = -174.48 g/sq.ft.Diffusion in from atmosphere * -0.51151E-01g/sq.ft.Diffusion in from water table = -48.989 g/sq.ft.
Total inflow at boundaries = -223.52 g/sq.ft.Mass discrepancy = -0.15259E-04g/sq.ft.
Polygon 1At time = 42.00, total mass in vadose zone = 1.9733 g/sq.ft.Mass in gas phase = 0.16901 g/sq.ft.Mass in liquid phase = 1.6247 g/sq.ft.Mass sorbed = 0.17956 g/sq.ft.
Since last printout at time = 41.00Change in Total Mass = -0.28258 g/sq.ft.
Advection in from atmosphere = 0.00000 g/sq.ft.Advection in from water table = -0.23205 g/sq.ft.Diffusion in from atmosphere = -0.55558E-04g/sq.ft.Diffusion in from water table - -0.50478E-01g/sq.ft.
Total inflow at boundaries =• -0.28258 g/sq.ft.Mass discrepancy = 0.29802E-07g/sq.ft.
Since beginning of run at time = 0.0Change in Total Mass =» -223.80 g/sq.ft.
Advection in from atmosphere = 0.00000 g/sq.ft.Advection in from water table = -174.71 g/sq.ft.Diffusion in from atmosphere = -0.51207E-01g/sq.ft.Diffusion in from water table = -49.039 g/sq.ft.
Total inflow at boundaries = -223.80 g/sq.ft.Mass discrepancy = 0.00000 g/sq.ft.
061+2

Polygon 1At time = 43.00, total mass in vadose zone = 1.7270 g/sq.ft.Mass in gas phase = 0.14792 g/sq.ft.Mass in liquid phase = 1.4220 g/sq.ft.Mass sorbed = 0.15716 g/sq.ft.
Since last printout at time = 42.00Change in Total Mass = -0.24625 g/sq.ft.
Advection in from atmosphere = 0.00000 g/sq.ftAdvection in from water table = -0.20217 g/sq.ftDiffusion in from atmosphere * -0.48968E-04g/sq.ftDiffusion in from water table = -0.44033E-01g/sq.ft
Total inflow at boundaries = -0.24625 g/sq.ft.Mass discrepancy = -0.16391E-06g/sq.ft.
Since beginning of run at time =0.0Change in Total Mass = -224.05 g/sq.ft.
Advection in from atmosphere = 0.00000 g/sq.ftAdvection in from water table = -174.91 g/sq.ftDiffusion in from atmosphere =* -0.51256E-01g/sq.ftDiffusion in from water table = -49.083 g/sq.ft
Total inflow at boundaries = -224.05 g/sq.ft.Mass discrepancy * 0.00000 g/sq.ft.
Polygon 1At time = 44.00, total mass in vadose zone = 1.5122 g/sq.ft.Mass in gas phase = 0.12952 g/sq.ft.Mass in liquid phase - 1.2451 g/sq.ft.Mass sorbed = 0.13761 g/sq.ft.
Since last printout at time = 43.00Change in Total Mass = -0.21477 g/sq.ft.
Advection in from atmosphere = 0.00000 g/sq.ft.Advection in from water table = -0.17629 g/sq.ft.Diffusion in from atmosphere = -0.43154E-04g/sq.ft.Diffusion in from water table = -0.38439E-01g/sq.ft.
Total inflow at boundaries = -0.21477 g/sq.ft.Mass discrepancy = 0.89407E-07g/sq.ft.
Since beginning of run at time =0.0Change in Total Mass = -224.26 g/sq.ft.
Advection in from atmosphere - 0.00000 g/sq.ft.Advection in from water table = -175.09 g/sq.ft.Diffusion in from atmosphere = -0.51299E-01g/sq.ft.Diffusion in from water table - -49.122 g/sq.ft.
Total inflow at boundaries = -224.26 g/sq.ft.Mass discrepancy = 0.00000 g/sq.ft.
Polygon 1At time = 45.00, total mass in vadose zone = 1.3248 g/sq.ftMass in gas phase = 0.11347 g/sq.ft.Mass in liquid phase = 1.0908 g/sq.ft.Mas.s sorbed = 0.12055 g/sq.ft.
Since last printout at time = 44.00
R.UIG6I43

Change in Total Mass = -0.18746 g/sq.ft.Advection in from atmosphere = 0.00000 g/sq.ftAdvection in from water table = -0.15384 g/sq.ftDiffusion in from atmosphere = -0.38027E-04g/sq.ftDiffusion in from water table = -0.33580E-01g/sq.ft
Total inflow at boundaries = -0.18746 g/sq.ft.Mass discrepancy = 0.44703E-07g/sq.ft.
Since beginning of run at time =0.0Change in Total Mass = -224.45 g/sq.ft.
Advection in from atmosphere = 0.00000 g/sq.ft.Advection in from water table = -175.24 g/sq.ft,Diffusion in from atmosphere = -0.51337E-01g/sq.ft,Diffusion in from water table = -49.155 g/sq.ft.
Total inflow at boundaries = -224.45 g/sq.ft.Mass discrepancy = -0.15259E-04g/sq.ft.
Polygon 1At time = 46.00, total mass in vadose zone = 1.1610 g/sq.ft.Mass in gas phase = 0.99442E-01g/sq.ft.Mass in liquid phase = 0.95595 g/sq.ft.Mass sorbed = 0.10565 g/sq.ft.
Since last printout at time = 45.00Change in Total Mass = -0.16374 g/sq.ft.
Advection in from atmosphere = 0.00000 g/sq.ftAdvection in from water table = -0.13435 g/sq.ftDiffusion in from atmosphere = -0.33506E-04g/sq.ftDiffusion in from water table = -0.29354E-01g/sq.ft
Total inflow at boundaries = -0.16374 g/sq.ft.Mass discrepancy = -0.14901E-07g/sq.ft.
Since beginning of run at time = 0.0Change in Total Mass = -224.61 g/sq.ft.
Advection in from atmosphere * 0.00000 g/sq.ft.Advection in from water table = -175.38 g/sq.ft.Diffusion in from atmosphere = -0.51370E-01g/sq.ft,Diffusion in from water table = -49.185 g/sq.ft.
Total inflow at boundaries = -224.61 g/sq.ft.Mass discrepancy = -0.15259E-04g/sq.ft.
Polygon 1At time = 47.00, total mass in vadose zone = 1.0179 g/sq.ft.Mass in gas phase = 0.87184E-01g/sq.ft.Mass in liquid phas1? = 0.83812 g/sq.ft.Mass sorbed = 0.92630E-01g/sq.ft.
Since last printout at time = 46.00Change in Total Mass = -0.14311 g/sq.ft.
Advection in from atmosphere - 0.00000 g/sq.ftAdvection in from water table - -0.11741 g/sq.ftDiffusion in from atmosphere = -0.29519E-04g/sq.ftDiffusion in from water table = -0.25675E-01g/sq.ft.
Total inflow at boundaries =•= -0.14311 g/sq.ft.Mass discrepancy = -0.17881E-06g/sq.ft.
061+14
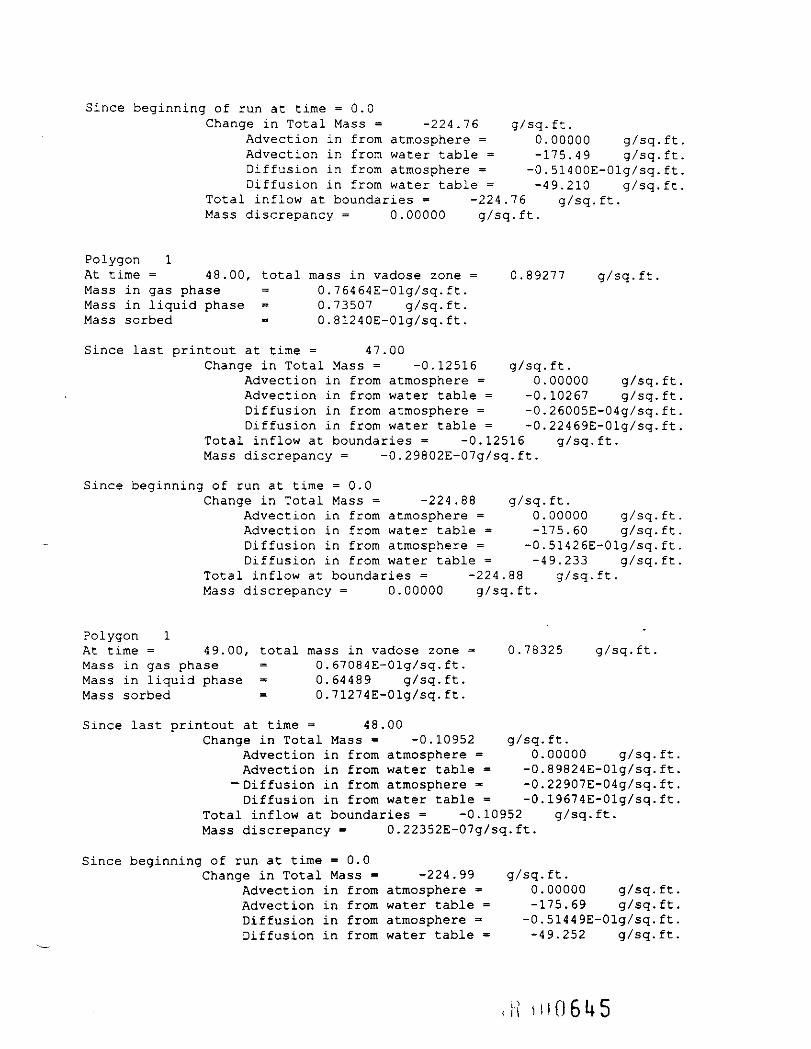
Since beginning of run at time =0.0Change in Total Mass = -224.76 g/sq.ft.
Advection in from atmosphere = 0.00000 g/sq.ftAdvection in from water table = -175.49 g/sq.ftDiffusion in from atmosphere = -0.51400E-01g/sq.ftDiffusion in from water table = -49.210 g/sq.ft
Total inflow at boundaries = -224.76 g/sq.ft.Mass discrepancy - 0.00000 g/sq.ft.
Polygon 1At time = 48.00, total mass in vadose zone = 0.89277 g/sq.ft.Mass in gas phase = 0.76464E-01g/sq.ft.Mass in liquid phase = 0.73507 g/sq.ft.Mass sorbed = 0.81240E-01g/sq.ft.
Since last printout at time = 47.00Change in Total Mass = -0.12516 g/sq.ft.
Advection in from atmosphere = 0.00000 g/sq.ft.Advection in from water table = -0.10267 g/sq.ft,Diffusion in from atmosphere = -0.26005E-04g/sq.ft.Diffusion in from water table = -0.22469E-01g/sq.ft.
Total inflow at boundaries = -0.12516 g/sq.ft.Mass discrepancy = -0.29802E-07g/sq.ft.
Since beginning of run at time =0.0Change in Total Mass = -224.88 g/sq.ft.
Advection in from atmosphere = 0.00000 g/sq.ft.Advection in from water table = -175.60 g/sq.ft.Diffusion in from atmosphere = -0.51426E-01g/sq.ft.Diffusion in from water table = -49.233 g/sq.ft.
Total inflow at boundaries = -224.88 g/sq.ft.Mass discrepancy = 0.00000 g/sq.ft.
Polygon 1At time = 49.00, total mass in vadose zone = 0.78325 g/sq.ft.Mass in gas phase = 0.67084E-01g/sq.ft.Mass in liquid phase = 0.64489 g/sq.ft.Mass sorbed = 0.71274E-01g/sq.ft.
Since last printout at time = 48.00Change in Total Mass = -0.10952 g/sq.ft.
Advection in from atmosphere = 0.00000 g/sq.ftAdvection in from water table = -0.89824E-01g/sq.ft
"Diffusion in from atmosphere - -0.22907E-04g/sq.ftDiffusion in from water table = -0.19674E-01g/sq.ft
Total inflow at boundaries = -0.10952 g/sq.ft.Mass discrepancy = 0.22352E-07g/sq.ft.
Since beginning of run at time = 0.0Change in Total Mass = -224.99 g/sq.ft.
Advection in from atmosphere = 0.00000 g/sq.ft,Advection in from water table = -175.69 g/sq.ft.Diffusion in from atmosphere = -0.51449E-01g/sq.ft,Diffusion in from water table = -49.252 g/sq.ft,
,!-< HI061+5

Total inflow at boundaries = -224.99 g/sq.ft.Mass discrepancy = 0.00000 g/sq.ft.
Polygon 1At time = 50.00, total mass in vadose zone = 0.68737 g/sq.ft.Mass in gas phase = 0.58872E-01g/sq.ft.Mass in liquid phase = 0.56594 g/sq.ft.Mass sorbed - 0.62549E-01g/sq.ft.
Since last printout at time = 49.00Change in Total Mass = -0.95884E-01g/sq.ft.
Advection in from atmosphere = 0.00000 g/sq.ftAdvection in from water table = -0.78630E-01g/sq.ftDiffusion in from atmosphere = -0.20177E-04g/sq.ftDiffusion in from water table = -0.17234E-01g/sq.ft
Total inflow at boundaries = -0.95884E-01g/sq.ft.Mass discrepancy = -0.74506E-08g/sq.ft.
Since beginning of run at time = 0.0Change in Total Mass = -225.09 g/sq.ft.
Advection in from atmosphere = 0.00000 g/sq.ft.Advection in from water table = -175.77 g/sq.ft.Diffusion in from atmosphere * -0.51469E-01g/sq.ft.Diffusion in from water table = -49.270 g/sq.ft,
Total inflow at boundaries = -225.09 g/sq.ft.Mass discrepancy - 0-00000 g/sq.ft.
Polygon 1At time = 51.00, total mass in vadose zone = 0.60338 g/sq.ft.Mass in gas phase = 0.51679E-01g/sq.ft.Mass in liquid phase = 0.49680 g/sq.ft.Mass sorbed = 0.54906E-01g/sq.ft.
Since last printout at time = 50.00Change in Total Mass = -0.83984E-01g/sq.ft.
Advection in from atmosphere = 0.00000 g/sq,ftAdvection in from water table = -0.68864E-6lg/sq.ftDiffusion in from atmosphere * -0.17772E-04g/sq.ftDiffusion in from water table = -0.15l03E-01g/sq.ft
Total inflow at boundaries = -0.83984E-01g/sq.ft.Mass discrepancy = 0.44703E-07g/sq.ft.
Since beginning of run at time =0.0Change in Total Mass = -225.17 g/sq.ft.
"Advection in from atmosphere = 0.00000 g/sq.ft,Advection in from water table - -175.83 g/sq.ft,Diffusion in from atmosphere = -0.51487E-01g/sq.ft.Diffusion in from water table = -49.285 g/sq.ft.
Total inflow at boundaries = -225.17 g/sq.ft.Mass discrepancy = 0.00000 g/sq.ft.
Polygon 1At time = 52.00, total mass in vadose zone = 0.52979 g/sq.ft.Mass in gas phase - 0.45376E-01g/sq.ft.
061+6
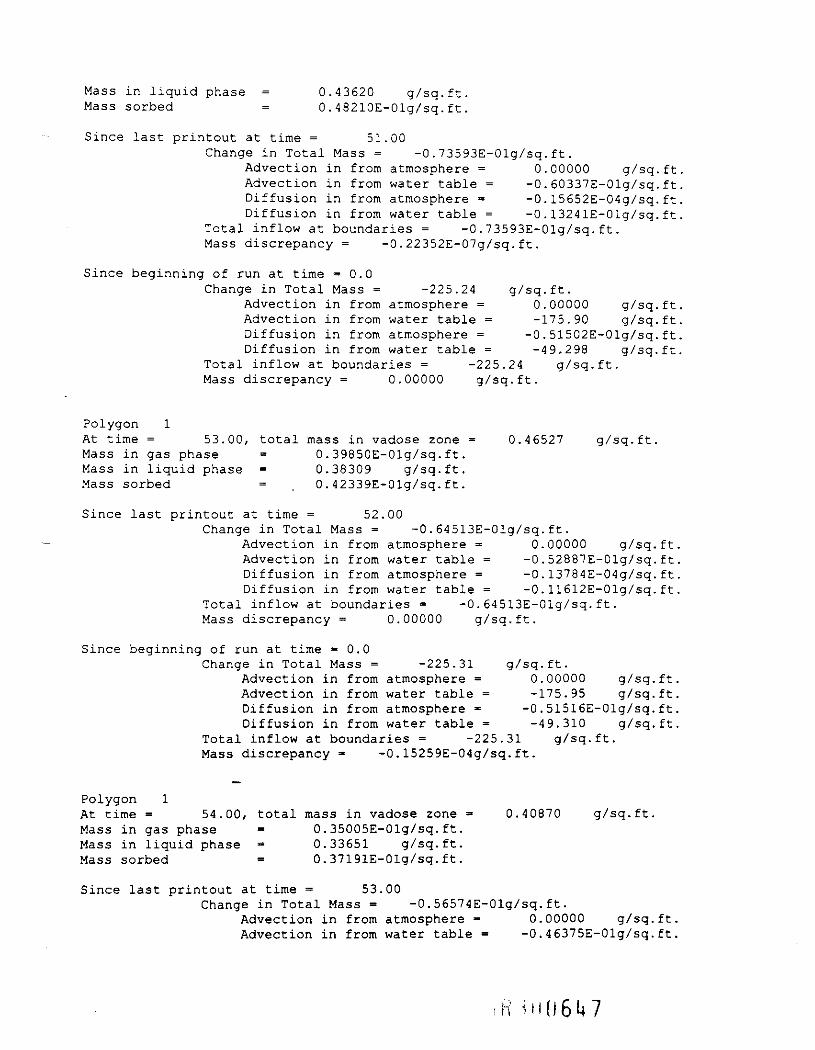
Mass in liquid phase = 0.43620 g/sq.ft.Mass sorbed = 0.48210E-01g/sq.ft.
Since last printout at time = 51.00Change in Total Mass = -0.73593E-01g/sq.ft.
Advection in from atmosphere = 0.00000 g/sq.ftAdvection in from water table = -0.60337E-01g/sq.ftDiffusion in from atmosphere = -0.15652E-04g/sq.ftDiffusion in from water table = -0.13241E-01g/sq.ft
Total inflow at boundaries = -0.73593E-01g/sq.ft.Mass discrepancy = -0.22352E-07g/sq.ft.
Since beginning of run at time =0.0Change in Total Mass = -225.24 g/sq.ft.
Advection in from atmosphere = 0.00000 g/sq.ft,Advection in from water table = -175.90 g/sq.ft,Diffusion in from atmosphere = -0.51502E-01g/sq.ft,Diffusion in from water table = -49.298 g/sq.ft,
Total inflow at boundaries = -225.24 g/sq.ft.Mass discrepancy = 0,00000 g/sq.ft.
Polygon 1At time = 53.00, total mass in vadose zone = 0.46527 g/sq.ft.Mass in gas phase - 0.39850E-01g/sq.ft.Mass in liquid phase = 0.38309 g/sq.ft.Mass sorbed = . 0.42339E-01g/sq.ft.
Since last printout at time = 52.00Change in Total Mass = -0.64513E-01g/sq.ft.
Advection in from atmosphere = 0.00000 g/sq. ft.Advection in from water table = -0.52887E-01g/sq.ft.Diffusion in from atmosphere = -0.13784E-04g/sq.ft.Diffusion in from water table = -0.1l612E-01g/sq.ft.
Total inflow at boundaries = -0.64513E-01g/sq.ft.Mass discrepancy = 0.00000 g/sq.ft.
Since beginning of run at time = 0.0Change in Total Mass = -225.31 g/sq.ft.
Advection in from atmosphere = 0.00000 g/sq.ft.Advection in from water table = -175.95 g/sq.ft.Diffusion in from atmosphere = -0.5l516E-01g/sq.ft.Diffusion in from water table = -49.310 g/sq.ft.
Total inflow at boundaries = -225.31 g/sq.ft.Mass discrepancy = -0.15259E-04g/sq. ft.
Polygon 1At time = 54.00, total mass in vadose zone - 0.40870 g/sq.ft.Mass in gas phase = 0.35005E-01g/sq.ft.Mass in liquid phase = 0.33651 g/sq.ft.Mass sorbed = 0.37191E-01g/sq.ft.
Since last printout at time = 53.00Change in Total Mass = -0.56574E-01g/sq.ft.
Advection in from atmosphere - 0.00000 g/sq.ftAdvection in from water table = -0.46375E-01g/sq.ft
06147
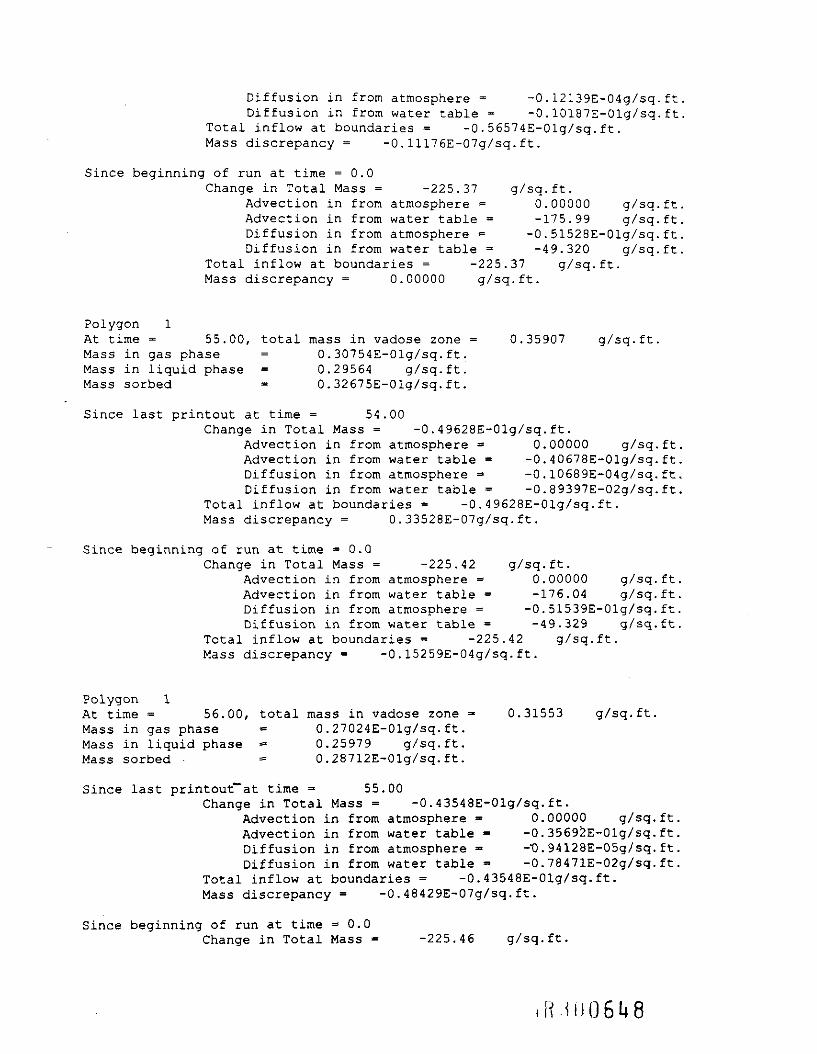
Diffusion in from atmosphere = -0.12139E-04g/sq.ftDiffusion in from water table = -0.10187E-01g/sq.ft
Total inflow at boundaries = -0.56574E-01g/sq.ft.Mass discrepancy - -0.11176E-07g/sq.ft.
Since beginning of run at time = 0.0Change in Total Mass = -225.37 g/sq.ft.
Advection in from atmosphere = 0.00000 g/sq.ft.Advection in from water table = -175.99 g/sq.ft.Diffusion in from atmosphere = -0.51528E-01g/sq.ft.Diffusion in from water table = -49.320 g/sq.ft.
Total inflow at boundaries = -225.37 g/sq.ft.Mass discrepancy = 0.00000 g/sq.ft.
Polygon 1At time = 55.00, total mass in vadose zone = 0.35907 g/sq.ft.Mass in gas phase = 0.30754E-01g/sq.ft.Mass in liquid phase = 0.29564 g/sq.ft.Mass sorbed = 0.32675E-01g/sq.ft.
Since last printout at time = 54.00Change in Total Mass = -0.49628E-01g/sq.ft.
Advection in from atmosphere = 0.00000 g/sq.ftAdvection in from water table = -0.40678E-01g/sq.ftDiffusion in from atmosphere * -0.l0689E-04g/sq.ftDiffusion in from water table = -0.89397E-02g/sq.ft
Total inflow at boundaries = -0.49628E-01g/sq.ft.Mass discrepancy = 0.33528E-07g/sq.ft.
Since beginning of run at time * 0.0Change in Total Mass = -225.42 g/sq.ft.
Advection in from atmosphere = 0.00000 g/sq.ft,Advection in from water table = -176.04 g/sq.ft.Diffusion in from atmosphere - -0.51539E-01g/sq.ft,Diffusion in from water table = -49.329 g/sq.ft.
Total inflow at boundaries = -225.42 g/sq.ft.Mass discrepancy = -0.15259E-04g/sq.ft.
Polygon 1At time = 56.00, total mass in vadose zone = 0.31553 g/sq.ft.Mass in gas phase = 0.27024E-01g/sq.ft.Mass in liquid phase - 0.25979 g/sq.ft.Mass sorbed • = 0.28712E-01g/sq.ft.
Since last printout*~at time = 55.00Change in Total Mass = -0.43548E-01g/sq.ft.
Advection in from atmosphere = 0.00000 g/sq.ftAdvection in from water table = -0.35692E-01g/sq.ftDiffusion in from atmosphere = -t). 94128E-05g/sq. ftDiffusion in from water table - -0.78471E-02g/sq.ft
Total inflow at boundaries = -0.43548E-01g/sq.ft.Mass discrepancy = -0.48429E-07g/sq.ft.
Since beginning of run at time =0.0Change in Total Mass - -225.46 g/sq.ft.
R.Hi 061+8
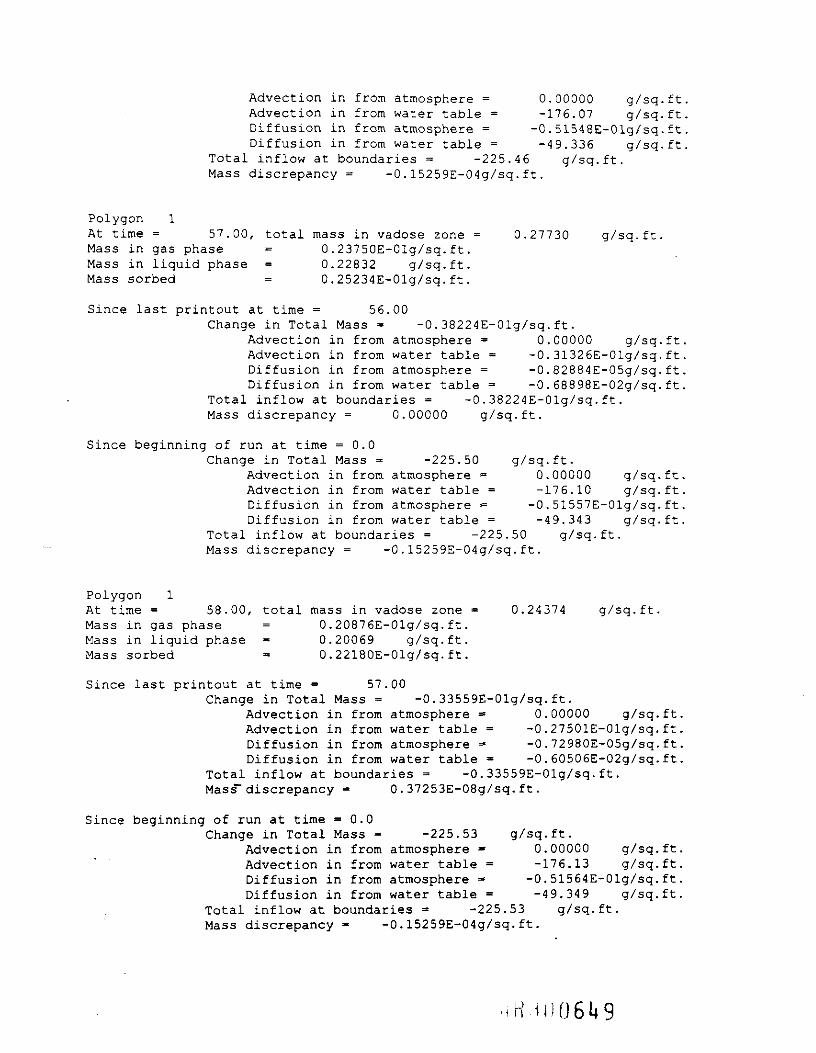
Advection in from atmosphere = 0.00000 g/sq.ftAdvection in from water table = -176.07 g/sq.ftDiffusion in from atmosphere = -0.51548E-01g/sq.ftDiffusion in from water table = -49.336 g/sq.ft
Total inflow at boundaries = -225.46 g/sq.ft.Mass discrepancy = -0.15259E-04g/sq.ft.
Polygon 1At time = 57.00, total mass in vadose zone = 0.27730 g/sq.ft.Mass in gas phase = 0 . 23750E-01g/sq.ft.Mass in liquid phase = 0.22832 g/sq.ft.Mass sorbed = 0.25234E-01g/sq.ft.
Since last printout at time = 56.00Change in Total Mass = -0.38224E-01g/sq.ft.
Advection in from atmosphere = 0.00000 g/sq.ft.Advection in from water table = -0.31326E-01g/sq.ft.Diffusion in from atmosphere = -0.82884E-05g/sq.ft.Diffusion in from water table = -0.68898E-02g/sq.ft.
Total inflow at boundaries = -0.38224E-01g/sq.ft.Mass discrepancy = 0.00000 g/sq.ft.
Since beginning of run at time = 0.0Change in Total Mass = -225.50 g/sq.ft.
Advection in from atmosphere ~ 0.00000 g/sq.ft.Advection in from water table = -176.10 g/sq.ft.Diffusion in from atmosphere * -0.51557E-01g/sq.ft.Diffusion in from water table = -49.343 g/sq.ft.
Total inflow at boundaries = -225.50 g/sq.ft.Mass discrepancy = -0.15259E-04g/sq.ft.
Polygon 1At time = 58.00, total mass in vadose zone = 0.24374 g/sq.ft.Mass in gas phase = 0.20876E-01g/sq.ft.Mass in liquid phase = 0.20069 g/sq.ft.Mass sorbed = 0.22180E-01g/sq.ft.
Since last printout at time = 57.00Change in Total Mass = -0.33559E-01g/sq.ft.
Advection in from atmosphere = 0.00000 g/sq.ftAdvection in from water table = -0.27501E-01g/sq.ftDiffusion in from atmosphere = -0.72980E-05g/sq.ftDiffusion in from water table = -0.60506E-02g/sq.ft
Total inflow at boundaries = -0.33559E-01g/sq.ft.Mass"discrepancy = 0.37253E-08g/sq.ft.
Since beginning of run at time =0.0Change in Total Mass = -225.53 g/sq.ft.
Advection in from atmosphere - 0.00000 g/sq.ftAdvection in from water table = -176.13 g/sq.ft.Diffusion in from atmosphere =- -0.5l564E-01g/sq.ft,Diffusion in from water table = -49.349 g/sq.ft,
Total inflow at boundaries = -225.53 g/sq.ft.Mass discrepancy =- -0.15259E-04g/sq. ft.
R.i!)06l+9
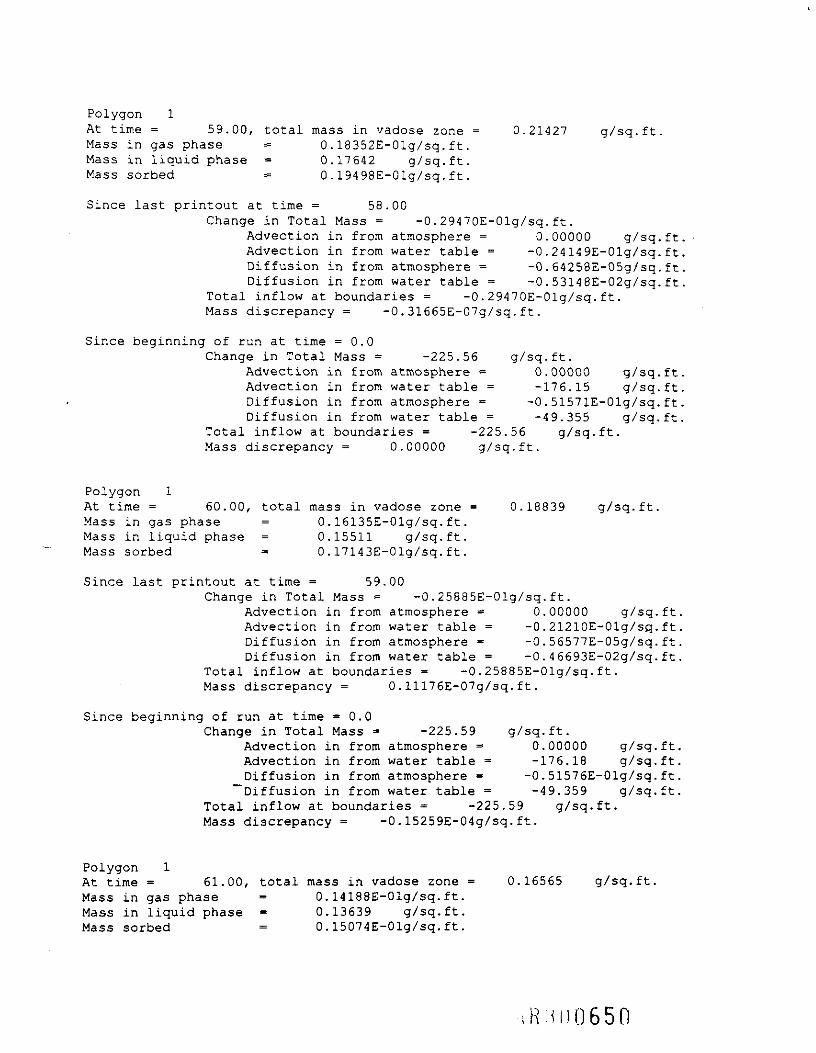
Polygon 1At time = 59.00, total mass in vadose zone = 0.21427 g/sq.ft.Mass in gas phase = 0 .18352E-01g/sq.ft.Mass in liquid phase = 0.17642 g/sq.ft.Mass sorbed = 0.19498E-01g/sq.ft.
Since last printout at time = 58.00Change in Total Mass = -0.29470E-01g/sq.ft.
Advection in from atmosphere = 0.00000 g/sq.ftAdvection in from water table = -0.24149E-01g/sq.ftDiffusion in from atmosphere = -0.64258E-05g/sq.ftDiffusion in from water table = -0.53148E-02g/sq.ft
Total inflow at boundaries = -0.29470E-01g/sq.ft.Mass discrepancy = -0.31665E-07g/sq.ft.
Since beginning of run at time = 0.0Change in Total Mass = -225.56 g/sq.ft.
Advection in from atmosphere * 0.00000 g/sq.ftAdvection in from water table = -176.15 g/sq.ftDiffusion in from atmosphere = -0.51571E-01g/sq.ft,Diffusion in from water table = -49.355 g/sq.ft,
Total inflow at boundaries = -225.56 g/sq.ft.Mass discrepancy = 0.00000 g/sq.ft.
Polygon 1At time = 60.00, total mass in vadose zone = 0.18839 g/sq.ft.Mass in gas phase = 0.16135E-01g/sq.ft.Mass in liquid phase = 0.15511 g/sq.ft.Mass sorbed = 0.17143E-01g/sq.ft.
Since last printout at time = 59.00Change in Total Mass = -0.25885E-01g/sq.ft.
Advection in from atmosphere = 0.00000 g/sq.ft.Advection in from water table = -0.21210E-01g/sq.ft.Diffusion in from atmosphere = -0.56577E-05g/sq.ft.Diffusion in from water table = -0.46693E-02g/sq.ft.
Total inflow at boundaries = -0.25885E-01g/sq.ft.Mass discrepancy = 0.11176E-07g/sq.ft.
Since beginning of run at time =0.0Change in Total Mass = -225.59 g/sq.ft.
Advection in from atmosphere = 0.00000 g/sq.ft.Advection in from water table = -176.18 g/sq.ft.Diffusion in from atmosphere = -0.51576E-01g/sq.ft.
""Diffusion in from water table - -49.359 g/sq.ft.Total inflow at boundaries = -225.59 g/sq.ft.Mass discrepancy = -0.15259E-04g/sq.ft.
Polygon 1At time = 61.00, total mass in vadose zone = 0.16565 g/sq.ft.Mass in gas phase = 0.14188E-01g/sq.ft.Mass in liquid phase = 0.13639 g/sq.ft.Mass sorbed = 0.15074E-01g/sq.ft.
R.uiQ65n
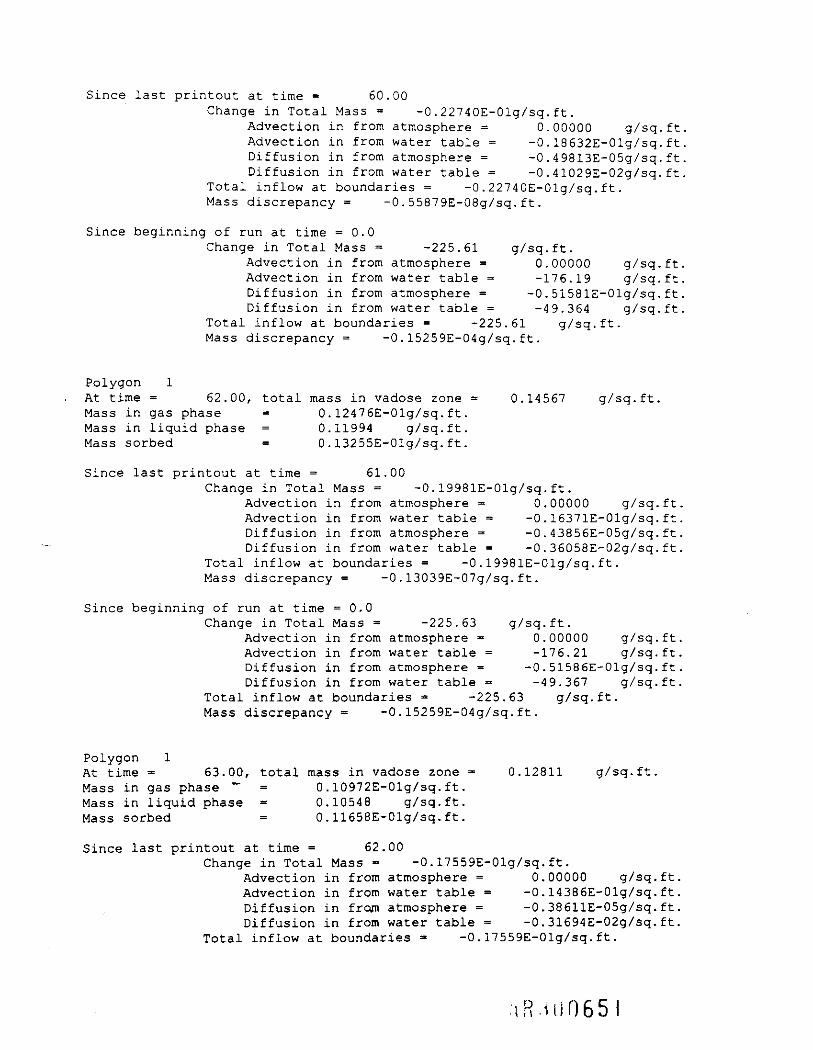
Since last printout at time = 60.00Change in Total Mass = -0.22740E-01g/sq.ft.
Advection in from atmosphere = 0.00000 g/sq.ftAdvection in from water table = -0.18632E-01g/sq.ftDiffusion in from atmosphere = -0.49813E-05g/sq.ftDiffusion in from water table = -0.41029E-02g/sq.ft
Total inflow at boundaries = -0.22740E-01g/sq.ft.Mass discrepancy = -0.55879E-08g/sq.ft.
Since beginning of run at time = 0.0Change in Total Mass - -225.61 g/sq.ft.
Advection in from atmosphere = 0.00000 g/sq.ft.Advection in from water table = -176.19 g/sq.ft.Diffusion in from atmosphere = -0.51581E-01g/sq.ft.Diffusion in from water table = -49.364 g/sq.ft.
Total inflow at boundaries = -225.61 g/sq.ft.Mass discrepancy = -0.15259E-04g/sq.ft.
Polygon 1At time = 62.00, total mass in vadose zone = 0.14567 g/sq.ft.Mass in gas phase = 0.12476E-01g/sq.ft.Mass in liquid phase = 0.11994 g/sq.ft.Mass sorbed = 0.13255E-01g/sq.ft.
Since last printout at time = 61.00Change in Total Mass = -0.19981E-01g/sq.ft.
Advection in from atmosphere = 0.00000 g/sq.ft.Advection in from water table - -0.16371E-01g/sq.ft.Diffusion in from atmosphere = -0.43856E-05g/sq.ft.Diffusion in from water table = -0.36058E-02g/sq.ft.
Total inflow at boundaries = -0.19981E-01g/sq.ft.Mass discrepancy = -0.13039E-07g/sq.ft.
Since beginning of run at time = 0.0Change in Total Mass = -225.63 g/sq.ft.
Advection in from atmosphere = 0.00000 g/sq.ft.Advection in from water table = -176.21 g/sq.ft.Diffusion in from atmosphere = -0.51586E-01g/sq.ft.Diffusion in from water table = -49.367 g/sq.ft.
Total inflow at boundaries = -225.63 g/sq.ft.Mass discrepancy = -0.15259E-04g/sq.ft.
Polygon 1At time - 63.00, total mass in vadose zone - 0.12811 g/sq.ft.Mass in gas phase ~" = 0.10972E-01g/sq.ft.Mass in liquid phase = 0.10548 g/sq.ft.Mass sorbed = 0.11658E-01g/sq.ft.
Since last printout at time = 62.00Change in Total Mass = -0.17559E-01g/sq.ft.
Advection in from atmosphere = 0.00000 g/sq.ftAdvection in from water table = -0.14386E-01g/sq.ftDiffusion in frojn atmosphere = -0.38611E-05g/sq.ftDiffusion in from water table = -0.31694E-02g/sq.ft,
Total inflow at boundaries = -0.17559E-01g/sq.ft.
iR.10065

Mass discrepancy = 0.18626E-08g/sq.ft.
Since beginning of run at time = 0.0Change in Total Mass = -225.65 g/sq.ft.
Advection in from atmosphere = 0.00000 g/sq.ftAdvection in from water table = -176.22 g/sq.ftDiffusion in from atmosphere = -0.51589E-01g/sq.ft.Diffusion in from water table = -49.370 g/sq.ft,
Total inflow at boundaries = -225.65 g/sq.ft.Mass discrepancy = 0.00000 g/sq.ft.
Polygon 1At time = 64.00, total mass in vadose zone = 0.11267 g/sq.ft.Mass in gas phase = 0.96504E-02g/sq.ft.Mass in liquid phase = 0.92771E-01g/sq.ft.Mass sorbed = 0.10253E-01g/sq.ft.
Since last printout at time = 63.00Change in Total Mass = -0.15434E-01g/sq.ft.
Advection in from atmosphere = 0.00000 g/sq.ft.Advection in from water table = -0.12644E-01g/sq.ft.Diffusion in from atmosphere = -0.33993E-05g/sq.ft.Diffusion in from water table = -0.27861E-02g/sq.ft.
Total inflow at boundaries = -0.15434E-01g/sq.ft.Mass discrepancy = 0.46566E-08g/sq.ft.
Since beginning of run at time = 0.0Change in Total Mass = -225.66 g/sq.ft.
Advection in from atmosphere = 0.00000 g/sq.ft.Advection in from water table = -176.24 g/sq.ft.Diffusion in from atmosphere = -0.51593E-01g/sq.ft.Diffusion in from water table = -49.373 g/sq.ft.
Total inflow at boundaries = -225.66 g/sq.ft.Mass discrepancy = 0.00000 g/sq.ft.
Polygon 1At time = 65.00, total mass in vadose zone = 0.99107E-01g/sq.ft.Mass in gas phase = 0.84884E-02g/sq.ft.Mass in liquid phase = 0.81600E-01g/sq.ft.Mass sorbed = 0.90186E-Q2g/sq.ft.
Since last printout at time = 64.00Change in Total Mass = -0.13567E-01g/sq.ft.
Advection in from atmosphere = 0.00000 g/sq.ft"•Advection in from water table = -0.11114E-01g/sq.ftDiffusion in from atmosphere = -0.29927E-05g/sq.ft.Diffusion in from water table = -0.24495E-02g/sq.ft
Total inflow at boundaries - -0.13567E-01g/sq.ft.Mass discrepancy = -0.74506E-08g/sq.ft.
Since beginning of run at time = 0.0Change in Total Mass = -225.68 g/sq.ft.
Advection in from atmosphere = 0.00000 g/sq.ft,Advection in from water table = -176.25 g/sq.ft,Diffusion in from atmosphere = -0.51596E-01g/sq.ft.
R.<U0652

Diffusion in from water table = -49.376 g/sq.ftTotal inflow at boundaries = -225.68 g/sq.ft.Mass discrepancy «* -0.15259E-04g/sq. ft.
Polygon 1At time = 66.00, total mass in vadose zone = 0.87180E-01g/sq.ft.Mass in gas phase = 0.74668E-02g/sq.ft.Mass in liquid phase = 0.71780E-01g/sq.ft.Mass sorbed = 0.79332E-02g/sq.ft.
Since last printout at time = 65.00Change in Total Mass = -0.11928E-01g/sq.ft.
Advection in from atmosphere = 0.00000 g/sq.ft.Advection in from water table = -0.97711E-02g/sq.ft.Diffusion in from atmosphere = -0.26347E-05g/sq.ft.Diffusion in from water table = -0.21538E-02g/sq.ft.
Total inflow at boundaries = -0.11928E-01g/sq.ft.Mass discrepancy = -0.83819E-08g/sq.ft.
Since beginning of run at time = 0.0Change in Total Mass = -225.69 g/sq.ft.
Advection in from atmosphere = 0.00000 g/sq.ft.Advection in from water table = -176.26 g/sq.ft.Diffusion in from atmosphere = -0.51598E-01g/sq.ft.Diffusion in from water table = -49.378 g/sq.ft.
Total inflow at boundaries = -225.69 g/sq.ft.Mass discrepancy = -0.15259E-04g/sq.ft.
Polygon 1At time = 67.00, total mass in vadose zone = 0.76692E-01g/sq.ft.Mass in gas phase = 0.65686E-02g/sq.ft.Mass in liquid phase = 0.63145E-01g/sq.ft.Mass sorbed = 0.69789E-02g/sq.ft.
Since last printout at time = 66.00Change in Total Mass = -0.10487E-01g/sq.ft.
Advection in from atmosphere = 0.00000 g/sq.ft.Advection in from water table = -0.85911E-02g/sq.ft.Diffusion in from atmosphere = -0.23194E-05g/sq.ft.Diffusion in from water table - -0.18940E-02g/sq.ft.
Total inflow at boundaries = -0.10487E-01g/sq.ft.Mass discrepancy = 0.74506E-08g/sq.ft.
Since beginning of run at time = 0.0Change in Total Mass = -225.70 g/sq.ft.
Advection in from atmosphere = 0.00000 g/sq.ft.Advection in from water table = -176.27 g/sq.ft.Diffusion in from atmosphere = -0.51601E-01g/sq.ft.Diffusion in from water table * -49.380 g/sq.ft.
Total inflow at boundaries * -225.70 g/sq.ft.Mass discrepancy - -0.15259E-04g/sq.ft.
Polygon 1At time = 68.00, total mass in vadose zone = 0.67470E-01g/sq.ft.
R 1D0653

Mass in gas phase = 0.57787E-02g/sq.ft.Mass in liquid phase = 0 . 55552E-01g/sq.ft.Mass sorbed = 0.61397E-02g/sq.ft.
Since last printout at time = 67.00Change in Total Mass = -0.92221E-02g/sq.ft.
Advection in from atmosphere = 0.00000 g/sq.ftAdvection in from water table = -0.75544E-02g/sq.ftDiffusion in from atmosphere = -0.20419E-05g/sq.ftDiffusion in from water table = -0.16657E-02g/sq.ft.
Total inflow at boundaries = -0.92221E-02g/sq.ft.Mass discrepancy = -0.55879E-08g/sq.ft.
Since beginning of run at time = 0.0Change in Total Mass = -225.71 g/sq.ft.
Advection in from atmosphere = 0.00000 g/sq.ft,Advection in from water table = -176.27 g/sq.ft,Diffusion in from atmosphere = -0.51603E-01g/sq.ft,Diffusion in from water table = -49.381 g/sq.ft.
Total inflow at boundaries = -225.71 g/sq.ft.Mass discrepancy = -0.15259E-04g/sq.ft.
Polygon 1At time = 69.00, total mass in vadose zone = 0.59360E-01g/sq.ft.Mass in gas phase = 0.5084lE-02g/sq.ft.Mass in liquid phase = 0 . 48874E-01g/sq.ft.Mass sorbed = 0.54017E-02g/sq.ft.
Since last printout at time = 68.00Change in Total Mass = -0.81102E-02g/sq.ft.
Advection in from atmosphere = 0.00000 g/sq.ft.Advection in from water table = -0.66434E-02g/sq.ft.Diffusion in from atmosphere = -0.17976E-05g/sq.ft.Diffusion in from water table = -0.14650E-02g/sq.ft.
Total inflow at boundaries = -0.81102E-02g/sq.ft.Mass discrepancy = 0.37253E-08g/sq.ft.
Since beginning of run at time = 0.0Change in Total Mass = -225.72 g/sq.ft.
Advection in from atmosphere = 0.00000 g/sq.ft.Advection in from water table = -176.28 g/sq.ft.Diffusion in from atmosphere = -0.5l605E-01g/sq.ft.Diffusion in from water table = -49.383 g/sq.ft.
Total inflow at boundaries = -225.72 g/sq.ft.Mass discrepancy - -0,30518E-04g/sq.ft.
Polygon 1At time = 70.00, total mass in vadose zone = 0.52227E-01g/sq.ft.Mass in gas phase = 0.44732E-02g/sq.ft.Mass in liquid phase = 0.43001E-01g/sq.ft.Mass sorbed = 0.47526E-02g/sq.ft.
Since last printout at time = 69.00Change in Total Mass = -0.71329E-02g/sq.ft.
Advection in from atmosphere = 0.00000 g/sq.ft
R 11)0651+
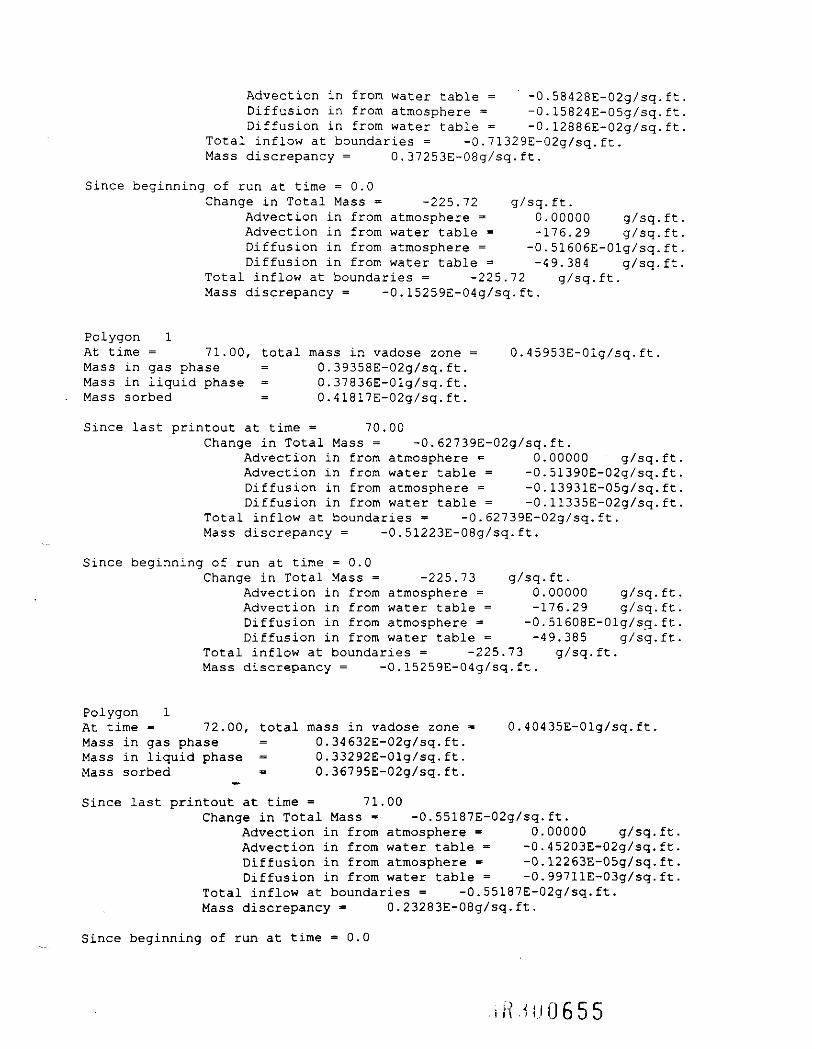
Advection in from water table = " -0.58428E-02g/sq.ftDiffusion in from atmosphere = -0.15824E-05g/sq.ftDiffusion in from water table = -0.12886E-02g/sq.ft
Total inflow at boundaries = -0.71329E-02g/sq.ft.Mass discrepancy = 0.37253E-08g/sq.ft.
Since beginning of run at time = 0.0Change in Total Mass = -225.72 g/sq.ft.
Advection in from atmosphere = 0.00000 g/sq.ft.Advection in from water table = -176.29 g/sq.ft.Diffusion in from atmosphere = -0.51606E-01g/sq.ft.Diffusion in from water table = -49.384 g/sq.ft.
Total inflow at boundaries = -225.72 g/sq.ft.Mass discrepancy = -0.15259E-04g/sq.ft.
Polygon 1At time = 71.00, total mass in vadose zone = 0.45953E-01g/sq.ft.Mass in gas phase = 0.39358E-02g/sq.ft.Mass in liquid phase = 0.37836E-01g/sq.ft.Mass sorbed = 0.41817E-02g/sq.ft.
Since last printout at time = 70.00Change in Total Mass = -0.62739E-02g/sq.ft.
Advection in from atmosphere * 0.00000 g/sq.ft.Advection in from water table = -0.51390E-02g/sq.ft.Diffusion in from atmosphere = -0.13931E-05g/sq.ft.Diffusion in from water table = -0.11335E-02g/sq.ft.
Total inflow at boundaries = -0.62739E-02g/sq.ft.Mass discrepancy = -0.51223E-08g/sq.ft.
Since beginning of run at time = 0.0Change in Total Mass = -225.73 g/sq.ft.
Advection in from atmosphere = 0.00000 g/sq.ft.Advection in from water table = -176.29 g/sq.ft.Diffusion in from atmosphere = -0. 51608E-01g/s_q. ft.Diffusion in from water table = -49.385 g/sq.ft.
Total inflow at boundaries = -225.73 g/sq.ft.Mass discrepancy = -0.15259E-04g/sq.ft.
Polygon 1At time = 72.00, total mass in vadose zone = 0.40435E-01g/sq.ft.Mass in gas phase = 0.34632E-02g/sq.ft.Mass in liquid phase - 0.33292E-01g/sq.ft.Mass sorbed = 0.36795E-02g/sq.ft.
Since last printout at time = 71.00Change in Total Mass = -0.55187E-02g/sq.ft.
Advection in from atmosphere = 0.00000 g/sq.ftAdvection in from water table - -0.45203E-02g/sq.ftDiffusion in from atmosphere = -0.12263E-05g/sq.ftDiffusion in from water table = -0.99711E-03g/sq.ft
Total inflow at boundaries = -0.55187E-02g/sq.ft.Mass discrepancy = 0.23283E-08g/sq.ft.
Since beginning of run at time = 0.0
R.Hi 0655

Change in Total Mass = -225.73 g/sq.ft.Advection in from atmosphere = 0.00000 g/sq.ftAdvection in from water table = -176.30 g/sq.ftDiffusion in from atmosphere = -0.51609E-01g/sq.ftDiffusion in from water table = -49.386 g/sq.ft
Total inflow at boundaries = -225.73 g/sq.ft.Mass discrepancy = -0.15259E-04g/sq.ft.
Polygon 1At time = 73.00, total mass in vadose zone = 0.35580E-01g/sq.ft.Mass in gas phase = 0.30474E-02g/sq.ft.Mass in liquid phase = 0.29295E-01g/sq.ft.Mass sorbed = 0.32377E-02g/sq.ft.
Since last printout at time = 72.00Change in Total Mass = -0.48547E-02g/sq.ft.
Advection in from atmosphere = 0.00000 g/sq.ft.Advection in from water table = -0.39764E-02g/sq.ft.Diffusion in from atmosphere = -0.10795E-05g/sq.ft.Diffusion in from water table = -0.87720E-03g/sq.ft.
Total inflow at boundaries = -0.48547E-02g/sq.ft.Mass discrepancy = 0.93132E-09g/sq.ft.
Since beginning of run at time = 0.0Change in Total Mass = -225.74 g/sq.ft.
Advection in from atmosphere = 0.00000 g/sq.ft.Advection in from water table = -176.30 g/sq.ft.Diffusion in from atmosphere = -0.51610E-01g/sq.ft.Diffusion in from water table = -49.387 g/sq.ft.
Total inflow at boundaries = -225.74 g/sq.ft.Mass discrepancy = -0.15259E-04g/sq.ft.
Polygon 1At time = 74.00, total mass in vadose zone = 0.31309E-01g/sq.ft.Mass in gas phase = 0.26816E-02g/sq.ft.Mass in liquid phase = 0.25778E-01g/sq.ft.Mass sorbed = 0.28491E-02g/sq.ft.
Since last printout at time = 73.00Change in Total Mass = -0.42708E-02g/sq.ft.
Advection in from atmosphere = 0.00000 g/sq.ftAdvection in from water table = -0.34981E-02g/sq.ftDiffusion in from atmosphere = -0.95031E-06g/sq.ftDiffusion in from water table = -0.77176E-03g/sq.ft
Total inflow at boundaries = -0.42708E-02g/sq.ft.Mass discrepancy = -0.27940E-08g/sq.ft.
Since beginning of run at time =0.0Change in Total Mass = -225.74 g/sq.ft.
Advection in from atmosphere = 0.00000 g/sq.ftAdvection in from water table = -176.30 g/sq.ft,Diffusion in from atmosphere = -0.51611E-01g/sq.ft,Diffusion in from water table = -49.388 g/sq.ft,
Total inflow at boundaries = -225.74 g/sq.ft.Mass discrepancy = -0.15259E-04g/sq.ft.
R HH1656

Polygon 1At time = 75.00, total mass in vadose zone = 0.27552E-01g/sq.ft.Mass in gas phase = 0.23598E-02g/sq.ft.Mass in liquid phase = 0.22685E-01g/sq.ft.Mass sorbed = 0.25072E-02g/sq.ft.
Since last printout at time = 74.00Change in Total Mass = -0.37574E-02g/sq.ft.
Advection in from atmosphere = 0.00000 g/sq.ftAdvection in from water table = -0.30776E-02g/sq.ftDiffusion in from atmosphere = -0.83656E-06g/sq.ftDiffusion in from water table = -0.67902E-03g/sq.ft
Total inflow at boundaries = -0.37574E-02g/sq.ft.Mass discrepancy = -0,20955E-08g/sq.ft.
Since beginning of run at time = 0.0Change in Total Mass = -225.75 g/sq.ft.
Advection in from atmosphere = 0.00000 g/sq.ft.Advection in from water table = -176.31 g/sq.ft.Diffusion in from atmosphere = -0.51612E-01g/sq.ft.Diffusion in from water table = -49.388 g/sq.ft.
Total inflow at boundaries = -225.75 g/sq.ft.Mass discrepancy = -0.15259E-04g/sq.ft.
Polygon 1At time = 76.00, total mass in vadose zone = 0.24246E-01g/sq.ft.Mass in gas phase = 0.20766E-02g/sq.ft.Mass in liquid phase = 0.19963E-01g/sq.ft.Mass sorbed = 0.22063E-02g/sq. ft.
Since last printout at time = 75.00Change in Total Mass = -0 . 33059E-02g/sq.ft.
Advection in from atmosphere = 0.00000 g/sq.ft.Advection in from water table = -0.27077E-02g/sq.ft.Diffusion in from atmosphere = -0.73641E-06g/sq.ft.Diffusion in from water table = -0.59744E-03g/sq.ft.
Total inflow at boundaries = -0.33059E-02g/sq.ft.Mass discrepancy = 0.16298E-08g/sq.ft.
Since beginning of run at time = 0.0Change in Total Mass = -225.75 g/sq.ft.
Advection in from atmosphere = 0.00000 g/sq.ft.Advection in from water table = -176.31 g/sq.ft.
"Diffusion in from atmosphere = -0.5l612E-01g/sq.ft.Diffusion in from water table = -49.389 g/sq.ft.
Total inflow at boundaries = -225.75 g/sq.ft.Mass discrepancy = -0.15259E-04g/sq.ft.
Polygon 1At time = 77.00, total mass in vadose zone = 0.21337E-01g/sq.ft.Mass in gas phase = 0.18275E-02g/sq.ft.Mass in liquid phase - 0.17568E-01g/sq.ft.Mass sorbed - 0.19416E-02g/sq.ft.
n 0657

Since last printout at time = 76.00Change in Total Mass = -0.29087E-02g/sq.ft.
Advection in from atmosphere = 0.00000 g/sq.ftAdvection in from water table = -0.23823E-02g/sq.ftDiffusion in from atmosphere = -0.64825E-06g/sq.ftDiffusion in from water table = -0.52569E-03g/sq.ft
Total inflow at boundaries = -0.29087E-02g/sq.ft.Mass discrepancy = -0.25611E-08g/sq.ft.
Since beginning of run at time = 0.0Change in Total Mass = -225.75 g/sq.ft.
Advection in from atmosphere = 0.00000 g/sq.ftAdvection in from water table = -176.31 g/sq.ft.Diffusion in from atmosphere = -0.51613E-01g/sq.ft.Diffusion in from water table = -49.390 g/sq.ft,
Total inflow at boundaries = -225.75 g/sq.ft.Mass discrepancy = -0.30518E-04g/sq.ft.
Polygon 1At time = 78.00, total mass in vadose zone = 0.18778E-01g/sq.ft.Mass in gas phase = 0.16083E-02g/sq.ft.Mass in liquid phase = 0.15461E-Olg/sq.ft.Mass sorbed = 0.17087E-02g/sq.ft.
Since last printout at time = 77.00Change in Total Mass = -0.25593E-02g/sq.ft.
Advection in from atmosphere = 0.00000 g/sq.ftAdvection in from water table = -0.20962E-02g/sq.ftDiffusion in from atmosphere = -0.57064E-06g/sq.ftDiffusion in from water table = -0.46257E-03g/sq.ft.
Total inflow at boundaries = -0.25593E-02g/sq.ft.Mass discrepancy = 0.00000 g/sq.ft.
Since beginning of run at time * 0.0Change in Total Mass = -225.76 g/sq.ft.
Advection in from atmosphere = 0.00000 g/sq.ft.Advection in from water table = -176.31 g/sq.ft,Diffusion in from atmosphere = -0.51614E-01g/sq.ft.Diffusion in from water table = -49.390 g/sq.ft.
Total inflow at boundaries = -225.76 g/sq.ft.Mass discrepancy = -0.15259E-04g/sq.ft.
Polygon 1At time = 79.00", total mass in vadose zone = 0.16526E-01g/sq. ft.Mass in gas phase = 0.14154E-02g/sq.ft.Mass in liquid phase = 0.13607E-01g/sq.ft.Mass sorbed = 0.l5038E-02g/sq.ft.
Since last printout at time = 78.00Change in Total Mass = -0.22520E-02g/sq.ft.
Advection in from atmosphere = 0.00000 g/sq.ftAdvection in from water table = -0.18445E-02g/sq.ftDiffusion in from atmosphere = -0.50232E-06g/sq.ft.Diffusion in from water table = -0.40705E-03g/sq.ft
^.11)0658
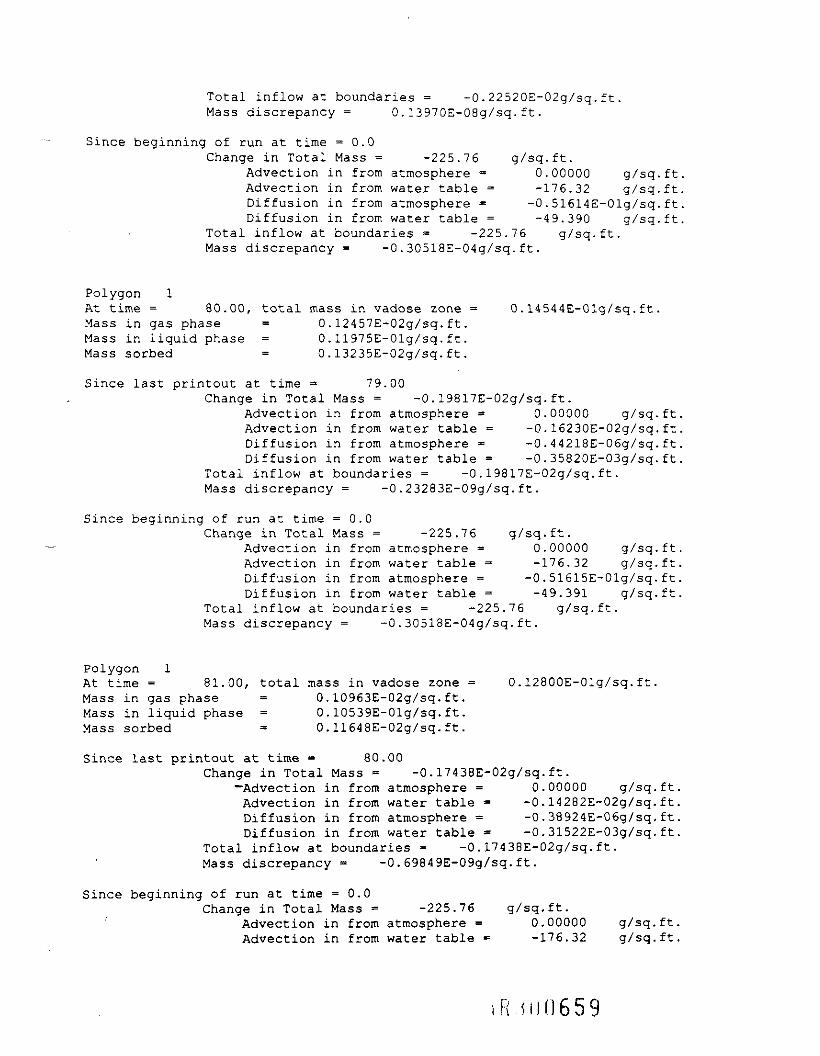
Total inflow at boundaries = -0.22520E-02g/sq.ft.Mass discrepancy = 0.13970E-08g/sq.ft.
Since beginning of run at time =0.0Change in Total Mass = -225.76 g/sq.ft.
Advection in from atmosphere = 0.00000 g/sq.ftAdvection in from water table = -176.32 g/sq.ftDiffusion in from atmosphere = -0.51614E-01g/sq.ftDiffusion in from water table = -49.390 g/sq.ft
Total inflow at boundaries = -225.76 g/sq.ft.Mass discrepancy = -0.30518E-04g/sq.ft.
Polygon 1At time = 80.00, total mass in vadose zone = 0.14544E-01g/sq.ft.Mass in gas phase = 0.12457E-02g/sq.ft.Mass in liquid phase = 0.11975E-01g/sq.ft.Mass sorbed = 0.13235E-02g/sq.ft.
Since last printout at time = 79.00Change in Total Mass = -0.19817E-02g/sq.ft.
Advection in from atmosphere * 0.00000 g/sq.ftAdvection in from water table = -0.16230E-02g/sq.ftDiffusion in from atmosphere = -0.44218E-06g/sq.ftDiffusion in from water table = -0.35820E-03g/sq.ft
Total inflow at boundaries = -0.19817E-02g/sq.ft.Mass discrepancy = -0.23283E-09g/sq.ft.
Since beginning of run at time = 0.0Change in Total Mass = -225.76 g/sq.ft.
Advection in from atmosphere = 0.00000 g/sq.ftAdvection in from water table = -176.32 g/sq.ft.Diffusion in from atmosphere = -0.51615E-01g/sq.ft,Diffusion in from water table = -49.391 g/sq.ft,
Total inflow at boundaries = -225.76 g/sq.ft.Mass discrepancy = -0.30518E-04g/sq.ft.
Polygon 1At time = 81.00, total mass in vadose zone = 0.12800E-01g/sq.ft.Mass in gas phase = 0.10963E-02g/sq.ft.Mass in liquid phase = 0.10539E-01g/sq.ft.Mass sorbed = 0.11648E-02g/sq.ft.
Since last printout at time = 80.00Change in Total Mass = -0.17438E-02g/sq.ft.
•Advection in from atmosphere = 0.00000 g/sq.ftAdvection in from water table = -0.14282E-02g/sq.ftDiffusion in from atmosphere = -0.38924E-06g/sq,ftDiffusion in from water table = -0.31522E-03g/sq.ft
Total inflow at boundaries = -0.17438E-02g/sq.ft.Mass discrepancy = -0.69849E-09g/sq.ft.
Since beginning of run at time =0.0Change in Total Mass = -225.76 g/sq,ft.
Advection in from atmosphere = 0.00000 g/sq.ft.Advection in from water table = -176.32 g/sq.ft
R (00659

Diffusion in from atmosphere = -0.51615E-01g/sq.ftDiffusion in from water table = -49.391 g/sq.ft
Total inflow at boundaries = -225.76 g/sq.ft.Mass discrepancy = -0.15259E-04g/sq.ft.
Polygon 1At time = 82.00, total mass in vadose zone = 0.11266E-01g/sq.ft.Mass in gas phase = 0.96489E-03g/sq.ft.Mass in liquid phase = 0.92756E-02g/sq.ft.Mass sorbed = 0.10252E-02g/sq.ft.
Since last printout at time = 81.00Change in Total Mass = -0.15346E-02g/sq.ft.
Advection in from atmosphere = 0.00000 g/sq.ft.Advection in from water table = -0.12569E-02g/sq.ft.Diffusion in from atmosphere = -0.34264E-06g/sq.ft.Diffusion in from water table = -0.27740E-03g/sq.ft.
Total inflow at boundaries = -0.15346E-02g/sq.ft.Mass discrepancy - -0.93l32E-09g/sq.ft.
Since beginning of run at time = 0.0Change in Total Mass = -225.76 g/sq.ft.
Advection in from atmosphere = 0.00000 g/sq.ft.Advection in from water table = -176.32 g/sq.ft.Diffusion in from atmosphere = -0.51615E-01g/sq.ft.Diffusion in from water table = -49.391 g/sq.ft.
Total inflow at boundaries = -225.76 g/sq.ft.Mass discrepancy = -0.30518E-04g/sq.ft-
Polygon 1At time = 83.00, total mass in vadose zone = 0.99152E-02g/sq.ft.Mass in gas phase = 0.84922E-03g/sq.ft.Mass in liquid phase = 0.81637E-02g/sq.ft.Mass sorbed = 0.90226E-03g/sq.ft.
Since last printout at time = 82.00Change in Total Mass = -0.13505E-02g/sq.ft.
Advection in from atmosphere = 0.00000 g/sq.ft.Advection in from water table = -0.11061E-02g/sq.ft.Diffusion in from atmosphere = -0.30161E-06g/sq.ft.Diffusion in from water table = -0.24413E-03g/sq.ft.
Total inflow at boundaries = -0.13505E-02g/sq.ft.Mass discrepancy - 0.34925E-09g/sq.ft.
Since beginning of Tun at time = 0.0Change in Total Mass = -225.76 g/sq.ft.
Advection in from atmosphere = 0.00000 g/sq.ft.Advection in from water table = -176.32 g/sq.ft.Diffusion in from atmosphere = -0.51616E-01g/sq.ft.Diffusion in from water table =- -49.392 g/sq.ft.
Total inflow at boundaries = -225.76 g/sq.ft.Mass discrepancy = -0.30518E-04g/sq.ft.
Polygon
R 100660
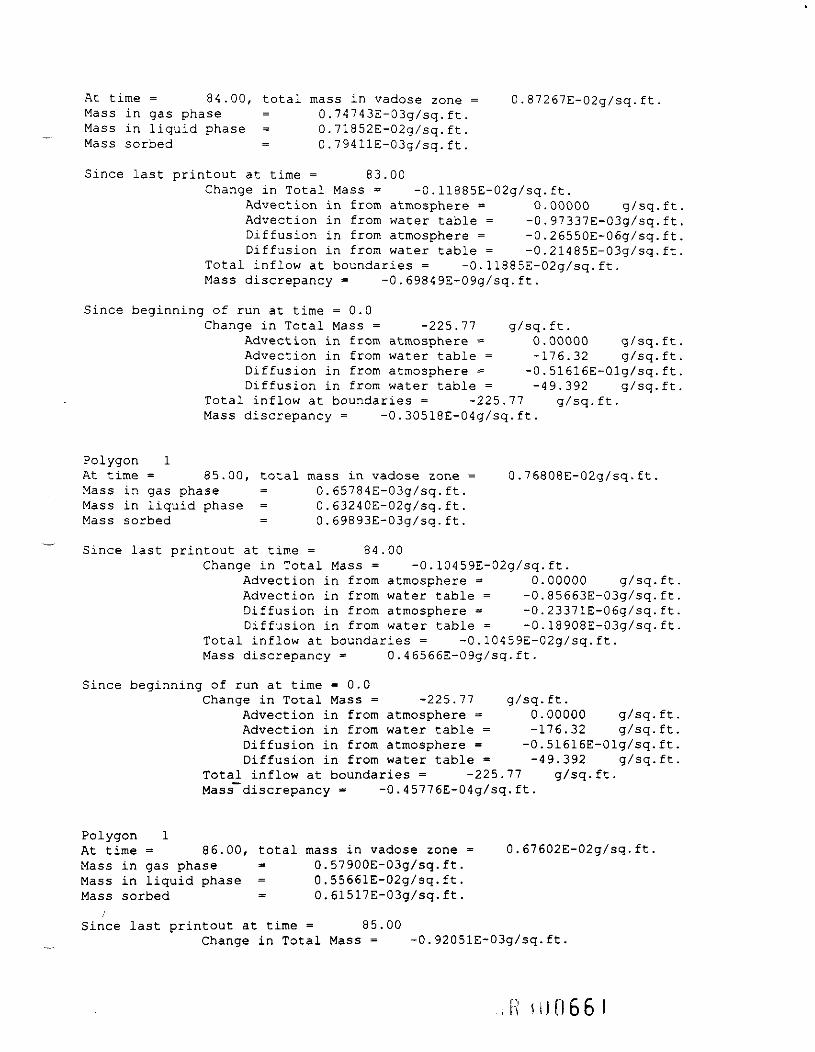
At time = 84.00, total mass in vadose zone = 0.87267E-02g/sq.ft.Mass in gas phase = 0.74743E-03g/sq.ft.Mass in liquid phase = 0.71852E-02g/sq.ft.Mass sorbed = 0.79411E-03g/sq.ft.
Since last printout at time = 83.00Change in Total Mass = -0.11885E-02g/sq.ft.
Advection in from atmosphere * 0.00000 g/sq.ftAdvection in from water table = -0.97337E-03g/sq.ftDiffusion in from atmosphere = -0.26550E-06g/sq.ftDiffusion in from water table = -0.21485E-03g/sq.ft
Total inflow at boundaries = -0.11885E-02g/sq.ft.Mass discrepancy = -0.69849E-09g/sq.ft.
Since beginning of run at time = 0.0Change in Total Mass = -225.77 g/sq.ft.
Advection in from atmosphere = 0.00000 g/sq.ftAdvection in from water table = -176.32 g/sq.ftDiffusion in from atmosphere = -0.51616E-01g/sq.ftDiffusion in from water table = -49.392 g/sq.ft.
Total inflow at boundaries = -225.77 g/sq.ft.Mass discrepancy = -0.30518E-04g/sq.ft.
Polygon 1At time = 85.00, total mass in vadose zone = 0.76808E-02g/sq.ft.Mass in gas phase = 0.65784E-03g/sq.ft.Mass in liquid phase = 0.63240E-02g/sq.ft.Mass sorbed = 0.69893E-03g/sq.ft.
Since last printout at time = 84.00Change in Total Mass = -0.10459E-02g/sq.ft.
Advection in from atmosphere =* 0.00000 g/sq.ft.Advection in from water table = -0.85663E-03g/sq.ft.Diffusion in from atmosphere =* -0.23371E-06g/sq.ft.Diffusion in from water table = -0.18908E-03g/sq.ft.
Total inflow at boundaries = -0.10459E-02g/sq.ft.Mass discrepancy = 0.46566E-09g/sq.ft.
Since beginning of run at time = 0.0Change in Total Mass = -225.77 g/sq.ft.
Advection in from atmosphere = 0.00000 g/sq.ft.Advection in from water table = -176.32 g/sq.ft.Diffusion in from atmosphere = -0.51616E-01g/sq.ft.Diffusion in from water table = -49.392 g/sq.ft.
Total inflow at boundaries = -225.77 g/sq.ft.Mass""discrepancy = -0 . 45776E-04g/sq. ft.
Polygon 1At time = 86.00, total mass in vadose zone = 0.67602E-02g/sq.ftMass in gas phase = 0.57900E-03g/sq.ft.Mass in liquid phase = 0.55661E-02g/sq.ft.Mass sorbed - 0.61517E-03g/sq.ft.
Since last printout at time = 85.00Change in Total Mass = -0.92051E-03g/sq.ft.
066

Advection in from atmosphere = 0.00000 g/sq.ftAdvection in from water table = -0.75390E-03g/sq.ftDiffusion in from atmosphere = -0.20572E-06g/sq.ftDiffusion in from water table = -0.1664lE-03g/sq.ft
Total inflow at boundaries = -0.92051E-03g/sq.ft.Mass discrepancy = -0.34925E-09g/sq.ft.
Since beginning of run at time = 0.0Change in Total Mass = -225.77 g/sq.ft.
Advection in from atmosphere = 0.00000 g/sq.ft,Advection in from water table = -176.32 g/sq.ft,Diffusion in from atmosphere = -0.51616E-01g/sq.ft,Diffusion in from water table = -49.392 g/sq.ft,
Total inflow at boundaries = -225.77 g/sq.ft.Mass discrepancy = -0.45776E-04g/sq.ft.
Polygon 1At time = 87.00, total mass in vadose zone = 0.59501E-02g/sq.ft.Mass in gas phase = 0.50962E-03g/sq.ft.Mass in liquid phase = 0.48990E-02g/sq.ft.Mass sorbed = 0.54145E-03g/sq.ft.
Since last printout at time = 86.00Change in Total Mass = -0.81014E-03g/sq.ft.
Advection in from atmosphere = 0.00000 g/sq.ftAdvection in from water table = -0.66350E-03g/sq.ftDiffusion in from atmosphere = -0.18109E-06g/sq.ftDiffusion in from water table = -0.14646E-03g/sq.ft
Total inflow at boundaries = -0.81014E-03g/sq.ft.Mass discrepancy = 0.58208E-10g/sq.ft.
Since beginning of run at time = 0.0Change in Total Mass = -225.77 g/sq.ft.
Advection in from atmosphere * 0.00000 g/sq.ft.Advection in from water table = -176.32 g/sq.ft.Diffusion in from atmosphere = -0.51616E-01g/sq.ft.Diffusion in from water table = -49.392 g/sq.ft.
Total inflow at boundaries = -225.77 g/sq.ft.Mass discrepancy = -0.45776E-04g/sq.ft.
Polygon 1At time = 88.00, total mass in vadose zone = 0.52371E-02g/sq.ft.Mass in gas phase = 0.44855E-03g/sq.ft.Mass in liquid phase = 0.43120E-02g/sq.ft.Mass sorbed " = 0.47656E-03g/sq.ft.
Since last printout at time = 87.00Change in Total Mass = -0.71301E-03g/sq-ft.
Advection in from atmosphere = 0.00000 g/sq.ftAdvection in from water table = -0.58395E-03g/sq.ftDiffusion in from atmosphere = -0.15940E-06g/sq.ftDiffusion in from water table = -0.12890E-03g/sq.ft
Total inflow at boundaries = -0.71301E-03g/sq.ft.Mass discrepancy = -0.34925E-09g/sq.ft.
0662

Since beginning of run at time = 0.0Change in Total Mass = -225.77 g/sq.ft.
Advection in from atmosphere - 0.00000 g/sq.ftAdvection in from water table = -176.33 g/sq.ftDiffusion in from atmosphere = -0.51617E-01g/sq.ftDiffusion in from water table = -49.392 g/sq.ft
Total inflow at boundaries = -225.77 g/sq.ft.Mass discrepancy = -0.61035E-04g/sq.ft.
Polygon 1At time = 89.00, total mass in vadose zone = 0.46096E-02g/sq.ft.Mass in gas phase = 0.39480E-03g/sq.ft.Mass in liquid phase = 0.37953E-02g/sq.ft.Mass sorbed = 0.41946E-03g/sq.ft.
Since last printout at time = 88.00Change in Total Mass = -0.62753E-03g/sq.ft.
Advection in from atmosphere = 0.00000 g/sq.ftAdvection in from water table = -0.51394E-03g/sq.ftDiffusion in from atmosphere = -0.14032E-06g/sq.ftDiffusion in from water table = -0.11345E-03g/sq.ft
Total inflow at boundaries = -0.62753E-03g/sq.ft.Mass discrepancy = 0.64028E-09g/sq.ft.
Since beginning of run at time =0.0Change in Total Mass = -225.77 g/sq.ft.
Advection in from atmosphere = 0.00000 g/sq.ft.Advection in from water table = -176.33 g/sq.ft,Diffusion in from atmosphere = -0.51617E-01g/sq.ft,Diffusion in from water table = -49-393 g/sq.ft.
Total inflow at boundaries = -225.77 g/sq.ft.Mass discrepancy = -0.45776E-04g/sq.ft.
Polygon 1At time = 90.00, total mass in vadose zone = 0.40572E-02g/sq.ft.Mass in gas phase * 0.34750E-03g/sq.ft.Mass in liquid phase - 0.33405E-02g/sq.ft.Mass sorbed * 0.36920E-03g/sq.ft-
Since last printout at time = 89.00Change in Total Mass = -0.55231E-03g/sq.ft.
Advection in from atmosphere = 0.00000 g/sq.ftAdvection in from water table = -0.45233E-03g/sq.ftDiffusion in from atmosphere =• -0.12351E-06g/sq.ft
-Diffusion in from water table = -0.99854E-04g/sq.ftTotal inflow at boundaries = -0.55231E-03g/sq.ft.Mass discrepancy = -0.29104E-09g/sq.ft.
Since beginning of run at time =0.0Change in Total Mass = -225.77 g/sq.ft.
Advection in from atmosphere = 0.00000 g/sq.ft,Advection in from water table = -176.33 g/sq.ft,Diffusion in from atmosphere = -0.51617E-01g/sq.ft.Diffusion in from water table = -49.393 g/sq.ft,
Total inflow at boundaries = -225.77 g/sq.ft.
R H)0663
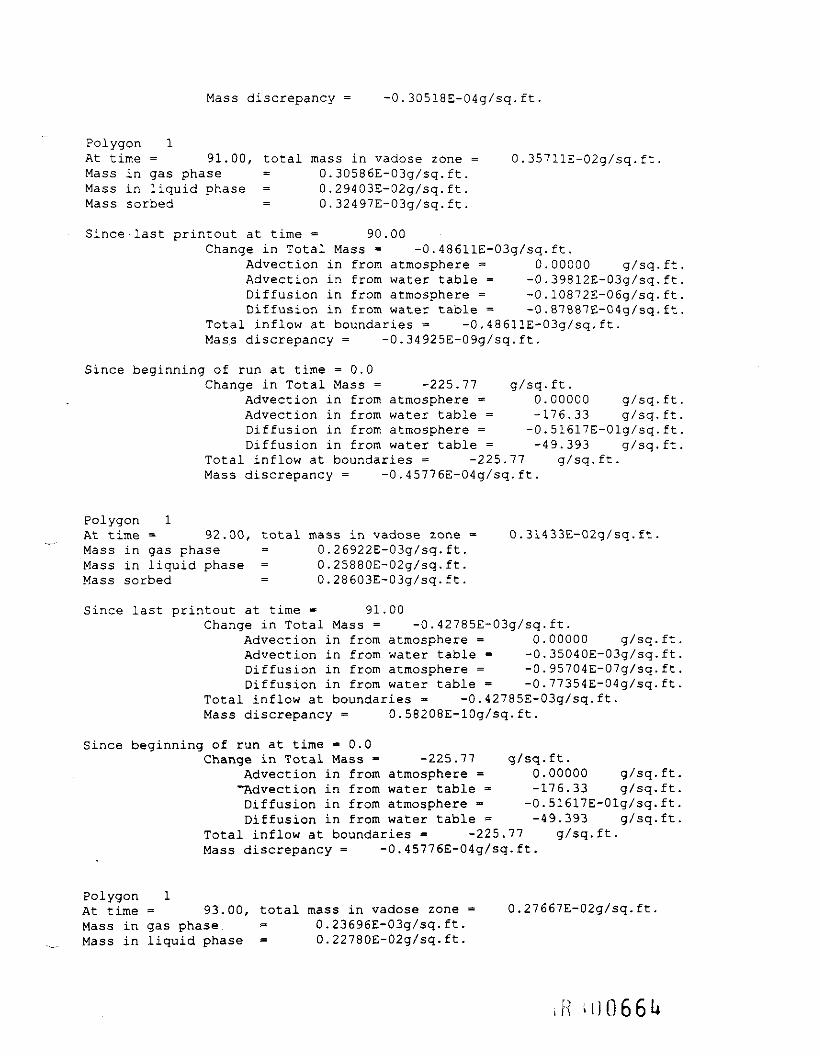
Mass discrepancy = -0.30518E-04g/sq.ft.
Polygon 1At time = 91.00, total mass in vadose zone = 0.35711E-02g/sq.ft.Mass in gas phase = 0.30586E-03g/sq.ft.Mass in liquid phase = 0.29403E-02g/sq.ft.Mass sorbed = 0.32497E-03g/sq.ft.
Since-last printout at time = 90.00Change in Total Mass = -0.48611E-03g/sq.ft.
Advection in from atmosphere = 0.00000 g/sq.ftAdvection in from water table = -0.39812E-03g/sq.ftDiffusion in from atmosphere = -0.10872E-06g/sq.ftDiffusion in from water table = -0.87887E-04g/sq.ft
Total inflow at boundaries = -0.48611E-03g/sq.ft.Mass discrepancy = -0.34925E-09g/sq.ft.
Since beginning of run at time = 0.0Change in Total Mass = -225.77 g/sq.ft.
Advection in from atmosphere = 0.00000 g/sq.ftAdvection in from water table = -176.33 g/sq.ft,Diffusion in from atmosphere = -0.51617E-01g/sq.ftDiffusion in from water table = -49.393 g/sq.ft,
Total inflow at boundaries = -225.77 g/sq.ft.Mass discrepancy = -0.45776E-04g/sq.ft.
Polygon 1At time = 92.00, total mass in vadose zone = 0.31433E-02g/sq.ft.Mass in gas phase = 0.26922E-03g/sq.ft.Mass in liquid phase = 0.25880E-02g/sq.ft.Mass sorbed = 0.28603E-03g/sq.ft.
Since last printout at time = 91.00Change in Total Mass = -0.42785E-03g/sq.ft.
Advection in from atmosphere = 0.00000 g/sq.ftAdvection in from water table = -0.35040E-03g/sq.ftDiffusion in from atmosphere = -0.95704E-07g/sq.ftDiffusion in from water table = -0.77354E-04g/sq.ft
Total inflow at boundaries = -0.42785E-03g/sq.ft.Mass discrepancy = 0.58208E-10g/sq.ft.
Since beginning of run at time = 0.0Change in Total Mass = -225.77 g/sq.ft.
Advection in from atmosphere = 0.00000 g/sq.ft."Advection in from water table = -176.33 g/sq.ft,Diffusion in from atmosphere = -0.51617E-01g/sq.ft,Diffusion in from water table = -49.393 g/sq.ft,
Total inflow at boundaries = -225.77 g/sq.ft.Mass discrepancy = -0.45776E-04g/sq.ft.
Polygon 1At time = 93.00, total mass in vadose zone = 0.27667E-02g/sq.ft,Mass in gas phase = 0.23696E-03g/sq.ft.Mass in liquid phase = 0.22780E-02g/sq.ft.
R U10661+

Mass sorbed = 0.25l76E-03g/sq.ft.
Since last printout at time = 92.00Change in Total Mass = -0.37658E-03g/sq.ft.
Advection in from atmosphere = 0.00000 g/sq.ftAdvection in from water table = -0.30841E-03g/sq.ftDiffusion in from atmosphere = -0.84243E-07g/sq.ftDiffusion in from water table = -0.68085E-04g/sq.ft.
Total inflow at boundaries = -0.37658E-03g/sq.ft.Mass discrepancy = -0.49477E-09g/sq.ft.
Since beginning of run at time = 0.0Change in Total Mass = -225.77 g/sq.ft.
Advection in from atmosphere = 0.00000 g/sq.ft.Advection in from water table = -176.33 g/sq.ft.Diffusion in from atmosphere = -0.51617E-01g/sq.ft.Diffusion in from water table = -49.393 g/sq.ft.
Total inflow at boundaries = -225.77 g/sq.ft.Mass discrepancy = -0.45776E-04g/sq.ft.
Polygon 1At time = 94.00, total mass in vadose zone = 0.24353E-02g/sq.ft.Mass in gas phase = 0.20858E-03g/sq.ft.Mass in liquid phase = 0.20051E-02g/sq.ft.Mass sorbed = 0.22160E-03g/sq.ft.
Since last printout at time = 93.00Change in Total Mass = -0.33145E-03g/sq.ft.
Advection in from atmosphere = 0.00000 g/sq.ftAdvection in from water table = -0.27145E-03g/sq.ftDiffusion in from atmosphere = -0.74155E-07g/sq.ftDiffusion in from water table = -0.59927E-04g/sq.ft
Total inflow at boundaries = -0.33145E-03g/sq.ft.Mass discrepancy = 0.14552E-09g/sq.ft.
Since beginning of run at time = 0.0Change in Total Mass = -225.77 g/sq.ft.
Advection in from atmosphere = 0.00000 g/sq.ft,Advection in from water table = -176.33 g/sq.ft.Diffusion in from atmosphere = -0.51617E-01g/sq.ft,Diffusion in from water table = -49.393 g/sq.ft,
Total inflow at boundaries = -225.77 g/sq.ft.Mass discrepancy = -0.30518E-04g/sq.ft.
Polygon 1 "-At time = 95.00, total mass in vadose zone = 0.21435E-02g/sq.ft.Mass in gas phase = 0.18359E-03g/sq.ft.Mass in liquid phase = 0.17649E-02g/sq.ft.Mass sorbed = 0.19506E-03g/sq.ft.
Since last printout at time = 94.00Change in Total Mass = -0.29173E-03g/sq.ft.
Advection in from atmosphere = 0.00000 g/sq.ftAdvection in from water table - -0.23892E-03g/sq.ftDiffusion in from atmosphere - -0.65275E-07g/sq.ft
10665
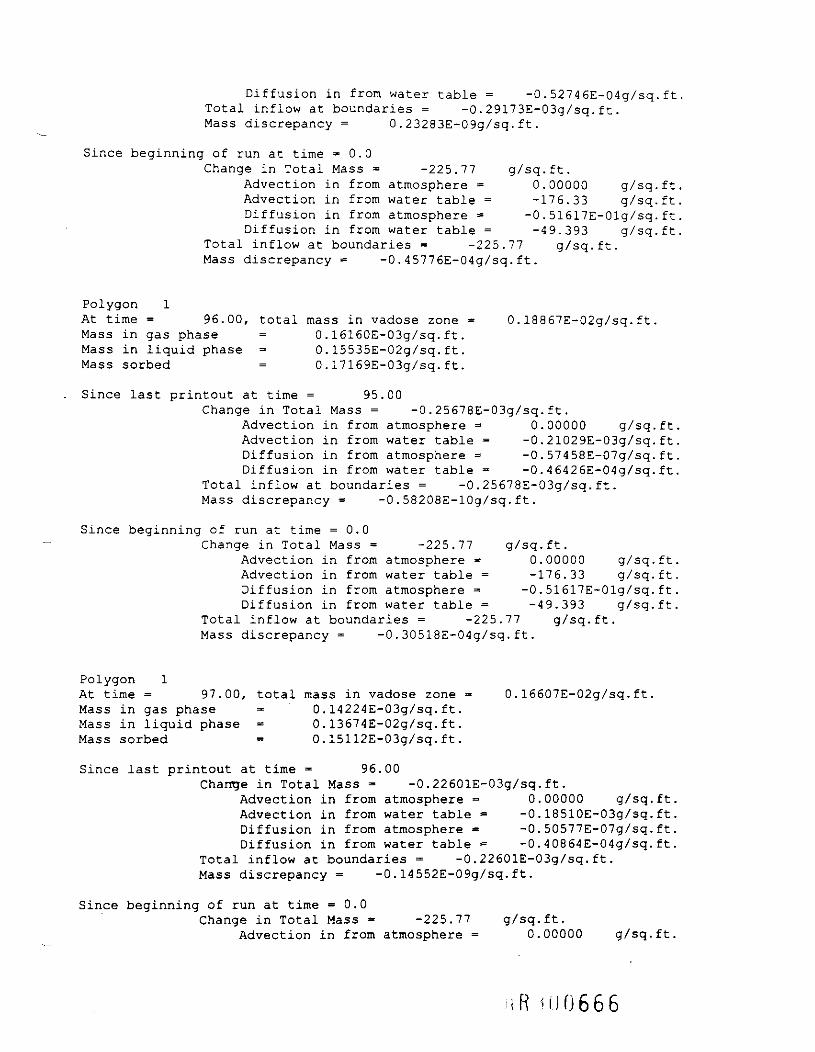
Diffusion in from water table = -0.52746E-04g/sq.ftTotal inflow at boundaries = -0.29173E-03g/sq.ft.Mass discrepancy = 0.23283E-09g/sq.ft.
Since beginning of run at time =0.0Change in Total Mass = -225.77 g/sq.ft.
Advection in from atmosphere = 0.00000 g/sq.ft,Advection in from water table = -176.33 g/sq.ft,Diffusion in from atmosphere = -0.51617E-01g/sq.ft,Diffusion in from water table = -49.393 g/sq.ft,
Total inflow at boundaries = -225.77 g/sq.ft.Mass discrepancy = -0.45776E-04g/sq.ft.
Polygon 1At time = 96.00, total mass in vadose zone = 0.18867E-02g/sq.ft.Mass in gas phase = 0.16160E-03g/sq.ft.Mass in liquid phase = 0.15535E-02g/sq.ft.Mass sorbed = 0.17169E-03g/sq.ft.
Since last printout at time = 95.00Change in Total Mass = -0.25678E-03g/sq.ft.
Advection in from atmosphere * 0.00000 g/sq.ft.Advection in from water table = -0.21029E-03g/sq.ft.Diffusion in from atmosphere = -0.57458E-07g/sq.ft.Diffusion in from water table = -0.46426E-04g/sq.ft.
Total inflow at boundaries = -0.25678E-03g/sq.ft.Mass discrepancy * -0.58208E-10g/sq.ft.
Since beginning of run at time = 0.0Change in Total Mass = -225.77 g/sq.ft.
Advection in from atmosphere = 0.00000 g/sq.ft.Advection in from water table = -176.33 g/sq.ft.Diffusion in from atmosphere = -0.51617E-01g/sq.ft.Diffusion in from water table = -49.393 g/sq.ft.
Total inflow at boundaries = -225.77 g/sq.ft.Mass discrepancy = -0.30518E-04g/sq.ft.
Polygon 1At time = 97.00, total mass in vadose zone - 0.16607E-02g/sq.ft.Mass in gas phase = 0.14224E-03g/sq.ft.Mass in liquid phase = 0.13674E-02g/sq.ft.Mass sorbed = 0.15112E-03g/sq.ft.
Since last printout at time = 96.00Change in Total Mass = -0.22601E-03g/sq.ft.
Advection in from atmosphere = 0.00000 g/sq.ft.Advection in from water table = -0.18510E-03g/sq.ft.Diffusion in from atmosphere = -0.50577E-07g/sq.ft.Diffusion in from water table - -0.40864E-04g/sq.ft.
Total inflow at boundaries = -0.22601E-03g/sq.ft.Mass discrepancy = -0.14552E-09g/sq.ft.
Since beginning of run at time = 0.0Change in Total Mass = -225.77 g/sq.ft.
Advection in from atmosphere = 0.00000 g/sq.ft.
R 11)0666

Advection in from water table = -176.33 g/sq.ftDiffusion in from atmosphere = -0.51617E-01g/sq.ftDiffusion in from water table = -49.393 g/sq.ft
Total inflow at boundaries = -225.77 g/sq.ft.Mass discrepancy = -0.30518E-04g/sq.ft.
Polygon 1At time = 98.00, total mass in vadose zone = 0.14618E-02g/sq.ft.Mass in gas phase = 0.12520E-03g/sq.ft.Mass in liquid phase = 0.12036E-02g/sq.ft.Mass sorbed = 0.13302E-03g/sq.ft.
Since last printout at time = 97.00Change in Total Mass = -0.19893E-03g/sq.ft.
Advection in from atmosphere = 0.00000 g/sq.ft.Advection in from water table = -0.16292E-03g/sq.ft.Diffusion in from atmosphere = -0.44521E-07g/sq.ft.Diffusion in from water table = -0.35968E-04g/sq.ft.
Total inflow at boundaries - -0.19893E-03g/sq.ft.Mass discrepancy = -0.14552E-09g/sq.ft.
Since beginning of run at time = 0.0Change in Total Mass = -225.77 g/sq.ft.
Advection in from atmosphere = 0.00000 g/sq.ft.Advection in from water table = -176.33 g/sq.ft.Diffusion in from atmosphere = -0.51617E-01g/sq.ft.Diffusion in from water table = -49.393 g/sq.ft.
Total inflow at boundaries = -225.77 g/sq.ft.Mass discrepancy = -0.30518E-04g/sq.ft.
Polygon 1At time = 99.00, total mass in vadose zone = 0.12867E-02g/sq.ft.Mass in gas phase = 0.11020E-03g/sq.ft.Mass in liquid phase = 0.10594E-02g/sq.ft.Mass sorbed = 0.11709E-03g/sq.ft.
Since last printout at time = 98.00Change in Total Mass = -0.17510E-03g/sq.ft.
Advection in from atmosphere = 0.00000 g/sq.ftAdvection in from water table = -0.14340E-03g/sq.ftDiffusion in from atmosphere = -0.39189E-07g/sq.ftDiffusion in from water table = -0.31659E-04g/sq.ft
Total inflow at boundaries =* -0.17510E-03g/sq.ft.Mass discrepancy = 0.00000 g/sq.ft.
Since beginning of run at time =0.0Change in Total Mass = -225.77 g/sq.ft.
Advection in from atmosphere = 0.00000 g/sq.ft.Advection in from water table = -176.33 g/sq.ft,Diffusion in from atmosphere = -0.51618E-01g/sq.ft,Diffusion in from water table = -49.393 g/sq.ft.
Total inflow at boundaries =* -225.77 g/sq.ft.Mass discrepancy = -0.45776E-04g/sq.ft.
0667
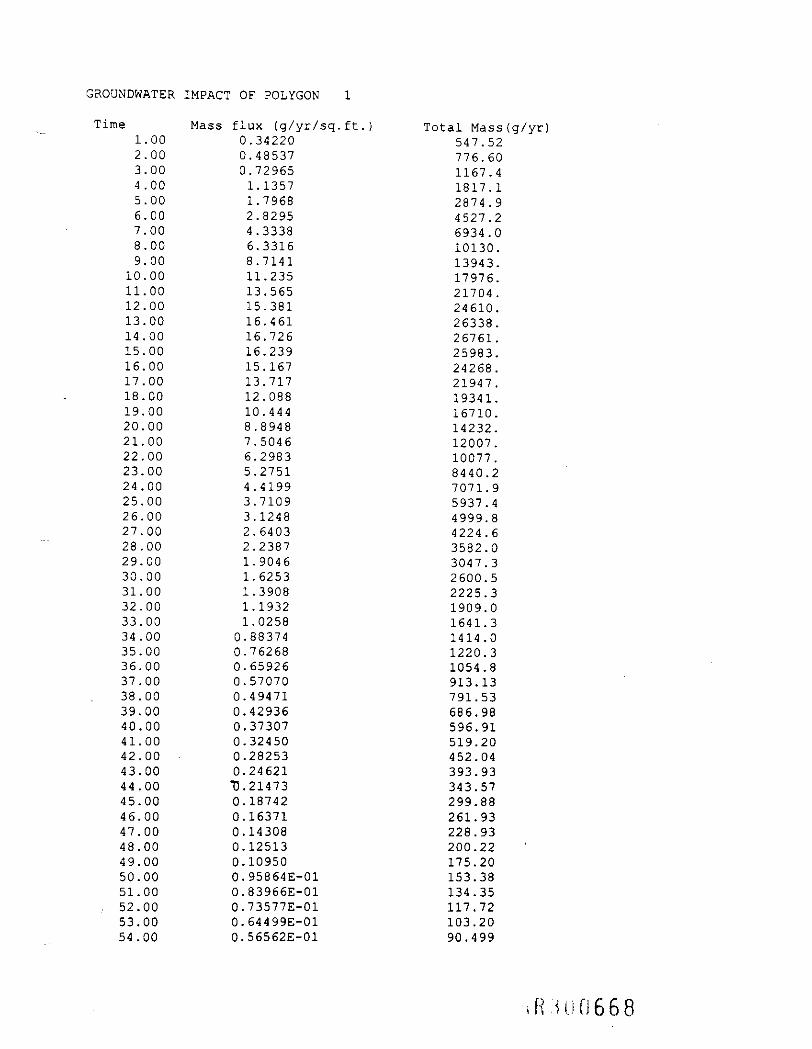
Time Mass flux (g/yr/sq.ft.) Total Mass(g/yr)1.00 0.34220 547.522-00 0.48537 776.603.00 0.72965 1167.44.00 1.1357 1817.15.00 1.7968 2874.96.00 2.8295 4527.27.00 4.3338 6934.08.00 6.3316 10130.9.00 8.7141 13943.
10.00 11.235 17976.11.00 13.565 21704.12.00 15.381 24610.13.00 16.461 26338.14.00 16.726 26761.15.00 16.239 25983.16.00 15.167 24268.17.00 13.717 21947.18.00 12.088 19341.19.00 10.444 16710.20.00 8.8948 14232.21.00 7.5046 12007.22.00 6.2983 10077.23.00 5.2751 8440.224.00 4.4199 7071.925.00 3.7109 5937.426.00 3.1248 4999.827.00 2.6403 4224.628.00 2.2387 3582.029.00 1.9046 3047.330.00 1.6253 2600.531.00 1.3908 2225.332.00 1.1932 1909.033.00 1.0258 1641.334.00 0.88374 1414.035.00 0.76268 1220.336.00 0.65926 1054.837.00 0.57070 913.1338.00 0.49471 791.5339.00 0.42936 686.9840.00 0.37307 596.9141.00 0.32450 519.2042.00 • 0.28253 452.0443.00 0.24621 393.9344.00 T).21473 343.5745.00 0.18742 299.8846.00 0.16371 261.9347.00 0.14308 228.9348.00 0.12513 200.2249.00 0.10950 175.2050.00 0.95864E-01 153.3851.00 0.83966E-01 134.35
, 52.00 0.73577E-01 117.7253.00 0.64499E-01 103.2054.00 0.56562E-01 90.499
.R n.if)668

55.00 0.49617E-01 79.38856.00 0.43539E-01 69.66257.00 0.38215E-01 61.14558.00 0.33551E-01 53.68259.00 0.29463E-01 47.14160.00 0.25879E-01 41.40661.00 0.22735E-01 36.37662.00 0.19977E-01 31.96263.00 0.17556E-01 28.08964.00 0.15430E-01 24.68865.00 0.13564E-01 21.70266.00 0.11925E-01 19.08067.00 0.10485E-01 16.77668.00 0.92200E-02 14.75269.00 0.81084E-02 12.97370.00 0.71313E-02 11.41071.00 0.62725E-02 10.03672.00 0.55175E-02 8.827973.00 0.48536E-02 7.765874.00 0.42699E-02 6.831875.00 0.37566E-02 6.010576.00 0.33051E-02 5.288277.00 0.29080E-02 4.652978.00 0.25588E-02 4.094079.00 0.22515E-02 3.602480.00 0.19812E-02 3.170081.00 0.17435E-02 2.789582.00 0.15343E-02 2.454883.00 0.13502E-02 2.160384.00 0.11882E-02 1.901285.00 0.10457E-02 1.673186.00 0.92031E-03 1.472587.00 0.80996E-03 1.295988.00 0.71285E-03 1.140689.00 0.62739E-03 1.003890.00 0.55219E-03 0.8835091.00 0.48600E-03 0.7776192.00 0.42776E-03 0.6844193.00 0.37649E-03 0.6023994.00 0.33138E-03 0.5302095.00 0.29167E-03 0.4666796.00 0.25672E-03 0.4107597.00 0.22596E-03 0.3615498.00 0.19889E-03 0.3182299.00 0.17506E-03 0.28010
Time (yr) Mass (g/yr) Cumulative Mass (g)1.00 547.52 547.522.00 776.60 1324.13.00 1167.4 2491.64.00 1817.1 4308.65.00 2874.9 7183.56.00 4527.2 11711.
R ni0669

7.00 6934.0 18645.8.00 10130. 28775.9.00 13943. 42718.
10.00 17976. 60694.11.00 21704. 82398.12.00 24610. 0.10701E+0613.00 26338. 0.13335E+0614.00 26761. 0.16011E+0615.00 25983. 0.18609E+0616.00 24268. 0.21036E+0617.00 21947. 0.23230E+0618.00 19341. 0.25165E+0619.00 16710. 0.26836E+0620.00 14232. 0.28259E+0621.00 - 12007. 0.29459E+0622.00 10077. 0.30467E+0623.00 8440.2 0.31311E+0624.00 7071.9 0.32018E+0625.00 5937.4 0.32612E+G626.00 4999.8 0.33112E+0627.00 4224.6 0.33535E+0628.00 3582.0 0.33893E+0629.00 3047.3 0.34197E+0630.00 2600.5 0.34458E+0631.00 2225.3 0.34680E+0632.00 1909.0 0.34871E+0633.00 1641.3 0.35035E+0634.00 1414.0 0.35177E-t-0635.00 1220.3 0.35299E+0636.00 1054.8 0.35404E+0637.00 913.13 0.35495E+0638.00 791.53 0.35574E+0639.00 686.98 0.35643E+0640.00 596.91 0.35703E+0641.00 519.20 0.35755E+0642.00 452.04 0.35800E+0643.00 393.93 0.35839E+0644.00 343.57 0.35874E+0645.00 299.88 0.35904E+0646.00 261.93 0.35930E+0647.00 228.93 0.35953E+0648.00 200.22 0.35973E+0649.00 175.20 0.35990E+0650.00 153.38 0.36006E+0651.00 134.35 0.36019E+0652.00 _117.72 0.36031E+0653.00 103.20 0.36041E+0654.00 90.499 0.36050E+0655.00 79.388 0.36058E+0656.00 69.662 0.36065E+0657.00 61.145 0.36071E+0658.00 53.682 0.36077E+0659.00 47.141 0.36081E+0660.00 41.406 0.36086E+0661.00 36.376 0.36089E+0662.00 31.962 0.36092E+0663.00 28.089 0.36095E+06
i HI0670

64.00 24.688 0.36098E+0665.00 21.702 0.36100E+0666.00 19.080 0.36102E+0667.00 16.776 0.36103E+0668.00 14.752 0.36105E+Q669.00 12.973 0.36106E+0670.00 11.410 0.36107E+0671.00 10.036 0.36108E+0672.00 8.8279 0.36109E+0673.00 7.7658 0.36110E+0674.00 6.8318 0.36111E+0675.00 6.0105 0.36111E+0676.00 5.2882 0.36112E+0677.00 4.6529 0.36112E+0678.00 4.0940 0.36113E+0679.00 3.6024 0.36113E+0680.00 3.1700 0.36113E+0681.00 2.7895 0.36H4E+0682.00 2.4548 0.36114E+0683.00 2.1603 0.36114E+0684.00 1.9012 0.36114E+0685.00 1.6731 0.36114E+0686.00 1.4725 0.36115E+0687.00 1.2959 0.36115E+0688.00 1.1406 0.36115E+0689.00 1.0038 0.36115E+0690.00 0.88350 0.36115E+0691.00 0.77761 0.36115E+0692.00 0.68441 0.36115E+0693.00 0.60239 0.36115E+0694,00 0.53020 0.36115E+0695.00 0.46667 0.36115E+0696.00 0.41075 0.36115E+0697.00 0.36154 0.36115E+0698.00 0.31822 0.36115E+0699.00 0.28010 0.36115E+06
HJ067

Appendix B
Technical Impracticability Evaluation Report
BLASLAND. BOUCK & LEE, INC.*
H