roi - building the business case for professional...
TRANSCRIPT

OAUG Collaborate 08 Copyright 2008 Hitachi Consulting and Project Partners LLC Page 1
ROI – Building The Business Case For Professional Services Automation
Robert D. Anderson, CPA Kimberly McDonald Baker Director Specialized Services Vice-President, Sales and Marketing Hitachi Consulting Project Partners LLC Professional Service Automation (PSA) systems empower Professional Services organizations with enhanced, automated & integrated capabilities to set-up, manage, control and report on client engagements. But how prepared is your firm to achieve a return on your systems investment? University of California Berkley and University of Southern California studies find 15-21% improvement in project execution and delivery costs by improving project management maturity one level. The purpose of this paper is to identify how to build your case for implementation of PSA tools in your firm and how leveraging the Oracle Project Management Key Performance Indicators (KPIs) assists in on going measurement of your business and charting a course of continuous process improvement. Significant 3rd Party Studies As your organization prepares to spend significant money on new tools to help you better manage projects, how prepared are you to achieve a return on this investment? How do you obtain the planned benefits by making this investment? In August 1997 Bradford K. Clark, at the University of Southern California, presented a paper summarizing his study across one hundred twelve software development projects titled: “THE EFFECTS OF SOFTWARE PROCESS MATURITY ON SOFTWARE DEVELOPMENT EFFORT”. Part of his conclusion states “Process Maturity was a significant factor affecting software development effort. After normalizing for the effects of other effort influences, a one-increment change in the rating of Process Maturity resulted in a 15% to 21% reduction in effort.” In October 2002 Dr. William Ibbs 1, University of California, Berkeley, presented a summary of his 20-plus year study of over 50 firms, including many prominent engineering and consulting firms, to the Silicon Valley Project Management Institute (PMI) Chapter. The title of his presentation was “The $$$ Value of PM (Can Good PM Cost Less?)”. Dr. Ibbs identifies increased PM Maturity as leading to 1) Better cost and schedule management, 2) Less expensive PM and 3) Improved PM/ROI SM Dr. Ibbs defined a Core Competency as something that 1) Provides a benefit to customers, 2) Must be sustainable and 3) Continuously improved. The continuously improved concept means done ahead of the competition (not following) and the improvements are items that customers desire, such as higher quality or lower cost. He provided an example of a company that improved both cost and schedule performance by 10% while having a savings of $150,000+ on project delivery costs. His conclusions 1 are “1) Good PM can cost less (<10%), 2) Good PM can give higher Cost Performance Index (CPI), Schedule Performance Index (SPI) results on average, and 3) Good PM can give more predictable CPI, SPI. Project Management Maturity Dr. Ibbs’ “Berkeley Project Management Maturity Model” 1 and PMI’s “OPM3” 2 define the project management maturity using similar steps. A basic model that combines these and other models, such as the Software Engineering Institute (SEI) and the Carnegie Mellon University Capability Maturity Model (CMM) can be summarized as follows:

OAUG Collaborate 08 Copyright 2008 Hitachi Consulting and Project Partners LLC Page 2
• A level 1 organization, largely “reinvents the wheel” every time a new program/project is started. Since there are no agreed upon methods for conducting PM, the success of the project relies almost completely on the “heroics” of key individuals to keep the project on track.
• A level 2 organization has gotten tired of getting burned by projects failing to finish on time,
within budget, and not accomplishing the intended project scope/quality. These organizations have taken the first steps towards globally managing the projects in their project portfolio, but the processes, PSA tools and metrics are still too new and poorly understood to make a dramatic impact.
• A level 3 organization, has taken the necessary steps to train their PM Teams in the PM processes,
PSA tools and metrics. Additionally, they have implemented effective enforcement mechanisms. Adhering to these processes enables PM Teams to reap the benefits of sound financial management, scheduling, risk management, project communications, etc. The organization is beginning to see profound project performance improvement.
• At level 4, an organization has begun to measure the effectiveness of their PM processes and
capture important performance data. The organization is capturing their best practices and making those available to the project teams. Performance improves with problems quickly detected and corrected. Manual processes become PSA enabling technology – PM applications, collaboration tools, knowledge management solutions.
• At level 5, the enterprise has achieved near optimal processes and therefore near optimal cycle
time, costs, and quality. PSA tools capture and compare project data from throughout the organization. The firm’s culture rewards individual contributions and suggestions for productivity enhancements. Processes change at the rate necessary to keep ahead of the industry and technological advances. With low costs, high quality and reduced cycle time, a level 5 organization is extremely competitive in their market place.
Building the Business Case Begin with a frank appraisal of where your firm is today. Initial appraisal using internal resources and tools such as OPM3 2 from PMI, provides an objective baseline to build from. External consulting firm staff familiar with professional service organizations and PSA efforts or specialized consulting firms, such as Ibbs Consulting, provides comparisons of your firm to similar businesses. With this information baseline, identification of the benefit areas for PSA begins with the goal of order of magnitude improvement to the business model and process flow. Professional Services Automation empowers the Professional Services organization by providing a set of enhanced, automated and integrated capabilities to set-up, manage, control and report on client engagements. The span of PSA includes the initial opportunity identification, through the proposal and planning processes, staffing and executing the work, collection of costs, recognition of revenue, invoicing the client, knowledge management and collaboration with both the internal team and the client representatives. PSA provides a single end-to-end, scalable system to manage the professional services business. This allows for growth of the business, reduces response time during the sales cycle, allows the Project Management Office (PMO) to foster innovation and increases quality of projects, better management of employees and subcontractor resources, and integrates intellectual capital management with the delivery of professional services. A wonderful end goal to work towards but a firm struggling at Level 1 must “get real”. Out of all this, where is a realistic place to start? Start with your current Services Profit and Loss projections.

OAUG Collaborate 08 Copyright 2008 Hitachi Consulting and Project Partners LLC Page 3
2006 2007 2008 2009 2010 2011 2012 2013
Services Revenue Growth Rate Baseline 15.00% 20.00% 15.00% 15.00% 10.00% 10.00% 10.00%
Net Sales - Services 50,000 57,500 69,000 79,350 91,253 100,378 110,416 121,457
Cost of SalesInternal Billable (30%) 15,000 17,250 20,700 23,805 27,376 30,113 33,125 36,437 Internal non-utilized (8%) 4,000 4,600 5,520 6,348 7,300 8,030 8,833 9,717 Subcontractors (25%) 12,500 14,375 17,250 19,838 22,813 25,094 27,604 30,364 Other (6%) 3,000 3,450 4,140 4,761 5,475 6,023 6,625 7,287
Total Cost of Sales 34,500 39,675 47,610 54,752 62,964 69,261 76,187 83,805
Gross Margin Services 15,500 17,825 21,390 24,599 28,288 31,117 34,229 37,652
Percent 31.0% 31.0% 31.0% 31.0% 31.0% 31.0% 31.0% 31.0%
GS&AService Operations Payroll 4,500 5,513 7,166 8,779 10,754 12,367 14,222 16,355 Practice Overhead 2,500 2,688 2,956 3,178 3,416 3,587 3,766 3,955 Sales Commission 4,185 4,813 5,775 6,642 7,638 8,402 9,242 10,166
Total GS&A 11,185 13,013 15,898 18,598 21,808 24,356 27,230 30,476
Net Services Contribution 4,315 4,812 5,492 6,000 6,480 6,761 6,999 7,176
Percent 8.6% 8.4% 8.0% 7.6% 7.1% 6.7% 6.3% 5.9%
Vision Professional Services Projections
There are four success measures for your PSA implementation: Revenue Production, Productivity Enhancement, Risk Reduction and Improved Cycle Times. In all cases these should be valid measurement criteria to determine success and measure the ROI of your investment. Using the baseline assessment of your firm, evaluate where the greatest weaknesses and pain points lie. If we can not do it all initially (no one can!) what do we start with? Looking at the example of Vision Professional Services:
• High subcontractor use is due to poor visibility into the future work pipeline and difficulty in resource scheduling (quick, high cost solution). Better forecasting of future demand and better scheduling of internal resources will reduce subcontractor use with employees. There is a margin improvement using internal resources, resulting in lower cost and increased gross margin for services.
• Utilization of existing resources is difficult to evaluate due to people charging internal development projects and sales when on the bench instead of appearing as available time. Everyone knows bench time is high but the numbers are difficult to validate. That problem limits hiring more internal employee resources.
• Struggling to be a Level 1 project maturity even with the recent investment in establishment of a PMO and hiring PMI certified project managers. No tools beyond Excel and a shared data drive. Change agents in place, just need the tools.
• Service Operations cost and head count growing faster than sales. No scaling of back office process, throwing more bodies at the problem to stay up with business growth.

OAUG Collaborate 08 Copyright 2008 Hitachi Consulting and Project Partners LLC Page 4
2006 2007 2008 2009 2010 2011 2012 2013
Services Revenue Growth Rate Baseline 15.00% 20.00% 15.00% 15.00% 10.00% 10.00% 10.00%
Net Sales - Services 50,000 57,500 69,000 79,350 91,253 100,378 110,416 121,457
Cost of SalesInternal Billable (30%) 15,000 17,250 20,700 23,805 27,376 30,113 33,125 36,437 Internal non-utilized (8%) 4,000 4,600 5,520 6,348 7,300 8,030 8,833 9,717 Subcontractors (25%) 12,500 14,375 17,250 19,838 22,813 25,094 27,604 30,364 Other (6%) 3,000 3,450 4,140 4,761 5,475 6,023 6,625 7,287 Improve Utilization - - - (46) (100) (110) (121) Improve Effectiveness (internal) - - (1,190) (2,738) (3,011) (3,312) (3,644) Subcontractor to Employee (218) (502) (552) (607) (668)
Total Cost of Sales 34,500 39,675 47,610 53,343 59,679 65,597 72,157 79,372
Gross Margin Services 15,500 17,825 21,390 26,007 31,573 34,781 38,259 42,085
Percent 31.0% 31.0% 31.0% 32.8% 34.6% 34.7% 34.7% 34.7%
GS&AService Operations Payroll 4,780 6,400 8,320 10,192 12,485 14,358 16,512 18,988 Practice Overhead 2,627 2,400 2,640 2,838 3,051 3,203 3,364 3,532 Sales Commission 3,067 4,813 5,775 7,022 8,525 9,391 10,330 11,363 Slow SO Payroll Growth - - (75) (158) (244) (335) (431)
Total GS&A 10,474 13,613 16,735 19,977 23,903 26,708 29,870 33,453
Net Services Contribution 5,026 4,212 4,655 6,030 7,670 8,073 8,389 8,632
Percent 10.1% 7.3% 6.7% 7.6% 8.4% 8.0% 7.6% 7.1%
Total change impact - (1,483) (3,443) (3,908) (4,365) (4,864)
Vision Professional Services Projections
Make projection adjustments based on your analysis and ability to change.
The assumptions for the cost reductions include modest improvement in Service Operations (1 head count growth reduction per year after full roll out), modest improvement in utilization (1% reduction) with the big changes reflected in movement of subcontractor work to internal resources (10% of subcontractor growth with a 22% margin improvement) and a 10% effectiveness improvement only on internal resources due to project management maturity improvement. Build out implementation cost estimates, additional software and support costs, training, change management, travel and all the other estimated items, including contingency, combine into a summary presentation across multiple years. This example uses a roadmap of phased changes, in an existing Oracle EBS environment. Scope consists of existing HR, Procurement, Project Cost and Billing module updates combined with new Oracle Project Management and Resource Management module rollouts. Additional Oracle software licenses and maintenance costs are not detailed in this analysis; it is assumed these costs have already been incurred.

OAUG Collaborate 08 Copyright 2008 Hitachi Consulting and Project Partners LLC Page 5
PROJECT RETURN ON INVESTMENTProject Benefits (Describe Above) Year 0 Year 1 Year 2 Year 3 Year 4 Year 5 Total
Increased GPM 1,408,463$ 3,285,090$ 3,663,788$ 4,030,167$ 4,433,183$ 16,820,690$ Decreased Costs 75,000 157,500 244,125 335,081 430,585 1,242,292 Other - - - - - -
Total Benefits 1,483,463$ 3,442,590$ 3,907,913$ 4,365,248$ 4,863,769$ 18,062,982$
Project Costs Year 0 Year 1 Year 2 Year 3 Year 4 Year 5 TotalInitial Investment 35,000$ 112,000$ 147,000 Internal IT Implementation Cost
Hours RatePM 3,600 75$ 135,000 135,000 270,000 BA 7,500 75$ 337,500 225,000 562,500 Developer 2,200 75$ 45,000 120,000 165,000 DBA 400 75$ 26,250 3,750 30,000 Other - 75$ - - - Total Hrs 13,700 Total Internal IT Implemention Cost 543,750 483,750 1,027,500
Outside Consulting 621,000 460,000 1,081,000 Training - Core Team 45,000 45,000 90,000 Training - Organizational Development 30,000 40,000 New Software Support Costs - 12,000 42,000 42,000 42,000 42,000 180,000 New IT Help Desk/BA Support 50,000 100,000 105,000 110,250 115,763 481,013 Patch/Upgrade IT Internal Cost 100,000 105,000 110,250 115,763 431,013 Other - Contingency 123,975 109,075 24,200 25,200 26,250 27,353 336,053
Total IT Cost 1,398,725 1,311,825 266,200 277,200 288,750 300,878 3,773,578 Business Implementation Cost
Hours RateBus PM 4,000 50$ 100,000 100,000 200,000 Bus PA 4,000 50$ 100,000 100,000 200,000 Accounting 900 50$ 25,000 20,000 45,000 SME 3,800 50$ 130,000 60,000 190,000 Total Hrs 12,700
Other 90,000 90,000 180,000 Patch/Upgrade Business Internal Cost 50,000 52,500 55,125 57,881 215,506 Contingency 44,500 37,000 5,000 5,250 5,513 5,788 103,051
Total Business Cost 489,500 407,000 55,000 57,750 60,638 63,669 1,133,557 Total Project Costs 1,888,225$ 1,718,825$ 321,200$ 334,950$ 349,388$ 364,547$ 4,907,134$
Net Project Cash Flows Year 0 Year 1 Year 2 Year 3 Year 4 Year 5 TotalNet Cash Flows (1,888,225)$ (235,363)$ 3,121,390$ 3,572,963$ 4,015,860$ 4,499,222$ 13,085,848$
1.) Total Initial Project Costs 1,888,225$ 2.) Cost of Capital 15% Net Present Value $6,217,0453.) Internal Rate of Return 85%
Of the four measurement areas, only a modest productivity enhancement drove the numbers. Additional opportunity still exists in the Revenue Production, Productivity Enhancement, Risk Reduction and Improved Cycle Times areas. Develop a long range plan to move your organization up the project management maturity level, targeting the four measurement areas and implementing only functions and features needed for success. Plan training programs to increase the understanding and skills of your Project Management team, not just in the tools, but in application of the tools to better manage your projects. Enable additional features and functions as your project management team matures.

OAUG Collaborate 08 Copyright 2008 Hitachi Consulting and Project Partners LLC Page 6
Leveraging Oracle Project Management KPIs Key Performance Indicators can assist in assessing the present state of the business and to prescribe a course of action on an on-going basis. Real-time monitoring of KPI’s allows maximization of performance over the shortest time period. Oracle Project Management, and Daily Business Intelligence, provides hundreds of KPI measurements for utilization by your team. Remember to be SMART in your use of these important tools:
Specific Measurable Achievable Realistic Timely Plan on updating the maturity measurement of your organization on a regular basis to determine where you have been successful in your improvement and identify areas of opportunity for future improvement. Oracle Project Management provides powerful access to pre-defined measures for use in establishing your own project measures. Follow the examples to define and create your own relevant measures for your specific organization. Screen images shown capture Oracle Project Management Release 12 formatting and presentation but the functionality remains the same in Release 11.5.10 with patches applied through Roll Up Patch 4 (RUP4) for Projects.
Project List screen showing KPA indicators for selected projects
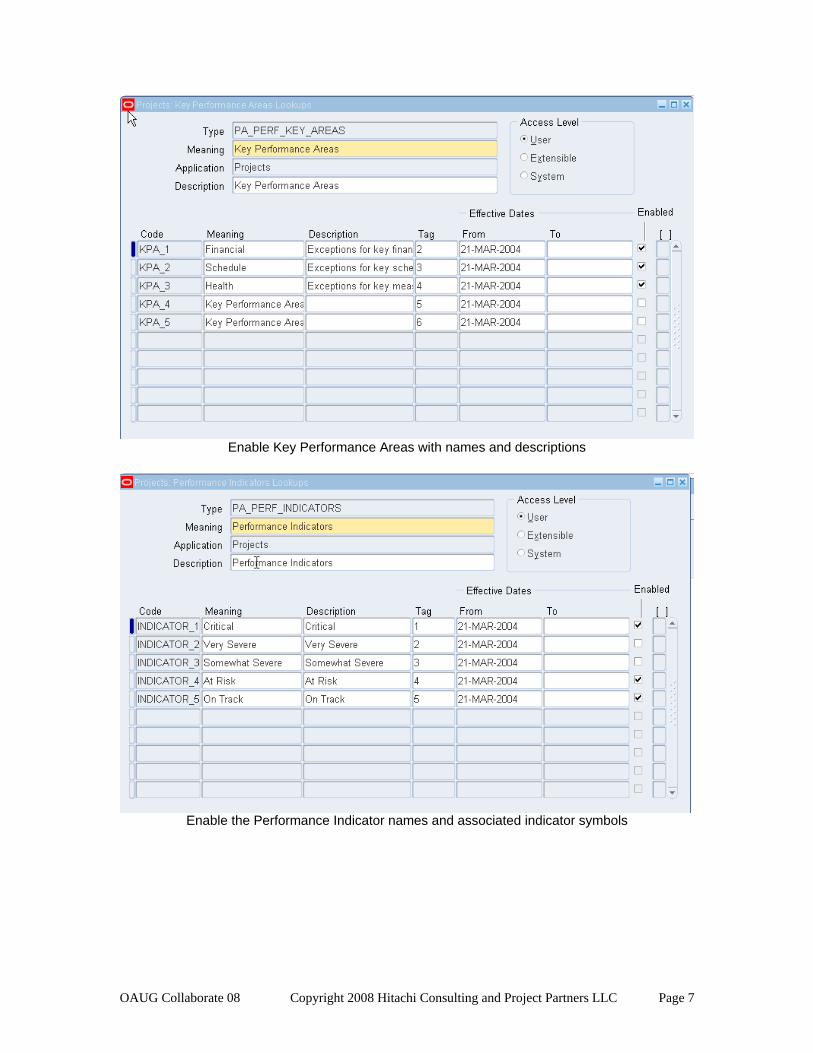
Follow the screen examples below to create your own Key Performance Areas (KPA) and KPI measures.
OAUG Collaborate 08 Copyright 2008 Hitachi Consulting and Project Partners LLC Page 7
Enable Key Performance Areas with names and descriptions
Enable the Performance Indicator names and associated indicator symbols

OAUG Collaborate 08 Copyright 2008 Hitachi Consulting and Project Partners LLC Page 8
Create Scoring Rules for each KPA
Define KPA threshold levels – this example for the Financial KPA

OAUG Collaborate 08 Copyright 2008 Hitachi Consulting and Project Partners LLC Page 9
Define KPA threshold levels – this example is for the Health KPA
Define KPA threshold levels – this example is for the Schedule KPA

OAUG Collaborate 08 Copyright 2008 Hitachi Consulting and Project Partners LLC Page 10
Update or create Performance Rules for use across projects.
Create Performance Rules like the following examples created from Oracle pre-defined measures. Create your own rules using the additional custom defined measures for your specific needs.
Create Performance Rule for At Risk Revenue

OAUG Collaborate 08 Copyright 2008 Hitachi Consulting and Project Partners LLC Page 11
Create Performance Rule for ITD Outstanding Receivables
Create Performance Rule for Schedule – Estimated Finish Variance

OAUG Collaborate 08 Copyright 2008 Hitachi Consulting and Project Partners LLC Page 12
Create Performance Rule for Schedule Performance Index.
When creating the various Performance Rules, the Measure is generally going to be from the
Oracle predefined list, as illustrated. You can define a limited number of new measures in each core area.

OAUG Collaborate 08 Copyright 2008 Hitachi Consulting and Project Partners LLC Page 13
Use KPA’s in various screens across Project Management, such as the initial Project opening
page Project Performance Reporting provides additional opportunity to leverage and display your KPI’s.
Define and use the indicators to enhance your performance report views and quickly call attention
to important information about the project

OAUG Collaborate 08 Copyright 2008 Hitachi Consulting and Project Partners LLC Page 14
Setup the KPA’s to be used under the Reporting > Setup tabs.
Select the page layout to use for your specific project to show the KPI’s and other information
desired

OAUG Collaborate 08 Copyright 2008 Hitachi Consulting and Project Partners LLC Page 15
Define both manual and automatic reports to capture and present the various measures you have defined and want to use for your project.
Define page layout and other report attributes for use on your project
Enable report changes at the enterprise level or allow project managers to override the report for
individual projects.

OAUG Collaborate 08 Copyright 2008 Hitachi Consulting and Project Partners LLC Page 16
Planning For Success As you prepare to implement new tools for your organization, consider establishment of a baseline across your firm. Assess where the organization is before you begin. Leverage this knowledge to help focus change management and training efforts where the return will be greatest. Develop a plan to move your organization up the maturity level. Target functions and features based on effective utilization in your organization. Plan training programs to increase the understanding and skills of your Project Management team, not just in the tools, but in application of the tools to better manage your projects. As your organization matures, enable additional features and functions within the tool set to further aid the project management team meet their objectives and measure the results. Three Client Experiences Three clients illustrate the need to conduct this assessment and planning in advance of your implementation. Client A Client A consisted of several diverse business groups that shared little in common except ownership. Change Management conducted a web based survey in advance of the project beginning. Divisions demonstrating high maturity, using solid project management principles, good multi-project capability and continuous process improvement existed with other divisions were barely able to hire semi-skilled project managers. As part of the pre-assessment, the client was able to scale back features and functionality for the groups with limited ability and focus the team doing the advanced functionality on the pockets that were in a position to leverage it effectively. This helped hold down the overall cost of the implementation for the geographical dispersed teams while aligning better with the user community needs. Client B Client B did not do a formal assessment, but the pilot project sponsors were very aware of the limited project management capability in the initial pilot group. The organization consisted of a very sophisticated project management community that ran very large, long duration engineering and construction projects and wanted advanced functionality, but were not part of the pilot, and scattered smaller groups that had very few tools, limited staff and had to do everything themselves with small repetitive projects, who were the target of the pilot. As the project was underway, the advanced group tried to accelerate functionality into the pilot. The pilot sponsors understood the success of the fast track pilot required the original plan be

OAUG Collaborate 08 Copyright 2008 Hitachi Consulting and Project Partners LLC Page 17
followed and resisted the scope creep. As a result, the pilot was successful and the advanced user group was able to accelerate the start of their own project team instead of changing the nature of the pilot. Client C Client C did a serious formal assessment as the project was rolling out across multiple continents to core teams with widely ranging skills and environments. Europe was a very mature market with highly skilled, experienced, project managers running mostly smaller projects due to the maturity of the environment. China was a rapidly growing market with very large teams and projects but very limited skills and experience. A comprehensive series of training programs, along with employee evaluation and transfers combined to insure a better matching of skills and abilities to the positions needed, especially in the Project Management area. At the time of the initial assessment, there were 79 people with the title Project Manager in China. None of those people held the title 12 months later. Revisiting the same countries 5 years later found the strongest project management methodology and practices were in China, directly as a result of the significant effort made to take a comprehensive approach to building the right skills, rather than just putting tools in place. Conclusion Tools, such as Oracle Project Management, assist an organization in the introduction of standards and common practices, and provide increased visibility into, and objective measurement of, project performance. The uniform capture and reporting capability allows easier sharing of lessons learned and the repetition of successful practices. When combined with an objective assessment of your firm before and after implementation of the new tools and introduction of new practices, you are positioned to make an honest and accurate assessment of the impact this effort has made. The data provides a basis to continue a planned series of improvements that will provide the best return for your firm. Remember, not everyone needs to be a maturity level 5 to be successful! About the Authors Robert D. Anderson has worked extensively in project centric organizations for over 30 years and assisted more than 20 firms implement Oracle Project solutions. Bob’s 20 years in industry, serving as a controller, CFO and General Manager provides insight to the challenges business leaders face on a daily basis. His hands on leadership have provided cutting edge solutions to complex business problems for international clients around the world. Kimberly McDonald Baker has worked with project centric organizations for over 20 years, recognizing technology’s ability to improve business operations even before the onset of packaged software. This prescience of technology’s impact led Kimberly to Oracle Corporation where she became Senior Product Director for the Projects and Professional Services Automation applications, and grew revenue from $2 Million to $200 Million. She continues as a technology evangelist at Project Partners LLC, an Oracle and Primavera partner firm. References: 1) Professor C. William Ibbs of the University of California at Berkeley, http://www.ce.berkeley.edu/~ibbs/ and http://www.ibbsconsulting.com/ 2) The Project Management Institute, (PMI®) http://www.pmi.org. Organizational Project Management Maturity Model (OPM3), Project Management Institute, 2003