role of emotions in seeking and sharing of information in
TRANSCRIPT

University of Nebraska - LincolnDigitalCommons@University of Nebraska - Lincoln
Library Philosophy and Practice (e-journal) Libraries at University of Nebraska-Lincoln
Winter 1-17-2017
Role of Emotions in Seeking and Sharing ofInformation in Library of Babasaheb BhimraoAmbedkar University, Lucknow, IndiaShilpi VermaBabasaheb Bhimrao Ambedkar University, Lucknow, [email protected]
Divyanshu GuptaBabasaheb Bhimrao Ambedkar University, Lucknow, [email protected]
Follow this and additional works at: http://digitalcommons.unl.edu/libphilprac
Part of the Library and Information Science Commons, and the Other Social and BehavioralSciences Commons
Verma, Shilpi and Gupta, Divyanshu, "Role of Emotions in Seeking and Sharing of Information in Library of Babasaheb BhimraoAmbedkar University, Lucknow, India" (2017). Library Philosophy and Practice (e-journal). 1493.http://digitalcommons.unl.edu/libphilprac/1493

ROLE OF EMOTIONS IN SEEKING AND
SHARING OF INFORMATION IN LIBRARY OF
BABASAHEB BHIMRAO AMBEDKAR
UNIVERSITY, LUCKNOW, INDIA
Dr. Shilpi Verma
Assistant Professor
Department of Library & Information Science
Babasaheb Bhimrao Ambedakr University
Vidya Vihar, Rai-Bareli Road
Lucknow (Uttar Pradesh)
India
Pin-226025
Email: [email protected]
Mobile: No: +91-8004000567
Mr. Divyanshu Gupta
Student of M.L.I.Sc. IVth Semester
Department of Library & Information Science
Babasaheb Bhimrao Ambedakr University
Vidya Vihar, Rai-Bareli Road
Lucknow (Uttar Pradesh)
India
Pin-226025
Email: [email protected]: No: +91-8687254759
Abstract The paper deals with role of emotions in seeking and sharing of information in
library of Babasaheb Bhimrao Ambedkar University of Lucknow, which is Central
University. The students and faculty members of the university are surveyed with the
help of questionnaire. The various resources sued, problems faced in seeking
information. And management of emotion in respect to information seeking is done in
detailed way. The emotions are effected by information seeking is also analysed in
the paper. The feelings of users like when they receive information, or when they
receive information beyond their expectation, when they don’t receive the
information is also analysed and discussed. The management of anger and anxiety is
also highlighted in the paper.
Key Words: Information Seeking Behaviour, Emotion, Information Sharing
Emotions are important in many areas of marketing, as “…they influence
information processing, mediate responses to persuasive appeals, measure the effects
of marketing stimuli, initiate goal setting, enact goal-directed behaviours, and serve
as ends and measures of consumer welfare (Anthony & Bates, 2013).

Emotions play a significant role in the workplace and staff/authorities’ emotions.
Emotional factors are equally important because they affect the general tone of
discussion and influence the ways in which participants seek and share information.
The main aim of the present study is to elaborate the picture of the role of emotional
expressions in information seeking and sharing. The main emphasis will be placed on
ways in which positive and negative emotions are expressed in the context of
information seeking and sharing.
Information Seeking Behaviour
The phrase ‘Information Seeking Behaviour’ has been defined variously by different
authors. The following definitions of information seeking behaviour will, however,
make the concept clearer.
Information seeking behaviour is a means towards reducing uncertainty and solving,
in this case, the information needs of an information consumer. According to
Kripke's, Information seeking behaviour refers to “any activity of an individual that
is undertaken to identify a message that satisfies a perceived need.”
King defined information seeking behaviour as “a manner in which a user conducts
himself in relation to a given information environment. It is, therefore, regarded as
essentially, a process of interaction between the user and the rest of the information
system.” Mick observed that the information producing and information seeking
behaviours are closely linked and are the reasons why most information systems are
not better accepted as they fail to provide linkage between the two activities.
Wilson, 1995 and as such its history may be considered to date back to the first
studies of scientific communication and information use (Royal Society, 1948). Its
use has also changed in line with developments in that field. Early references to
information-seeking behaviour would be referring to scientists’ use of formal and
informal communication channels and with a predominantly quantitative flavour
unpacked, the expression ‘information-seeking behaviour of scientists’ would,
typically be referring to the different proportion of scientists consulting with
colleagues, using journals or books, employing abstracting services, receiving
preprints or reprints, attending conferences, and their associated preferences in terms
of channel.
Emotions
A mental state of readiness that arises from cognitive appraisals of events or thoughts;
has a phenomenological tone; is accompanied by physiological processes; is often

expressed physically (e.g., in gestures, posture, facial features); and may result in
specific actions to affirm or cope with the emotion, depending on its nature and meaning
for the person having it. The emotions effect the general routine of working.
In this study, it will find out that how emotions affect the behaviour of users/staff for
sharing the information.
How the emotions affect the behaviour of users? How the services of library affected by the user’s emotions? How the staff’s behaviour affect the information seeking?
SCOPE OF THE STUDY
The study has undertaken to keep in mind the emotional attitude of the users. The
study intended to find out the information seeking behavioural approach of the users
in the Library of BBA University, Lucknow.
The population of the study is the student and teaching faculties of the university.
However, the study is based on the survey of the random sampling of the population.
The scope of the study is covered the UG, PG, Research Scholar and the teaching
faculty who use the library.
Since the study covers the psychological aspects of the users, therefore, the other point
of view i.e. Librarian and staff also included in it. As per library website, there are more
than 2000 users combining students, researchers, faculties and others.
OBJECTIVES
The objectives of the study are as follows:
1. What are the reactions of users for getting the information?
2. To know the positive and negative emotions impact on user behaviour.
3. To measure the impact of emotional intelligence on users.
4. To know the reaction of staff for sharing the information.
5. To measure the impact of technology on user’s information seeking
behavioural approaches.
6. To know the major problems faced by the users while seeking information.
Questionnaire For this study, a questionnaire will be used as a data gathering instrument. It will be
contained a series of questions, presented in a specific order to elicit responses from
the respondents. For this study, a comprehensive questionnaire will be designed to
collect data on different aspects of the Institutional Repositories.
Profile of University and Library

Introduction
In Indian education system university plays a vital role. The university develops
the minds and generates knowledge. There are 45 central universities in which 40
universities are under Ministry of Human Resource Development (MHRD) while 5
universities are not under MHRD. There are 4 central universities in Uttar Pradesh.
These are:
1. Aligarh Muslim University (AMU), Aligarh 2. Banaras Hindu University (BHU), Varanasi 3. University of Allahabad (AU), Allahabad 4. Babasaheb Bhimrao Ambedkar University (BBAU), Lucknow
The Babasaheb Bhimrao Ambedkar University (BBAU), Lucknow is one of the
premier central universities in the country. The jurisdiction of this residential
University is over the entire state of Uttar Pradesh. Babasaheb Bhimrao Ambedkar
University is a Central University, established on 10th January 1996
Library Profile
The library is the heart of the university. The Central Library, BBAU, Lucknow
has been named as Gautam Buddha Library after the name of Lord Gautam Buddha.
The foundation of the library services of Babasaheb Bhimrao Ambedkar University,
Lucknow was laid in January 1998. Keeping with the version and mission of the University, the library has been established “to promote knowledge and application
through its effective dissemination of knowledge and information”. The library acts
as learning resource centre of the University to supplement education and
information needs of the faculty and students. It also provides information services
and facilities to meet the requirement of the teaching, training, and research
programmes. The library services are also open to University staff and visitors.
During the Year 2014-15, the modular furniture has been brought for the students.
Now the reading capacity of the Library has increased as 500 at a time. The
inauguration of the Lifts in the Library has done by the Hon’ble Vice Chancellor by
this; the movement of students from one to another floor becomes easy.
The library building is fully fleshed Air-Conditioned building. It is in the centre of
the university campus i.e. on the half way from each entrance gate.
Opening Hours

The library remains open on each working day from 8:00 am to 8:00 pm for its
readers. However, on Saturday it opens from 9:30 am to 5:00 pm.
Membership The registered members are issued Borrower's tickets as per their entitlement given as
blow:
Table: 1 Privilege from Library
S. No. Category of Member Borrowing Privileges No. days
1 PG Students 2 15
2 PhD. Scholars 4 15
3 Faculty Members 8 30
4 Group 'A' Officials 3 30
5 Others 1 15
Membership for the year
Table: 2 Membership of the Year 2015-16
Sr. No. Type of Membership Male Female Total
1 Faculty 100 02 102
2 P.G. Students 1051 679 1730
3 U.G. Students 360 138 498
4 Ph.D. Students 66 35 101
5 Non-Teaching 28 2 30
6 Guest Faculty 18 8 26
Total 2487 Online Facilities The library provides the information through its website. It has own Online Public
Access Catalogue (OPAC) by which users searched their information easily. It
subscribed to 14 major databases in various areas of Science, Social Science, Arts,
and Humanities, Engineering and Law provide electronic access to 8257 full-text e-
journals through UGC_INFONET Digital Library Consortium, Ahmadabad. The
breaks up details of the same are given below:
Bibliographic Database
Table: 3 Bibliographic Database
S. Name
No
1 ISID

2 JCCC
Full-Text Online Database
Table: 4 Full-Text Database
S. No Name of Database No. of Full-Text Journals
1 American Chemical Society 37
2 Cambridge University Press 224
3 Economic & Political Weekly 1
4 Emerald 29
5 Institute of Physics 46
6 JSTOR 2585
7 Oxford University Press 206
8 Project Muse 493
9 Science Direct (10 Subject Collection) 1036
10 Springer Link 1613
11 Taylor & Francis 1079
12 Wiley-Blackwell 908
Total Full-Text Journals 8257
5. Library Services Library is a non-profit organization and known for its services. Library provides several services to its user community given as under: Reprography or Xeroxing: Library provides Xerox facilities in the library premises at a nominal cost of Rs.0.50/ page.
Document Delivery Services (DDS): Library provided printed copy of articles which is requested by the users under DDS. In the year 2014-15, several articles have
been delivered to users.
Email Alert: Library using an email i.e. [email protected] to provide alert services such as article and reservation, etc. to the users.
New Arrival: Library opened a section for display of the new arrival books.
Hindi Prakosth: Library also extended its services in the form of ‘Hindi
Prakosth’ by which use of Hindi collection of books encouraged. Braille Section: In the Library several new sections have been established in which Braille section is one of them. In this section, two PCs have installed one for
the visually challenged and another for lower vision people. This facility has increased
not only to the student of this University but also for other people of the society.
Cyber Section: This is the new section start from the Month of January, 15. Presently, a total of 25 computers with the facility of access to the internet have been
installed. The strength of the section is 50 computers that shall be installed in coming
future. The Library is Wi-Fi enabled. The users access Wi-Fi facility by using their
Laptops and Tablets.
Research Floor: This section is exclusively started for the Research Scholars and the faculty members. Presently, the capacity of the section is 30 scholars. The section
is a plan for open up to midnight every day.
Text Book Section: On the demand of the students, a separate section is opened, so that the students could read the books of their curriculum and subjects.
Thesis Section: A separate theses section is started during the year. In this section, the scholars can use the theses on the recommendation of their respective supervisor.
Toppers’ corner: This section is unique in its nature. The answer sheets of the students, who are the topper in their department, are kept in this section for the
consultation by the library users.
Technical Section: In this section the technical processing of the document is
ensured. The technical work i.e. classification is conducted by using DDC 23rd
Edition. After the acquisition of the documents, the technical processing is a must that provides
easy retrieval of the documents.
Faculty Publication: A section meant to display faculty publication is created in the Library. Till date, more than 50 articles and Book Chapters have being displayed.
Periodical section: The periodical section is the very important section of a university library. The updated
knowledge and news available here. The users came for the latest magazines, journals,
newspapers, etc. so that the users stay connected with their surroundings in this
competitive age. The periodical sections renovate during the year and new subsection
i.e. Reports, Faculty Publication, Magazines have been created inside this section.
6. Library Statistics: The statistics of library till date is as follows:
Total of Number of Periodical = 35 Gifted
Total Number of Magazines = 12 (6 Hindi), (6 English)
Total Amount Spent on Newspaper = Rs. 19267/-

Electronic Database = 14
Full Text electronic Journals = 8257
Bibliographic Databases = 02
7. Library Staff
The library consists seven professional as follows:
Table: 5 Staff of Library Designation of Library Professionals
Gender Librarian
Assistant Professional Library Library Total
Librarian Assistant Assistant Attendant
Male 1 2 1 0 0 4
Female 0 0 0 2 1 3
Total 1 2 1 2 1 7
Acquisition Section:
Library acquisitions is the department of a library responsible for the
selection and purchase of materials or resources. The department may select
vendors, negotiate consortium pricing, arrange for standing orders, and select
individual titles or
resources.
The total statistics of this section are as follows:
Total Number of Books as on 31/03/2015 = 38676
Books Purchased during the year 2014-15 = 6683
Books Purchased for Department Libraries = 3469
Expenditure on Books During the year 2014-15 = Rs. 16884036/-
Circulation Section:
The main public service point is the circulation desk or loans desk, usually
found near the main entrance of a library. It provides lending services and
facilities for return of loaned items. Renewal of materials and payment of fines
are also handled at the circulation desk.
Borrowing
1. The library cards are NON-TRANSFERABLE and should be kept under safe
custody of the users. The members are responsible for the safety of the library
material borrowed by them. The user is responsible for any loss that the library
may suffer due to the misuse or loss of such card. The cards must not be handed
over to any other users or outsiders.

2. The users should consult the library materials within the library premises.
The borrowed materials should not be taken out of the station without the permission
of the librarian. 3. Library can recall any issued book even before the due date, in case of urgency. 4. Borrowers must satisfy themselves with the physical condition of the book
before borrowing.
Overdue charges
Books taken on loan must be returned on or before the due date. Overdue charge
would be levied on students’ @Rs.2/- for Text Books and Rs. 5/- for overnight
Books per day per volume. In case of loss of library tickets, readers have to inform to
the Librarian. For duplicate Library Ticket readers required to pay Rs. 50/- per ticket.
Circulation Timing Every day 9:30 am to 5:00 pm except Saturday. The statistics of circulation section is as
follows: Book Issue during the year 2014-1=43345
Users Registered for consultation=43061
Overdue Charges=Rs. 28383
Total Membership on31/3/2015=Rs.1890
Data Analysis and Interpretation:
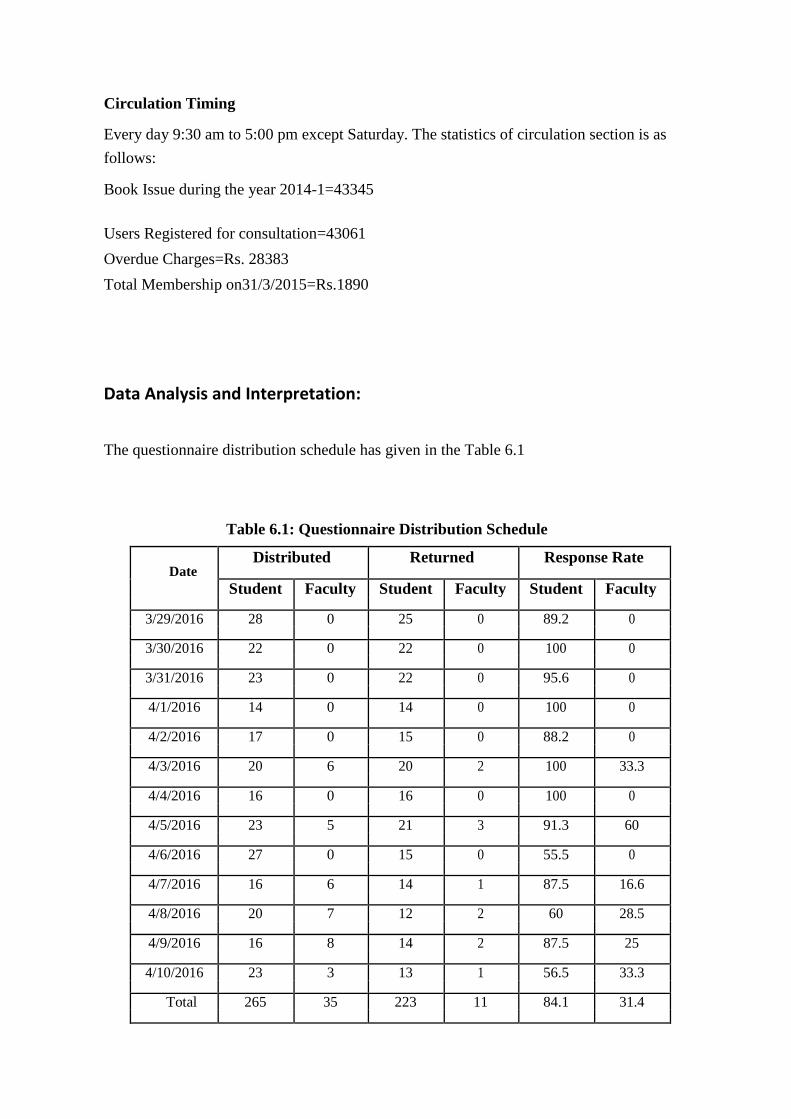
The questionnaire distribution schedule has given in the Table 6.1
Table 6.1: Questionnaire Distribution Schedule
Distributed Returned Response Rate Date
Student Faculty Student Faculty Student Faculty
3/29/2016 28 0 25 0 89.2 0
3/30/2016 22 0 22 0 100 0
3/31/2016 23 0 22 0 95.6 0
4/1/2016 14 0 14 0 100 0
4/2/2016 17 0 15 0 88.2 0
4/3/2016 20 6 20 2 100 33.3
4/4/2016 16 0 16 0 100 0
4/5/2016 23 5 21 3 91.3 60
4/6/2016 27 0 15 0 55.5 0
4/7/2016 16 6 14 1 87.5 16.6
4/8/2016 20 7 12 2 60 28.5
4/9/2016 16 8 14 2 87.5 25
4/10/2016 23 3 13 1 56.5 33.3
Total 265 35 223 11 84.1 31.4

In the questionnaire there was a series of 29 questions under the four parts viz.
Demographic Information, Perception of Library, Information Seeking Behaviour of Users
and Emotional Aspects of Users for Information Seeking. The types of questions were
involved closed ended as well as open ended. To know the additional information, an
option i.e. “Any other” was also included in the questionnaire in appropriate place. In the
Part I of the questionnaire was related to the demographic information i.e. personal
information of users like their name, gender, age, designation and department. While in the
Part II, there was several questions related to the library perception. Whereas the rest of
two parts consists with the actual study. The response rate of student and faculty is shown
in the Figure 6.1
0
80 84.1
70
60
50
40
30 31.4
20
10
0
Student Faculty
Response Rate
Figure 6.1: Response Rate
6.2 Analysis of Questionnaire:
The data collected in the study have analysed and presented in the subsequent tables and
figures.
The basic of an analysis is that the enquiry about the population of the study on which the
study to be conducted. Thus, to know the age-groups of the respondent’s, five options have
given in the part-I of the questionnaire as given in the Table 6.2.
Table 6.2: Gender and Age-groups of the Respondents
Age Male Female Total
Groups No. % Nos. % Nos. %
Below 24 Years 64 53.3 66 57.8 130 55.5
25-29 36 30 34 29.8 70 29.9
30-34 12 10 8 7 20 8.5
34-39 5 4.1 6 5.2 11 4.7

Above 40 Years 3 2.5 0 0 3 1.2
Total 120 100 114 100 234 100
Analysis in the Table No. 6.2 and Figure 6.2 reveal that there were total numbers of 234
respondents have responded for this study in which 51.2% (120) males and 48.8% (114)
females have responded in different age groups. The Table 6.2 also shows that the majority
of the respondents i.e. 55.5% belongs to the below 24 years followed by 29.9% belongs to
25-29 years age group. In brief, it reflects that majority of the respondents was youngsters.
Gender-wise Age-group
70
57.8
60
53.3
50
40
30 29.8
30
20
10 7
10 4.1 5.2
2.5
0
0
Below 24 Years 25-29 30-34
34-39 Above 40 Years
Male % Female %
Figure 6.2
To know the designation of the respondents a question was asked to the users. The responses received are given below in the Table 6.3
Table 6.3: Designations of the Respondents.
Designation
Gender Faculty Students
Asst. Asso. Prof. Total
Ph.D.
M. PG UG
Any Total
Prof. Prof.
Phil. other
Male 4 1 1 6 34 9 52 18 1 114
% 66.6 16.6 16.6 100 29.8 7.8 45.6 15.7 0.8 100
Female 2 2 1 5 30 5 55 19 0 109

% 40 40 20 100 26.7 7.14 49.1 16.9 0 100
Total 6 3 2 11 64 14 107 37 1 223
The Table 6.3 and Figure 6.3 show the designation of the respondents which reveals the
total number of respondents were 234 in which 11 faculty members and 223 students
have responded. The faculty members further categorised into Assistant Professor
(6),Associate Professor (3) and Professor (2). However to know the qualifications of the
respondents, different options for the qualifications were given. The responses received
revels that there were 64 Ph.D., 14 M.Phil. 107 PG and 37 UG respondents have
responded for this study. The response received under any other option reveals that there
was a Post-Doctoral Fellow (PDF) was also responded for this study. The percentage of
the male and female respondents indicate that it is more or less equally divided. In this
study it is observed that only 31.4% faculty members have responded for the study, the
reason may be there business in their academic work.
Designation of the respondents 70
66.6
60
50 49.1
45.6
40 40
40
29.8
30
26.7
20
20 16.6 16.6 16.9
15.7
10 7.8
7.14
0.8 0
0
Assistant Associatae Prof.
Ph.D
M. Phil PG UG Any other
Prof. Prof.
Faculty Students
Male %
Female %
Figure 6.3
The central library is having many users from different departments. So an option to know

the departments of the respondents was given in the questionnaire. The responses received
are given in the Table no. 6. 4 in which the most respondents were from the Department of
Library and Information Science under which this study conducted. However the
respondents of other departments also responded for the study.
Table 6.4: Department of the Respondents.
Departments Male % Female % Total
Applied Animal Science 7 5.8 5 4.3 12
Applied Chemistry 5 4.1 3 2.6 8
Applied Mathematics 4 3.3 2 1.7 6
Applied Physics 5 4.1 4 3.5 9
Applied Plant Science 5 4.1 1 0.8 6
Applied Statistics 5 4.1 4 3.5 9
Biotechnology 6 5 3 2.6 9
Computer Science 5 4.1 4 3.5 9
Economics 2 1.6 5 4.3 7
Education 3 2.5 4 3.5 7
Environmental Microbiology 5 4.1 11 9.6 16
Hindi 1 0.8 3 2.6 4
History 3 2.5 4 3.5 7
Human Rights 3 2.5 6 5.2 9
Information Technology 6 5 5 4.3 11
Library And Information Science 22 18.3 16 14 38
Mass Communication 6 5 5 4.3 11
Political Science 5 4.1 5 4.3 10
Rural Management 8 6.6 10 8.7 18
Sociology 6 5 5 4.3 11
UIET 5 4.1 4 3.5 9
Not Mentioned 3 2.5 5 4.3 8
Total 120 100 114 100 234
The Table 6.4 and show that the number and percentage of male and female participated in the

study. There are 18.3% male and 14% female respondents responded from the DLIS. The
respondents from other departments are varies from 4% to 16% have
also responded. The highest number of responded departments are DLIS (38), DRM (18) and
DAAS (12).
To know the status of library visiting of respondents, a question was asked about the
visiting of the library, the responses received are given in the Table 6.5.
Table 6.5: Respondents Visit of Library
Sr. Visit of Library
No. Parameters Number of Users Users %
1 Daily 104 44.4
2 Weekly 88 37.6
3 Fortnightly 2 0.8
4 Monthly 16 6.8
5 Occasionally 22 9.4
6 Never 2 0.8
Total 234 100
The Table 6.5 and Figure shows that 44.4 % respondents visit the library daily, 37.6 %
weekly, 0.8 % visit fortnightly, 6.8 % visit monthly, 9.4 % visit occasionally and 0.8%
never visit the library. The graph given below shows the percentage of the visits of the
library by the respondents.
To know the types of resources used by the respondents a question was asked in which
following options as given in the Table 6.6.
Table 6.6: Types of Resources Used.
Sr. Types of Resources Used
No. Resource Number of Users Users %
1 Print 126 26.2
2 E-resources 96 20
3 Audio-Video 22 4.5
4 Reference Collection 90 18.7
5 Internet 116 24.1
6 Any other 30 6.2
Total 480 100

The Table 6.6 reveals that the most of the respondents (26.2%) used Print Resource and
followed by the Internet (24.1%). Since print resources are the good and long-time
preservative resource so most of the user used it. The Figure 6.6 shows the percentage of
resources used by the respondents.
To know the satisfaction level of respondents with the library perception, several aspects
have been covered in the questionnaire. The Table 6.7 shows the satisfaction level of users
with percentage.
Table – 6.7 Satisfaction Level of Respondents
Satisfaction Levels
Sr. Perception on
No. Extremely Satisfied Unsatisfied
Extremely Can't
Satisfied Unsatisfied say
Number of 15 103 86 16 14
required Books
1
% 6.4 44 36.7 6.8 5.9
Overall
Collection of 11 118 63 10 32
2 Library
% 4.7 50.4 26.9 4.2 13.6
Quality of
Library 18 144 43 12 17
3 Collection
% 7.6 61.5 18.3 5.1 7.2
The table 6.7 and Figure 6.7 reveals that most of the respondents satisfied with the library
collection. The 44% respondents satisfied with the no. of required books in the library
whereas 50.4% respondents satisfied with the overall collection of library, however 61.5%
respondents satisfied with the quality of library collection. It shows that the collection of
library is good but there is need of improvement to the overall collection of library.
Figure 6.7
Satisfaction Level of respondents
70 60 50
40 30 20

10 0
61.5
50.4
44
36.7
26.9
18.3
13.6
6.4 6.8 5.9 4.7
4.2 7.6
5.1 7.2
Number of required books (%) Overall collection of library (%) Quality of library collection (%)
Extremely Satisfied
Satisfied
Unsatisfied
Extremely Unsatisfied
Can't say
To know the aspects of arrangement in the library the questions were asked in the
questionnaire which are listed below in the Table No. 6.8. It reveals that most of the
respondents satisfied with the arrangement of books in the library as well as they
are able to find books from the shelf. It is good sign of library arrangement.
Table – 6.8 Library Aspects of Respondents
Sr. Aspects of library
Yes No Total
No. Nos. % Nos.
%
1 Whether proper shelf
160 68.3 74
31.6 234
arrangement
2 User's ability to find
174 74.3 60
25.6 234
books from shelf
The Table No. 6.8 and reveals that most of the respondents i.e. 74.3% are able to
find books from the shelf, it means that library arrangement is understandable to its
users. Analysis in Table 6.8 clearly reveals that most of the respondents i.e. 74.3% understand
the working of library so that they easily find the books from the library stack whereas
the 68.3% respondents responded in the favour of proper shelf arrangement of library.
To know the approach of information seeking of the respondents a question was asked in
the questionnaire i.e. the way by which they find/search their required information from
the library. The options and responses shown in the Table 6.9.
Table – 6.9: Approach for Getting Information
Sr. Approach for Getting Information
Number of
Users
No. Approaches
Users
%
1 Subject 156 35.4
2 Author 114 25.9
3 Title 122 27.7
4 Keyword 40 9
5 Any other 8 1.8
The Table 6.9 and reveals that most of the respondents i.e. 35.4% searches the required
information through Subject approach while 27.7% respondents searched through Title
approach. Thus it is clear that the subject approach is wide approach used by the
respondents in the library.

It also reveals that 25.9% respondents approached through author approach i.e. Most of
the respondents are not aware about the technical terminology of searching so that they
searched through Subject and Title approach.
Library is known as resource centre of the institution. Hence, to know the preference of
getting information of the respondents a question was asked in which following options
had been given separately online and offline in Table 6.10
Table – 6.10 Preference for getting information
Preference for getting information
Sr. No.
Preferred Types
No. of Users
Resources Users %
Website 154 45.2
E-journals 88 25.8
1 Online E-mail 54 15.8
E-databases 34 10
Any other 10 2.9
Total 340 100
Books 210 67.7
2 Offline CD/DVD 20 6.4
Print Journals 60 19.3
Any other 20 6.4
Total 310 100
The Table 6.10 and reveals that both online and offline information seeking methods
have their importance. In online information seeking, 45.2% respondents searched their
information through website whereas in offline information seeking, 67.7% respondents
preferred Books. Overall in both of the methods books are the most favourite and
suitable method of getting information i.e. the print form of the resources are the most
preferred form of getting information.

To know the purpose of information seeking a question was asked in which several aspects given in the option, the responses shown in the Table 6.11.
Table – 6.11: Purpose of information seeking
Purpose of information seeking
Sr. No.
Purpose Number of Users
Users %
1 Class notes 111 31.7
2 General Awareness 48 13.7
3 Knowledge Update 101 28.8
4 Research 78 22.2
5 Any other 12 3.4
Total 350 100
The Table 6.11 and reveals that most of the respondents i.e. 37.7% prepare class notes
from the library while 28.8% respondents updating their knowledge. Since academic
library supports the teaching of the institution so most of the students prepare the class
notes.
Library is known as resource centre. So users came in the library for searching and using
their resources. To know the preference of information used by the user from the library
a question was asked in which different aspects and their responses were given in Table
6.12.
Table – 6.12: Information preference from the library
Sr. Information preference from the library
Number of Users
No. Preference
Users %
1 Factual 35 15.2
2 Descriptive 60 26
3 Electronic 40 17.3
4 Textual 75 32.6
5 Any other 20 8.6
Total 230 100
The Table 6.12 and reveals that 32.6% respondents preferred for Textual Information
whereas 26% preferred for Descriptive information. In the previous table 6.10 shows that the books are the most preferred method of information seeking i.e. most
of the respondents preferred the Textual Information.

Today’s era is the electronic age of information seeking so to know the effect of
electronic environment in the information seeking habits of respondents a question was
asked in which several factors and their responses listed below in Table 6.13.
Table 6.13: Effect of E-Dissemination on Information Seeking Habit
Sr. Effect of E-Dissemination on Information Seeking Habit
No. Factors Number of Users
Users %
1 Rapid Access to Information 72 21.5
2 Anywhere Access 76 22.7
3 Anytime Access 92 27.5
4 Not Affected 42 12.5
5 Information in Multiple
44 13.1
Formats
6 Any other 8 2.3
Total 334 100
The Table 6.13 and reveals that most of the respondents accepted that information
seeking is possible at any time i.e. 27.5 % whereas anywhere access i.e. 22.7% is another
effect of e-dissemination of Information. Thus analysis reveals that e-dissemination of
information plays very important role in information dissemination.
Affection of Information Seeking Habit by E-Dissemination
2.3, 2%
13.1, 13% 21.5, 22%
12.5, 12%
22.7, 23%
27.5, 28%
Rapid access to information
Anywhere access
Anytime access
Not affected
Information in multiple formats
Any other
Figure 6.13
In In this digital era, every resource available in the e-format so to know that the
electronic medium of information gathering is helpful or not, a question was asked to the
respondents, the response received are presented in Table 6.14.

Table 6.14: Electronic sources make it easier to gather and use information
Electronic sources make it easier to gather and use information
Yes No
Nos. % Nos. %
210 89.7 24 10.2
The Table 6.14 and show that the majority i.e. 89.7% respondents agreed that the
electronic environment makes easier to gather and use information frequently. It was
observed during the study that most of the users use electronic gadgets to access
information in electronic environment.
To know that what type of problems faced by users in the library, a question was asked
in which several problems as given in the table 6.15 have given. The responses received
from the respondents are presented in the Table 6.15.
Table 6.15: Problems Faced in Information Seeking
Sr. Problems faced in information seeking
No. of Users
No. Problems Rank
Users %
1 Unavailability of required
140 18.4 2
information
2 Staff is unwilling for serve 37 4.8 9
3 Lots of time taking 72 9.4 4
4 Absence of guides in the
82 10.7 3
library
5 Information is not well
62 8.1 6
managed
6 Lack of awareness of staff 56 7.3 7
7 Old technology used by the
64 8.4 5
library
8 Poor internet accessibility 148 19.4 1
9 Timing of circulation 54 7.1 8
10 Time consumed in
35 4.6 10
circulation
11 Any other 10 1.3 11

The Table 6.15 and Figure 6.15 reveal that the majority of respondents i.e. 19.4% faced
poor internet speed, facility provided by the library while 18.4% respondents believes
that uavailability of required information is another major problem. Thus, the library
needs to improve its collection according to the need of respondents.
P R O B L E M S F A C E D B Y R E S P O N D E N T S
25
20
15
10
5
0
Figure 6.15 Emotional attachment with the work is the main concern of this study. So, to know the
emotional feeling of the users when they didn’t get their required information a question
was asked. The option of feeling and responses presented in Table 6.16
Table 6.16: Emotional Feeling when Information not obtained
Sr. Emotional Feeling when Information not obtained
No. Feelings Number of Users Users %
1 Angry 34 14.5
2 Irritating 91 38.8
3 Envy 9 3.8
4 Dissatisfaction 96 41
5 Any other 4 1.7
Total 234 100

The Table 6.16 and Figure 6.16 reveal that majority of the respondents i.e. 41%
dissatisfied when they didn’t obtained their required information whereas 38.8% feels
irritating. It observes that the feeling of respondents affected from the library services.
So the library services helps in good emotional attachment between library professional
and users.
Emotional Feeling when Information not obtained
2%
41%
4%
14%
39%
Angry Irritating Envy Dissatisfaction Any other
Figure 6.16 As earlier asked about the feelings when information didn’t get to the respondents. Similarly to know the feelings of the users when they get their required information a
question was asked. The options and responses are given in Table 6.17.
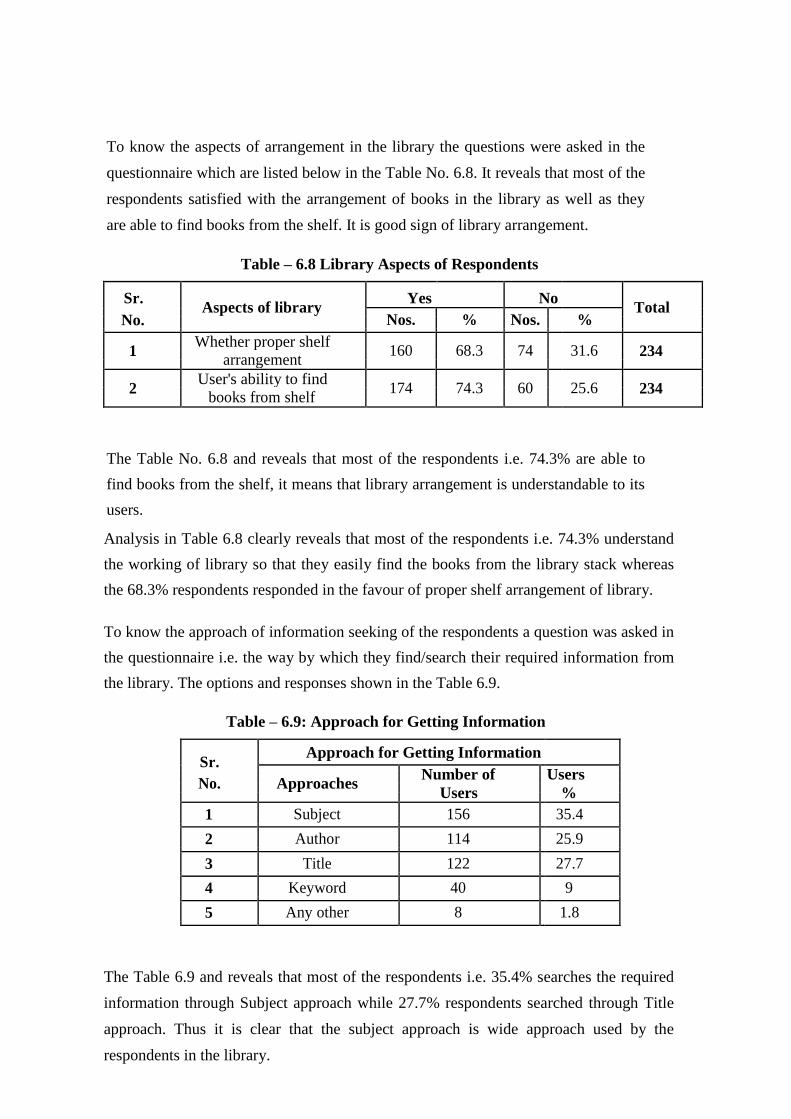
Table 6.17: Feeling when Information obtained
Feeling when Information obtained
Sr. No. Feelings
Number of Users
Users %
1 Happy 128 54.7
2 Excited 31 13.2
3 Pleased 58 24.7
4 No feeling 12 5.1
5 Any other 5 2.1
Total 234 100
The Table 6.17 and Figure 6.17 reveal that majority of the respondents i.e. 54.7% feels
happy when they get their required information while 24.7% respondents feels excited.
It is observed during study that obtaining of required information motivate the
respondents towards study.
Feeling when Information obtained
5.1
2.1
Happy
24.7 Excited
Pleased
54.7
No feeling
Any other
13.2
Figure 6.17 Fear is the other emotional feelings which effect the interest of the users towards study and
visit of the library. To know that the users feel any kind of fear during information seeking
from the library a question was asked. The responses presented in the Table 6.18.
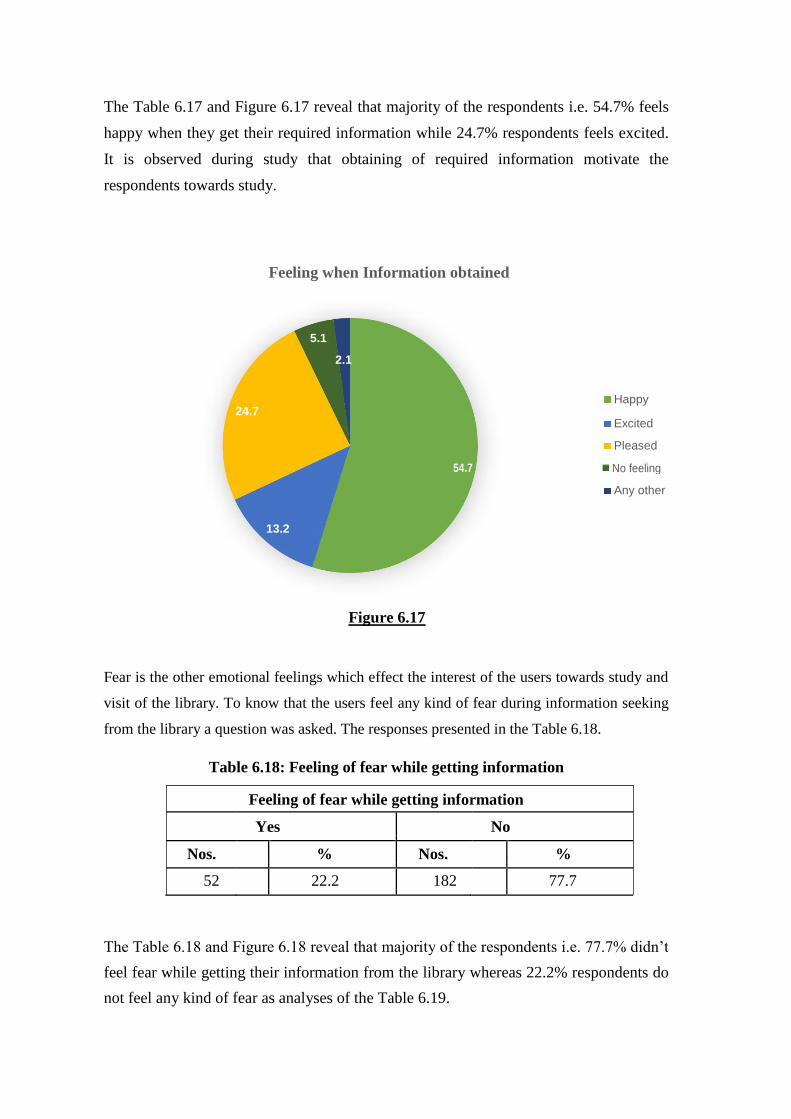
Table 6.18: Feeling of fear while getting information
Feeling of fear while getting information
Yes No
Nos. % Nos. %
52 22.2 182 77.7
The Table 6.18 and Figure 6.18 reveal that majority of the respondents i.e. 77.7% didn’t
feel fear while getting their information from the library whereas 22.2% respondents do
not feel any kind of fear as analyses of the Table 6.19.

Feeling of fear while getting information
22%
78%
Yes % No %
Figure 6.18 The Table 6.19 represents the responses in the favour of feeling while getting
information from the library.
Table 6.19: Fear of Respondents
Sr. No.
Users
Types of Fear of
No. %
Users
1 Fear of unavailability of information in
36 24
the library
2 Fear of locating information in the
48 32
library
3 Don’t know how to access the library? 25 16.6
4 Hesitation for getting information 29 19.3
5 Any other 12 8
Total 150 100
The analysis of Table 6.19 and Figure 6.19 show that majority of the respondents i.e.
32% feels the fear of locating information in the library whereas 24% respondents
feared about the unavailability of information in the library. Hesitation is another fear
feels by 19.3% respondents.

Fear of Respondents
35 32
30
25 24
20 19.3
16.6
15
10 8
5
0
Fear of unavailability Fear of locating Don't know how to Hesitation for getting Any other
of information in the information in the access the library? information
library library
Figure 6.19
To know the feeling when users get the information beyond expectation, a question was
asked in the questionnaire. The feelings and received responses presented in the Table
6.20.
Table 6.20: Feeling when Information obtained beyond Expectation
Feeling when Information obtained beyond Expectation
Sr.
No. Feelings Number of
Users % Users
1 Extremely Surprised 38 16.2
2 Surprised 126 53.8
3 Not Surprised 44 18.8
4 Not Satisfied 16 6.8
5 Any other 10 4.2
Total 234 100
The Table 6.20 and Figure 6.20 reveal that majority of the respondents surprised i.e.
53.8% when they got the information beyond their expectation whereas 18.8% not
surprised.

Feeling When Information Obtained Beyond Expectation
53.8
60
50
40 18.8 4.2
30 6.8 Any other
Not Satisfied
20 16.2 Not Surprised
10 Surprised
0 Extemely Surprised
Users %
Extemely Surprised Surprised Not Surprised Not Satisfied Any other
Figure 6.20
In this technological era, technical error occurrence is very common problem while
information seeking. Thus to know the feelings of users when any kind of technical
error occurred, a question was asked. The option given and responses received are
presented in Table 6.21
Table 6.21: Feeling when Technical error occur while Seeking Information
Feeling when Technical error occur while Seeking
Sr. Information
No. Feelings
No. of Users
Users
%
1 Angry 43 18.3
2 Irritating 120 51.2
3 Annoyed 53 22.6
4 Fear 13 5.5
5 Any other 5 2.1
Total 234 100

The analysis of Table 6.21 and Figure 6.21 reveal that the majority of the respondents
i.e. 51.2% feels irritate when technical error occur while information seeking whereas
22.6% feels annoyed.
Feeling when Technical error occur while Seeking Information 60
51.2
50
40
30
22.6 20 18.3
10 5.5
2.1
0 Angry Irritating Annoyed Fear Any other
Figure 6.21
User satisfaction is the main objective of the library. To know the satisfaction level of
respondents with the co-operation of library staff, a question was asked. The options
and responses received represents in the Table 6.22.
Table 6.22: Satisfaction with the co-operation with Library Staff
Satisfaction with the co-operation with Library Staff
Yes No
Nos. % Nos. %
183 78.2 51 21.7
The analysis of Table 6.22 and Figure 6.22 show that the majority of the respondents
satisfied with the co-operation of library staff whereas 21.7% respondents not satisfied.
It observed that the users are compatible with the library staff. The reason of
dissatisfaction of the respondents given in the Table 6.23.

Satisfaction With the Co-operation With Library Staff
No %, 21.7
Yes %, 78.2
Figure 6.22
The Table 6.23 represents the reasons and responses received by the dissatisfied respondents.
Table 6.23: Reason Not Satisfaction Respondents
Sr. Reasons No. of Users
Users
No. %
1 Staff is unwilling for serve 44 33.8
2 Lack of awareness of staff 52 40
3 Lack of skilled staff 24 18.4
4 Any other 10 7.6
Total 130 100
The analysis of Table 6.23 and reveal that majority of the respondents i.e. 40% believes
that lack of awareness is the big reason of dissatisfaction whereas 33.8% believes that
staff is unwilling for serving to the users.

The emotional awareness is necessary to build up the healthy atmosphere in the
library. To know the effect of emotional awareness in the library, a question was
asked. The options given and the responses received represents in the Table 6.24.
Table 6.24: Effect of emotions awareness
Sr Levels
Effect of
.
Strong
emotions Stron
Can
N Agr Disagr ly
awareness gly 't
o. ee ee Disagr
agree say
ee
Healthy
Emotional 96 114 12 5 7
1 Climate for
Library
% 41 48.7 5.1 2.1 2.9
Improve the
Information- 43 159 9 12 11
2 Dissemination
System
% 18.3 67.9 3.8 5.1 4.7
Analysis of Table 6.24 and Figure 6.24 reveals that majority of the respondents i.e.
67.9% agreed that the emotional awareness effects the information seeking and sharing
system whereas 41% believes that a healthy emotional climate is necessary for the
library. The healthy emotional climate helps the user to concentrate towards study.

Effect of Emotions Awareness
80
70 67.9
60
48.7
50
41
40
30
18.3
20
10
5.1 3.8 5.1 2.9
4.7
2.1
0
Strongly agree Agree
Disagree Strongly Disagree Can't say
Healthy Emotional Climate for Library (%)
Improve the Information-Dissemination System (%)
Figure 6.24
Since emotion helps in major aspects in life as well as in information seeking. To know
the users view on the awareness of emotions a question was asked. The responses
received represents in Table 6.25.
Table 6.25: Awareness of Emotions in Relationship with Users
Awareness of emotions can Improve the Relationship between
Library Staff and Users
Yes No
Nos. % Nos. %
219 93.5 15 6.4

The Table 6.25 and show that majority of the respondents i.e. 93.5% agreed that the
awareness of emotions can improve the relationship between Library staff and users
whereas 6.4% against it.
Conclusion
Emotions play a significant role in the workplace and staff/authorities’ emotions. Emotional factors are equally important because they affect the general tone of
discussion and influence the ways in which participants seek and share information. The
population of the study is the student and teaching faculties of the university. However,
the study is based on the survey of the random sampling of the population. The scope of
the study is covered the UG, PG, Research Scholar and the teaching faculty who use the
library. Since the study covers the psychological aspects of the users, therefore, the other point
of view i.e. Librarian and staff also included in it. As per library website, there are more
than 2000 users combining students, researchers, faculties and others.
Suggestions Based on the study and responses received from the respondents through questionnaire following suggestions have been derived: Behaviour of library staff should be good and helpful towards users.
Library staff are the breath of the library. It should help in maintaining the friendly relationship with the users. It leads to maintain discipline and silence in the library.
The training and orientation regarding the arrangement of library collection for the library users should be provided periodically to utilize the library.
Library is the silence zone of the university so the visitors create the healthy atmosphere in the study area.
There is a need to improve the speed of internet connection being provided by the library.
Library professionals should try to resolve each and every query of the users with smile to build an emotional relationship so that their emotions doesn’t hurt.
The library should build a quality collection for the users.
Library staff should be given adequate training to manage library housekeeping activities.
REFERENCE: Babasaheb Bhimrao Ambedkar University (BBAU), Lucknow (2016) retrieved from
www.bbau.ac.in on 23/03/2016

Gautam Buddha Library, Babasaheb Bhimrao Ambedkar University (BBAU), Lucknow
(2016) retrieved from www.bbau.ac.in/central_library.html (14.139.228.238) on
24/03/2016 Ministry of Human Resource and Development, New Delhi (2016) retrieved from
http://mhrd.gov.in/central-universities-0 on 25/04/2016 University Grant Commission, New Delhi (2016) retrieved from http://www.ugc.ac.in/
on 25/04/2016 Kumar, Lalit. Singh, Lokendra and Lal, Pyare (July-Sept. 2012). “Open Source
Software Using Koha: A Case Study of L R Institute of Engineering &
Technology”. An International Journal of Digital Library Services, Issue-3, Vol.
3 retrieved from http://www.ijodls.in/uploads/3/6/0/3/3603729/61-75.pdf
accessed on 13/04/2016. Babasaheb Bhimrao Ambedkar University, Lucknow (2015) Gautam Buddha Library
Annual Report – 2014-15.