role of mining in national economies
TRANSCRIPT

third edition
Role of mining in national economies

Role of mining in national economies – third editionii

Role of mining in national economies – third edition 1
Contents
Executive summaryFindings
Looking towards the future
1. Introduction1.1 Mining’s contribution and sustainable development
1.2 Overview
2. Global context of mining’s contribution2.1 Introduction
2.2 Metals prices
2.3 Demand and supply
2.4 Implications
2.5 Implications for mining companies
3. A revised Mining Contribution Index (MCI)3.1 Introduction
3.2 Results
3.3 Mining’s location and dependency levels
3.4 Decomposing the MCI
4. Selected topics that significantly influence mining’s contribution4.1 Mineral taxation – what contribution does mining make to government revenue?
4.2 Employment – how much employment does mining create?
4.3 Governance – how does governance influence mining contributions?
5. ConclusionsGuest contribution – The SDGs: an opportunity to re-imagine mining’s role in development
References
Abbreviations and glossary
24
10
18
30
58

Past editions of the Role of Mining in National Economies (Romine) have drawn attention to the significant contribution of mining and metals to the global economy and to the economies of an increasing number of low- and middle-income countries. This third edition, produced at a time of considerable turbulence in international commodity markets, shows that despite the metals prices downturn a great many low and middle-income economies remain dependent on the mineral sector. A dependence jolted only slightly by the commodity markets downturn.
This reinforces the need for the contribution of mining and metals to national economies to be thought about more strategically as a catalyst for sustainable development: a position contrary to much of the conventional commentary about the industry. The magnitude of its value to the economies of many lower-income countries gives it and its stakeholders a clear responsibility to be ever more conscious of how mining and metals might contribute to sustainable development. The potential for mining to contribute to the Sustainable Development Goals is the subject of a guest contribution from the United Nations Development Programme (UNDP) to this publication (see page 60).
Findings
This edition of Romine introduces an updated Mining Contribution Index (MCI) that synthesises into a single number the significance of the mining and metals sector’s contribution to over 180 national economies. It also adds a new indicator – mineral rents as a percentage of GDP – to those previously used to construct the MCI. Mineral rents are defined as production values minus ‘normal costs’ so they loosely approximate to the aggregation of tax and profit above ‘normal’ profits from mining. The indicators are each given equal weight in the index.
The MCI scores and rankings provide an indication of the relative importance of mining in the economic life of each of the 183 countries covered. However, whether or not a relatively high position on this Index ultimately translates into broader-based economic and social benefits for a country is a separate yet critically important question.
Overall, the MCI shows that the biggest mineral-producing countries (a list topped by China, Australia, Russia and the United States) are not necessarily those most economically dependent on mineral production. Of the 20 biggest mineral-producing countries, only Australia, the Democratic Republic of the Congo (DRC), Mozambique and Ukraine appear in the top 20 of the MCI.
‘ It is predominantly in low-and-middle- income countries that national economic life depends most heavily on mining’
Executive summary
Role of mining in national economies – third edition2
1. The third edition of the MCI incorporates a new indicator: mineral rents as a percentage of GDP. The previous MCI has been recalculated to include this indicator for purposes of showing the change in ranking.
It is predominantly in low- and middle-income countries that national economic life depends most heavily on mining. And this dependence has been increasing over the last two decades. The MCI confirms that many of the most mineral dependent countries continued to become even more dependent on the economic contribution of mining between 2011 and 2014, despite the fall in commodity prices. In light of this, getting the framework that governs mineral resources right will be increasingly important if governments are to insulate their economies from vulnerability to the commodity cycle.
The revised MCI – as a composite of four main quantitative indicators – is a useful starting point for understanding the extent of mining’s contributions to a country’s economy.
Position Change1 Country
1 +2 Congo, Dem Republic
2 -1 Mauritania
3 +5 Burkina Faso
4 +34 Madagascar
5 +5 Botswana
6 -4 Guyana
7 +12 Uzbekistan
8 +6 Liberia
9 +14 Kyrgyz Republic
10 +57 Tajikistan

‘ ...getting the framework that governs mineral resources right will be increasingly important if governments are to insulate their economies from vulnerability to the commodity cycle’
However, it remains a compromise between what we would ideally like to measure and include and what can in practice be measured across all countries. In particular it does not yet capture some other highly significant contributions and factors that influence how effectively mining contributes to broader development. To begin to bridge this gap we have sought to supplement the MCI data with further analysis on the potential contribution of the mining and metals industry to government revenues and employment, and to reflect on the importance of governance.
Mining’s contribution to government revenues
The responsible stewardship of tax revenues is key to translating mining and metals contributions into long-term development. Available data suggests that mining’s contribution to government revenues in low- and middle-income countries can be significant, but is also highly variable between different economies (contributing anywhere between 2 and 20 per cent of total revenues, with some outliers), and is also often volatile. In the recent past, lower commodity prices have already led to fiscal problems in some national economies, creating the need for several countries to cut spending or increase borrowing.
Mining’s ability to generate jobs
Currently no reliable or comparable data is produced for all countries but what data exists suggests that mining typically contributes only around 1–2 per cent of total employment in a country – but when indirect and induced employment is included, this can jump to 3–15 per cent. The multiplier effect of the industry means that each loss of a mining job
caused by the commodity price slump could have the knock-on effect of causing several more workers to lose their jobs.
The quality of governance
A well-governed country is more likely to maximise the contribution of mining by negotiating good terms with mining companies; collecting, managing and spending revenues wisely; and creating an enabling environment to enhance employment. Some indicators of governance exist, although as yet are insufficiently comprehensive to incorporate into the MCI. Evidence from both the World Bank (World Governance Indicators) and the Natural Resources Governance Institute (Natural Resources Governance Index) suggests that of the top 50 MCI-ranked countries, approximately 75 per cent are governed at levels below those considered satisfactory for good governance of natural resources. However, many do relatively well on measures of having in place appropriate institutional and legal settings, safeguards and quality controls. This creates a base on which to build.
Looking towards the future
As more comprehensive data become available, future editions of Romine and the MCI will work towards building a more nuanced understanding of the extent to which countries rely on mining – and how well they leverage mining for broader development. This will improve the value of the MCI and ensure that it provides a regular and useful basis for assessing mining’s role in the global economy and in individual mining economies.’
Role of mining in national economies – third edition 3

Role of mining in national economies – third edition4
Introduction1.1
Mining’s contribution and sustainable development
The past few years since the publication of the second edition of the Role of Mining in National Economies (Romine) have been highly eventful for the mining industry. Price uncertainties have persisted leading to the cancellation or delay of major projects; several countries that host mining projects have faced painful fiscal and other adjustments; and many of the major mining companies have seen changes to their management teams, to their financial structures and to their operational plans.
This is the third edition of Romine. The first edition (published in 2012) covered the period from 2000 to 2010, when metals and minerals prices were generally strong and on the increase. The second edition (published in 2014) extended the analysis to 2012: a period during which prices for many metals peaked but later declined. This edition extends coverage through the period to 2014/15 during which prices generally further declined but by the end of which limited signs of turnaround had become evident at least for some metals.
The first two editions of the Role of Mining in National Economies documented the very substantial roles of the mining and metals industry in the global economy. They also drew attention to the industry’s growing significance to the economic performance of an increasing number of low- and middle-income
economies, as mineral production shifted from its traditional centres in Europe and North America to exploit large and often remote resources in Latin America, Asia and Africa.
Since the last edition, the UN General Assembly has adopted the Sustainable Development Goals (the successor agenda to 2000’s Millennium Development Goals), covering the period from 2015 to 2030.2 Mining is not generally thought about in the context of the agenda for sustainable development and its component targets, such as global poverty reduction.
However, the magnitude of mining in many lower-income countries gives the industry and its stakeholders a clear responsibility to be ever more conscious of the role mining can and should play in broader economic and social development. The potential for mining to contribute to the Sustainable Development Goals is the subject of a guest contribution from the United Nations Development Programme (UNDP) to this publication (see page 60).
International Council on Mining and Metals (ICMM) members recognise that large mines, especially in lower-income countries, need to be designed and operated to make a genuine contribution to the sustainable development of their host societies. This goes beyond the obligation to make a fair and reasonable fiscal contribution to the budgets of host-country governments although that is a crucial component. It also involves large-scale mining’s undoubted ability – if well managed, and supported by appropriate host-
‘ the magnitude of mining in many lower-income countries gives the industry and its stakeholders a clear responsibility to be ever more conscious of the role mining can and should play in broader economic and social development’
2. The full title of the agenda is Transforming our world: the 2030 Agenda for Sustainable Development. The agenda comprises 17 goals with 169 targets covering a broad range of sustainable development issues including ending poverty and hunger, improving health and education, more sustainable cities, combating climate change, and protecting oceans and forests.

Role of mining in national economies – third edition 5
‘ The case for mining-led economic and social progress still needs to be supported by more evidence’
country policies – to catalyse broader economic development.
The industry recognises also that a finite and depletable resource cannot, on its own, deliver sustainable long-term development. But the exploitation of that resource over several decades can provide various beneficial stimuli to processes that can deliver such development. These include new productive activities stimulated by mining company procurement; higher incomes for local populations, leading to new local demand from non-mining sources; new, multi-user infrastructure; the introduction of new technologies, both hard and soft (eg management techniques), with related improvements in local corporate capacity; new skills stimulated by training programmes linked to mining; and higher levels of government social and economic spending, supported by mining companies’ tax and royalty payments.
In short, the mining and metals sector – if properly managed, regulated and supported – can be a powerful way of helping a lower-income country transition to higher and more sustainable levels of income and long-term development.3 There is no guarantee, however, that the transition described will be achieved easily or in all countries. And the positive story about the transition was certainly easier to tell when commodity prices were rising after 2003, driven in large part by the growth in metals demand from China. During those years, three decades of economic literature drawing attention to a ‘curse of natural resources’
became less prevalent in political debates.
Today, despite five years of lower commodity prices, the fundamental idea of the extractives sector acting as a bridging activity to sustainable long-term development remains fundamentally valid, and the framework for understanding this role has been articulated clearly in a number of studies.4
The case for mining-led economic and social progress still needs to be supported by more evidence, more documentation of successful cases, more critical assessments of existing policy interventions and more practical support from all those charged with policy-making for the sector, both in companies and in governments.
This third edition of Romine seeks to contribute to that agenda. It does this by presenting a revised and updated version of the Mining Contribution Index (MCI), which was introduced in the first edition of Romine in 2012.
The MCI provides an indication of the relative importance of mining in the economic life of each of the 183 countries for which comparable data exist. However, whether or not a relatively high position on this index ultimately translates into broader-based economic and social benefits for a country is a separate question that can only really be answered by recourse to more detailed country case studies of the type that ICMM has supported through its Mining: Partnerships for Development (MPD) programme.
3. This idea, including a strong recommendation for host countries to pursue economic diversification as the focal point of their stance towards extractives, has been set out in detail in a recent study published by Chatham House. See Stevens, P, Lahn, G and Kooroshy, J (2015), The resource curse revisited, London: Chatham House, August 2015.
4. Examples include Gibson, R, Hassan, S, Holtz, S, Tansey, J and Whitelaw, G (2005), Sustainability assessment – criteria and processes, London: Earthscan; and Hodge, A (2011), Mining and sustainability, Chapter 16.2 in Peter Darling (ed), SME mining engineering handbook, third edition, Englewood, Colorado: Society for Mining, Metallurgy and Exploration.
1

Role of mining in national economies – third edition6

Role of mining in national economies – third edition 7
Introduction continued
1.2
Overview
Section 2 describes the current global context for mining. It first documents the main headline story of the past few years, significant drop in the prices of the major metals and minerals, and assesses both near-term and longer-term prospects. It then examines the longer-term global levels and geographical patterns of metals consumption and how these continue to drive the levels of production and prices in international markets.
Next it considers the main ways in which the major international mining companies – in both the Organisation for Economic Co-operation and Development (OECD) and the BRIC countries (Brazil, Russia, India and China) – have been impacted by the decline in metal prices, and the various adjustment mechanisms that companies have employed to protect their positions in the face of these difficulties.
Section 3 presents a revised and updated version of the MCI, which was introduced in the first edition of Romine in 2012 as ‘a basis for discussion and a first step towards providing a long overdue and continuously updated set of data on mining’s overall economic contribution’.5 Section 3 also updates the analysis of the second edition of Romine by showing how the role of low- and middle-income countries in mineral production has further increased.
It was recognised in the two previous editions that the numerous components of ‘contribution’ that can be assessed in detailed country case studies6 could only be captured in part by using data that was readily available and consistently produced for all mining economies. In the first two editions of Romine, the MCI used just three equally weighted main variables. However, it was always the intention to incorporate additional indicators of contribution as and when appropriate data became available.
The process of producing this third edition of the MCI was preceded by an in-depth examination of a range of indicators that might be considered for inclusion, either in this edition or in later years.7 However, this process showed that there are still only a very limited number of indicators that meet the condition of being readily available for all or most countries on a timely, consistent and comparative basis. Just one new indicator has been added this year – mineral rents as a percentage of gross domestic product (GDP) – and given the same weight as the other three indicators. The role of this new indicator is further explained in Section 3. Notes on the methodology and the weightings used to construct the MCI were set out in previous editions, and are not repeated here. Further structural analysis about the role of each individual indicator in the MCI is presented in the supplement to this third edition of Romine– the Mining Contribution Index.
5. It was noted at the time that there was no source that systematically captures the important role of the extraction and production of mining, minerals and metals in the economies of each country in the world. Hence there was an obvious gap to be filled and the MCI was designed to do just that.
6. Including the eight in-depth country cases undertaken by ICMM itself under the umbrella of its MPD programme.
7. This process was led by a well-qualified specialist who was independent of ICMM and who also examined some of the other weaknesses of the MCI and how these might be addressed.
1Section 4 elaborates three issues that are not yet formally captured in the MCI, but which are highly influential in determining the overall size and nature of mining’s contribution in all mining countries: taxation, employment and various dimensions of the governance of the sector in host countries. Section 4.1 addresses the contribution that mining makes to government revenues, and Section 4.2 covers its contributions to employment. Both sections outline why these contributions are important, discuss evidence about how much the sector contributes, and consider emerging evidence about the impacts of the commodity price drop on these contributions. Section 4.3 assesses governance in the countries ranked in the top 50 of the MCI and outlines how governance is likely to impact on the contributions of mining to government revenues and employment.

Role of mining in national economies – third edition8 Role of mining in national economies – third edition8

Role of mining in national economies – third edition 9
2Global context
of mining’scontribution
Role of mining in national economies – third edition 9
Role of mining in national economies – third edition10
Global context of mining’s contribution2.1
Introduction
The headline stories about mining over the past 24–36 months have mainly been about the prolonged downturn in most metal prices; the substantial adjustments to activity levels and future plans that this has caused; the demergers and sell-offs that it has provoked among the major corporates; and the fiscal and other difficulties arising in many of the lower- and middle-income host economies leading to further expressions of resource nationalism. However, these prominent and challenging short-term issues have obscured a more positive longer-term story about the ongoing and growing significance of the mining and metals industry in the global economy.
2.2
Metals prices
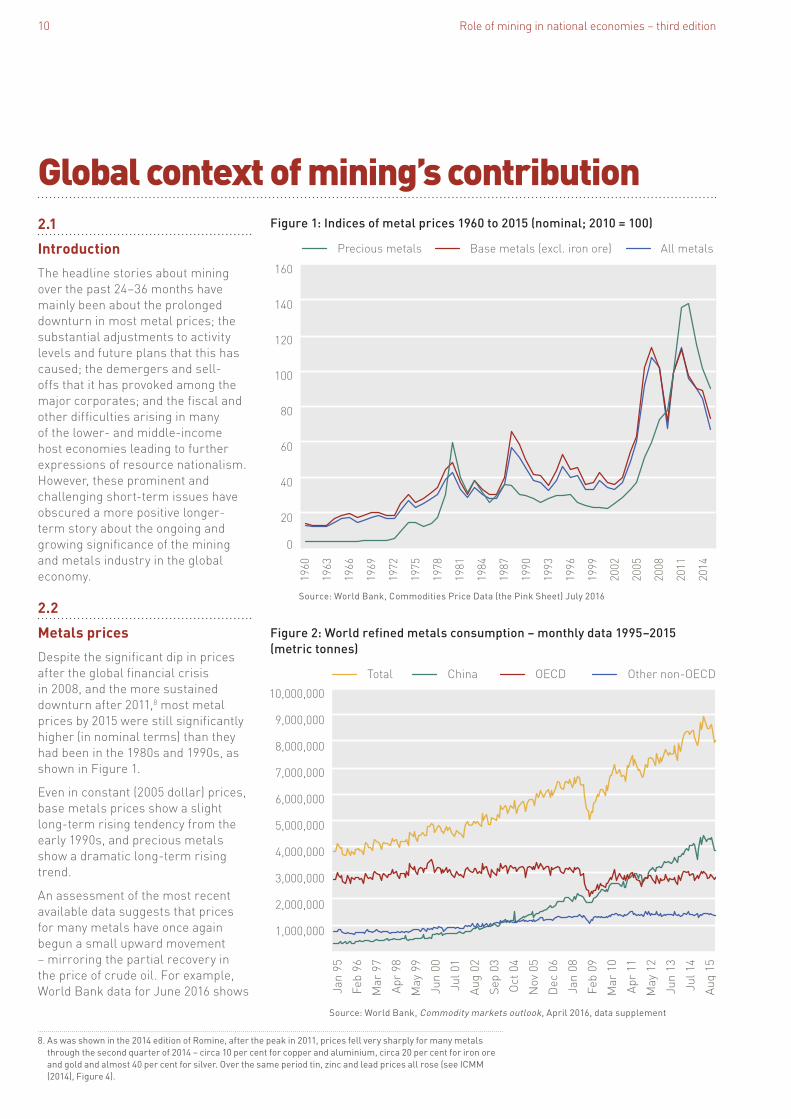
Despite the significant dip in prices after the global financial crisis in 2008, and the more sustained downturn after 2011,8 most metal prices by 2015 were still significantly higher (in nominal terms) than they had been in the 1980s and 1990s, as shown in Figure 1.
Even in constant (2005 dollar) prices, base metals prices show a slight long-term rising tendency from the early 1990s, and precious metals show a dramatic long-term rising trend.
An assessment of the most recent available data suggests that prices for many metals have once again begun a small upward movement – mirroring the partial recovery in the price of crude oil. For example, World Bank data for June 2016 shows
8. As was shown in the 2014 edition of Romine, after the peak in 2011, prices fell very sharply for many metals through the second quarter of 2014 – circa 10 per cent for copper and aluminium, circa 20 per cent for iron ore and gold and almost 40 per cent for silver. Over the same period tin, zinc and lead prices all rose (see ICMM (2014), Figure 4).
140
120
100
80
60
40
20
160
0
1987
1984
1981
1978
1975
1972
1969
1966
1963
1960
1990
1993
1996
2008
2005
2002
2011
1999
2014
Precious metals Base metals (excl. iron ore) All metals
Figure 1: Indices of metal prices 1960 to 2015 (nominal; 2010 = 100)
Source: World Bank, Commodities Price Data (the Pink Sheet) July 2016
9,000,000
8,000,000
7,000,000
6,000,000
5,000,000
4,000,000
3,000,000
10,000,000
2,000,000
1,000,000
Dec
06
Sep
03
Oct
04
Nov
05
Aug
02
Jul 0
1
Jun
00
May
99
Apr
98
Mar
97
Feb
96
Jan
95
Jan
08
Feb
09
Mar
10
Apr
11
May
12
Jun
13
Jul 1
4
Aug
15
Total China OECD Other non-OECD
Figure 2: World refined metals consumption – monthly data 1995–2015 (metric tonnes)
Source: World Bank, Commodity markets outlook, April 2016, data supplement

Role of mining in national economies – third edition 11
price increases relative to those for October–December 2015 of 6.4 per cent for aluminium, 10.6 per cent for iron ore, 1.6 per cent for lead, 12.5 per cent for tin, 15.3 per cent for gold and 16.9 per cent for silver.9 But these movements are neither firmly established nor consistent across all metals; there is still some differentiation across metals and ongoing volatility. So, for example, in that same period, there have been further price declines for both copper (5.2 per cent) and nickel (5.5 per cent).
2.3
Demand and supply
The long-term price tendencies shown in Figure 1 have been driven by what seems to be a well-established long-term trend for increased metals consumption in emerging lower- and middle-income countries around the world. Although demand from the OECD countries has been pretty much flat over the 20 years since 1995 (at around 3 million metric tonnes per annum),10 rising demand from the emerging economies – especially China – has ensured a very significant increase in total global metals consumption, as evidenced in Figure 2.
Relative to the growth of global incomes (as measured by GDP) over the same period, this increase in metals consumption as shown in Figure 2 has been dramatic. Total world GDP in current prices rose by about 140 per cent from 1995 through 2015 in nominal dollar terms, by just under 200 per cent using the purchasing power parity (PPP) measure of GDP but by only 78 per cent in constant price (2010 $) terms.
By contrast, the value of metallic minerals produced (which includes the impact that rising demand has had on the prices of metals) rose much faster, by no less than 470 per cent between 1995 and 2014 – as seen in Figure 3.
The downturns both in 2008 and after 2011 are clearly visible in Figure 3 – but despite this volatility, the total global demand for metals has held up strongly in the longer-term perspective. Specifically, the long-term growth in the physical (real) growth of metals consumption (1995 through 2015) as shown in Figure 2 was 106 per cent whereas the corresponding real (constant price) change in GDP over the same period was 78 per cent. This suggests that the long-term elasticity of metals demand with respect to GDP has been circa 1.36 in this period (ie 106/78).
9. Overall, data from the World Bank suggests that the decline in prices was halted in 2014Q3, with the World Bank metals price index rising 2.6 per cent (quarter on quarter).
10. Consumption in this section refers to world refined metal consumption as defined by the World Bureau of Metal Statistics.
11. These characteristics include strength, durability, capacity to conduct heat and electricity, aesthetic appeal and – to date – their reasonable cost.
2700%
600%
500%
400%
300%
200%
100%
800%
0
2004
2003
2002
2001
2000
1999
1998
1997
1996
1995
2005
2006
2007
2008
2009
2010
2011
2012
2013
2014
Total mineral production (excl coal)
World GDP (PPP, current prices)
Figure 3: World GDP and total mineral production – 1995 to 2014 (1995 = 100)
Sources: SNL database and World Bank
The underlying reason for an elasticity greater than one, as noted in previous ICMM reports, is that the specific properties of minerals in general, and metals in particular, continue to give them a central role in everyday life and economic development.11 This fundamental reality has driven both the long-term upward movement of prices and the long-term movement of total production.
It is a reasonable proposition that the strong growth in demand has been driving the supply of the main metals and minerals in the recent past. But there have also been significant supply side forces that have been exerting an effect on the global markets for particular minerals and their prices. In recent years, for example, huge investments have been made in Latin America, Africa and parts of Asia, driven by factors including the

Role of mining in national economies – third edition12
Global context of mining’s contribution continued
depletion of easily accessible mineral deposits in Europe and the US.
In addition, technological advances have made feasible the mining of previously inaccessible deposits in remote less-developed regions, and the development of huge ocean-going vessels facilitating trade in bulk minerals has made their transportation around the globe increasingly feasible and lower cost. These trends are expected to continue. Strategic factors have also played a part with China in particular putting security of supply high on its own political agenda. This has led that country to spend increasing amounts on exploring for minerals inside China and also to reach out ever more to participate in the mining and metals industry in other countries. Supply factors have also influenced demand because of the ongoing technological developments that have made it possible to mine ores of declining grades and more complex mineralogy. By lowering costs this has opened up feasible new uses for some metals.
2.4
Implications
How the pattern of global demand revealed by Figures 2 and 3 will evolve in future years is critical to an assessment of how metal prices are most likely to evolve. With flat demand from OECD countries, overall growth has become ever more dependent on lower- and middle-income countries and particularly China. As noted by ICMM (2012):12
Studies have now consistently demonstrated that when per capita incomes reach US$5,000–10,000 per year, metal demand increases particularly quickly. When populous countries such as China and India go
through this development phase, the effects on metal demand are dramatic … From this perspective alone, only a prolonged global economic recession or a global environmental or social disaster would stop the overall growth in demand for minerals and metals in the foreseeable future. This is so even when there are swings in the global economy that result in peaks and troughs in demand.
Although China’s slower growth has recently caused market commentators much anxiety, the economy is expected to grow by around 6–7 per cent per annum – and from a much higher base than in the recent past, with its total GDP having quadrupled since 2000. So a still high growth rate is being applied to a much bigger total economic base. While slower infrastructure growth could cause difficulties for iron ore and coal, the rebalancing of Chinese aggregate demand towards a greater role for
private consumption will likely boost demand growth for base metals such as copper and nickel as well as zinc. Additionally, any slackening of demand growth from China could possibly be taken up by more rapid growth of demand from India and other Asian and African economies approaching the critical $5,000–$10,000 per capita income level. Metals usage remains very low for a large share of the world’s total population. So it is reasonable to assume that continued high rates of growth for at least a subset of the world’s poorer countries could be an ongoing stimulus to sustain the significant growth in metals demand for many more years to come.
Certainly it seems likely that the broad pattern of demand growth revealed by Figures 2 and 3 will be sustained, albeit with further occasional perturbations. This implies that metals prices are likely to rebound
160%
140%
120%
100%
80%
180%
200%
2024 202520232022202120202019201820172016
Nickel
Tin
Copper
Zinc
Aluminium
Iron ore
Lead
Figure 4: Selective metal price forecasts – 2016 to 2025 (2016 = 100)
Source: World Bank, Commodities Price Forecast (constant US dollars) – 19 April 2016 release
12. ICMM (2012). InBrief. Trends in the mining and metals industry. Mining’s contribution to sustainable development. October 2012. London: ICMM, p 3.

Role of mining in national economies – third edition 13
Introduction
further from the downturns of recent years. In confirmation of this, some major forecasters are expecting a sustained upturn in the prices of most metals (dramatic in the case of nickel), as shown by examples from World Bank forecasts in Figure 4.
2.5
Implications for mining companies
2.5.1 Market capitalisation
The past few years have been problematic for most mining companies, as manifest in the stock market capitalisation of the Top 40 companies. A 2015 report by PricewaterhouseCoopers (PwC) put their total capitalisation at $791 billion at the end of 2014 – no higher than in 2004, despite huge investments in the intervening decade, and 50 per cent lower than at the peak of the super cycle in 2010.13
However, the pain was not equally spread. In 2014 the OECD-domiciled companies in the Top 40 lost 21 per cent of their value (a massive $137 billion) versus only 7 per cent ($19 billion) in BRIC-domiciled companies. More than half the BRIC companies actually saw improvements in value, with three Chinese companies – two predominantly coal miners – seeing impressive gains of more than 30 per cent.14 South African miners disappeared completely from the Top 40 list, having occupied five places in 2004.
The stock markets’ view of mining companies has not been helped by a number of one-off problems, notably the tailing dam failure at BHP Billiton and Vale’s Samarco operation in Brazil. The overall decline in market capitalisation continued through 2015, not only for the 40 largest in 2011,15 but also for another 2,590 companies in the SNL mining database, as shown in Figure 5.
2
3,000,000
2,500,000
2,000,000
1,500,000
1,000,000
500,000
0
All other companies
Top 40 companies by market cap (2011)
20152014201320122011
Figure 5: Market capitalisation – 2011 to 2015 ($ million)
Source: SNL Mine Economics database
13. PwC defines the Top 40 companies by reference to their market capitalisation – in this case in 2014.
14. PwC (2015), Mine 2015: the gloves are off, review of global trends in the mining industry.
15. On this 2011 basis, the 10 largest companies were BHP Billiton, Vale, Rio Tinto, Polyus Gold, China Shenhua, Coal India, Anglo American, Barrick, Mitsubishi Materials and Glencore.
2.5.2 Cash management and production costs
The more difficult operating conditions of the past three to four years have elicited various corporate reactions, often involving a scramble for tighter operational management – especially cash flows. More than half of the Top 40 felt the need to change their chief executive officers. They have generally reduced investing activities, especially in greenfield projects; looked for new ways to cut costs, to achieve lower levels of debt; cut dividend payouts; and been less enthusiastic about merger and acquisition activities. The 2015 PwC report indicates that 2014 saw a 23 per cent reduction in capital expenditures by the OECD companies – significantly higher than in the BRIC-based companies, whose markets were growing more rapidly.
The PwC data shows that more than half the Top 40 companies saw a decline in their gross revenues between 2013 and 2014, with a total fall of $38 billion (5 per cent of the 2013 total of $728 billion). However, those companies also reduced their operating costs by circa $26 billion overall through a variety of measures helped in part by various extraneous forces, notably the significantly lower costs of energy inputs such as oil, and by their own efforts to boost productivity.
Previous editions of Romine discussed factors that had tended to increase production costs, as miners sought to take advantage of historically high metals prices (see Section 2.4 in the second edition). However, the evidence metal-by-metal through the period of declining prices since 2011/12 tells a somewhat different story. For example, from 2012 to 2015 the

Role of mining in national economies – third edition14
Global context of mining’s contribution continued
weighted average total costs (including royalties) of iron ore declined substantially, from about $45 per dmt (dry metric tonne) to $28 – a decline of 38 per cent. This followed a 31 per cent increase in the boom period from 2008 ($34.4 per dmt) to 2012. Several factors contributed to this decline, as shown in Figure 6: labour costs (reduction of $2.7 per dmt); energy costs (down by $2.4); other on-site and off-site costs (each down by over $4); and lower royalty payments, as the taxable base for these payments declined (down by $2.6).16 These decreases in royalty payments have implications for governments, as discussed in Section 4.1.
The evolution of weighted average costs in copper production has been similar, with a substantial rise through the boom years to 2012 followed by significant reductions thereafter. Total cash costs declined from $4,066/ton in 2012 to $3,512 /ton in 2015, a reduction of 14 per cent – smaller than for iron ore, but nonetheless significant. This contrasts with an increase of over 37 per cent between 2008 and 2012. As shown in Figure 7, the main sources of cost savings in copper production since 2012 have been labour costs (almost $173/ton) and energy (over $100/ton). There was also a $135/ton saving in royalty payments, which had the effect of passing some part of the adjustment on to host governments.
Finally, although its price fall has been more modest, the cost trends in gold mining have followed a similar path to those seen in copper and iron ore. Since 2012 total cash costs17 have fallen by $82 per oz, a fall of 11 per cent – although following an extremely large increase of over 60 per cent
40
35
30
25
20
15
10
45
50
5
0 20152014201320122011201020092008
Royalty
Off-Site Costs
Other on-site costs
Reagents
Energy
Labour
Figure 6: Production and royalty costs for iron ore – 2008 to 2015 ($ per dmt), free on board
Source: SNL Mine Economics database
3000
2000
1000
4000
5000
0
Royalty
TCRC and shipment
Other on-site costs
Reagents
Energy
Labour
20152014201320122011201020092008
Figure 7: Production and royalty costs for copper – 2008 to 2015 ($/tonne)
Source: SNL Mine Economics database
16. Most of the major resource exporting countries such as Australia, Brazil and Canada saw their exchange rates appreciate during the price boom period and subsequently fall as prices came down, and this has also helped companies to reduce costs expressed in $US terms.
17. Many of the top gold producers now generally report costs on an all-in sustaining costs as opposed to cash costs basis. However, the SNL data on cash costs is preferred here since it enables us to split production costs into its energy, labour etc components.

Role of mining in national economies – third edition 15
Introduction
between 2008 and 2012. As shown in Figure 8, the sources of the cost savings since 2012 are similar to those in iron ore and copper: a $24/oz saving in labour costs, $20/oz in energy costs and almost $14/oz in royalty payments.
Significantly, the detailed mine-by-mine data provided by SNL Mine Economics continues to show large variations in costs across the world’s many gold mines. For example, while the average total cost in 2015 was $670/oz, around a quarter of the world’s ‘paid gold’18 was produced at a total cost of under $500/oz, and a quarter at over $750/oz. Ten per cent of gold production cost well over $1000/oz to produce. At the peak of total costs, in 2012, a significant number of mines (in Australia, Canada, South Africa, West Africa and Papua New Guinea) produced at a total cost in excess of $1,500/oz, but by 2015 only a handful of South African mines were still producing at that level.
2.5.3 Exploration spend
The scramble for increased free cash has also resulted in significantly decreased exploration activity, which is likely to impact future levels of production. Figure 9 shows data for the 25 companies that were the largest spenders on exploration (including research and development)19 in 2011, and for 1,247 other companies making data available. Exploration spend was slow to react to declining metal prices in 2011, and continued to increase in 2012. But since then there has been a major decline, with the spending of the top 25 almost halving between 2012 and 2015.
2800
700
600
500
400
300
200
100
0 2015201420132012201120102009
Royalty
TCRC and shipment
Other on-site costs
Reagents
Energy
Labour
2008
Figure 8: Production and royalty costs for gold – 2008 to 2015 ($/oz)
Source: SNL Mine Economics database
Other companies 25 largest spenders (2011)
20152014201320122011
18,000,000
16,000,000
14,000,000
12,000,000
20,000,000
10,000,000
8,000,000
6,000,000
4,000,000
2,000,000
0
Figure 9: Spending on exploration, research and development 2011–15 ($ ’000)
Source: SNL Mine Economics database
18. In the statistics the concept of ‘paid gold’ or ‘payability’ reflects the actual arm’s-length contract between the miner and the smelter/refiner eliminating the adjustment of any unpaid metal units (or losses).
19. On this 2011 basis, the 10 largest spenders on exploration and research and development were, in order: Vale, Rio Tinto, BHP Billiton, Newmont, Nippon Steel and Metals, Posco, Areva, Metallurgical Corporation of China, Barrick and ArcelorMittal.
Role of mining in national economies – third edition16

3A revised Mining
Contribution Index(MCI)
Role of mining in national economies – third edition 17

Role of mining in national economies – third edition18
A revised Mining Contribution Index (MCI)3.1
Introduction
As was noted in the introduction, the MCI aims to synthesise important aspects of mining’s contribution in individual countries into a single number and an associated ranking. This is a complex task, and it is accepted that the data does not yet exist to do this in a wholly satisfactory manner for all countries. So parallel work is needed and indeed is being carried out by ICMM and others on more in-depth case studies of individual countries. The results of such studies are always more detailed and so more directly helpful for policy purposes, but they do not lend themselves to easy comparability across multiple countries. Hence a construct such as the MCI has value. Nonetheless, the MCI is inevitably a compromise between what should be included in principle and what can be measured in practice. ICMM is committed to improving and widening the scope of the MCI as data availability allows.
For the moment, the MCI as presented here provides an indication of the relative importance of mining in the economic life of a given country. However, as was noted in the introduction, whether or not this can be interpreted as also indicating something about the broader-based economic and social benefits for a country is a
separate but profoundly important question. Arguably, some of the countries that rank highest in the MCI – such as DRC and Mauritania – occupy these high positions by virtue of the limited extent to which they have successfully diversified their economies into areas that are independent of metals and minerals. Other countries such as Chile and Brazil that are further down the rankings have moved further along the transition path to incorporate their still important mining activities into broader-based economic development. So the relative position of a country on the MCI is not necessarily an indication of the extent to which it has benefited from mining to date: instead, it signals the current significance of mining in the economic life of that country and the importance of taking steps to better understand and then strengthen the contribution of mining and metals to sustainable development.
In the first two editions, the MCI was derived based on the total contribution of mining to export earnings (2012), the change in export earnings in the preceding five years (which gives a sense of whether mining is growing or diminishing in importance over time) and the value of mineral production expressed as a percentage of GDP. For this edition, one new indicator has been incorporated – mineral rents as a percentage of GDP. This makes
four indicators in total, with each given one-quarter weight in the index. Mineral rents are defined as production values minus ‘normal costs’, including an appropriate rate of return on investment. So they loosely approximate to the aggregation of potential tax and profit flows from mining.20 Therefore the new indicator may have a relatively small numerical value but may also be quite volatile to changing circumstances such as downswings in mineral prices like those seen since 2011.
As a result, the latest MCI results may show a greater degree of short-term instability relative to that shown by the previous index. The new variable’s inclusion in the index helps to capture some sense of the margins associated with mining once all normal costs and normal profits have been taken into account. To achieve comparability with the index values from the first two editions of Romine, the MCI has also been calculated with the inclusion of that new indicator for the previous years. The remainder of this section summarises the main numerical results, starting with Table 1 that presents the ranking of countries according to the revised MCI for 2016.21 Full country-by-country detail for 18322 countries can be found at www.icmm.com/romine/index
20. The World Bank publishes estimates of natural resource rents as a percentage of GDP for minerals and coal separately. It defines these rents as the production values of a range of minerals less their ‘normal’ costs of production including an appropriate rate of return on investment. Mineral rents do not equate precisely with any national account statistic. Their addition to the MCI does add new information relative to the existing ‘production value’ indicator.
21. The rankings use data for 2014, the last year for which all the necessary data is available at the time of publication. The previous two versions of the index had the same two-year lag in data.
22. The first two editions of Romine covered 214 countries. Of this original list, two or less data points are available for 31 countries which have been omitted from the main data table and rankings. However, available information for these countries is included at the end of the MCI supplement.

Role of mining in national economies – third edition 19
3

Role of mining in national economies – third edition20
A revised Mining Contribution Index (MCI) continued
Table 1: An updated and revised Mining Contribution Index – top 25 countries in 2016
Source: various sources for indicators that make up MCI (available online at www.icmm.com/romine/index)
1 2 3 4 5 6 7
2016 MCI rank Country
2016 MCI score
2014 rank with mineral rents
Difference in ranks between 2016 and 2014 (col 4 – col 1)
2014 rank without mineral rents
Difference in ranks between 2016 and 2014 without mineral rents (col 6 – col 1)
1 Congo, Dem. Rep. 96.2 3 +2 4 +3
2 Mauritania 95.6 1 -1 1 -1
3 Burkina Faso 94.0 8 +5 8 +5
4 Madagascar 91.7 38 +34 37 +33
5 Botswana 90.7 10 +5 9 +4
6 Guyana 90.8 2 -4 3 -3
7 Uzbekistan 89.8 19 +12 25 +18
8 Liberia 89.0 14 +6 11 +3
9 Kyrgyz Republic 88.8 23 +14 33 +24
10 Tajikistan 87.0 67 +57 81 +71
11 Australia 84.5 12 +1 13 +2
12 Mozambique 84.0 35 +23 17 +5
13 Jamaica 83.7 73 +60 87 +74
14 Ghana 83.4 51 +37 62 +48
15 Sierra Leone 83.2 58 +43 52 +37
16 Dominican Republic 81.9 54 +38 53 +37
17 Senegal 82.0 24 +7 30 +13
18 Ukraine 80.6 29 +11 39 +21
19 Rwanda 79.4 77 +58 77 +58
20 Mongolia 78.0 11 -9 14 -6
21 Armenia 77.6 16 -5 19 -2
22 Sudan 77.2 37 +15 42 +20
23 Nicaragua 76.7 27 +4 32 +9
24 Chile 75.8 42 +18 50 +26
25 Myanmar 75.1 28 +3 16 -9

Role of mining in national economies – third edition 21
3.2
Results
The results for the top 25 ranked countries are summarised in Table 1. There has been a significant change at the top of the rankings in 2016 with just over half (13) of these countries changing since 2014. Most of the top 25 are classified as lower- or lower-middle income countries, with the exception of the higher-income economies of Australia and Chile. The top-ranked countries are the Democratic Republic of the Congo (DRC), Mauritania, Burkina Faso, Madagascar and Botswana.
Three of these changes to the top 25 are the result of the exclusion of countries for which data was available for only two of the four components that make up the index. The countries excluded are Eritrea, Democratic Republic of Korea and the North Mariana Islands. However, a number of countries have made significant gains to feature in the top 25 rankings, including Madagascar, Tajikistan, Jamaica, Ghana, Sierra Leone, Dominican Republic and Rwanda. Tajikistan, Jamaica and Rwanda have made the greatest gains (see fourth column).
As in the previous version of the index, these larger gains are mainly associated with the most dynamic variable among the four, namely the change in mineral export contribution measured from a base year of 2009. In the case of Jamaica, for example, that change was positive in the current index (13 per cent) whereas in the previous index it had been strongly negative (-23 per cent). Increases in production
value (as a percentage of GDP) was also significant in some instances. Between the 2014 MCI and this third edition it had more than doubled in Tajikistan and increased threefold in the Dominican Republic.
The component indicators among the highest-ranked countries differ significantly. For example, DRC had a very high export contribution of 78.3 per cent; a change in that contribution, relative to 2009, of 5.6 percentage points; a production value relative to GDP of 27.5 per cent; and a high mineral rent level relative to GDP of 20.1 per cent. By contrast, fifth-placed Botswana had a higher export contribution of 92.1 per cent, a larger change in that contribution of 18.3 percentage points, even after many years of seeking to diversify away from diamonds, but a production value lower than that in DRC of 6.5 per cent and a lower mineral rents ratio of 1.8 per cent. Tajikistan, now ranked 10th (compared with 81th in 2014), increased its export contributions from 29.0 to 48.5 per cent from 2009 to 2014, whereas for the 2014 MCI its export contributions reduced by 11.2 percentage points from 2007 to 2012, which helps to explain its significant gain in the rankings.
The final column of Table 1 shows that the inclusion of the new indicator on mineral rents has made a difference to the rankings, but not a huge one. Most of the top 25 ranked countries in 2014 and 2012 move by only a few places in the rankings when the index is recalculated on the previous three-variable basis. This is partly because the new indicator shows some degree of correlation
with the production value indicator. However, there are a limited number of exceptions to this.
3.3
Mining’s location and dependency levels
Previous editions of Romine have shown that countries that are the major producers of minerals do not necessarily have a high degree of economic dependence on mineral export activity, whereas an increasing number of smaller but generally poorer countries do show high levels of dependency. Mineral production is still dominated by a few higher-income economies (notably Australia, the US, Chile and Canada), the four BRIC economies, South Africa and a few higher middle-income countries such as Mexico and Indonesia. Table 2 shows the rankings of countries in terms of production value for 2010, 2012 and 2014, together with the 2014 levels of production (with and without coal).
The major fallers in the rankings since 2010 include Brazil (from 3rd to 9th) and Zambia (from 16th to 23rd). New entrants to the top 20 in 2014 include Colombia, Germany and Poland, along with DRC and Mozambique – the only two low-income countries to feature, and the only new entries that remain in the top 20 when coal is excluded.
However, low- and middle-income countries continue to show the highest levels of dependence. Table 3, for example, ranks countries in terms of the first of the four indicators of the MCI – exports of metals and minerals (excluding coal)
3

Role of mining in national economies – third edition22
A revised Mining Contribution Index (MCI) continued
relative to total commodity exports in 2014, with comparison figures for 1996 and 2012.
In 2014, 41 countries had a mineral export dependence ratio of greater than 25 per cent. A further 13 (not shown) had a ratio between 15 per cent and 25 per cent.23 Eight of these 54 countries were classified as high income (Australia, Aruba Bahrain,
Chile, French Polynesia, Iceland New Caledonia and Switzerland) – the other 46 were either low- or middle-income countries.
Table 3 also shows a very clear tendency for these dependency ratios to have increased since 1996. Only 9 of the 41 most dependent countries shown in Table 3 decreased their levels of dependence between
1996 and 2014, with many of the others showing large increases: for example, Rwanda (42.4 percentage points (pp) increase), Burkina Faso (41.4 pp), Mali (38.7 pp) and Mozambique (35.4 pp). The average magnitude of this increase across all the 41 countries was 12.8 percentage points. This rising level of mineral dependency is partly explained by the super cycle of price rises through
Table 2: Top 20 countries in terms of production values
2014 ranking Country
2014 production value ($ bn)
2014 production value excl coal ($ bn)
2014 ranking excl coal
2014 production value (% of world total)
2012 ranking
2010 ranking
1 China 159.0 83.4 2 17.4% 1 1
2 Australia 112.9 90.4 1 12.3% 2 2
3 Russia 88.0 69.9 3 9.6% 4 4
4 US 81.5 36.0 6 8.9% 6 8
5 South Africa 48.9 40.0 5 5.3% 7 7
6 Chile 47.1 46.9 4 5.1% 5 5
7 India 44.0 14.9 11 4.8% 9 6
8 Canada 39.9 35.9 7 4.4% 8 9
9 Brazil 35.8 35.8 8 3.9% 3 3
10 Indonesia 27.3 9.5 13 3.0% 12 11
11 Peru 23.1 23.1 9 2.5% 10 10
12 Mexico 16.7 16.3 10 1.8% 11 13
13 Kazakhstan 13.5 9.5 12 1.5% 13 14
14 Ukraine 11.7 9.0 14 1.3% 14 12
15 Poland 11.3 5.1 22 1.2% na na
16 Germany 9.2 1.2 50 1.0% na na
17 Congo, Dem Rep 9.0 9.0 15 1.0% na na
18 Philippines 8.1 7.7 16 0.9% 19 18
19 Colombia 6.6 2.9 33 0.7% na na
20 Mozambique 6.5 6.1 17 0.7% na na
Total – top 20 800.1 552.6 87.5%
Total – all countries
914.4 666.5 12.5
Source: SNL Mine Economics database 2016
23. These other 13 countries are Suriname, Niger, Ghana, Cuba, Dominican Republic, Myanmar, Zimbabwe, Togo, Djibouti, Senegal, Bhutan, Brazil and Korea Dem Rep.

Role of mining in national economies – third edition 23
3Table 3: Export contribution (metallic and industrial minerals, excluding coal) 1996, 2012 and 2014 as percentage of total exports
Sour
ce: D
ata
used
to c
onst
ruct
the
MC
I bas
ed o
n U
NC
TAD
trad
e da
taba
se
Income classification Country 1996 2012 2014
Change (% points)
1996–2012 1996–20141 Middle income (upper) Botswana 80.90% 91.60% 91.92% 10.70% 11.02%2 Low income Congo, Dem Rep 72.40% 81.50% 78.26% 9.10% 5.86%3 High income French Polynesia 71.00% 64.00% 72.90% –7.00% 1.90%4 Middle income (lower) Zambia 76.10% 69.20% 69.05% –6.90% –7.05%5 Middle income (upper) Mongolia 57.50% 74.60% 64.23% 17.10% 6.73%6 Middle income (lower) Mauritania 35.90% 62.90% 58.82% 27.00% 22.92%7 High income Chile 47.70% 61.60% 56.92% 13.90% 9.22%8 Middle income (upper) Peru 48.30% 60.10% 53.71% 11.80% 5.41%9 Low income Guinea 76.30% 60.10% 53.15% –16.20% –23.15%10 Middle income (lower) Guyana 37.40% 58.50% 51.52% 21.10% 14.12%11 Low income Burkina Faso 8.20% 46.30% 49.65% 38.10% 41.45%12 Middle income (lower) Tajikistan 30.20% 58.50% 48.51% 28.30% 18.31%13 Middle income (upper) Jamaica 49.70% 39.10% 48.14% –10.60% –1.56%14 Middle income (lower) Armenia 24.60% 44.50% 47.30% 19.90% 22.70%15 Low income Mali 8.40% 42.30% 47.12% 33.90% 38.72%16 Low income Sierra Leone 27.80% 50.60% 45.91% 22.80% 18.11%17 Low income Rwanda 2.80% 39.10% 45.18% 36.30% 42.38%18 Low income Central African Republic 56.00% 44.60% 44.75% –11.40% –11.25%19 Low income Liberia 49.30% 24.00% 43.43% –25.30% –5.87%20 High income Australia 24.50% 57.30% 42.33% 32.80% 17.83%21 Low income Mozambique 6.10% 35.90% 41.55% 29.80% 35.45%22 High income Iceland 10.60% 37.70% 39.02% 27.10% 28.42%23 Middle income (lower) Papua New Guinea 24.50% 51.30% 38.71% 26.80% 14.21%24 Middle income (lower) Lesotho 3.50% 44.50% 37.83% 41.00% 34.33%25 High income Aruba 0.30% 1.20% 37.82% 0.90% 37.52%26 Middle income (upper) Namibia 38.00% 53.40% 37.65% 15.40% –0.35%27 High income New Caledonia 42.20% 37.80% 35.70% –4.40% –6.50%28 Low income Eritrea 62.50% 60.50% 35.68% –2.00% –26.82%29 Middle income (lower) Uzbekistan 9.90% 18.60% 35.49% 8.70% 25.59%30 Low income Madagascar 8.00% 17.80% 33.58% 9.80% 25.58%31 Low income Tanzania 4.00% 35.20% 32.91% 31.20% 28.91%32 Middle income (upper) South Africa 29.60% 33.00% 32.50% 3.40% 2.90%33 Middle income (upper) Montenegro na na 32.11% 34 High income Israel 31.90% 29.40% 31.21% –2.50% –0.69%35 Middle income (lower) Lao PDR 1.30% 39.10% 29.64% 37.80% 28.34%36 Middle income (lower) Bolivia 30.10% 29.80% 27.22% –0.30% –2.88%37 High income Switzerland 5.10% 5.80% 26.98% 0.70% 21.88%38 Middle income (upper) Lebanon 10.60% 32.50% 26.15% 21.90% 15.55%39 Middle income (lower) Kyrgyz Republic 6.70% 17.20% 25.62% 10.50% 18.92%40 High income Bahrain 42.70% 29.50% 25.37% –13.20% –17.33%41 Low income Sudan 4.20% 45.80% 25.21% 41.60% 21.01%
Average 13.24% 12.80%

Role of mining in national economies – third edition24
2011, and partly by the increased volume of minerals produced in lower-income environments. As was noted in Section 2, in recent years huge investments have been made in Latin America, Africa and parts of Asia, driven by factors including the depletion of easily accessible mineral deposits in Europe and the US and technological advances that have made feasible the mining of previously inaccessible deposits in remote less-developed regions.
Although there has been some inevitable arithmetic effect on export dependency ratios caused by the more recent decline in mineral prices, this has not reversed the longer-term tendencies shown by Table 3. This is evident from the final two columns of Table 3. Although the increases in dependency levels for the 41 mineral exporting countries were generally a bit larger in the period of rising prices (1996 through 2012), these increases still remained large in the longer period (1996 through 2014), by which time prices had trended downwards.
This reinforces the results from a recent paper that examined the dependence of low- and middle-income countries on both mineral and oil and gas exports. That paper showed that the commodity price collapse did indeed disrupt the previously strong upward tendencies. However, that disruption has not been general across all countries and many of the most extractives-dependent low- and middle-income countries saw their levels of
dependence actually increase further between 2011 and 2014.24
Successive editions of Romine had emphasised the fact of high and increasing dependence of many low- and middle-income countries on the mining sector. This fact alone should be sufficient reason for the policies towards such countries – whether of host governments, donor agencies or non-governmental organisations (NGOs) – to devote more attention to interventions that can potentially enhance the beneficial impacts that well-run mining operations can undoubtedly bring in their train.
There are by now a whole host of positive examples of regulatory arrangements and partnerships between key players in the sector that demonstrate how this general point can and indeed has become manifest in many real-world situations. The point is further strengthened by the fact that many of the more dependent countries also have large oil and gas resources, which pose similar management challenges to those of mining.
There was a brief discussion of these matters in previous editions of Romine (especially Section 5 of the second edition)25 that also recognised the different economic, political and environmental contexts of different countries and how these contexts shape the extent to which the impulse from mining might be captured (or not) in the local economy.
24. Roe, A and Dodd, S (2016). The statistical tendencies. Paper for UNU-WIDER Conference on Extractive Industries and Development. Helsinki, April 2016.
25. That section examined the various routes through which mining can be and has been a catalyst for broader economic and social development in some countries, and offered some specific examples.
3.4
Deconstructing the MCI
Finally, Table 4 illustrates how the top 25 countries rank in relation to the four individual components of the MCI. As outlined in the MCI supplement, Mauritania has the highest score of the 183 countries on the new mineral rents indicator. Botswana ranks highest on the sector’s contribution to exports, Liberia ranks highest on the change in that variable since 2009 and Sierra Leone leads on production value as a percentage of GDP. Table 4 demonstrates that:
There is a moderate connection between the size of a country’s existing export contribution and the change in that contribution since 2009. Nine countries rank in the top 25 for these components of the MCI. This helps to explain why the overall index shows shifts between countries over time.
• There is a slightly higher overlap between export contribution and production value as a percentage of GDP, with 11 countries ranked in the top 25 for both components of the MCI.
• There is only a limited degree of overlap between export contribution and the new indicator on mineral rents – with just 8 countries ranked in the top 25 for these components of the MCI. This illustrates why the overall index is likely to be modified by the introduction of this new indicator.
A revised Mining Contribution Index (MCI) continued

Role of mining in national economies – third edition 25
Table 4: Level of overlap/correlation between component parts of the MCI
Source: SNL Mine Economics database 2016
3Country
Ranked in the top 25 for these index components
Export valueChange in export value Production value Mineral rents
1 Congo, Dem Rep Yes Yes Yes Yes
2 Mauritania Yes Yes Yes Yes
3 Burkina Faso Yes Yes Yes Yes
4 Madagascar Yes Yes Yes
5 Botswana Yes Yes Yes
6 Guyana Yes Yes Yes
7 Uzbekistan Yes Yes
8 Liberia Yes Yes Yes
9 Kyrgyz Republic Yes Yes Yes
10 Tajikistan Yes Yes
11 Australia Yes Yes Yes
12 Mozambique Yes Yes Yes
13 Jamaica Yes Yes
14 Ghana Yes Yes
15 Sierra Leone Yes Yes
16 Dominican Republic Yes
17 Senegal Yes
18 Ukraine Yes Yes
19 Rwanda Yes Yes
20 Mongolia Yes Yes Yes
21 Armenia Yes Yes
22 Sudan
23 Nicaragua
24 Chile Yes Yes Yes
25 Myanmar Yes
Each component indicator of the MCI constitutes a (different) pointer to the significance of mining activities in a country, and it can be useful to consider them separately as well as weighted together.
As the opening paragraphs of this section highlighted, while the MCI
provides insight into the importance of mining in the economic life of a given country, it does not indicate whether this ultimately translates into broader-based economic and social benefits. In the final section of the report (Section 4), we consider three further dimensions of ‘contribution’ that we cannot for
the moment measure consistently across all mining economies but which nonetheless have a significant bearing on the extent to which mining supports broader-based economic and social progress. These three further dimensions are mineral taxation, employment and governance.

Role of mining in national economies – third edition26
80+ 60+ 40+ 20+ 0+Above 80 Above 60,
less than 80Above 40, less than 60
Above 20, less than 40
Zero to 20Two or less data points available
A revised Mining Contribution Index (MCI) continued

The role of mining in national economies 27
80+ 60+ 40+ 20+ 0+Above 80 Above 60,
less than 80Above 40, less than 60
Above 20, less than 40
Zero to 20Two or less data points available
3

Role of mining in national economies – third edition28

4Selected topics
that significantlyinfluence mining’s
contribution
Role of mining in national economies – third edition 29

Role of mining in national economies – third edition30
Selected topics that significantly influence mining’s contribution While the MCI is a useful starting point for understanding the mining sector’s contributions to a country’s economy, it does not capture some other highly significant contributions – notably to government revenue and to employment. It is also unable to capture some of the more qualitative aspects of mining sector contributions, such as the nature and quality of jobs the sector generates or the governance of the sector, which influences the size and nature of its contributions.
This section attempts to fill these gaps, expanding on the earlier analysis of global context in Section 2 and the findings of the MCI to outline the available evidence from various countries on the contributions that mining makes to government revenue, employment and the quality of governance. Box 1 recaps organising frameworks outlined
in previous ICMM publications, providing an overview of the how, what, when and how much of mining sector contributions. Section 4.1 discusses the evidence on mining’s contributions to government revenues, Section 4.2 outlines contributions to employment and Section 4.3 discusses how governance influences both.
How – from natural resources to socioeconomic development
Metals or mineral deposits are a national asset – something of value that belongs to the entire nation. How can these deposits be transformed into outcomes that nations value (such as higher living standards, human development and economic growth)? Figure 10 provides a simplified schematic.
Subsoil assets (metals or minerals in the ground such as copper or gold) need to be discovered, brought above the ground and monetised, that is, turned into economic value. The portion of the resulting revenue that accrues to government can be used to finance public spending on, for example,
physical capital (infrastructure such as roads or bridges), human capital (through education, cash transfers or public health investments) or intangible capital (such as institutional development), which can lead to future socioeconomic development and growth (Dietsche et al, 2013).
Box 1: Organising frameworks – how, what, when and how much?
DiscoveryFinding the sub-soil asset
SpendingInvestment in physical and human capital
RevenueMonetising the asset
ProductionBringing it above ground
Human developmentRealising benefits in higher standards of living
$$
Figure 10: Asset transformation – from subsoil assets to development

Role of mining in national economies – third edition 31
4What – allocation of revenue shares
When minerals or metals are monetised, the revenue is shared between four main stakeholders: suppliers (who are paid for their inputs), employees (who are paid their wages), government (which receives its share through royalties and taxes and sometimes profit share) and investors (who receive profits – typically a residual after the other payments have been made).
Figure 11 indicates the typical shares received by each group. Most of the revenue a project generates (50–65 per cent) typically goes towards operating and capital expenditures (simplified here as suppliers), 10–20 per cent goes to employees, 15–20 per cent goes to government and 15–20 per cent goes to investors.
In terms of socioeconomic development, the shares received
by government, employees and suppliers are the most important. The share allocated to government represents the contribution mining makes to total government revenue, discussed in Section 4.1. The employees’ share represents direct employment generated by a mining project, while the suppliers’ share represents potential indirect employment, depending on how much of the supplies (both goods and services) come from local firms. Together these represent the contribution of mining to employment in an economy, discussed in Section 4.2.26
How large each of these shares are and how much they are able to contribute to socioeconomic development over the long term are determined in part by the quality of governance in a country. This is discussed in Section 4.3.
Operating expenditures & capital expenditures
Company salaries & wages(direct emploment)
Taxes & payments to governments(government revenues)
Company community spending
Profits for shareholders
10–20%
Potential indirect employment
0.5–1%
50–65%
15–20%
15–2
0%
26. There is, in addition, a third contribution to employment – namely the jobs created in local businesses as the employees of both the mining activity and their suppliers spend their wages and salaries.
‘In terms of socioeconomic development, the shares received by government, employees and suppliers are the most important’
Figure 11: Revenue allocation to different stakeholders for a typical mine

Role of mining in national economies – third edition32
When – the mining life cycle
Figure 12 provides a simplified representation of the life cycle of a mine. It shows five phases, with typical timelines: exploration (1–10 years), site design and construction (1–5 years), operation (2–100 years), final closure and decommissioning (1–5 years) and post-closure (10 years to perpetuity). It also shows how the size of government revenue and employment contributions vary over the course of a project.
In terms of government revenues (shown by the black line in the figure), a mining project typically
generates only a small amount of revenue during the first two phases of the life cycle (exploration and construction) and during the initial part of the operations phase. Revenues then rise sharply around seven to eight years into the phase of full operation, when projects become profitable and profit-based taxes kick in. Depending on the amount of resources available, revenues typically peak 10–20 years after this and then start to decline as both production and profitability fall.27
In terms of direct employment (shown by the coloured area) the contributions are typically largest during the short-lived site design and construction phase (phase 2) and then level off to a smaller total during the longer-lasting operations phase, although ongoing sustaining investments can keep this higher for longer. However, this does not include potential indirect employment, which is likely to increase over time as supplier capacity is built in a country.
27. This assumes a mine life of some 20–30 years. But in some operations the lifespan can be much longer than this and the period of profitability can also be extended.
Selected topics that significantly influence mining’s contribution continued
54321
Labo
ur/a
ctiv
ity le
vel
Leve
l of g
over
nmen
t rev
enue
s
Low
High
Low
High
Time
3 5431 2
Stylised profile of government revenue contributions (right hand axis)
Exploration1–10 years or more
Site design and construction 1–5 years
Operation 2–100 years
Final closure and decommissioning 1–5 years
Post-closure A decade to perpetuity
Figure 12: Mining life cycle – revenue and employment contributions

Role of mining in national economies – third edition 33
4How much – the inverted pyramid of macroeconomic contributions from mining
Past research carried out by ICMM based on a series of in-depth country case studies has found that the macroeconomic contributions made by the mining
sector form an inverted pyramid, as illustrated in Figure 13: in low- and middle-income countries, mining often makes up the majority of foreign direct investment (FDI)
and progressively decreasing proportions of exports, government revenue, national income and employment.
60–90%of totalFDI
30–60%of totalexports
3–25% of governmentrevenues
3–10% of totalnationalincome
NATIONAL INCOME (GDP AND GNI)Modern-day mineral processing technology is
sophisticated and highly capital intensive;locations are centralised as a result and
most upstream value addition takes place outside the mine-host country
EMPLOYMENT Mine employment on its
own is usually smallrelative to the total
national labour force
1–2% of totalemployment
EXPORTSMineral exports can rapidly rise to be a major share of total exports in low-income agrarian economies even when starting from a low base
GOVERNMENT REVENUEMineral taxation has become a very significant source oftotal tax revenues in many low-income economies with
limited tax-raising capacity
FOREIGN DIRECT INVESTMENT (FDI)Mining FDI often dominates the total flow of FDI in low-income economies that have only
limited other attractions for international capital
Source: ICMM (2014)
Figure 13: Macro-level contributions in low- and middle-income countries

Role of mining in national economies – third edition34
4.1
Mineral taxation – what contribution does mining make to government revenue?
4.1.1 Why is this an important contribution?
As outlined in Figure 10 in Box 1, a key part of transforming minerals and metals into socioeconomic development involves using the revenues generated from the sector for public spending and investment. Revenues from mining can be particularly important in low-income countries that have minimal other formal economic activity and, hence, limited capacity to raise taxes. While this revenue can be spent on urgent current needs, it can also enable governments to invest in physical and human capital. If managed appropriately, these investments can generate future revenues and
contribute significantly to sustained economic growth.28
The contribution of mining to government expenditures is typically far larger than the direct government revenue that mining generates through corporate taxes and royalties levied on mining companies, although it is this that commands most public attention. Governments will also receive indirect taxation revenues from economic activity stimulated by the sector, including additional corporate and income tax revenues from new jobs created in the supply chain and induced through employee spending (see Section 4.2).
4.1.2 How much does mining contribute to government revenues?
Case studies carried out through the application of the Mining: Partnerships for Development (MPD) Toolkit have found that
the contribution of mining varies significantly, from 3 to 25 per cent of total government revenues.
A number of factors influence the size of the contribution that any mining project makes to government revenues in any given year, including the size of the project, the size of the economy, the stage of the mining life cycle and the commodity price. Fluctuations in metal and mineral prices influence the profitability of the sector and the level of production, both of which influence the level of revenue paid to government.
It is still the case that, as noted in the previous Romine edition, there is no standardised database available to help assess the size of the mining sector’s tax contributions for most of the countries included in the MCI. The International Monetary Fund (IMF) has recently started to put together figures for a subset of countries;
28. See also https://www.icmm.com/en-gb/society-and-the-economy/economic-development/revenue-management.
29. Selected countries, in percent of total revenue excluding grants.
Selected topics that significantly influence mining’s contribution continued
Colombia
Zambia
Chile
Mongolia
Mauritania
Guniea
Vietnam
Papua New
Guinea
Indonesia
Mozam
bique
Ghana
Peru
Liberia
Canada
Lesotho
Brazil
South Africa
Australia
Tanzania
Sierra Leone
Kyrgyz Republic
Bolivia
DR
C
Botsw
anaMining and petroleum Mining Percent of GDP (right hand side)
0
10
20
30
40
50 45
2826 25 25
23 23 2218
15 1411 11 10
7 64 4 3 3 2 2 2 1
0
10
20
30
40
50
Perc
ent o
f tot
al re
venu
e
Perc
ent o
f GD
P
Figure 14: Government receipts from natural resources (averages 2000–201329)
Source: IMF (2016)

Role of mining in national economies – third edition 35
4unfortunately, where a country has both mining and petroleum resources, taxation contributions to government have been combined into one figure. This results in revenue figures being available for just 12 mining-only countries,30 with a combined figure for a further 12 countries31 that have both mining and petroleum resources. Figure 14 shows the average contributions between 2000 and 2013 as a percentage of total government revenues and (the black diamonds, calibrated against the right axis) as a percentage of GDP.
Botswana has by far the highest contribution among the mining countries, accounting for 45 per cent of government revenue – more even than the 12 countries with both mining and petroleum resources. The other mining countries cluster between 1 and 7 per cent (Ghana, Kyrgyz Republic, Sierra Leone, Tanzania, South Africa, Lesotho and Canada) or between 14 and 23 per cent (Guinea, Mongolia, Chile and Zambia).
These averages do not show year-on-year variations (which can be wide), related to the maturity of the industry and commodity prices.
Figure 15, which focuses on the mining-only countries, shows that – for example – in Mongolia, Chile and Zambia, mining contributions constituted only around 2–4 per cent of total government revenues in some years, but over 30 per cent in other years. In Botswana, the contribution has varied between around 30 per cent and up to 60 per cent – that is, in some years mining contributed a majority of Botswana’s government revenue. This inherent year-to-year instability in revenues naturally constitutes a major fiscal
30. Bolivia, Papua New Guinea, Vietnam, Mauritania, Indonesia, Colombia, Peru, DRC, Liberia, Mozambique, Australia and Brazil.
31. Botswana, Mongolia, Chile, Guinea, Zambia, Kyrgyz Republic, Lesotho, Ghana, South Africa, Sierra Leone, Tanzania and Canada.
0
10
20
30
40
50
60
Canada
Lesotho
South Africa
Tanzania
Sierra Leone
Kyrgyz Republic
Ghana
Zambia
Chile
Mongolia
Guinea
Botsw
ana
1
45
23
1815 14
74 4 3 2 2
Perc
ent o
f tot
al re
venu
e
Figure 15: Government receipts from mining (average, min and max 2000–2013)
Source: IMF (2016)
Botswana
Guinea
0%
10%
20%
30%
40%
50%
60%
2000 2001 2002 2003 2004 2005 2006 2007 2008 2009 2010 2011 2012 2013 2014
Mongolia
Chile
Zambia
Ghana
Sierra Leone
Tanzania
Figure 16: Government receipts from mining (2000–2014)
Source: IMF (2016)

Role of mining in national economies – third edition36
management challenge for the countries concerned.
Figure 16 shows the differing trends over time in eight of these countries. For example, Botswana experienced a sustained reduction, with the sector’s contribution steadily halving over 10 years – from around 60 per cent in 2000 to 30 per cent in 2010. By contrast, Ghana has seen a steady and sustained increase, from 2 per cent in 2000 to 18 per cent in 2014. Some countries have seen a large amount of volatility: in Zambia, mining contributed just 1.4 per cent of government revenues in 2006, rising to 32.5 per cent in 2011, and back down to around 14 per cent in 2013. Other countries also experienced peaks either just before the financial crisis (Chile and Mongolia peaking around 2006–7) or before the recent fall in prices (Sierra Leone and Tanzania mirroring Zambia’s peak in 2011).
Other, partial information is available from various sources on the contribution that mining makes to government revenues. While this is not collected on a consistent or comparable basis, it seems to confirm the findings from the IMF database. The reports on past MPD Toolkit applications in countries not on the IMF list have found mining sector contributions of 12 per cent of government revenues in Lao PDR, 5 per cent in Peru and 2 per cent in Brazil, at varying dates. The Extractive Industries Transparency Initiative (EITI) has found average revenue contributions over 2008–13 of around 15 per cent for Peru, 12 per cent for Burkina Faso, 11 per cent for Cote d’Ivoire and 5 per cent for Togo. Interestingly, EITI’s figures are consistently higher than the IMF’s for
Selected topics that significantly influence mining’s contribution continued
53%
15%11% 9%
18%
10%7% 6%0%
10%
20%
30%
40%
50%
60%
Mongolia Peru Ghana Mozambique
EITI IMF
Figure 17: EITI and IMF figures for average mineral sector contributions to government revenue (2008–13)
Sources: IMF (2016) and EITI reports
the four countries included in both datasets (see Figure 17). It is possible that the IMF figures underestimate the total contribution that the mining sector makes to government revenue by missing some additional taxes paid at the local level or through employee income tax.
An expanded dataset from the IMF, preferably separating mining from petroleum contributions, will in time provide for a more precise assessment of the direct contributions that the mining sector makes to government revenues in more of the countries included in the MCI.
For now, based on only partial information, three points are clear:
• There is a large degree of variation in revenue contributions across countries.
• There is a large degree of variation within countries over time, which seems to be a function of both the life cycle stage of some large projects in the smaller economies and commodity price movements.
• With some outliers, contributions to government revenues in low- and middle-income countries tend to sit in the region of 2 per cent to 20 per cent. For context, governments tend to spend around 10 per cent of their expenditure on health – so, in many countries, contributions from the mining sector will roughly cover the entire health budget.
These figures consider only the direct contribution made by the mining sector to government revenues, primarily through royalties and corporate taxes. They do not capture additional contributions in the form of income taxes paid by mine employees, or income or corporate

Role of mining in national economies – third edition 37
4Figure 18 compares MCI data from Section 3 to the fiscal contributions from the mining sector. As with the previous Romine publication, there is some correlation between the MCI score and the total contribution to government revenue but this is fairly low.
For example, South Africa (72, ranking 30th) and Guinea (72, ranking 31st) have the same MCI scores but have dramatically different levels of mining sector contributions to government revenue: 2 per cent on average for the period 2000–2013 in South Africa, and over 23 per cent for Guinea. Chile, ranking 24th in the
MCI, receives a higher percentage of revenue contributions from mining (15 per cent) than several countries ranked above it (eg Kyrgyz Republic and Ghana, ranked 9th and 14th respectively).
The relationship between the MCI and fiscal contributions from the sector is not straightforward. As outlined in Section 4.2.1, government revenue contributions within a country vary dramatically across years. By contrast, changes in exports and production experience smaller year-on-year fluctuations. The life cycle phase of mining has an important impact on government revenue
contributions. If a large mining project is relatively new, several of the underlying components of the MCI (the production and export figures) may be large while government revenue contributions are still low. Both of these factors reduce correlation between MCI scores and government revenue contributions.
If and when this important contribution is included in the MCI, the scores and rankings may change for several countries – but this will not be possible until additional data is available for more countries on a consistent and comparable basis.
Figure 18: Comparison of MCI rank, MCI score and mining sector contribution to government revenue
Box 2: MCI rankings and government revenue contributions
32. Total tax paid globally by Rio Tinto in 2014 was just under $9 billion. Employee income tax made up $1.8 billion of this.
0%
Country (MCI rank)
10% 20% 30% 40% 50%
40
60
50
80
70
100
90 Botswana (5)
Guinea (31)
Mongolia (21)Chile (24)
Zambia (28)
Ghana (14)
Tanzania (43)
Sierra Leone (15)
Lesotho (67)
South Africa (30)
Canada (45)
Kyrgyz republic (9)
% contribution to government revenue
MC
I sco
re
taxes generated through supply chains or induced employment (see Section 4.2), which could be at
least as important. For example, 20 per cent of all of Rio Tinto’s tax payments32 in 2014 were in the
form of employee income tax – a substantial amount of $1.8 billion (Rio Tinto, 2014).

Role of mining in national economies – third edition38
4.1.3 Emerging evidence of fiscal problems
As outlined in Section 2, the downward trend in commodity prices began in 2011 and was well established by 2012.
Figure 19 shows IMF data for fiscal contributions from the mining sector for 2011–14 for countries where this is available (Ghana, Mongolia, Chile, Zambia, Sierra Leone, Tanzania, South Africa and Canada). With the exception of Ghana, all these countries show a downward trend that is clear and sometimes sharp: in Zambia, from 32 per cent in 2011 to 14 per cent in 2013; in Mongolia, from 24 per cent to 15 per cent; in Chile, from 17 per cent to 9 per cent; and in Sierra Leone from 14 per cent to 8 per cent.
While the data is limited, it clearly indicates that the drop in commodity prices is already having a serious negative impact on a number of governments that have historically relied on the mining sector for a significant share of their revenue. Some countries are to some extent insulated from these drops in revenue as a result of having established sound macroeconomic management practices and institutional mechanisms to allow for the smoothing of revenue over time. Many low- and middle-income countries, however, are not. Even for high-income countries, the impacts can be significant.33 This is already leading to painful fiscal adjustments through some combination of reduced government spending, increased taxation, increased debt financing or (as with Ghana) recourse to new IMF programmes (NRGI, 2015).
Selected topics that significantly influence mining’s contribution continued
Mongolia
Chile
Zambia
Ghana
Sierra Leone
Tanzania
South Africa
Canada
0%
5%
10%
15%
20%
25%
30%
35%
2011 2012 2013 2014
Figure 19: Fiscal contributions since the commodity price crash
Source: IMF (2016)
The impacts are likely to prove deeper than these figures suggest, as the commodity price decline continued after 2013–14 – the last years for which data is available – and it is likely to lead to a reduction in production, as new mining developments are delayed or cancelled and existing, higher-cost operations are shut down. If a government has already committed to spending anticipated revenues that do not now materialise, then necessary fiscal adjustments (such as increased debt financing) are likely to further reduce the budget available for future spending. The experience of the recent metal price collapse has brought into renewed focus the instabilities associated with mining’s contribution to government revenue, and the need for governments to be well organised to manage their way through such periods.
4.1.4 Implications of government revenue contribution findings
Mining clearly contributes a significant share of government revenue in low- and middle-income countries. The direct contributions alone are large – typically ranging anywhere from 2 to 20 per cent of total government revenue. Additional indirect contributions further increase the total contributions of the sector. However, these contributions fluctuate dramatically across years. This presents a serious revenue management challenge for governments. Given the size of total revenue contributions, periods of sustained reductions in commodity prices – such as that currently being experienced – have serious consequences for low- and middle-income countries. Low commodity prices have already
33. In the case of Australia, for example, mining revenues grew from around A$5 billion in 2000/01 to A$25 billion in 2008/9 before falling to around A$15 billion in 2009/10.

Role of mining in national economies – third edition 39
4reduced government revenue in a number of countries. Sustained low prices could have serious long-term consequences – reduced spending, increased debt financing and increased taxation of other sectors of the economy.
4.2
Employment – how much employment does mining create?
4.2.1 Why is this an important contribution?
The mining sector’s ability to generate jobs receives as much attention as its contributions to government revenue. Employment is a priority for communities living close to mine sites, particularly in remote areas where alternative opportunities are limited. Employment is also a priority for national governments: it reduces poverty, boosts living standards, raises productivity and allows individuals to invest in themselves and their families – improving health, education and future economic prospects. Expanding formal economy jobs is particularly important in low- and middle-income countries where unemployment is high and most work opportunities are in the insecure informal economy.
The mining sector generates employment directly by hiring people to work on mining projects (including long-term contractors) and indirectly through the supply chain (see Box 3). With today’s highly capital-intensive mining technologies, the number of direct jobs is often limited. However, the employment contributions of the sector extend well beyond these two areas. Additional employment is
generated through the spending of incomes received by individuals who are directly or indirectly employed by the sector. The overall employment effect, even over the short and medium term, is typically much larger than the direct employment figures suggest.
As with government revenue, there is also a qualitative component and a longer-term dynamic to the employment contributions made by the sector. In the short term, the jobs generated are typically much better paid than alternatives in the same geographical area. Over the longer term, local suppliers build increased capacity to service the industry (sometimes directly supported by mining companies) and mining companies train employees. These contributions not only expand indirect employment, they also build skills that are transferable to
other industries, supporting future growth and employment. And, as more employment is generated, so too is additional government revenue through income and corporate taxes.
4.2.2 How much does mining contribute to employment?34
Earlier research carried out by ICMM has found that the employment contributions of the industry are smaller than other macroeconomic contributions (see inverted pyramid in Figure 13). The mining sector typically contributes only around 1 to 2 per cent of total employment in a country. This is typical of capital-intensive industries. However, these figures take into account only direct employment. The contributions of indirect employment, and particularly induced employment (see Box 3 for an explanation of these terms), are generally many times larger.
34. Note that this only includes large-scale mining. Artisanal and small-scale mining (ASM) is not included in the analysis as reliable estimates for employment in ASM do not exist. ASM contributes to many more jobs but the benefits are hampered by low wages, dangerous work conditions and environmental hazards.
Box 3: Direct, indirect and induced employment
Direct employment – individuals employed by the company that owns and operates the extraction site. This sometimes includes contractors’ staff if their regular workplace is on-site. An example would be an engineer employed on a mine site.
Indirect employment – individuals employed by companies that supply goods or services to the mining company or that use its services, that is, employment through the supply chain. It can also include employment generated through social investment activities such as local business development. An example would be a mechanic supplying services to a mine as a contractor.
Induced employment – additional employment generated as a result of the spending activities of those employed directly or indirectly by the industry. This includes things such as employees spending their wages in shops or on accommodation or transport. An example would include someone who has opened a shop in a mining region to sell groceries.
Source: Cordes et al (2016)

Role of mining in national economies – third edition40
Many factors influence the contribution that mining can make to employment in a particular country (see Box 4 for details). These include general industry characteristics (eg the life cycle phase of a mine, prevailing commodity prices), national characteristics (eg the enabling environment for businesses
Selected topics that significantly influence mining’s contribution continued
these variations, some consistent patterns can be seen in employment contributions from the sector.
Direct employment
Generating national figures on mining sector employment that are comparable across many countries is currently very difficult. It is particularly difficult to accurately measure the total amount of induced employment that the industry generates – but even measuring direct and indirect contributions can be difficult given the available data. National statistics can provide an estimate of total employment in the mining sector. However, the sector classification of workers (‘mining and quarrying’) is problematic. In many countries the national statistics include quarry workers who are not employed in the mining sector, and excludes workers who are employed in the mining sector but are captured in other categories (eg construction or services). The figures may also include artisanal and small-scale mining in some countries and not in others. So these figures need to be treated only as a very rough estimate.
In terms of direct employment, the best information currently available is that produced by the International Labour Organization (ILO) through its database. The database includes data collected through labour force surveys by national statistics agencies in individual countries, albeit with the aforementioned limitations. Also, data is available only for some countries and for some years: Ilostat (ILO’s central statistics database) figures for mining employment and total employment are available for 23 of the 50 highest-ranking countries on the MCI (see Table 5).
• Type of mine ownership – publicly owned mining companies generate more direct and less indirect employment; private companies generate less direct employment but more indirect employment.
• Size and life of a mine – larger mines with longer operating periods generate more employment.
• Life cycle phase – construction phases generate more direct employment and more unskilled employment; operational phases generate less direct employment and less unskilled employment but increasing indirect employment over time.
• Type of mining operation – underground mines generate more employment than open pit mines, relative to production value and volume. Underground staff tend to have higher skills and therefore higher wages, which increases induced impacts.
• Type of commodity – different commodities generate varying levels of employment. Uranium mines tend to have the largest employment impacts, and gold and potash mines the smallest.
• Mineral grade – in general the lower the mineral grade, the higher the employment impact.
• Level of existing infrastructure – if infrastructure needs to be developed in a region, more employment will be generated through its construction. This may generate further employment benefits if the new infrastructure allows for additional trading opportunities for the local population.
• Skills levels in local and national economy – the higher the skills levels and more relevant the skills in the local economy, the higher the employment impact.
• Level of development and diversification of local and national economy – the more diversified an economy is, the higher the employment effects.
• Enabling business environment – an enabling business environment generates higher indirect employment over the long term.
• Technical assistance programmes – implementation of supplier development or technical assistance programmes can speed up capacity building of local suppliers and increase indirect employment.
Source: Cordes et al (2016) and McMahon and Moreira (2014)
Box 4: Factors influencing job creation potential in the mining industry
generally, and skills levels in a country), mine-specific factors (the type and grade of a mineral deposit) and any efforts made by mines – sometimes working in collaboration with other stakeholders – to enhance indirect employment (eg through local sourcing and supplier development programmes). Despite

Role of mining in national economies – third edition 41
4Country Year
Mining employment
Total Employment
Mining employment as % of total employment
Peru 2013 198,000 4,598,800 4.3%
Mongolia 2014 40,900 1,110,700 3.7%
Kazakhstan 2013 249,300 8,570,600 2.9%
South Africa 2014 428,000 15,317,000 2.8%
Ukraine 2015 399,100 16,443,200 2.4%
Namibia 2013 13,600 685,700 2.0%
Bolivia 2014 100,300 5,082,000 2.0%
Zambia 2012 90,000 5,386,100 1.7%
Liberia 2010 17,000 1,091,000 1.6%
Zimbabwe 2014 92,300 6,265,900 1.5%
Madagascar 2012 126,800 10,441,900 1.2%
Ghana 2010 112,700 10,243,500 1.1%
Senegal 2011 41,200 3,777,900 1.1%
Guinea 2012 53,300 4,982,500 1.1%
Bulgaria 2015 25,700 3,031,900 0.8%
Iran 2014 159,500 21,304,300 0.7%
Armenia 2015 8,000 1,072,600 0.7%
Philippines 2015 234,500 38,740,800 0.6%
Turkey 2015 118,800 26,618,500 0.4%
Rwanda 2012 18,200 4,152,700 0.4%
Kyrgyzstan 2014 9,200 2,302,700 0.4%
Guatemala 2015 8,600 6,325,800 0.1%
Suriname 2013 6,500 37,917,000 0.0%
Table 5: ILO data on mining employment and total employment
Source: Ilostat
Figure 20 illustrates the percentage contribution that mining makes to total employment. This ranges from 4.3 per cent in Peru to a negligible amount in Suriname; most countries sit between 0.5 and 3 per cent with slightly higher mining sector contributions to employment in Peru (4.3 per cent) and Mongolia (3.7 per cent).
Alternative sources for estimating mining sector contributions to employment include information directly collected from mines. While these figures are more accurate, they too suffer from problems with consistency and comparability across mines and countries. Direct and indirect employees are classified differently by different companies. Even if two mines generate exactly the same amount of direct and indirect employment in total, one mine may look as if it generates much higher levels of employment and smaller multiplier effects, while another may look as if its direct employment impact is small and multipliers are large. Any comparisons made across studies carried out where employment data has been directly collected from mines needs to be sensitive to these differences.

Role of mining in national economies – third edition42
Selected topics that significantly influence mining’s contribution continued
ICMM has collected a large amount of case study data on employment through the MPD Toolkit applications. These case studies have found that the sector’s direct employment contributions are generally in the region of 1–2 per cent of total national employment, which conforms to the Ilostat findings. The most recent case studies have found direct employment in the mining sector contributing just under 1 per cent to total employment in Brazil (2009), 1 per cent in Lao PDR (2009), 1.7 per cent in Zambia (2012) and 1.1 per cent in Ghana (2013). Importantly, the findings also indicate that the jobs generated directly by the sector tend to be better paid than alternative jobs available in these countries. For example, an MPD Toolkit application in Chile found that average incomes in mining were double that of other
economic activities (ICMM, 2007). The majority of these jobs go to national employees rather than expatriates.
Indirect and induced employment – evidence on multipliers
While these figures are useful in order to understand the magnitude of mining’s direct employment contributions, they do not provide any indication of indirect and induced employment impacts (or the ‘multiplier effects’), which in many cases are much larger. Figure 11 illustrates why this is true for indirect employment: the share of total project revenue paid to employees ranges from 10–20 per cent, whereas the proportion typically paid to suppliers is around 50–65
4.5%
4.0%
3.5%
3.0%
2.5%
2.0%
1.5%
1.0%
0.5%
0.0% Madagascar
Zimbabw
e
Liberia
Zambia
Bolivia
Nam
ibia
Ukraine
South Africa
Kazakhstan
Bulgaria
Guinea
Senegal
Ghana
Suriname
Guatam
ala
Kyrgyzstan
Rw
anda
Turkey
Philipines
Armenia
Iran
Mongolia
Peru
Figure 20: Mining sector direct employment as a percentage of total employment
Source: Ilostat
per cent. This will generate indirect employment if the goods and services supplied are provided locally, which depends on the local economy’s level of development and diversification – although even in very underdeveloped economies, many services will be locally procured. An MPD case study demonstrated this in Zambia: though most manufactured goods were imported, almost 100 per cent of services were locally procured. Public–private partnerships can expand indirect employment contributions by enhancing the capacity of local suppliers (see Box 5).
Evidence suggests that induced employment (as defined in Box 3) is likely to be larger than both direct and indirect employment combined. This component is the most difficult

Role of mining in national economies – third edition 43
4
Potential direct employment contribution Potential indirect & induced
employment contribution
12.5%2.5%
Figure 21: Potential direct, indirect and induced employment contributions to total employment
to measure, since it arises as the result of many diffused spending decisions by many different people – some in the informal economy – and so it can be difficult to identify and link to mining. However, it can make a significant contribution to local incomes and create a potential base for diversified development.
Various studies35 have attempted to estimate the multiplier effects of mining sector employment – the total number of additional indirect and induced jobs generated for every direct job created. These multipliers are highly context specific and reliant on the assumptions used in models that estimate them.36 They vary dramatically across industries, within industries across countries, and even within an industry in one country; they can vary depending on the region being assessed, the type of mining activity and individual firms’ characteristics. Multipliers can even change for a specific case study if the base year used for estimates is changed (IFC, 2013). They therefore need to be treated with caution and seen as indicative rather than precise. Nevertheless, they can still be an informative reference point for estimating total employment effects.
Most studies find that multipliers are spread over a range between two and five.37 Depending on the context, the mining sector therefore contributes anywhere from two to five additional jobs for every direct job created. If mining typically contributes 1–2.5 per cent of an economy’s total jobs through direct employment, this means that its total contribution could range from 3 to 15 per cent (see Figure 21).
35. For examples see studies listed in IFC (2013), World Bank and IFC (2002) and McMahon and Moreira (2014).
36. Multipliers are generally estimated using econometric techniques – input-output or computable general equilibrium models.
37. Much larger multipliers have been found in Ghana (around 20 indirect and induced jobs per direct job). This report focuses on the more conservative estimates found in other countries.
Chile has successfully built supplier capacity and maximised the employment contributions of mining in Antofagasta (Region II) through a series of public–private programmes that began in the early 1990s and continue today. Mining companies (including two ICMM member companies – BHP Billiton and Codelco) and governments have worked together on initiatives to support the growth of small and medium enterprises: financing, training, support in gaining ISO certification, and promoting suppliers associations. In the early 1990s most goods and services for Chile’s mining sector were imported. Now Chilean companies supply goods and services not only in Chile but also to the rest of the region, and the Ministry of Mining aims to establish local firms as world-class suppliers.
Sources: ICMM (2007) and McMahon and Moreira (2014)
Box 5: Enhancing indirect employment contributions through supplier development programmes in Chile

Role of mining in national economies – third edition44
Selected topics that significantly influence mining’s contribution continued
Figure 22 compares the MCI data to the employment contributions from the mining sector. Consistent with the findings from the previous Romine publication and the findings on mineral fiscal contribution, the degree of correlation is low. For example, South Africa is ranked only 30th on the MCI but mining contributes 2.8 per cent of total employment; by contrast, Madagascar is ranked as far more mineral dependent, 4th on the MCI, but mining contributes only around 1.2 per cent of total employment.
The relationship between the MCI and employment contributions is complicated. As outlined in Box 4, many factors influence the job creation potential of mining. These factors differ across countries and therefore influence employment contributions. However, the underlying surveys informing Ilostat figures use different methodologies and do not necessarily produce comparable figures. It is unsurprising that the degree of correlation between MCI figures and employment contributions are low. Low correlation is partly due to genuine differences in employment contributions, but a larger part is due to methodological differences. This complicates any analysis of employment contributions and MCI scores.
Figure 22: Comparison of MCI rank, MCI score and contribution to direct employment
Country MCI rank MCI score% contribution to employment
Mongolia 20 78 3.7%
South Africa 30 72 2.8%
Ukraine 18 81 2.4%
Bolivia 33 71 2.0%
Zambia 27 74 1.7%
Liberia 8 89 1.6%
Madagascar 4 92 1.2%
Ghana 14 83 1.1%
Senegal 17 82 1.1%
Guinea 29 72 1.1%
Armenia 21 78 0.7%
Rwanda 19 79 0.4%
Kyrgyz Republic 9 89 0.4%
Box 6: Comparison of MCI rank, MCI score and mining sector contribution to employment
4.2.3 Emerging evidence of employment impacts of commodity price drop
During periods of sustained low commodity prices, such as that between 2011 and 2015, producers respond by seeking to reduce costs (see Section 2), including through workforce reductions. Job losses or wage cuts affect not only those directly employed, but also those in induced employment, whose incomes rely on the spending of mining sector workers. Consequently, employment impacts can be far larger than the figures for direct employment losses might suggest.
Unfortunately, as Ilostat relies on infrequently administered labour force survey data, it provides little information on the time trends in mining sector employment and offers only limited insights into the employment effects of recent commodity price falls. However, some data is available for changes over time in Peru, Mongolia and the Philippines.
In Peru, total employment in ‘mining and quarrying’ declined from around 205,000 jobs in 2012 to 198,000 in 2013; in Mongolia, mining employment declined from 45,000–46,000 in 2011–12 to 40,900 in 2014; in the Philippines, it fell from 250,000 in 2012 to 234,500 in 2015.
A recent World Bank study also found that mining employment growth in Mali, which steadily increased to a peak of 3,862 direct jobs in 2012, decreased to 3,568 direct jobs in 2013 (Sanoh and Coulibaly, 2015). The National Australia Bank recently estimated that the mining sector created around 169,000 jobs in Australia from the start of the mining construction boom in 2005 to its peak in 2013 but that 46,000 of these

Role of mining in national economies – third edition 45
4
38. ABC News Friday 10 June 2016.
39. The Fraser Institute produces an Investment Attractiveness Index detailing how attractive investments are in various countries as a result of mineral policies. Investment Attractiveness Index scores are positively correlated with the RGI composite score and the WGI scores for government effectiveness and regulatory quality.
had now gone with another 50,000 expected to be lost in the next two and a half years.38
Although these figures are limited and preliminary, they nevertheless indicate that the commodity price slump is having an impact on mining sector employment. The thousands of direct job losses being experienced in some countries could translate into tens of thousands of job losses when the knock-on effects on indirect and induced employment are included.
4.2.4 Implications of employment contribution findings
Employment contributions from mining are difficult to measure. Currently no reliable, comparable data is produced to allow for cross-country comparisons. MPD Toolkit applications and Ilostat data do, however, provide some initial evidence of employment contributions. MPD Toolkit applications have found that direct employment contributions typically range from 1 to 2 per cent of total national employment. The Ilostat database suggests that the range is slightly wider: around 0.5–3 per cent. Although the Ilostat figures are less reliable, they confirm the MPD findings that direct employment from mining is likely to constitute only a few percentage points of national employment. For each of these direct jobs, an additional two to five jobs are generated through indirect and induced employment. Once this is factored in, the total employment contribution could be as large as 15 per cent of total employment. Low commodity prices have already led to a reduction of thousands of jobs in some countries. This could result in tens of thousands of job
losses through indirect and induced employment. This has serious consequences for these tens of thousands of individuals (and their dependants) if they are unable to find alternative employment.
4.3
Governance – how does governance influence mining contributions?
4.3.1 The importance of governance in determining economic and social outcomes
The quality of governance in a country has a dramatic impact on both the nature and the magnitude of the economic and social contributions of the mining sector. As a general principle, better governance improves how well a country does overall – it has been linked in various studies with higher levels of per capita GDP and higher rates of GDP growth (Han et al, 2014) and better social indicators such as infant mortality rates (Kaufmann et al, 2000).
Governance influences mining’s contributions to government revenue (see Section 4.1) and employment (see Section 4.2) at all stages of its life cycle, from a government’s ability to attract initial investment39 and secure a good deal during initial contract negotiations, to its ability to manage the contribution over time to facilitate development in the rest of the economy. A country that is well governed is more likely to negotiate good terms with mining companies; to collect, manage and spend revenues effectively to generate broad-based growth and development; to create the enabling environment needed to enhance
employment; and to succeed in using mining to catalyse longer-term economic diversification.
4.3.2 Definitions and measures of governance
‘Governance’ has many definitions, encompassing the processes of making and implementing decisions. The widely used Worldwide Governance Indicators (WGI) identify three main components of the concept: the process by which governments are selected, monitored and replaced; the capacity of the government to effectively formulate and implement sound policies; and the respect of citizens and the state for the institutions that govern economic and social interactions among them (Kaufmann et al, 2000). ‘Good governance’ generally implies that the rule of law is respected, corruption is kept in check, political institutions are stable, government is effective and citizens are able to hold government to account.
Good governance requires a broader political environment that encourages accountability – for example, by allowing a free press and an active civil society. In relation to governing mineral resources, a key component of accountability is transparency – including transparency in contracts, beneficial ownership and revenue payments. Good governance also requires a government to have capacity to translate mining activities into social and economic development – ranging from mineral-sector-specific capabilities (eg the ability to administer a mining cadastre) to general public administration skills (eg procurement) to complex technical skills (eg capacity for sound macroeconomic management).

Role of mining in national economies – third edition46
Selected topics that significantly influence mining’s contribution continued
Discovery SpendingRevenueProduction Human development
$$
Mining law Environmental production National tax legislation National development plan
Industry regulations Annual budget
Economic and social policiesExploration licences Commercial licences Tax regulations
Revenue authority
Ministry of FinanceMinstry of energy and mining
Industry regulator Sector ministries
Environmental regulator Central bank
Legal framework
Enforcing instruments
Administration
Figure 23: The value chain and governance
Source: Adapted from Dietsche et al, 2013
Government comprises a complex set of institutions that operates at various levels and interacts in various ways. Good governance at one level does not automatically translate into good governance at other levels. For example, a national government may have better capacity to manage revenues from the mineral sector than a local government; if revenue is transferred to the local government to invest in infrastructure, this may reduce mining’s contribution to broad-based growth.
Getting the policies right for mineral sector policy and administration is complex and requires coordination across many agencies, something that is difficult to achieve even in highly effective governments.
Figure 23 shows a simplified outline of the numerous agencies, policies and levels of government that intersect across the ‘value chain’ involved in converting natural resources into growth and development.
Its broad scope makes ‘governance’ difficult not only to define but also to measure, although numerous indicators have been developed to measure various aspects of governance. Two are particularly relevant to the mineral sector.
The first is the Worldwide Governance Indicators (WGI), created by the World Bank. These include six indicators that act as proxies for the overall quality of governance
within a country (see Box 7 for more information). As they are not aggregated into an overall score for governance, we have focused on the two indicators that seem most relevant for determining how large a contribution mining is able to make to a country – government effectiveness and regulatory quality.
The second index focuses more specifically on governance of the natural resource sector. The Resource Governance Index (RGI) was created by the Natural Resource Governance Institute (NRGI). It is made up of four main components (see Box 8 for more details) that are aggregated to provide a composite score for each country it assesses.

Role of mining in national economies – third edition 47
4The Resource Governance Index, a recent initiative by the Natural Resource Governance Institute, covered 58 countries in 2013 and will be updated in early 2017. It evaluates four components of the quality of governance in the extractives sector:
• Institutional and legal setting – the degree to which the laws, regulations and institutional arrangements facilitate transparency, accountability and open/fair competition.
• Reporting practices – the actual disclosure of information by government agencies. Because de facto disclosures are the best indicator of transparency, this component receives a greater weight.
• Safeguards and quality controls – the presence and quality of checks and oversight mechanisms that encourage integrity and guard against conflicts of interest.
• Enabling environment – the broader governance environment, based on more than 30 external measures of accountability, government effectiveness, rule of law, corruption and democracy.
The first three components are informed by a 173-item questionnaire. Responses are clustered into 45 indicators, which are then mapped onto the components. The final component uses data from 30 external sources, including the WGI. These components are then weighted (40 per cent for ‘reporting practices’, 20 per cent for the others) to provide a composite score for each country assessed, ranging from 0 to 100.
Source: Natural Resource Governance Institute
Box 8: The Resource Governance Index (RGI)
The Worldwide Governance Indicators were created by the World Bank. They cover 215 countries and have been produced since 1996. The most recent figures are for 2014. Six indicators assess governance from three perspectives:
• the process by which governments are selected, monitored and replaced: voice and accountability and political stability
• the capacity of government to effectively formulate and implement sound policies: government effectiveness and regulatory quality
• respect of citizens and the state for the institutions that govern economic and social interactions among them: rule of law and control of corruption.
The indicators are informed by a large number of existing data sources and include views from the public and private sector as well as NGOs. Data sources include household and firm surveys (eg Afrobarometer surveys), NGOs (eg Global Integrity), commercial business information providers (eg Economist Intelligence Unit) and public sector organisations (eg CPIA assessments of World Bank).
The six indicators are not aggregated to provide an overall assessment of governance per country. Instead each indicator stands alone for each of the 215 countries, enabling comparisons over time and across countries. Scores are assumed to have a normal distribution and lie on a range from –2.5 to 2.5, with higher numbers indicating better governance. Countries are also ranked according to percentiles, with 0 indicating the lowest rank and 100 the highest. Source: Worldwide Governance Index
Box 7: The Worldwide Governance Indicators (WGI)

Role of mining in national economies – third edition48
Selected topics that significantly influence mining’s contribution continued
0-10thPercentile range
10-25th 25-50th 50-75th 75-90th 90-100th No data for country
Figure 24: Government effectiveness (WGI) in 2014 of the countries ranked in the top 50 of the MCI41
40. Australia, Bolivia, Botswana, Brazil, Canada, Chile, DRC, Ghana, Guinea, Iran, Liberia, Mongolia, Mozambique, Myanmar, Papua New Guinea, Peru, Philippines, Russia, Sierra Leone, South Africa, Tanzania, Zambia, Zimbabwe.
41. Source – Worldwide Governance Indicators website.
4.3.3 Governance indicators for top 50 countries on the MCI
Figure 24 provides an indication of government effectiveness (using the WGI indicator) and Figure 25 of regulatory quality for the countries ranked in the top 50 on the MCI. Countries are colour coded according to the percentile in which they rank in terms of government effectiveness and regulatory quality.
Overall, most of the top 50 MCI countries do poorly on both of these important measures of governance. Around a quarter of the countries (13 of 50 for government effectiveness and 17 of 50 for regulatory quality) rank in the top half, and only four (Australia, Canada, Chile and Israel) in the top quarter.
The majority of countries (around three-quarters) lie in the bottom half of the government effectiveness rankings.
Of the 37 countries in the bottom half of government effectiveness, 18 rank in the lowest quartile and 5 in the bottom decile. Of the 33 countries in the bottom half of regulatory quality, 13 rank in the lowest quartile and 6 in the bottom decile.
The NRGI assessed 23 of the top 50 MCI countries.40 Their composite scores are shown in Figure 26 and mapped in Figure 27. Five are rated as ‘satisfactory’, eight as ‘partial’, five as ‘weak’ and five as ‘failing’.

Role of mining in national economies – third edition 49
4
Percentile range0-10th 10-25th 25-50th 50-75th 75-90th 90-100th No data for country
Figure 25: Regulatory quality (WGI) in 2014 of the countries ranked in the top 50 of the MCI
Satisfactory
Philippines
South Africa
Zambia
Liberia
Ghana
Indonesia
Peru
Chile
Canada
Botsw
ana
Tanzania
Mongolia
Bolivia
Myanm
ar
Iran
Zimbabw
e
Mozam
bique
Congo, D
em R
ep
Papua New
Guinea
Sierra Leone
Guinea
Brazil
Australia
0
20
40
60
80
100
FailingWeakPartial
Figure 26: Resource Governance Index composite scores for 23 of the top 50 MCI countries
Source: NRGI

Role of mining in national economies – third edition50
Selected topics that significantly influence mining’s contribution continued
RGI composite scoreSatisfactory FailingWeakPartial
Figure 27: Map of Resource Governance Index composite scores for 24 of the top 50 MCI countries
Source: NRGI Resource Governance Index 2013
Table 6 breaks down how the 23 countries score on the four components that inform the NRGI composite score, with their WGI government effectiveness and regulatory quality scores added in the final two columns for reference and colour coded according to the same criteria.
It shows that there is variation in how well countries score in the underlying components, even if their composite scores are similar. For example, South Africa and Bolivia have similar
composite scores (56 and 53), but South Africa does better on ‘enabling environment’ and ‘safeguards and quality controls’ while Bolivia does better on ‘institutional and legal setting’ and ‘reporting practices’.
Some patterns emerge. In general, the ‘enabling environment’ is fairly poor for the 23 of the top 50 MCI countries assessed by NRGI, even for those countries scoring relatively well on the composite score. However, relative to their composite scores, many countries
seem to perform relatively well on ‘institutional and legal setting’ and ‘safeguards and quality controls’.
For example, Guinea scores as ‘weak’ on the composite index but scores very high on ‘institutional and legal setting’. This highlights that even if the formal legislation is good, governance in reality can still be very poor. But it also offers encouragement, in the sense that even in countries where government capacity is currently limited and regulatory capacity is poor, some

Role of mining in national economies – third edition 51
Table 6: RGI composite and disaggregated scores and WGI government effectiveness score
Sources: NRGI and WGI
4Country RGI WGI
Composite Institutional and legal setting
Reporting practices
Safeguards and quality controls
Enabling Environment
Government effectiveness
Regulatory quality
Australia 85 88 87 65 96 92 98
Brazil 80 81 78 96 66 47 50
Canada (Alberta) 76 67 72 74 96 95 98
Chile 75 77 74 65 87 84 92
Peru 73 88 83 56 55 44 69
Ghana 63 79 51 73 59 44 51
Liberia 62 83 62 71 31 8 23
Zambia 61 71 62 72 37 36 32
South Africa 56 69 31 75 72 65 64
Russia 56 57 60 62 39 51 37
Philippines 54 63 54 51 46 62 52
Bolivia 53 80 47 63 32 30 20
Mongolia 51 80 39 49 48 38 46
Tanzania 50 44 48 68 42 27 41
Botswana 47 55 28 53 69 65 72
Guinea 46 86 45 43 11 11 13
Sierra Leone 46 52 47 59 24 11 24
Papua New Guinea 43 59 34 50 38 28 42
Congo, Dem Rep 39 56 45 42 6 4 11
Mozambique 37 58 26 37 37 24 38
Zimbabwe 31 48 23 56 6 12 2
Iran 28 26 33 26 23 38 49
Myanmar 4 8 5 2 2 9 6

Role of mining in national economies – third edition52
Selected topics that significantly influence mining’s contribution continued
0102030405060708090
100
0 20 40 60 80 100Inve
stm
ent A
ttra
ctiv
enes
s In
dex
0102030405060708090
100
Inve
stm
ent A
ttra
ctiv
enes
s In
dex
RGI composite0 20 40 60 80 100
WGI government effectiveness
Figure 28: Investment Attractiveness Index compared to RGI composite and WGI government effectiveness scores
of the key components for effective governance of the resources sector can (and have) been put in place – such as an appropriate institutional and legal setting, and effective safeguards and quality controls.
Governance matters not just for current investments but also for future potential investments. The Fraser Institute produces an Investment Attractiveness Index that combines country ratings of geologic attractiveness and the effects of government policy on attitudes towards exploration investment. Figure 28 shows a positive correlation between this index and two measures of governance – the RGI composite score and the WGI government effectiveness score. Poor governance is therefore likely to constrain the amount of investment that a country receives.
4.3.4 What does this mean for the mining sector’s actual and potential contributions?
In summary, the evidence shows that good governance is lacking in many of the top 50 MCI countries: 74 per cent rank in the bottom half of the WGI government effectiveness score, 66 per cent rank in the bottom half of the WGI regulatory quality score and 78 per cent of those covered by the RGI are rated at levels below that considered satisfactory for good governance of natural resources.
Poor governance is likely to constrain investment. Even when investments are made, poor governance constrains some of the benefits that mining could otherwise bring to countries. It can reduce the amount of revenue that governments receive as a result of poorly negotiated
contracts or ineffective collection of taxes; lead to poor management of revenues through corruption or lack of capacity to smooth fluctuations or invest well; and prevent governments from effectively formulating and implementing policies to enhance indirect and induced employment over the long run. These challenges are particularly concerning given the current global context of deflated prices and reduced investments, as outlined in Section 2. Good governance is needed for effective management of the effects of the downturn.
However, there are some positive signs. Many countries have strengths to build on, such as relatively strong scores on ‘institutional and legal setting’ and ‘safeguards and quality controls’. They therefore have some of the key foundations

Role of mining in national economies – third edition 53
4Country MCI
rankImplementing EITI
Congo, Dem. Rep. 1 Yes
Mauritania 2 Yes
Burkina Faso 3 Yes
Madagascar 4 Yes
Botswana 5 No
Guyana 6 No
Uzbekistan 7 No
Liberia 8 Yes
Kyrgyz Republic 9 Yes
Tajikistan 10 Yes
Australia 11 No
Mozambique 12 Yes
Jamaica 13 No
Ghana 14 Yes
Sierra Leone 15 Yes
Dominican Republic 16 Yes
Senegal 17 Yes
Ukraine 18 Yes
Rwanda 19 No
Mongolia 20 Yes
Armenia 21 No
Sudan 22 No
Nicaragua 23 No
Chile 24 No
Myanmar 25 Yes
Table 7 EITI status of top 50 MCI countries
Country MCI rank
Implementing EITI
Philippines 26 Yes
Zambia 27 Yes
Brazil 28 No
Guinea 29 Yes
South Africa 30 No
Papua New Guinea 31 Yes
Mali 32 Yes
Bolivia 33 No
Peru 34 Yes
Cote d'Ivoire 35 Yes
Israel 36 No
Russian Federation 37 No
Zimbabwe 38 No
Solomon Islands 39 Yes
Guatemala 40 Yes
Macedonia, FYR 41 No
Namibia 42 No
Lao PDR 43 No
Tanzania 44 Yes
Suriname 45 No
Fiji 46 No
Iran, Islamic Rep. 47 No
Panama 48 No
Honduras 49 Yes
Bulgaria 50 No
in place to build upon for improved governance in other areas. Initiatives such as EITI are helping to improve other important components of governance in 51 countries that are implementing the EITI standard. Currently, 26 of the top 50 MCI countries are implementing EITI
(see Table 7). Companies can also play their part by recognising limited government capacity in countries where they operate and do their part to enhance governance, for example, by agreeing to contract disclosure as a means to enhance transparency and accountability in government
revenues (something already done by a number of ICMM member companies), or by taking steps to build capacity in local governments (see Box 9 for an example). These efforts enhance both revenue and employment contributions from the sector over the long term.

Role of mining in national economies – third edition54

Role of mining in national economies – third edition 55
44.3.5 Implications of governance findings
Governance is complex. It is difficult to define and to measure. But it is also an important determinant of the economic and social contributions that mining makes to a country. The Worldwide Governance Indicators (WGI) and the Resource Governance Index (RGI) show that overall levels of governance in countries ranked in the top 50 on the MCI are low. Three-quarters rank in the bottom half of countries for government effectiveness and two-thirds for regulatory quality on the WGI. Almost 80 per cent rank below satisfactory levels of governance on the RGI, although more than half were satisfactory or partially satisfactory. However, there are promising signs. Despite poor levels of overall governance, many countries have put in place the key foundations for improved governance in the form of appropriate institutional and legal settings, and safeguards and quality controls, and transparency initiatives such as EITI are working to improve other important aspects of governance. Over time these improvements should allow the already fairly substantial government revenue and employment contributions from mining to have a larger and more sustained positive impact on economic and social outcomes in the top 50 MCI countries.
Vale is the dominant mining company in the state of Southeast Pará in Brazil. Public services in Brazil are decentralised, and municipalities have significant responsibilities for providing public services but lack capacity for managing revenues and planning projects. Vale recognised the limited capacity of municipal government in Pará state and responded by setting up several structures to help build capacity within local municipalities. Through its public–private social partnership framework, it provides technical support to build municipalities’ capacity to apply for federal funds and use them to implement projects. Vale has helped improve local government’s capacity to map demand, supply technical information for project design and develop monitoring tools to manage funds. All of this has supported improved revenue management at the subnational level in Pará state.
Vale has also supported public education and technical training provision in the state. Through its Ação Educação (Education Action) programme, it supports municipal government (through an NGO) to implement and monitor education programmes from the federal and state levels. Technical assistance for federal fund applications is provided, and training is given to education department officials and school administrators. Through its supplier development programme Inove, Vale partners with national education institutions (Senai and Sesi) to develop technical training to build capacity among local suppliers. These initiatives have increased the employment contributions from the sector in Pará state (see ICMM Brazil case study for details). Source: ICMM (2013)
Box 9: Local government capacity building by mining companies – Vale Foundation in Brazil

Role of mining in national economies – third edition56

5Conclusions
Role of mining in national economies – third edition 57
Role of mining in national economies – third edition58
ConclusionsThis third edition of Romine has been produced at a time of considerable turbulence in the international markets for metals and minerals with significant ramifications for all major participants in the industry as documented in Section 2. In such a period the need to verify and update the broad structural dimensions of minerals and metals as a significant global activity remains as important as ever.
The initial idea from the first edition in 2012 was to provide a long overdue and regularly updated set of data on mining’s overall contribution in the global economy both in its totality and in individual mining economies. That basic mission statement remains relevant. The introduction of a single number for each country – its score and relative ranking on the MCI – was and remains an important part of the picture that Romine sets out to portray.
This edition has shown that notwithstanding the turbulence in the past seven to eight years, there are certain facts about the industry that have persisted as longer-term characteristics through 2016. These include the ongoing increase in demand for the series of products that we include under the label of mining and metals; the clear dependence of this increase on the rising demands that we still see in major middle-income countries; an ongoing shift in the production of major minerals to tap previously inaccessible deposits in remote less-developed regions; some stability of the positioning of most countries according to the MCI; and above all the still high level of dependence of many low- and middle-income economies on the mineral sector, a dependence jolted only slightly by the commodity price downturn.
Solid evidence on these and other aspects of the industry’s role is
helpful in advancing the proposition that mining needs to be thought about more centrally as a crucial contributor to a host country’s economic and social development, a position contrary to much of the conventional commentary about the industry. That proposition can be defended by reference to the high and rising levels of dependence of so many low- and middle-income countries on the sector: for example, the numerical fact that those countries make up almost all of the top 25 countries in the MCI in the years for which it has been produced.
However, the authors of this report acknowledge the limitations of the MCI. It is inevitably a compromise between what one would ideally like to measure and include and what can in practice be measured using the data currently available for most of the 183 countries that it seeks to cover. These limitations underlie the ongoing commitment to make the MCI more complete as a numerical representation of mining’s ‘contribution’ as more and better data becomes available. MCI-ranked countries, over 75 per cent are governed at levels below those considered satisfactory for good governance of natural resources.
Looking to the future, the Romine work will continue to explore ways to improve the scope and content of the MCI to ensure that it provides a regular and useful basis for
‘ Solid evidence on these and other aspects of the industry’s role is helpful in advancing the proposition that mining needs to be thought about more centrally as a crucial contributor to a host country’s economic and social development’

Role of mining in national economies – third edition 59
5Qualitative analysis
In this edition of Romine, quantitative analysis has been supplemented by a qualitative assessment of selected components of mining’s ‘contribution’, which do not lend themselves to systematic quantification.
There is no standardised database available to assess mineral taxation across countries; what limited comparative data there is shows very wide variations in the significance of tax and royalty payments in the total budgets of host countries. Closer examination of the data suggests that such variations often arise from the different states of maturity of the industry in different countries (ie its position along the life cycle) but also, more recently, from the turbulence of price movements that have affected some metals more than others.
This edition of Romine also found that while no reliable data is available to make possible cross-country numerical comparisons on employment, what limited evidence there is confirms two important points. These are that direct employment created by most modern mining activities (excluding artisanal
mining) represents only a small proportion of total employment in most host countries but that indirect employment creation can often be very substantial. Available multiplier evidence suggests that while total direct mining employment may only equate to some 2.5 per cent of a country’s total employment, total indirect or influenced employment can exceed 10 per cent.
Lastly, the effects of ‘governance’ on the sector’s contribution can be significant. Available evidence confirms an all too familiar conclusion that – in spite of many initiatives (national and international) and undoubted improvements in some areas – weak governance can prevent the mining sector from delivering on its full economic and social development potential. More specifically, evidence from both the World Bank (World Governance Indicators) and the natural Resource Governance Institute (Natural Resource Governance Index) suggests that of the top 50 MCI-ranked countries, over 75 per cent are governed at levels below those considered satisfactory for good governance of natural resources.
assessing mining’s role in the global economy and in individual mining economies. The selected topics as discussed in this edition will be expanded in future editions to examine other important dimensions of the industry’s contribution
‘ the Romine initiative will continue to explore ways to improve the scope and content of the MCI to ensure that it provides a regular and useful basis for assessing mining’s role in the global economy and in individual mining economies’
including, probably next time, an analysis of the methodologies for managing and evaluating community contributions; and a synthesis of the impacts of the major international climate change initiatives on the industry.
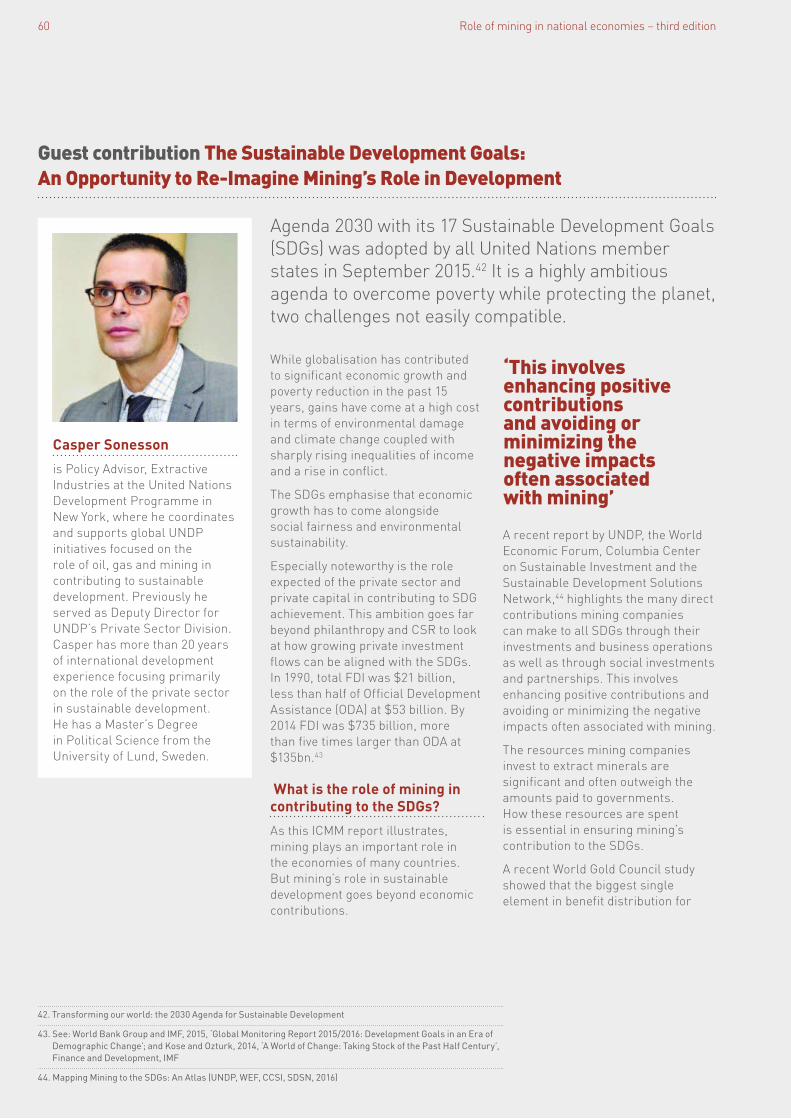
Role of mining in national economies – third edition60
Guest contribution The Sustainable Development Goals: An Opportunity to Re-Imagine Mining’s Role in Development
Agenda 2030 with its 17 Sustainable Development Goals (SDGs) was adopted by all United Nations member states in September 2015.42 It is a highly ambitious agenda to overcome poverty while protecting the planet, two challenges not easily compatible.
While globalisation has contributed to significant economic growth and poverty reduction in the past 15 years, gains have come at a high cost in terms of environmental damage and climate change coupled with sharply rising inequalities of income and a rise in conflict.
The SDGs emphasise that economic growth has to come alongside social fairness and environmental sustainability.
Especially noteworthy is the role expected of the private sector and private capital in contributing to SDG achievement. This ambition goes far beyond philanthropy and CSR to look at how growing private investment flows can be aligned with the SDGs. In 1990, total FDI was $21 billion, less than half of Official Development Assistance (ODA) at $53 billion. By 2014 FDI was $735 billion, more than five times larger than ODA at $135bn.43
What is the role of mining in contributing to the SDGs?
As this ICMM report illustrates, mining plays an important role in the economies of many countries. But mining’s role in sustainable development goes beyond economic contributions.
A recent report by UNDP, the World Economic Forum, Columbia Center on Sustainable Investment and the Sustainable Development Solutions Network,44 highlights the many direct contributions mining companies can make to all SDGs through their investments and business operations as well as through social investments and partnerships. This involves enhancing positive contributions and avoiding or minimizing the negative impacts often associated with mining.
The resources mining companies invest to extract minerals are significant and often outweigh the amounts paid to governments. How these resources are spent is essential in ensuring mining’s contribution to the SDGs.
A recent World Gold Council study showed that the biggest single element in benefit distribution for
‘This involves enhancing positive contributions and avoiding or minimizing the negative impacts often associated with mining’
Casper Sonesson
is Policy Advisor, Extractive Industries at the United Nations Development Programme in New York, where he coordinates and supports global UNDP initiatives focused on the role of oil, gas and mining in contributing to sustainable development. Previously he served as Deputy Director for UNDP’s Private Sector Division. Casper has more than 20 years of international development experience focusing primarily on the role of the private sector in sustainable development. He has a Master’s Degree in Political Science from the University of Lund, Sweden.
42. Transforming our world: the 2030 Agenda for Sustainable Development
43. See: World Bank Group and IMF, 2015, ‘Global Monitoring Report 2015/2016: Development Goals in an Era of Demographic Change’; and Kose and Ozturk, 2014, ‘A World of Change: Taking Stock of the Past Half Century’, Finance and Development, IMF
44. Mapping Mining to the SDGs: An Atlas (UNDP, WEF, CCSI, SDSN, 2016)

Role of mining in national economies – third edition 61
communities and government comes from procurement by gold mines, not from taxes and royalties.45 Out of a total of $55bn annual spending in 2012 by the fifteen Gold Council member companies participating in the study, some $35bn were payments to other businesses, mostly subcontracting and procurement. Less than $10bn were royalty and tax payments to governments. So if even a small additional share of these expenditures can be captured by domestic enterprises and workers in developing countries, it can have significant impact on local economic development and job creation, contributing to SDGs 8 and 9.
As companies invest in mining-related infrastructure required to operate a mine, there is ample opportunity for leveraging such infrastructure for local development. For example, in Peru, Compañía Minera Antamina constructed a 304 km pipeline to transport copper and zinc concentrate slurry from mine to port. The company also built a fiber optic cable next to the pipeline to monitor it for leaks or disturbances. The cable enabled the national telecommunications utility to better serve the area with mobile and internet coverage at a much lower cost than if the mining company’s cable had not been used.46
Or consider what mining, as a major water user, can do to contribute to SDG 6 on increasing water
use efficiency. At Vale’s Sossego metallurgical plant in Para, Brazil, 99.99% of the water used is recycled from the tailings pond and re-circulated through the processing circuit. The procedure saves 900,000 cubic meters of freshwater annually that had previously been pumped from a nearby river. This is enough water to supply a town of 25,000 people for six months.47
How can mining’s contribution be scaled up?
A relatively limited number of leading companies pursue such opportunities in a systematic way. To enhance mining’s contribution to the SDGs there is a need to scale up these kinds of efforts. A number of drivers can help make this happen.
1. There is a need to further articulate the specific business cases for companies to take action on the SDGs and demonstrate how to operationalise the SDGs in mining. Broadly, it is clear that doing so can lead to greater efficiencies, cost savings, enhanced competitiveness and improved license to operate.
Take SDG 7 on sustainable energy and the target on increasing the share of renewable energy in the global energy mix for example. Mining is extremely energy intensive and normally consumes between 10 per cent to 40 per cent of operational costs for a mine.48 Investing in
renewable energy can help reduce this cost significantly. The Mining and SDG Atlas highlights cases where mines in remote areas are saving tens of millions USD in energy costs by replacing traditional fuels with renewables such as wind or geothermal power.
Significant cost savings over time can also be made by taking action in other SDG areas, such as increasing local procurement or investing in conflict prevention. On the latter, a 2014 study49 showed that the cost to a world-class mining project ($3-5bn investment) of lost production due to a shutdown caused by conflicts with communities is estimated at $20 million per week.
2. Another central driver for mainstreaming the SDGs into mining is governance. As countries start to implement the SDGs, it is expected that national policies and regulations, including those governing mining, will increasingly incorporate or be informed by the SDGs.
One concern often expressed about stringent environmental and social regulations is the trade-off with competitiveness, ie the more stringent regulations a country has in place the less competitive it will be in attracting mining investments. However, recent research50 dispels this concern and shows that a lack of timeliness, flexibility and predictability in implementing regulations rather
45. World Gold Council - Responsible gold mining and value distribution: A global assessment of the economic value created and distributed by members of the World Gold Council, 2013
46. CCSI, 2014. Leveraging Mining Demand for Internet and Telecommunications Infrastructure for Broad Economic Development: Models, Opportunities, and Challenges. http://ccsi.columbia.edu/files/2014/05/CCI-Policy-Paper-Leveraging-Mining-Related-ICT-Infrastructure-for-Development-June-20141.pdf
47. ibid
48. World Mining Congress, 2013. Production Energy Optimization in Mining.
49. Harvard Kennedy School, Shift, and Univ. of Queensland, 2014. Costs of Company-Community Conflict in the Extractive Sector. http://www.hks.harvard.edu/m-rcbg/CSRI/research/Costs%20of%20Conflict_Davis%20%20Franks.pdf
50. Environmental regulation and mining sector competitiveness: Söderholm, Söderholm, Petterson, Svahn, Viklund, Helenius, 2014

Role of mining in national economies – third edition62
than the stringency of regulations are actually the greatest threats to competitiveness.
This points to the importance of two key governance aspects to maximise mining’s contribution to the SDGs: i) effective, capable and accountable government institutions and ii) the quality and design of regulations and policies.
SDG 16 recognises the central role of good governance to achieve sustainable development. Prioritising and making progress on this Goal will be central to scale up and maximize mining’s contributions to (all) other SDGs.
3. Investors and providers of finance for mining projects increasingly require adherence to sustainability principles. The IFC already applies its Performance Standards on Environmental and Social Sustainability to all its project financing. The Equator Principles, based on the IFC Performance Standards, have been adopted by nearly 80 banks and financial institutions. The Norwegian Pension Fund includes sound sustainability performance as a key criterion for investment decisions. In Peru, the financial sector regulator is incentivising better management of social conflict by extractive companies through requirements of due diligence by banks, insurers and pension funds.51
The SDGs will further accelerate this move towards factoring in environmental, social and governance issues into credit risks and rewarding projects that demonstrate strong contributions to sustainable development.
4. The trend towards increased transparency in the sector will continue and will move beyond revenues and financial flows spearheaded by initiatives such as EITI. Disclosure of environmental, social and economic impacts will increasingly be required, whether by regulators, financiers or the public and will be fuelled by enhanced digital connectivity and access to information. This will further incentivise mining stakeholders to take action in support of sustainable development.
Moving forward – partnerships and data
The 2030 Agenda is ambitious and multidimensional. Maximizing mining’s contributions to it will require new forms of partnership between all stakeholders.
Global development institutions like UNDP are working closely with governments of developing economies to integrate the SDGs into national development plans and to support SDG implementation. In mineral-rich countries, the mining sector must become engaged and define its role in these efforts.
Making such engagement effective will require collaborative governance mechanisms that allow for structured and continuous multi-stakeholder dialogue, priority setting, coordination and partnerships focused on mining’s contributions. UNDP works to support such approaches.
To ensure continuous progress in enhancing mining’s contributions will also require improvements in tracking and measuring results. More and better quality data will be needed that can be aggregated and feed into wider national and international SDG monitoring. As mineral rich countries define their specific SDG priorities and indicators to measure progress, the mining sector should be engaged in these discussions.
Contributing to the SDGs is not only a call to action to the mining industry. Other industry sectors ought to take similar steps. But mining is unique: mineral resources are finite and are owned by the people. A fundamental objective of mining is therefore to ensure that the extraction of this natural capital is transformed into human capital and broader sustainable development.
51. See SHIFT: Advising the Peruvian Financial Regulator on Improved Corporate Management of Social Conflict

Role of mining in national economies – third edition 63
Cordes, K, Östensson, O and Toledano, P (2016). Employment from mining and agricultural investments: how much myth, how much reality? Columbia Center on Sustainable Investment.
Dietsche, E, Dodd, S, Haglund, D, Henstridge, M, Jakobsen, M, Sindou, E and Slaven, C (2013). Topic guide: extractive industries, development and the role of donors. EPS PEAKS, UK.
Gibson, R, Hassan, S, Holtz, S, Tansey, J and Whitelaw, G (2005). Sustainability assessment – criteria and processes. London: Earthscan.
Han, X, Khan, H and Zhuang, J (2014). Do governance indicators explain development performance? A cross-country analysis. Asian Development Bank Economics Working Paper Series No 417, November 2014.
Hodge, A (2011). Mining and sustainability. Chapter 16.2 in Peter Darling (ed), SME mining engineering handbook. Third edition. Englewood, Colorado: Society for Mining, Metallurgy and Exploration.
ICMM (2007). Chile. The challenge of mineral wealth: using resource endowments to foster sustainable development. Country case study. March 2007. London: ICMM.
ICMM (2012). InBrief. Trends in the mining and metals industry. Mining’s contribution to sustainable development. October 2012. London: ICMM.
ICMM (2013). The mining sector in Brazil: building institutions for sustainable development. Mining: Partnerships for Development. April 2013. London: ICMM.
ICMM (2014). The role of mining in national economies (2nd edition). Mining’s contribution to sustainable development. October 2014. London: ICMM.
IFC (2013). IFC jobs study. Assessing private sector contributions to job creation and poverty reduction. Preliminary findings and conclusions – draft October 2012.
References
Ilostat data. http://www.ilo.org/ilostat/
Kaufmann, D, Kraay, A and Zoido-Lobaton, P (2000). ‘Governance matters: from measurement to action’, Finance and Development, June 2000.
McMahon, G and Moreira, S (2014). The contribution of the mining sector to socioeconomic and human development. Extractive Industries for Development Series No 30. World Bank. April 2014.
Östensson, O (2014). Mining royalties – boon or bane? Euro Mine Expo, Skellefteå, 10–12 June 2014.
PwC (2015). Mine 2015: the gloves are off. Review of global trends in the mining industry.
Rio Tinto (2014). Taxes paid in 2014: a report on the economic contribution made by Rio Tinto to public finances.
Roe, A and Dodd, S (2016). The statistical tendencies. Paper for UNU-WIDER Conference on Extractive Industries and Development. Helsinki, April 2016.
Sanoh, A and Coulibaly, M (2015). Socioeconomic and fiscal impact of large-scale gold mining in Mali. World Bank, Policy Research Working Paper 7467.
Stevens, P, Lahn, G and Kooroshy, J. (2015). The resource curse revisited. London: Chatham House. August 2015.
World Bank and IFC (2002). Large mines and local communities: forging partnerships, building sustainability. Mining and Development.
Worldwide Governance Indicators. http://data.worldbank.org/data-catalog/worldwide-governance-indicators

Role of mining in national economies – third edition64
ASM artisanal and small-scale mining
BRIC Brazil, Russia, India and China
dmt dry metric tonne
DRC the Democratic Republic of the Congo
EITI Extractive Industries Transparency Initiative
FDI foreign direct investment
GDP gross domestic product
ICMM International Council on Mining and Metals
IFC International Finance Corporation
ILO International Labour Organization
Ilostat ILO’s central statistics database
IMF International Monetary Fund
MCI Mining Contribution Index
MPD Mining: Partnerships for Development
NGO non-governmental organisation
NRGI Natural Resource Governance Institute
OECD Organisation for Economic Co-operation and Development
pp percentage points
PPP purchasing power parity
PwC PricewaterhouseCoopers
RGI Resource Governance Index
Romine Role of Mining in National Economies
SME small and medium enterprise
UNCTAD United Nations Conference on Trade and Development
WGI Worldwide Governance Indicators
Abbreviations and glossary

Role of mining in national economies – third edition 65
z
Acknowledgements
The development of this publication would not have been possible without the input and support of the individuals below. ICMM gratefully acknowledges the following contributions:
Disclaimer
This publication contains general guidance only and should not be relied upon as a substitute for appropriate technical expertise. While reasonable precautions have been taken to verify the information contained in this publication as at the date of publication, it is being distributed without warranty of any kind, either express or implied.
In no event shall the International Council on Mining and Metals (“ICMM”) (or its affiliates or contributors, reviewers or editors to this publication) be liable for damages or losses of any kind, however arising, from the use of, or reliance on this document. The responsibility for the interpretation and use of this publication lies with the user (who should not assume that it is error-free or that it will be suitable for the user’s purpose) and ICMM assumes no responsibility whatsoever for errors or omissions in this publication or in other source materials which are referenced by this publication.
The views expressed do not necessarily represent the decisions or the stated policy of ICMM. This publication does not constitute a position statement or other mandatory commitment which members of ICMM are obliged to adopt under the ICMM Sustainable Development Framework.
We are not responsible for, and make no representation on, the content or reliability of linked websites, and linking should not be taken as endorsement of any kind. We have no control over the availability of linked pages and accept no responsibility for them.
The designations employed and the presentation of the material in this publication do not imply the expression of any opinion whatsoever on the part of ICMM concerning the legal status of any country, territory, city or area or of its authorities, or concerning delimitation of its frontiers or boundaries. In addition, the mention of specific entities, individuals, source materials, trade names or commercial processes in this publication does not constitute endorsement by ICMM.
This disclaimer should be construed in accordance with the laws of England.
Consulting team
This report was developed by a consulting team from Oxford Policy Management (OPM). ICMM is indebted to the OPM team which comprised the following members:
Alan Roe Katherine Cooke Rachita Daga Samantha Dodd
Special thanks to:
Casper Sonesson (UNDP) who provided a guest contribution to this publication on The Sustainable Development Goals: An Opportunity to Re-Imagine Mining’s Role in Development.
Clive Armstrong (independent consultant) who provided valuable insights on updating the MCI and who acted as independent expert reviewer.
Gareth Taylor (SNL) for providing helpful input throughout the data compilation process.
Alice and Will Beaven (Positive2) for their creative design work.
Richard Earthy for editing the document.
Thanks also go to the teams that worked on the 2014 and 2012 editions of Romine.
ICMM team
Aidan Davy led the process to develop this index. Marcus Addy and Diane Tang-Lee compiled the macroeconomic data sets that make up the revised MCI and provided additional points of data analysis. Constructive contributions were provided by Fernanda Diez, Duncan Robertson and Nic Benton throughout the process.
Photographs
©AngloAmerican, pp.8–9; ©Goldcorp, p.19; ©Hydro, p.6; ©Jan Kowalski/Shutterstock.com, pp.16 –17; ©MMG, pp.54 & 56–57; ©Newmont, pp.28–29; ©Rio Tinto: cover, inside front cover.

Role of mining in national economies – third edition66ICMM is an international organisation dedicated to a safe, fair and sustainable mining industry. Bringing together 23 mining and metals companies and 34 regional and commodities associations we strengthen environmental and social performance.
We serve as a catalyst for change; enhancing mining’s contribution to society.
ICMM35/38 Portman SquareLondon W1H 6LRUnited Kingdom+44 (0) 20 7467 [email protected]
Follow us: