role of renewable energy policies in energy dependency...
TRANSCRIPT
Applied Energy 113 (2014) 758–765
Contents lists available at ScienceDirect
Applied Energy
journal homepage: www.elsevier .com/ locate/apenergy
Role of renewable energy policies in energy dependency in Finland:System dynamics approach
0306-2619/$ - see front matter � 2013 Elsevier Ltd. All rights reserved.http://dx.doi.org/10.1016/j.apenergy.2013.08.015
⇑ Corresponding author at: Industrial Management Department, Faculty ofTechnology, University of Vaasa, Vaasa 65101, Finland. Tel./fax: +358 44 255 0010.
E-mail address: [email protected] (A. Aslani).
Alireza Aslani a,b,⇑, Petri Helo a, Marja Naaranoja a
a Industrial Management Department, Faculty of Technology, University of Vaasa, Vaasa 65101, Finlandb Department of Engineering and Public Policy, College of Engineering, Carnegie Mellon University, 5000 Forbes Ave., Pittsburgh, PA 15213, USA
h i g h l i g h t s
� A system dynamics model for evaluating renewable energy policies on dependency is proposed.� The model considers the role of diversification on dependency and security of energy supply in Finland.� Dependency on imported sources will decrease depends on the defined scenarios in Finland.
a r t i c l e i n f o
Article history:Received 29 March 2013Received in revised form 3 July 2013Accepted 6 August 2013Available online 3 September 2013
Keywords:Renewable energy resourcesDependencyFinlandSystem dynamics
a b s t r a c t
Objective: We discuss the role of diversification on dependency and security of energy supply. A systemdynamics model with especial focus on the role of renewable energy resources (as a portfolio) onFinland’s energy dependency is developed. The purpose is also to cover a part of research gap exists inthe system dynamics modeling of energy security investigations.Methods: A causal loops diagram and a system dynamics model evaluate Finnish scenarios of renewableenergy policies. The analysis describes the relationship between dynamic factors such as RE encourage-ment packages, dependency, and energy demand.Results: A causal loops diagram and a system dynamics model evaluate three different Finnish scenariosof renewable energy policies by 2020.Conclusion: Analysis shows that despite 7% electricity/heat consumption growth by 2020 in Finland,dependency on imported sources will decrease between 1% and 7% depend on the defined scenarios.Practice Implications: The proposed model not only helps decision makers to test their scenarios relatedto renewable energy polices, it can be implemented by other countries.
� 2013 Elsevier Ltd. All rights reserved.
1. Introduction
One of the effective factors of the governments’ policies is secu-rity of energy supply. Energy security refers to a resilient energysystem that is capable withstanding threats with focus on criticalinfrastructures [1]. It includes direct security measures (e.g., sur-veillance and guards) and indirect measures (e.g., redundancy,duplication of critical equipment and diversity in resources).
Energy security directly affects the level of economy, safety, andsocial welfare of a country [2]. Therefore, concerns such as growingenergy demands, limitations of fossil fuels, threats of carbon diox-ide (CO2) emission and consequently global warming have causedpolicy makers and governments to debate role of diversificationand utilization of renewable energy resources (RER) in their energypolicies. A diversified portfolio of resources and suppliers for elec-
tricity/heat generation in a country decreases the overall risk ofenergy supply [3]. Diversification in supply resources not onlyreduce vulnerability of supply disruptions from a source, but alsoit decreases the power of suppliers and risks of higher prices inthe market [4,5]. To succeed diffusion programs of RE develop-ment, different strategies such as technological improvements,increased economies of scale, and strong policy support shouldbe contributed in both developed and developing countries [6,7].
After economic recession in the 1970s and early 1980s, as wellas high dependency of Finland to imported fossil fuels, renewableenergy (RE) alternatives have had an important role in the Finnishenergy and climate strategies [8]. However, development of REparticularly in areas such as wind power has lagged that of otherEuropean countries in recent years in Finland [9].
This article discusses the role of diversification on dependencyand security of energy supply in Finland. Our study develops an en-ergy dependency analysis with especial focus on the role of renew-able energy resources (RER) via both qualitative and quantitative
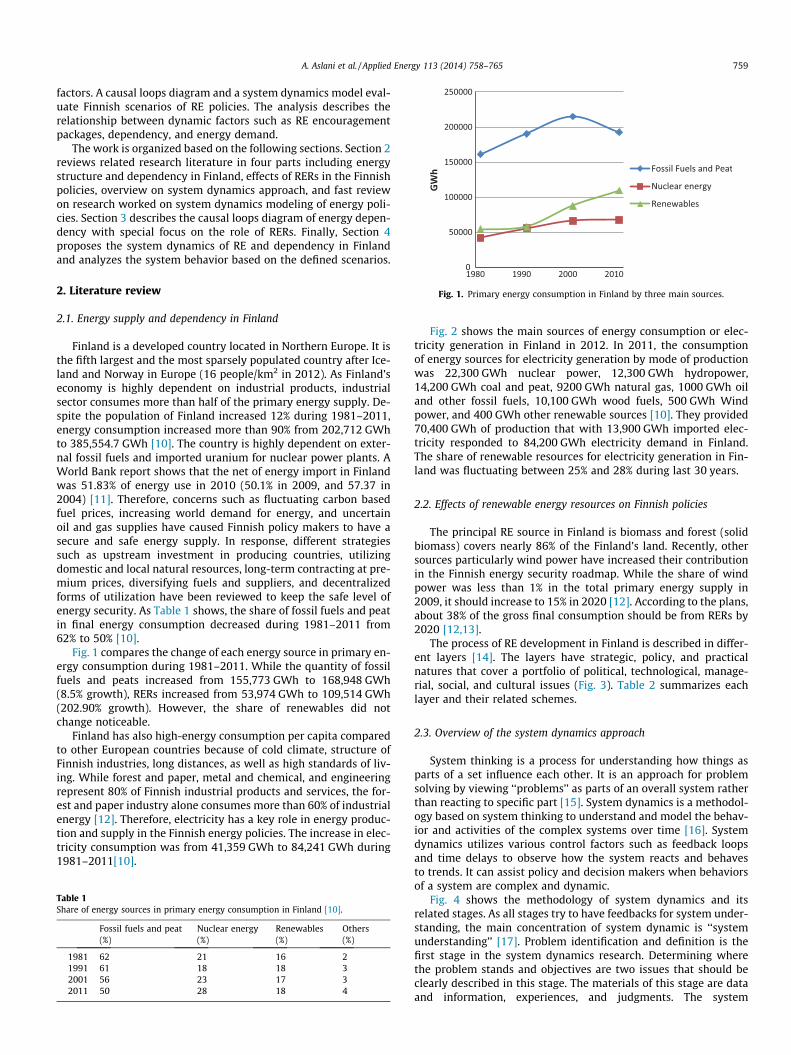
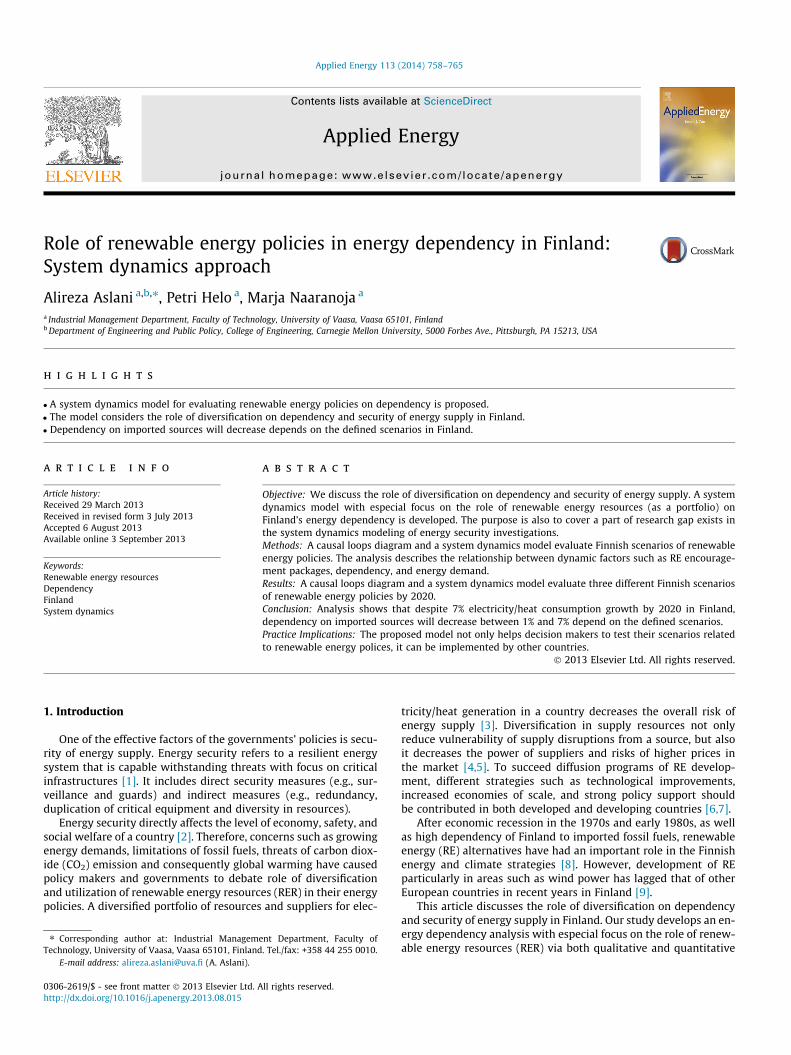
Fig. 1. Primary energy consumption in Finland by three main sources.
A. Aslani et al. / Applied Energy 113 (2014) 758–765 759
factors. A causal loops diagram and a system dynamics model eval-uate Finnish scenarios of RE policies. The analysis describes therelationship between dynamic factors such as RE encouragementpackages, dependency, and energy demand.
The work is organized based on the following sections. Section 2reviews related research literature in four parts including energystructure and dependency in Finland, effects of RERs in the Finnishpolicies, overview on system dynamics approach, and fast reviewon research worked on system dynamics modeling of energy poli-cies. Section 3 describes the causal loops diagram of energy depen-dency with special focus on the role of RERs. Finally, Section 4proposes the system dynamics of RE and dependency in Finlandand analyzes the system behavior based on the defined scenarios.
2. Literature review
2.1. Energy supply and dependency in Finland
Finland is a developed country located in Northern Europe. It isthe fifth largest and the most sparsely populated country after Ice-land and Norway in Europe (16 people/km2 in 2012). As Finland’seconomy is highly dependent on industrial products, industrialsector consumes more than half of the primary energy supply. De-spite the population of Finland increased 12% during 1981–2011,energy consumption increased more than 90% from 202,712 GWhto 385,554.7 GWh [10]. The country is highly dependent on exter-nal fossil fuels and imported uranium for nuclear power plants. AWorld Bank report shows that the net of energy import in Finlandwas 51.83% of energy use in 2010 (50.1% in 2009, and 57.37 in2004) [11]. Therefore, concerns such as fluctuating carbon basedfuel prices, increasing world demand for energy, and uncertainoil and gas supplies have caused Finnish policy makers to have asecure and safe energy supply. In response, different strategiessuch as upstream investment in producing countries, utilizingdomestic and local natural resources, long-term contracting at pre-mium prices, diversifying fuels and suppliers, and decentralizedforms of utilization have been reviewed to keep the safe level ofenergy security. As Table 1 shows, the share of fossil fuels and peatin final energy consumption decreased during 1981–2011 from62% to 50% [10].
Fig. 1 compares the change of each energy source in primary en-ergy consumption during 1981–2011. While the quantity of fossilfuels and peats increased from 155,773 GWh to 168,948 GWh(8.5% growth), RERs increased from 53,974 GWh to 109,514 GWh(202.90% growth). However, the share of renewables did notchange noticeable.
Finland has also high-energy consumption per capita comparedto other European countries because of cold climate, structure ofFinnish industries, long distances, as well as high standards of liv-ing. While forest and paper, metal and chemical, and engineeringrepresent 80% of Finnish industrial products and services, the for-est and paper industry alone consumes more than 60% of industrialenergy [12]. Therefore, electricity has a key role in energy produc-tion and supply in the Finnish energy policies. The increase in elec-tricity consumption was from 41,359 GWh to 84,241 GWh during1981–2011[10].
Table 1Share of energy sources in primary energy consumption in Finland [10].
Fossil fuels and peat(%)
Nuclear energy(%)
Renewables(%)
Others(%)
1981 62 21 16 21991 61 18 18 32001 56 23 17 32011 50 28 18 4
Fig. 2 shows the main sources of energy consumption or elec-tricity generation in Finland in 2012. In 2011, the consumptionof energy sources for electricity generation by mode of productionwas 22,300 GWh nuclear power, 12,300 GWh hydropower,14,200 GWh coal and peat, 9200 GWh natural gas, 1000 GWh oiland other fossil fuels, 10,100 GWh wood fuels, 500 GWh Windpower, and 400 GWh other renewable sources [10]. They provided70,400 GWh of production that with 13,900 GWh imported elec-tricity responded to 84,200 GWh electricity demand in Finland.The share of renewable resources for electricity generation in Fin-land was fluctuating between 25% and 28% during last 30 years.
2.2. Effects of renewable energy resources on Finnish policies
The principal RE source in Finland is biomass and forest (solidbiomass) covers nearly 86% of the Finland’s land. Recently, othersources particularly wind power have increased their contributionin the Finnish energy security roadmap. While the share of windpower was less than 1% in the total primary energy supply in2009, it should increase to 15% in 2020 [12]. According to the plans,about 38% of the gross final consumption should be from RERs by2020 [12,13].
The process of RE development in Finland is described in differ-ent layers [14]. The layers have strategic, policy, and practicalnatures that cover a portfolio of political, technological, manage-rial, social, and cultural issues (Fig. 3). Table 2 summarizes eachlayer and their related schemes.
2.3. Overview of the system dynamics approach
System thinking is a process for understanding how things asparts of a set influence each other. It is an approach for problemsolving by viewing ‘‘problems’’ as parts of an overall system ratherthan reacting to specific part [15]. System dynamics is a methodol-ogy based on system thinking to understand and model the behav-ior and activities of the complex systems over time [16]. Systemdynamics utilizes various control factors such as feedback loopsand time delays to observe how the system reacts and behavesto trends. It can assist policy and decision makers when behaviorsof a system are complex and dynamic.
Fig. 4 shows the methodology of system dynamics and itsrelated stages. As all stages try to have feedbacks for system under-standing, the main concentration of system dynamic is ‘‘systemunderstanding’’ [17]. Problem identification and definition is thefirst stage in the system dynamics research. Determining wherethe problem stands and objectives are two issues that should beclearly described in this stage. The materials of this stage are dataand information, experiences, and judgments. The system
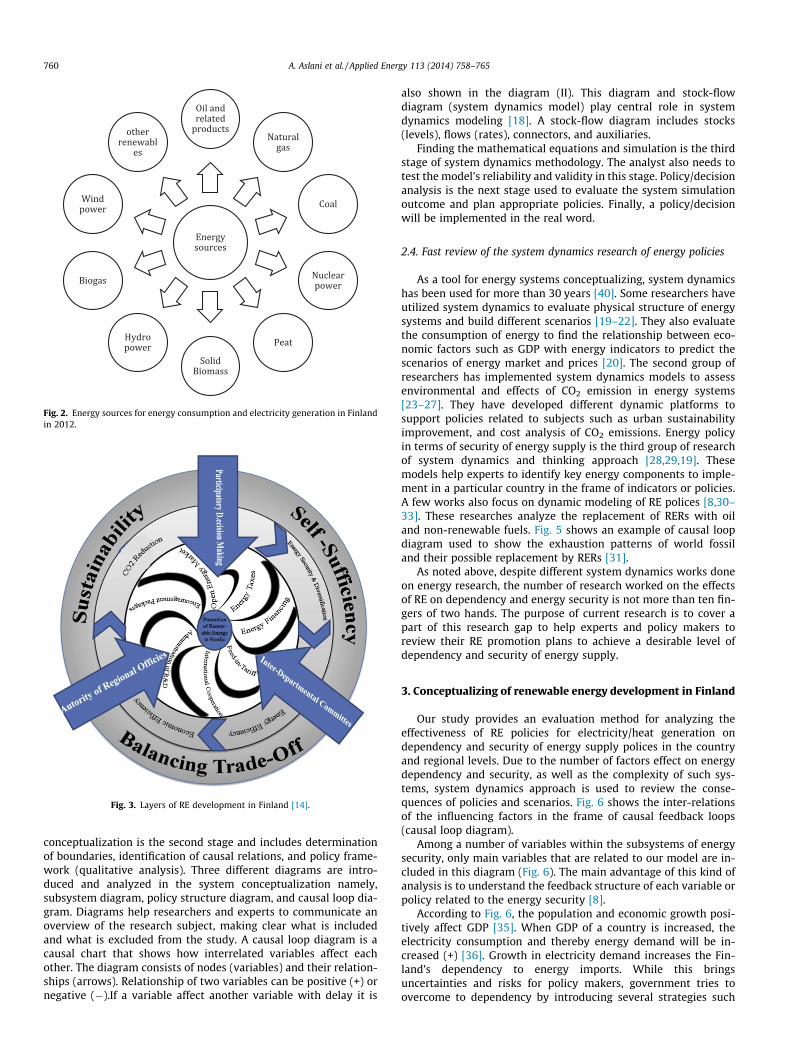
Fig. 2. Energy sources for energy consumption and electricity generation in Finlandin 2012.
Fig. 3. Layers of RE development in Finland [14].
760 A. Aslani et al. / Applied Energy 113 (2014) 758–765
conceptualization is the second stage and includes determinationof boundaries, identification of causal relations, and policy frame-work (qualitative analysis). Three different diagrams are intro-duced and analyzed in the system conceptualization namely,subsystem diagram, policy structure diagram, and causal loop dia-gram. Diagrams help researchers and experts to communicate anoverview of the research subject, making clear what is includedand what is excluded from the study. A causal loop diagram is acausal chart that shows how interrelated variables affect eachother. The diagram consists of nodes (variables) and their relation-ships (arrows). Relationship of two variables can be positive (+) ornegative (�).If a variable affect another variable with delay it is
also shown in the diagram (II). This diagram and stock-flowdiagram (system dynamics model) play central role in systemdynamics modeling [18]. A stock-flow diagram includes stocks(levels), flows (rates), connectors, and auxiliaries.
Finding the mathematical equations and simulation is the thirdstage of system dynamics methodology. The analyst also needs totest the model’s reliability and validity in this stage. Policy/decisionanalysis is the next stage used to evaluate the system simulationoutcome and plan appropriate policies. Finally, a policy/decisionwill be implemented in the real word.
2.4. Fast review of the system dynamics research of energy policies
As a tool for energy systems conceptualizing, system dynamicshas been used for more than 30 years [40]. Some researchers haveutilized system dynamics to evaluate physical structure of energysystems and build different scenarios [19–22]. They also evaluatethe consumption of energy to find the relationship between eco-nomic factors such as GDP with energy indicators to predict thescenarios of energy market and prices [20]. The second group ofresearchers has implemented system dynamics models to assessenvironmental and effects of CO2 emission in energy systems[23–27]. They have developed different dynamic platforms tosupport policies related to subjects such as urban sustainabilityimprovement, and cost analysis of CO2 emissions. Energy policyin terms of security of energy supply is the third group of researchof system dynamics and thinking approach [28,29,19]. Thesemodels help experts to identify key energy components to imple-ment in a particular country in the frame of indicators or policies.A few works also focus on dynamic modeling of RE polices [8,30–33]. These researches analyze the replacement of RERs with oiland non-renewable fuels. Fig. 5 shows an example of causal loopdiagram used to show the exhaustion patterns of world fossiland their possible replacement by RERs [31].
As noted above, despite different system dynamics works doneon energy research, the number of research worked on the effectsof RE on dependency and energy security is not more than ten fin-gers of two hands. The purpose of current research is to cover apart of this research gap to help experts and policy makers toreview their RE promotion plans to achieve a desirable level ofdependency and security of energy supply.
3. Conceptualizing of renewable energy development in Finland
Our study provides an evaluation method for analyzing theeffectiveness of RE policies for electricity/heat generation ondependency and security of energy supply polices in the countryand regional levels. Due to the number of factors effect on energydependency and security, as well as the complexity of such sys-tems, system dynamics approach is used to review the conse-quences of policies and scenarios. Fig. 6 shows the inter-relationsof the influencing factors in the frame of causal feedback loops(causal loop diagram).
Among a number of variables within the subsystems of energysecurity, only main variables that are related to our model are in-cluded in this diagram (Fig. 6). The main advantage of this kind ofanalysis is to understand the feedback structure of each variable orpolicy related to the energy security [8].
According to Fig. 6, the population and economic growth posi-tively affect GDP [35]. When GDP of a country is increased, theelectricity consumption and thereby energy demand will be in-creased (+) [36]. Growth in electricity demand increases the Fin-land’s dependency to energy imports. While this bringsuncertainties and risks for policy makers, government tries toovercome to dependency by introducing several strategies such

Table 2Different layers of diffusion of renewable energy in Finland and Nordic countries [14].
Layer Description Scheme Aim
Dimensions To show the purposes of diffusion of RE utilization Self-sufficiency To reduce consumption of fossil fuels and increase thedependency of indigenous resources
Balancing trade-off To help to economic and technologic growth of the regionsSustainability To reduce pollution and environmental impacts
Characters To identify main stakeholders affect public policies andprocess of decision-making
Participatory decision-making To have the supports of the community organizations andcitizens
Inter-departmentalcommittees
To have a comprehensive and coordinative decision making
Authority of regional offices To increase the role of regionals (municipalities) in decision-making
Objectives To show different perspectives of diffusion of RE Energy security anddiversification
To reduce the dependency to the external resources (energyimports)
Energy efficiency To produce specific amount of services using less energyEconomic efficiency – Technical efficiency
– Allocative efficiencyCO2 reduction To minimize CO2 emissions from fossil fuel burning caused
by human activities
Keyschemes
To describe different policies or regulations related todiffusion of RERs utilization
Energy financing To direct government investment on the RE technologiesand efficiency solutions
Energy taxes To curb the growth of energy consumptionOpen energy market To make RE utilization competitiveEncouragement packages andgreen certificates
To improve the knowledge and awareness of the citizensabout RERs
Administration of research To manage research and R&D fundsInternational cooperation To share and crate the knowledgeFeed-in-tariff To accelerate investment in RE utilization
Fig. 4. System dynamics methodology.
A. Aslani et al. / Applied Energy 113 (2014) 758–765 761
as development of RE utilization, energy conservation policies, andother schemes [10]. These polices consist different packagesincluding direct investments, tax/tariffs packages, and otherencouragement policies. For instance, government investments orencouraging private sector to participate in RE development pro-grams helps to speed RE diffusion programs [37,38]. Therefore, dif-fusion programs positively influence on number of installedrenewable systems and capacity of renewable systems. This notonly decreases the energy dependency on external sources, itbrings new opportunities for creating new businesses and employ-ment that provide economic growth and social welfare. On theother hand, the depreciation period of a renewable system has neg-
ative effect on dependency after a period (�) (e.g., 20 years forwind power plants). It also affects negatively on capacity of REsystems.
4. Dynamic analysis of renewable energy utilization plans inenergy dependency of Finland
Due to the above causal feedback loop, a system dynamics mod-el is constructed to evaluate the effect of RERs on Finnish energydependency during 2011–2020. According to the Finland’s nationalaction plan for promoting RE (document number: 2009/28/EC),
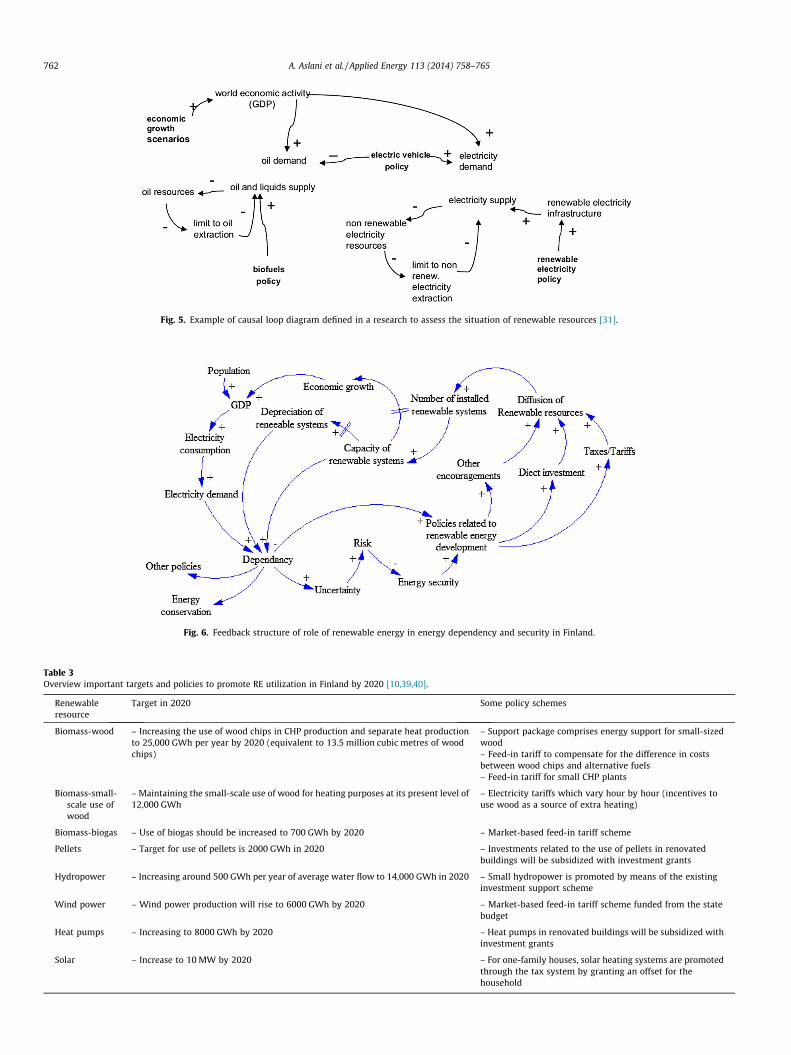
Fig. 5. Example of causal loop diagram defined in a research to assess the situation of renewable resources [31].
Fig. 6. Feedback structure of role of renewable energy in energy dependency and security in Finland.
Table 3Overview important targets and policies to promote RE utilization in Finland by 2020 [10,39,40].
Renewableresource
Target in 2020 Some policy schemes
Biomass-wood – Increasing the use of wood chips in CHP production and separate heat productionto 25,000 GWh per year by 2020 (equivalent to 13.5 million cubic metres of woodchips)
– Support package comprises energy support for small-sizedwood– Feed-in tariff to compensate for the difference in costsbetween wood chips and alternative fuels– Feed-in tariff for small CHP plants
Biomass-small-scale use ofwood
– Maintaining the small-scale use of wood for heating purposes at its present level of12,000 GWh
– Electricity tariffs which vary hour by hour (incentives touse wood as a source of extra heating)
Biomass-biogas – Use of biogas should be increased to 700 GWh by 2020 – Market-based feed-in tariff scheme
Pellets – Target for use of pellets is 2000 GWh in 2020 – Investments related to the use of pellets in renovatedbuildings will be subsidized with investment grants
Hydropower – Increasing around 500 GWh per year of average water flow to 14,000 GWh in 2020 – Small hydropower is promoted by means of the existinginvestment support scheme
Wind power – Wind power production will rise to 6000 GWh by 2020 – Market-based feed-in tariff scheme funded from the statebudget
Heat pumps – Increasing to 8000 GWh by 2020 – Heat pumps in renovated buildings will be subsidized withinvestment grants
Solar – Increase to 10 MW by 2020 – For one-family houses, solar heating systems are promotedthrough the tax system by granting an offset for thehousehold
762 A. Aslani et al. / Applied Energy 113 (2014) 758–765

Fig. 7. The system dynamics model of renewable application policies in Finland.
Fig. 8. Electricity/heat consumption demand in Finland.
A. Aslani et al. / Applied Energy 113 (2014) 758–765 763
Finland should have 77,000 GWh electricity/heat utilized by RERsby 2020 [39]. For instance, electricity generated by wind powershould be raised to 6000 GWh by 2020. As noted in Table 3, toachieve this target, feed-in tariff and other promotional schemeshave been introduced. For instance, feed-in tariffs are equivalentto the difference between the guaranteed price provided for bylaw and the actual market price of electricity. The target price byfeed-in tariff is EUR83.50 per MWh, but until the end of 2015 thetarget price for electricity generated by wind power should beEUR105.30 MWh (feed-in tariff is paid for maximum of 3 years)[10]. Table 3 reviews some of the important policies and targetsfor RE development by 2020 in Finland.
Fig. 7 shows the system dynamics model for RE policy inFinland to analyze the level of dependency (GWh). There are sixstocks in the proposed system dynamics model for RE policy inFinland including electricity/heat demand, capacity of Biomasselectricity/heat, capacity of hydropower electricity, capacity of so-lar electricity/heat, capacity of wind power electricity, and capacityof geothermal electricity/heat. Total amount of electricity/heatgenerated by RERs is the sum of capacity of each RER. As figureillustrates, the capacity of each RER influenced by current operat-ing electricity/heat generated by renewables and new installations(based on the policies and plans), as well as decreased number ofRER systems affected by delay time (depreciation). This researchassumes that the depreciation periods of RER systems are 20 yearsfor solar, 25 for wind, 25 years for geothermal, 30 years for biomassplants, and 15 years for small hydropower. The number ofincreased RER systems (rates in the system dynamics model) aredirectly affected by plans and government policies discussed inSection 2 and Table 3.
Therefore, dependency on external energy resources (imports)in order to response to the heat/electricity demands, is the
difference between electricity/heat generated by nuclear andrenewable and electricity/heat demand.
4.1. Simulation results
Fig. 8 illustrates the electricity/heat demand (prediction) inFinland during 2011–2020. The prediction is based on the Finland’saction plans multiplied by especial factor for electricity/headdemand growth (affected by criteria such as weather conditionsand economic growth). As Fig. 8 shows, the electricity/heatconsumption will arise from 265,959 GWh in 2012 to285,177 GWh in 2020 (7.2% growth).
Next, the amount of dependency in each year is calculatedbased on the three different policy scenarios as following:

Fig. 9. Dependency based on the first scenario.
Fig. 10. Dependency based on the second scenario.Table 4Amount of dependency and saving by renewable energy action plan in Finland ($).
Scenario
1 2 3
Dependency($)
2011 11,448,928,400 11,448,928,400 11,448,928,4002013 11,864,027,000 11,796,799,000 11,810,244,6002020 10,929,009,000 10,268,939,800 10,405,110,800
Saving ($)comparedto firstscenario
2011 – – –2013 – 67,228,000 53,782,4002020 – 660,069,200 523,898,200
764 A. Aslani et al. / Applied Energy 113 (2014) 758–765
1. Before promoting renewable policies and implementing actionplan (current operating systems without installations in thefuture).
2. After 100% implementation of RE action plan.3. After implementation of 90% biomass, 50% hydropower, 80%
wind, 100% geothermal, and 50% solar action plans (designedbased on the experts’ opinions).
Figs. 9–11 show the simulation results of dependency based oneach scenario.
Fig. 11. Dependency based
The first scenario is a criteria to compare with other scenarios.This scenario helps to analyze the effects of each energy policyon dependency with an appropriate validity. According to the firstscenario, the amount of electricity/heat generated by RE will befixed during 2012–2020 (total: 23,710 GWh). Therefore, the energydependency will increase by 2013 (172,945 GWh). Since a new nu-clear power plant with 1550 MW capacity starts to work in 2013,the dependency will decrease in 2014, but again it will increaseto 159,315 GWh in 2020.
The second scenario is based on the action plan defined by Finn-ish government (Fig. 10). According to this scenario, dependencydecreases to 171,965 GWh in 2013 and 149,693 GWh in 2020. Thismeans, despite energy consumption growth (around 3% per year)Finland’s dependency will decrease 1% in 2013, and 7% comparedto first scenario by 2020. Indeed, while the electricity/heat demandincreases around 9% during the period of 2011–2020, the amountof dependency will decrease around 11%.
The third scenario (conservative scenario) is designed based onthe expert’s opinions and trend of RE projects in the last 10 years inFinland. Several factors such as investments, economic crisis, bankinterests, and estimation errors affect the action plan of RE devel-opment in Finland. Therefore, the achievements in 2020 woulddecrease based on 90% biomass, 50% hydropower, 80% wind,100% geothermal, and 50% solar. As Fig. 10 illustrates, the amountof energy dependency in Finland in 2013 and 2020 will be172,161 GWh and 151,678 GWh (0.4% and 5% decrease comparedto the first scenario).
Table 4 shows the amount of energy dependency ($) and savingin each scenario in 2 years of 2013, and 2020. Since the mostdependency of Finnish fossil fuels power plant is natural gas, thecosts of dependency is compared based on the average natural
on the third scenario.
A. Aslani et al. / Applied Energy 113 (2014) 758–765 765
gas price estimated by US department of energy for advanced com-bustion turbine power plans in 2018 (68.2$/MWh) [34]. This is notincluded other costs including capital costs, transmission costs,operation and maintenance costs (fixed costs), and emission pricescosts.
5. Conclusion
Many countries in particular import-dependent countries havemade efforts to be effective in management of energy supply.Due to the various effective factors, security of energy supply ischaracterized as a complex system. This study provided a system-atic research to evaluate the role of renewable energy resources (asa portfolio) for electricity/heat generation in Finland. Therefore, acausal feedback diagram and a system dynamics model were con-structed to reveal the relationships between the dynamic factors ofenergy security and dependency, and the effects of renewable en-ergy promotion policies. Therefore, three scenarios were intro-duced to assess role of renewable energy plans on dependency.Results showed that implementation of energy actions plans to in-stall new renewables capacities brings more than 4billion dollarsaving for natural gas imports (from 67.2 million dollar in 2013to 660 million dollar in 2020).
For future research, the created system dynamics model can beimplemented in other countries and the results can be comparedwith current work. Further, the total costs of renewable energydevelopment in Finland can be compared with other sources alongwith risk analysis to indicate the strength and weaknesses of therenewables. Finally, accurate analysis of each of the parametersof renewable energy utilization, strategies for cost reduction via is-sues such as combination of markets, tax, and regulatory incen-tives are subjects that are suggested by authors.
References
[1] Brown MH, Rewey Ch, Gagliano T. In: Energy security, national conference ofstate legislatures. Washington, DC; 2001.
[2] Aslani A, Helo P, Feng B, Antil E, Hiltunen E. Renewable energy supply chain inOstrobothnia region and Vaasa city: innovative framework. Renew SustainEnergy Rev 2013;23:405–11. http://dx.doi.org/ 10.1016/j.rser.2013.03.012.
[3] Mathiesen Brian Vad, Lund Henrik, Karlsson Kenneth. 100% Renewable energysystems, climate mitigation and economic growth. Appl Energy2011;88(2):488–501. ISSN: 0306-2619, 10.1016/j.apenergy.2010.03.001.
[4] Dybvig P, Ross SA. State prices and portfolio theory, handbook of theeconomics of finance; 2010 [chapter 10].
[5] IEA. Energy securities and climate policy: assessinginteractions. Paris: Information Paper International Energy Agency; 2004.
[6] Nagy Karoly, Körmendi Krisztina. Use of renewable energy sources in light ofthe ‘‘New Energy Strategy for Europe 2011–2020. Appl Energy 2012;96:393–9.ISSN: 0306-2619, 10.1016/j.apenergy.2012.02.066.
[7] Lean Hooi Hooi, Smyth Russell. Are fluctuations in US production of renewableenergy permanent or transitory? Appl Energy 2013;101:483–8. ISSN: 0306-2619, 10.1016/j.apenergy.2012.06.022.
[8] Aslani A, Antila E, Wong KFV. Comparative analysis of energy security in theNordic countries: the role of renewable energy resources in diversification. JRenew Sustain Energy 2012;4(6):062701. http://dx.doi.org/10.1063/1.4765695.
[9] IEA Wind. In: Annual reports – Finland; 2011. <http://www.ieawind.org/annual_reports_PDF/2011/Finland.pdf>.
[10] Statistics Finland. Energy supply and consumption, statistical, database; 2013.[11] World bank report. Data base, Finland; 2013.[12] Aslani A, Naaranoja M, Helo P, Antila E, Hiltunen E. Energy diversification in
Finland: achievements and potential of renewable energy development. Int JSustain Energy 2013; [in press], http://dx.doi.org/10.1080/14786451.2013.766612.
[13] Aslani A, Mohaghar A. Business structure in renewable energy industry: Keyareas. Renewable and Sustainable Energy Reviews 2013;27:569–75.
[14] Aslani A, Naaranoja M, Wong KFV. Strategic analysis of diffusion of renewableenergy in the Nordic countries. Renew Sustain Energy Rev 2013;22:497–505.http://dx.doi.org/10.1016/j.rser.2013.01.060.
[15] Russell L. Ackoff. Systems thinking for curious managers. Triarchy Press; 2010.ISBN: 978-0-9562631-5-5.
[16] Michael J. Radzicki, Robert A. Taylor. Origin of system dynamics: Jay W.Forrester and the history of system dynamics. In: US Department of Energy’sIntroduction to System Dynamics; 2008. [retrieved 23, 2008].
[17] Sushil. System dynamics: a practical approach for managementproblems. Wiley Eastern Ltd.; 1993.
[18] Morecroft JDW. A critical review of diagramming tools for conceptualizingfeedback system models. Dynamica – Part 1 1982;8.
[19] Chi KCh, Nuttall WJ, Reiner DM. Dynamics of the UK natural gas industry:system dynamics modeling and long-term energy policy analysis. TechnolForecasting Soc Change 2009;76:339–57.
[20] Naill RF. Managing the energy transition: a system dynamics search foralternatives to oil and gas. Cambridge, MA: Ballinger Publishing Company;1977.
[21] Naill RF. The discovery life cycle of a finite resource: a case study of US naturalgas. In: Meadows DL, editor. Toward global equilibrium: collectedpapers. Cambridge, MA: MIT Press; 1973.
[22] Connolly D, Lund H, Mathiesen BV, Leahy M. A review of computer tools foranalysing the integration of renewable energy into various energy systems.Appl Energy 2010;87(4):1059–82.
[23] Feng YY, Chen SQ, Zhang LX. System dynamics modeling for urban energyconsumption and CO2 emissions: A case study of Beijing-China. EcologicalModelling 2013;252:44–52.
[24] Trappey AJC, Trappey ChV, Gilbert L, Chang Y. The analysis of renewableenergy policies for the Taiwan Penghu island administrative region. RenewSustain Energy Rev 2012;16(1):958–65.
[25] Anand S, Vrat P, Dahiya RP. Application of a system dynamics approach forassessment and mitigation of CO2 emissions from the cement industry. JEnviron Manage 2005;79:383–98.
[26] Jin W, Xu L, Yang Z. Modeling a policy making framework for urbansustainability: incorporating system dynamics into the ecological footprint.Ecol Econ 2009;68(12):2938–49.
[27] Han J, Hayashi Y. A system dynamics model of CO2 mitigation in China’s inter-city passenger transport. Transport Res Part D: Transport Environ2008;13(5):298–305.
[28] Shin J, Shin WS, Lee Ch. An energy security management model using qualityfunction deployment and system dynamics. Energy Policy 2013;54:72–86.
[29] Wu J-H, Huang Y-L, Liu C-C. Effect of floating pricing policy: an application ofsystem dynamics on oil market after liberalization. Energy Policy2011;39:4235–52.
[30] Hsu CH-W. Using a system dynamics model to assess the effects of capitalsubsidies and feed-in tariffs on solar PV installations. Appl Energy2012;100:205–17.
[31] Mediavilla M, Castro C, Capellan I, Miguel L, Arto I, Frechoso F. The transitiontowards renewable energies: physical limits and temporal conditions. EnergyPolicy 2013;52:297–311.
[32] Krutilla K, Reuveny R. The systems dynamics of endogenous populationgrowth in a renewable resource-based growth model. Ecol Econ2006;56(2,15):256–67.
[33] Bennett SJ. Using past transitions to inform scenarios for the future ofrenewable raw materials in the UK. Energy Policy 2012;50:95–108.
[34] US Department of Energy. Energy information administration, levelized cost ofnew generation resources in the annual energy outlook; 2013. <http://www.eia.gov/forecasts/aeo/electricity_generation.cfm>.
[35] Lee Ch, Chang ChP. Energy consumption and GDP revisited: a panel analysis ofdeveloped and developing countries. Energy Econ 2007;29:1206–23.
[36] Narayana PK, Prasad A. Electricity consumption real GDP causality nexus:evidence from a bootstrapped causality test for 30 OECD countries. EnergyPolicy 2008;36:910–8.
[37] Aslani A, Naaranoja M, Zakeri B. The prime criteria for private sectorparticipation in renewable energy investment in the Middle East (casestudy: Iran). Renew Sustain Energy Rev 2012;16(4):1977–87. http://dx.doi.org/10.1016/j.rser.2011.12.015.
[38] Aslani A. Private sector investment in renewable energy utilization: strategicanalysis of stakeholder perspectives in developing countries. Int J SustainEnergy 2013; DOI:10.1080/14786451.2012.751916 [in press].
[39] Finland’s national action plan for promoting energy from renewable sourcespursuant to Directive 2009/28/EC. In: Ministry of employment and theeconomy report, energy department; 2010.
[40] Finland’s national action plan for promoting energy from renewable sourcespursuant to directive (summery). In: Ministry of employment and theeconomy report, energy department; 2010.