role of the australian paediatric surveillance unit in monitoring communicable ... ·...
TRANSCRIPT

Role of the Australian PaediatricSurveillance Unit in monitoring
communicable diseases ofchildhood
Katrina Williams,1 Elizabeth Elliott2
AbstractThe Australian Paediatric Surveillance Unit (APSU) conducts active national surveillance ofconditions affecting children, including communicable diseases and their complications. Bymailing over 900 clinicians each month the APSU gathers national information, not available fromother sources, about the incidence, demographic and clinical features of these conditions. In someconditions APSU data supplements that available from existing schemes. The APSU hasmonitored 20 conditions to date. Eight of these are communicable diseases or their complications,two have a possible infectious aetiology and one frequently presents with infection. Since itsinception in 1993 the return rate of monthly report cards by the mailing list has increased from 88per cent to 94 per cent. Return rate of questionnaires for the communicable diseases studiedranged from 74 per cent to 100 per cent. Studies have enabled estimation of disease incidence,identification of risk factors and possible preventive strategies and provision of detailed clinicalinformation. Although the APSU cannot serve a public health role by case identification andcontact tracing it provides information that contributes to the communicable disease strategy forAustralia. Comm Dis Intell 1998;22:283-287
ISSN 0725-3141
Volume 22Number 1324 December 1998
ContentsRole of the Australian Paediatric Surveillance Unit in monitoring communicable diseases ofchildhood 283
Katrina Williams, Elizabeth Elliott
Resistance in gonococci isolated in the WHO Western Pacific Region to various antimicrobials used in the treatment of gonorrhoea, 1997 288
Prepared by the WHO Western Pacific Gonococcal Antimicrobial Surveillance Programme
CDI Subject index, 1998 292
CDI Author index 1998 295
CDI Reviewers, 1997 296
Shigella at a wake in Adelaide, June 1998 297
Rod Givney, Jack Darzenos, Dianne Davos
Communicable Diseases Surveillance 298
Overseas briefs 305
1. Assistant Director APSU, Lecturer, University of Sydney and Clinical Epidemiology Unit, New Children’s Hospital, Sydney
2. Director APSU, Senior Lecturer, Department of Paediatrics and Child Health, University of Sydney, Consultant Paediatrician, NewChildren’s Hospital, Sydney
Corresponding author, Dr Elizabeth J Elliott, Director, The Australian Paediatric Surveillance Unit, Level 2, Clinical SciencesBuilding, New Children’s Hospital, PO Box 3515, Parramatta NSW 2124

IntroductionThe APSU, modelled on a similar scheme in Britain,1 wasestablished in 1992 with the aims shown in Figure 1.Since May 1993 it has conducted active nationalsurveillance of conditions affecting children, includingselected communicable diseases and their complications.Some of these are vaccine preventable. All result inconsiderable morbidity or mortality. For most, no data haspreviously been available to allow estimation of nationalincidence or provide a picture of current management oroutcome. For other conditions the APSU provides dataadditional to that available through existing schemes.
MethodsInformation about APSU activities and individual studies isavailable in the 1997 annual report.2 Each month clinicians on the mailing list are sent either a reply-paid report cardor an e-mail which they are asked to return, indicatingeither the number of cases of listed conditions they haveseen in the previous month or that they have “nothing toreport” (Figure 2). A principal investigator is identified foreach condition, and each principal investigator is notifiedmonthly by the APSU of positive case reports and provided with contact details for the reporting doctor. The principalinvestigator is then responsible for obtaining demographicand clinical data on the case from the reporting doctor bypostal questionnaire; for collating, presenting andpublishing data and for regular feedback of information topaediatricians and the APSU. No identifying patient detailsare requested by the APSU or the researcher. Duplicatereports are detected by a unique identifier code.
The mailing list comprises nearly 900 paediatricians,paediatric subspecialists and other clinicians who workpredominantly with children (eg paediatric surgeons,ophthalmologists and community child health clinicians).The mailing list attempts to include all paediatricians andother doctors who see children with the type of rare andserious conditions monitored through the APSU and whocan ascertain cases seen as both outpatients and hospitalinpatients.
Individuals or organisations may apply to study a conditionthrough the APSU and applications undergo a process ofpeer review and revision before being listed on the monthly
report card. To satisfy the criteria for study, a conditionmust be sufficiently uncommon that the system is notover-burdened; must invariably result in referral to apaediatrician or related specialist and must provideinformation that satisfies the study aims and that is notavailable from other sources. Conditions are usuallystudied for three years, although provision for on-goingstudy may be granted for diseases of public healthsignificance and for those for which case numbers are low.
Estimated annual incidence has been calculated from valid (confirmed and probable) cases notified to the end of1997. For incidence calculated per 100,000 births, onlycases born in Australia have been included.
Results Overview
The development and infrastructure funding for APSU hasbeen derived primarily from competitive research grantstotalling about $340,000 for 1993-1998 inclusive.Additional funding for communicable diseases studies hasbeen received from the Commonwealth Department ofHealth and Aged Care or its precursors ($32,000). TheNSW Department of Health ($10,000), the National Centrefor HIV Epidemiology and Clinical Research ($10,000) and industry ($25,000) have also provided funding. The totalAPSU budget for 1997 was approximately $100,000including salaries of three part-time administrators/researchers ($73,000), postage ($11,000), printing($7,000) and costs of the annual scientific meeting.Funding for the time spent by the Director and AssistantDirector in APSU activities is not included in the budgetbecause their salaries are provided by the University ofSydney and the New Children’s Hospital. Establishing anew condition to be monitored through the APSU incurs no additional real cost because the time of reviewers and
284 CDI Vol 22, No 13 24 December 1998
Article
Figure 1. Aims of the APSU
Primary aim:
• To accurately document the number of Australianchildren with specific diseases (or complications ofdiseases), their geographic distribution, clinicalfeatures, current management and outcome
Secondary aims:
• To provide a mechanism for national collaborativeresearch
• To issue updated clinical and diagnostic informationto clinicians caring for children with specificconditions being studied
• To disseminate information acquired by the unitwhich will guide best practice, appropriate prevention strategies and optimal health resource allocation
Paediatrician
APSU
Report card detailsentered on APSU database
Positive case report(s)
Investigator
Data analysed and reports prepared
yearly reports for APSU
feedback to paediatrician
monthly report cardregularfeedback
Nothing to report
Figure 2. How the APSU works
APSU directors is unpaid. Investigators are asked toensure that adequate funding is available to undertaketheir planned research. The amount of money required for mailing and research time varies for each investigatordepending on the frequency of notifications for thecondition they are monitoring.
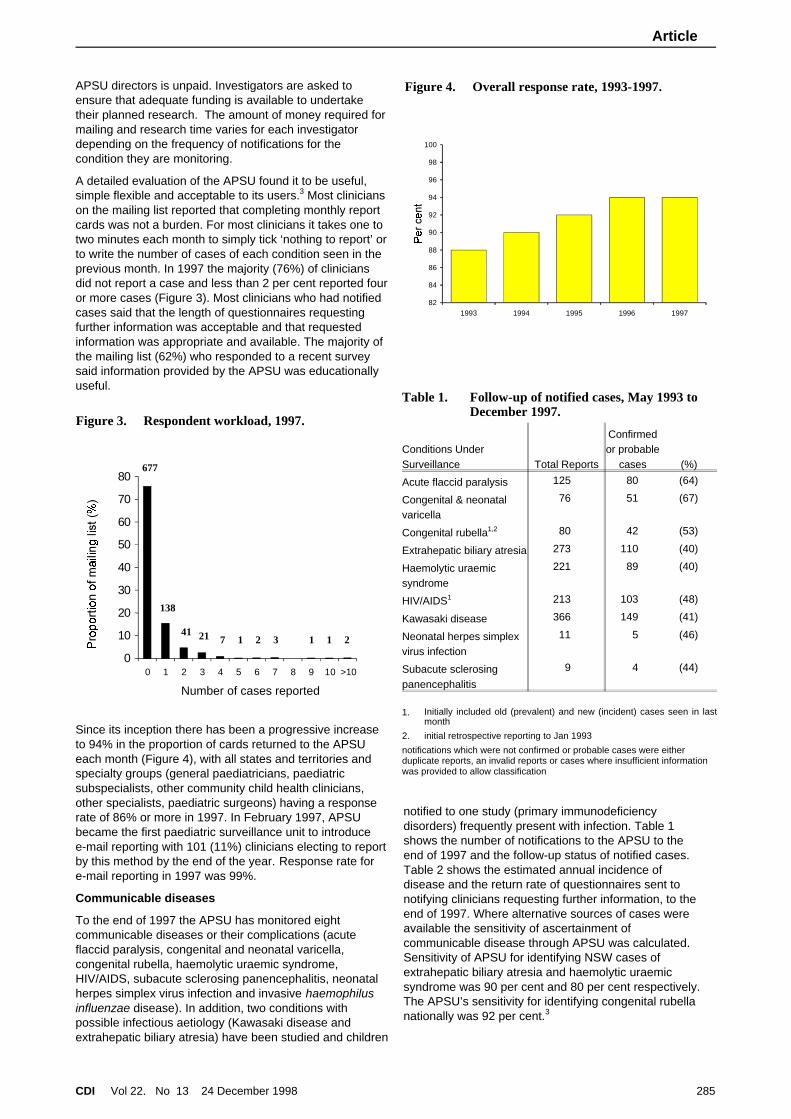
A detailed evaluation of the APSU found it to be useful,simple flexible and acceptable to its users.3 Most clinicians on the mailing list reported that completing monthly reportcards was not a burden. For most clinicians it takes one totwo minutes each month to simply tick ‘nothing to report’ or to write the number of cases of each condition seen in theprevious month. In 1997 the majority (76%) of cliniciansdid not report a case and less than 2 per cent reported four or more cases (Figure 3). Most clinicians who had notifiedcases said that the length of questionnaires requestingfurther information was acceptable and that requestedinformation was appropriate and available. The majority ofthe mailing list (62%) who responded to a recent surveysaid information provided by the APSU was educationallyuseful.
Since its inception there has been a progressive increaseto 94% in the proportion of cards returned to the APSUeach month (Figure 4), with all states and territories andspecialty groups (general paediatricians, paediatricsubspecialists, other community child health clinicians,other specialists, paediatric surgeons) having a responserate of 86% or more in 1997. In February 1997, APSUbecame the first paediatric surveillance unit to introducee-mail reporting with 101 (11%) clinicians electing to report by this method by the end of the year. Response rate fore-mail reporting in 1997 was 99%.
Communicable diseases
To the end of 1997 the APSU has monitored eightcommunicable diseases or their complications (acuteflaccid paralysis, congenital and neonatal varicella,congenital rubella, haemolytic uraemic syndrome,HIV/AIDS, subacute sclerosing panencephalitis, neonatalherpes simplex virus infection and invasive haemophilusinfluenzae disease). In addition, two conditions withpossible infectious aetiology (Kawasaki disease andextrahepatic biliary atresia) have been studied and children
notified to one study (primary immunodeficiencydisorders) frequently present with infection. Table 1shows the number of notifications to the APSU to theend of 1997 and the follow-up status of notified cases.Table 2 shows the estimated annual incidence ofdisease and the return rate of questionnaires sent tonotifying clinicians requesting further information, to theend of 1997. Where alternative sources of cases wereavailable the sensitivity of ascertainment ofcommunicable disease through APSU was calculated.Sensitivity of APSU for identifying NSW cases ofextrahepatic biliary atresia and haemolytic uraemicsyndrome was 90 per cent and 80 per cent respectively.The APSU’s sensitivity for identifying congenital rubellanationally was 92 per cent.3
CDI Vol 22, No 13 24 December 1998 285
Article
0
10
20
30
40
50
60
70
80
0 1 2 3 4 5 6 7 8 9 10 >10
Number of cases reported
677
138
41 21 1 2 3 1 1 27
Figure 3. Respondent workload, 1997.
82
84
86
88
90
92
94
96
98
100
1993 1994 1995 1996 1997
Figure 4. Overall response rate, 1993-1997.
Table 1. Follow-up of notified cases, May 1993 toDecember 1997.
Conditions UnderSurveillance Total Reports
Confirmedor probable
cases (%)
Acute flaccid paralysis 125 80 (64)
Congenital & neonatalvaricella
76 51 (67)
Congenital rubella1,2 80 42 (53)
Extrahepatic biliary atresia 273 110 (40)
Haemolytic uraemicsyndrome
221 89 (40)
HIV/AIDS1 213 103 (48)
Kawasaki disease 366 149 (41)
Neonatal herpes simplexvirus infection
11 5 (46)
Subacute sclerosingpanencephalitis
9 4 (44)
1. Initially included old (prevalent) and new (incident) cases seen in lastmonth
2. initial retrospective reporting to Jan 1993
notifications which were not confirmed or probable cases were eitherduplicate reports, an invalid reports or cases where insufficient informationwas provided to allow classification

The acute flaccid paralysis study has provided amechanism for Australia to participate in the global effortby the WHO to eradicate poliomyelitis and declareAustralia polio-free.4 This study, conducted by the National Centre for Disease Control in the Department of Healthand Family Services, aims to identify all cases of acuteflaccid paralysis and, through stool examination, sixty dayfollow-up and case review by an expert panel (the National Certification Committee), to exclude poliomyelitis as thecause. The rate of AFP identified is around the expected1/100 000 and over half of children identified wereconfirmed as having Guillain-Barré syndrome. No cases ofpoliomyelitis have been confirmed. However, inadequateprovision of information has meant that it has not beenpossible to exclude poliomyelitis in all cases.
Monitoring cases of haemolytic uraemic syndrome (HUS)with simultaneous examination of stool and serum fromcases has given clinicians throughout Australia access tospecialised centralised laboratory techniques and hasidentified the heterogeneous range of organismsresponsible for HUS. Information from this study hascontributed to efforts to prevent and control HUS includingchanges to the code for the manufacture of fermentedmeat products; requirement for notification of HUS casesto state health departments; and public education aboutfood storage and preparation.5
The APSU provides a source of reporting of cases ofperinatal exposure to HIV and cases of diagnosed HIVinfection in children.6 This supplements mandatoryreporting of cases of diagnosed HIV infection and AIDS tostate and territory health authorities. In 28 (46%) cases ofperinatal exposure reported in Australia between 1994 and 1997, the APSU was the only source of case notification.Preventive interventions to reduce the risk of mother tochild transmission, such as uptake of zidovudine duringpregnancy and avoidance of breast-feeding, are being
monitored among women diagnosed with HIV infectionprior to delivery.
Although clinicians are asked to report any new case ofHIV or AIDS in a child under 16 years of age, allnotifications since 1995 have been cases of perinatalexposure. No new diagnoses due to blood transfusion inchildren born in Australia have been reported since 1990.All such products were given prior to 1985.7
A study of congenital and neonatal varicella has allowedassessment of the burden and clinical spectrum ofcongenital and neonatal varicella infection prior to theavailability in Australia of varicella vaccination, which iscurrently being trialed in infancy. Data from this study hasidentified that congenital varicella is more common thanpreviously recognised in Australia.8 This may reflectincreased recognition of a condition following a request fornotification. Presentation may be with disseminated herpes zoster early in life and the range of defects includes skinscarring, central nervous system, cardiac and oculardeformity.
In the study of congenital rubella, comparison withpopulation data confirmed that children born in Australia in1995 and 1996 to mothers born outside Australia were atan increased risk of being affected. The need to payparticular attention to the vaccination status of thissubgroup of women and to adequately investigate womenwith symptoms consistent with infection in pregnancy areseen as important preventive strategies.
Subacute sclerosing panencephalitis, though rare,continues to occur and the APSU is providing amechanism to monitor this most devastating complicationof measles. There may be an underascertainment of cases through the APSU because clinicians are asked to reportonly those diagnosed under the age of 16 years and olderchildren may present to adult physicians.
The study of neonatal herpes simplex virus infection(neonatal HSV) aims to determine its incidence, morbidityand mortality in Australia, its modes of presentation andthe timeliness of therapeutic intervention. In 1997, fivecases were identified, all with disseminated rather thanlocal (eye, skin or mouth) disease. Three cases hadinvolvement of the central nervous system.
It has been suggested that a subgroup of extrahepaticbiliary atresia may be due to an infectious agent. TheAPSU study has confirmed a seasonal (winter) distributionof cases that would be consistent with an infectiousaetiology. It has also provided an estimate of the nationalrequirement for paediatric liver transplantation andconfirmed that late diagnosis is a risk factor for worseprognosis.9
Similarly the cause of Kawasaki disease has not yet beendetermined. Information from surveillance through theAPSU has contributed to a developing literature about therole of streptococcal infection and highlighted diagnosticdilemmas for clinicians which may contribute to suboptimal management of this condition.10 This study has alsoidentified limitations of international disease classificationsystems and the effect of these on outcomes.
Invasive H. influenzae disease was monitored fromJanuary 1998. This study aims to provide an additionalsource of notification of cases of invasive H. influenzaedisease in children and to determine the proportion of
286 CDI Vol 22, No 13 24 December 1998
Article
Table 2. Estimated annual incidence ofcommunicable diseases monitored, to theend of 1997.
ConditionQuestionnaireresponse (%)
Incidence/100,000
95%Confidence
Interval
Acute flaccid paralysis* 83 0.7 0.6, 0.9
Varicella Congenital# 95 0.8 0.2, 1.4
Neonatal 5.8 2.8, 7.8
Congenital rubella (withdefects)
97 1.5 0.9, 2.4
HUS* ( years) 98 1.4 1.1, 1.8
Perinatal HIV exposure 88 5.6 4.4, 7.2
Neonatal herpes simplex(HSV) infection
100 2.0 0.7, 4.9
Kawasaki disease (years)*
74 3.7 3.6, 3.8
Extrahepatic biliaryatresia
92 5.4 4.0, 7.0
SSPE* 100 0.03 0.01, 0.09
* incidence is per 100,000 children aged less than 15 years; all otherfigures are expressed per 100,000 births

cases of invasive H. influenzae disease which are due tovaccine failure. Information obtained through the APSUhas provided details about both clinical and laboratory riskfactors which are not available from laboratory ormandatory reporting schemes. Whether H. influenzaeisolates from cases that are due to vaccine failure differfrom those that are not due to vaccine failure is yet to bedetermined.
DiscussionAfter five years active surveillance the APSU is functioning well. High return rates of monthly report cards andquestionnaires and feedback received from users during arecent evaluation confirm that the scheme is acceptable toits users. It is a simple and relatively cheap system to run.It is difficult to determine the cost-benefits of this system.However, direct costs are low, especially consideringAPSU facilitates simultaneous monitoring of severalconditions. The APSU is not a disease register, but ananonymous case-finding system. It is neither sufficientlytimely, nor has the resources or the expertise to functionas a public health unit in following up disease contacts ortracing infective sources.
Studies conducted through the APSU on communicableand related diseases have provided previously unavailable national data that have allowed estimation of the incidence of these uncommon but important conditions as well asproviding demographic and comprehensive clinicalinformation. Some studies have identified risk factors, have determined the spectrum of morbidity and mortality, haveidentified current management or have providedinformation on factors affecting short-term outcome. Others have generated hypotheses that may be tested byfurther research or identified potential cohorts of cases that may be used for follow-up and intervention trials. Inaddition, studies have allowed the evaluation of alternative methods of case-finding, estimation of sensitivity of theAPSU and highlighted problems with definition andclassification of disorders studied.
APSU achievements include the promotion of collaborative research between scientific disciplines and workers indifferent states and the provision of an interface betweenclinicians, public health units, health departments andother national bodies collecting data on communicablediseases. APSU is a unique system that overcomes statebarriers and allows prospective collection of national data.Availability of APSU data is more timely than that fromsome other systems, for many of which there are inherentadministrative delays. Active surveillance combined with ahigh response rate is maximising case ascertainment.High level of cooperation of clinicians may relate to theinformation provided to them by APSU.
We anticipate that APSU will make an increasing andvaluable contribution to monitoring communicablediseases in childhood in Australia in the future bycontinuing its current activities. Potentially it may alsoprovide a mechanism for rapid surveillance in the event ofan epidemiological emergency. This could be achieved byestablishing a fast track for inclusion of a new condition on
the card. APSU may also repeat previous studies toenable assessment of prevention strategies (eg newvaccines) or changes in disease patterns over time.Cohorts identified in APSU studies should be used forfurther research using follow-up, case-control andintervention methodologies.
AcknowledgmentsWe thank all contributors to the APSU for their ongoingsupport. We also thank Rennie D’Souza (Surveillance andManagement Section, National Centre for Disease Control, Dept of Health and Aged Care), Margaret Burgess(National Centre for Immunisation Research &Surveillance), Jeffrey Hanna (Tropical Public Health Unit,Cairns), David Isaacs (Department of Immunology &Infectious Diseases, New Children’s Hospital), AnnMcDonald (National Centre in HIV Epidemiology andClinical Research) and Peter McIntyre (National Centre forImmunisation Research & Surveillance and Department ofImmunology & Infectious Diseases, New Children’sHospital) for providing information on their studies to theAPSU. The APSU gratefully acknowledges financialsupport received from the Financial Markets Foundationfor Children, the National Centre for Disease Control of the Commonwealth Department of Health and Aged Care ofAustralia, the National Centre in HIV Epidemiology andClinical Research, Commonwealth Serum Laboratories,Victoria Health and the Department of Immunology andInfectious diseases at the New Children’s Hospital inSydney.
References 1. Hall SM, Glickman M. The British Paediatric Surveillance Unit.
Archives of Disease in Childhood 1988; 63:344-346.
2. Australian Paediatric Surveillance Unit. Fifth annual report1997, Editors Elliott E, Mildenhall S, Redmond D, Williams K,Peat J, Sydney 1998:
3. Williams K, Gazarian M, Chant K, Longbottom H, Mellis C,Nolan T, Oates RK, Ruben A, Elliott E, Contributors to theAPSU Evaluation of the Australian Paediatric SurveillanceUnit Archives of Disease in Childhood 1998; In Press
4. Herceg A, Kennett M, Antony J. Acute flaccid paralysissurveillance in Australia: the first year. CommunicableDiseases Intelligence 1996; 20:403-405.
5. Elliott E, Henning P, Hogg G, Knight J, O’Loughlin E, PowellH, et al. Haemolytic uraemic syndrome in Australia 1994-5.Communicable Diseases Intelligence 1995; 19:310-312.
6. McDonald AM, Cruickshank M, Ziegler JB, Elliott E, KaldorJM. Perinatal exposure to HIV in Australia, 1982-1994.Medical Journal of Australia 1997; 166:77-80.
7. McDonald AM, Elliott E, Cruickshank M, MacDonald M,Ziegler J. HIV in Australian children, 1993 and 1994.Communicable Diseases Intelligence 1995; 19:238-240.
8. Forrest JM, Burgess MA. Plotting the demise of congenitalrubella and varicella (editorial). Australian & New ZealandJournal of Public Health 1996; 20:4-6.
9. Elliott E, Davidson G, Dorney S, Redmond D, Smith A,Shepherd R, et al. Extrahepatic biliary atresia (EHBA) inAustralia 1993-6. Journal of Paediatrics and Child Health1997; 33:A36 Abstract.
10. Royle JA, Williams K, Elliott E, Sholler G, Nolan T, Allen R, etal. Kawasaki disease in Australia, 1993-1995. Archives ofDisease in Childhood 1998; In Press:
CDI Vol 22, No 13 24 December 1998 287
Article

Resistance in gonococci isolated in theWHO Western Pacific Region to variousantimicrobials used in the treatment of
gonorrhoea, 1997(Prepared by the WHO Western Pacific Gonococcal Antimicrobial Surveillance Programme - WHO WPR GASP)
SummaryThe World Health Organization Western Pacific RegionGonococcal Antimicrobial Surveillance Programme (WHOWPR GASP) is a multicentric long term programme ofcontinuous surveillance of the antibiotic susceptibility ofNeisseria gonorrhoeae. In 1997 the programme examinedthe susceptibility of 8,594 isolates of gonococci to variousantimicrobials in 15 focal points.
The trend toward increased antimicrobial resistance notedin earlier years continued. The proportion of quinoloneresistant gonococci reported from most centres was eithermaintained or else increased. More than half of theisolates tested in China - Hong Kong, China, Japan,Korea, and the Philippines had altered quinolonesusceptibility and increases in the number and percentageof quinolone resistant strains were noted in most, but notall, of the other centres.
Resistance to the penicillins was again widespread, andchromosomally mediated resistance was a significantfactor. Penicillinase-producing Niesseria gonorrhoeae(PPNG) were present in all centres.
All isolates were sensitive to the third generationcephalosporins and only a very few isolates in China werespectinomycin resistant.
High level tetracycline resistance was concentrated in anumber of centres including Singapore, Malaysia, thePhilippines and Vietnam. The proportion of tetracyclineresistant Neiserria gonorrhoeae (TRNG) in most of theremaining centres was less than 10 per cent.
IntroductionEffective treatment of gonorrhoea remains a priority forwell founded reasons including prevention of morbidity inindividual patients and reduction in the total diseaseburden associated with the disease. It is now alsoestablished that the rate of HIV transmission increases bythree to five times in the presence of gonorrhoea.1 Withproper treatment HIV transmission rates can be reducedby up to 40 per cent.2
Appropriate antibiotic regimens for treatment ofgonococcal disease may be established, modified andmade more relevant by data on gonococcal susceptibilitypatterns. The WHO has sought to establish a globalsurveillance network to monitor antibiotic resistance in thegonococcus - the Gonococcal Antimicrobial SurveillanceProgramme (GASP). Such a GASP network is useful notonly for the individual contributing countries and the
Regions, but also has wider application as an indicator ofemerging global resistance in Neisseria gonorrhoeae.3
The WHO WPR GASP commenced in 1992. Annualreports of WPR GASP findings have been published in avariety of sources designed to disseminate the data aswidely as possible.4-10 This report deals with datagenerated in the calendar year 1997.
MethodsData were generated by participants in focal points invarious countries throughout the WHO WPR and collatedin the regional reference laboratory. A list of participatingmembers of the programme is contained in theacknowledgements. These include countries with a smallgeographic area e.g. Singapore and China - Hong Kongwhere isolates were examined in a single centre. Datafrom other centres represents an analysis of strainsreferred throughout a country to a central setting as inMalaysia. Other countries (e.g. Australia, China) have anetwork of contributors supplying data from a nationalsurveillance scheme. A full description of the methodsused in the WPR GASP is available.9 Briefly, participantswere encouraged to examine susceptibility of gonococci toa recommended ‘core’ list of antibiotics using one of thestandard methods nominated by the programme. Aprogramme-specific quality assurance programme isconducted annually and a series of reference strainspertinent to the regional patterns of resistance were madeavailable. Because of resource limitations, not all isolatesare examined for sensitivity to all agents by all participants. Most strains examined are from non-selected sexuallytransmissible disease (STD) clinic patients, but some areobtained as a result of case finding.
ResultsApproximately 8,600 isolates were examined in 15 focalgroupings in 1997. Other centres were unable to supplydata but maintained contact with the programme throughparticipation in the quality assurance (QA) programme.Mongolia joined the programme in 1997, but data were not available from Brunei, Cambodia, Papua New Guinea orthe Solomon Islands in this period. About 44,000 strainshave been examined in this programme since 1992. Thesensitivity of isolates to selected antimicrobials is shown inTables 1 - 4.
Penicillins
The proportion of isolates resistant to the penicillin groupby one or mechanisms ranged between 3.5 per cent(Japan) and 95 per cent of isolates (Philippines) in the 15
288 CDI Vol 22, No 13 24 December 1998
Article

contributing centres. Particularly high levels of penicillinresistance were also recorded in Korea (91.3%), China -Hong Kong (66.4%), Vietnam (76.9%) and Singapore(62.3%) (Table 1).
The programme seeks to identify separately the extent ofpenicillin resistance manifested through plasmid-mediatedpenicillinase production (PPNG) or through chromosomally controlled intrinsic resistance [chromosomaly-mediatedresistant Neiserria gonorrhoeae (CMRNG)]. Both forms ofresistance may exist simultaneously in the one isolate, butthe latter type may be masked in PPNG.
PPNG were widely distributed throughout the WPR in 1997 but the proportion of PPNG was below 10% in a number of centres. PPNG were especially prominent in thePhilippines (81.8% of isolates), Korea (79%) Singapore(61.3%) Vietnam (64.1%) and Malaysia 41%). Anincreasing proportion of CMRNG has also been detectedover the life of the programme. In Hong Kong isolates ofthis type now represent 61.2 per cent of all isolates whilethe proportion of PPNG has declined to 5.2 per cent.
Quinolone antibiotics
About 8,400 isolates were examined for susceptibility tosecond generation quinolones in 12 centres in 1997 andquinolone resistant gonococci (QRNG) were detected in10. Separate categories of “less sensitive” and “resistant”(to the second generation agents) are included in Table 2because of their epidemiological relevance in long termstudies of the evolution of quinolone resistance. Thepattern of increasing quinolone resistance in gonococcifirst described in the WPR in 1993 and reinforced from1994 to 1996 was present again in 1997.
The proportion of ‘less sensitive’ isolates has increasedsignificantly in many centres since 1992, but there waslittle further change in 1997. The proportion of ‘lesssensitive’ strains remained particularly high in China(51.5%), Hong Kong (42.1%) and Korea (46.8%) in 1997.
In a large sample in Fiji and in a small one in Malaysia, noQRNG were detected.
Many centres reported an increase in the proportion ofresistant isolates in 1997 or else maintained the highnumbers seen in 1996. The highest proportions of fullyquinolone resistant isolates were seen in the Philippines(50%), Japan (41.2%), China - Hong Kong (38.6%), China(28.5%) and Korea (20.4%). In other centres the increasein fully developed QRNG was slower. In Australia resistantstrains account for 5.6 per cent of all isolates but most ofthese were concentrated in one city. The proportion ofQRNG more than doubled in New Zealand in 1997.
CDI Vol 22, No 13 24 December 1998 289
Article
Table 1. Penicillin sensitivity of strains of Neisseria gonorrhoeae isolated in countries in the WHO WPR in1997.
Country Number tested
PPNG CMRNG All Pen R
No % No % No %
Australia 2,817 180 6.4 36 12.8 541 19.2
China 908 101 11.0 406 44.0 507 55.0
Fiji 522 29 5.5 13 2.5 42 8.0
Hong Kong (China) 2,435 125 5.2 1,492 61.2 1,617 66.4
Japan 85 2 2.3 1 1.2 3 3.5
Korea 382 303 79.0 47 12.3 350 91.3
Malaysia 51 21 41.0 NT
Mongolia 20 4 20.0 NT
New Caledonia 16 0 1 6.0 1 6.0
New Zealand 309 23 7.4 22 7.1 45 14.5
Philippines 22 18 81.8 3 13.6 21 95.4
Singapore 691 424 61.3 5 1.0 429 62.3
Tonga 9 2 22.0 2 22.0 4 44.0
Vanuatu 171 28 16.4
Vietnam 156 100 64.1 20 12.8 120 76.9
Table 2. Quinolone resistance in strains of Neisseriagonorrhoeae isolated in countries in theWHO WPR in 1997
Country
Numbertested
Less susceptible Resistant
No. % No. %
Australia 2,817 46 1.6 158 5.6
China 903 468 51.5 257 28.5
Fiji 522 0 0 0 0
Hong Kong(China) 2,435 1,026 42.1 939 38.6
Japan 85 17 20.0 35 41.2
Korea 382 179 46.8 78 20.4
Malaysia 9 0 0
New Caledonia 16 3 18.0 0 0
New Zealand 309 18 5.8 6 1.9
Philippines 22 0 0 11 50.0
Singapore 691 33 4.8 26 3.8
Vietnam 152 5 3.3 5 3.3

Ceftriaxone
This third generation cephalosporin was used as therepresentative agent for this group of antibiotics in thisprogramme. No resistance to this agent was evident in1997. As in previous years, some evidence of increasingMIC levels was present in some centres.
Spectinomycin
Just over 5,000 isolates were examined in 10 centres in1997. Only in China was there a small number of resistantisolates. In particular, all 382 isolates tested in Korea weresensitive to this agent (Table 3).
High level tetracycline resistance (TRNG)
About 5,400 isolates were examined in 1997 in 10countries and TRNG were present in all of these centres.Particularly high proportions of TRNG were again seen inSingapore (82%), Malaysia (55%) and Vietnam (35.9%)continuing a pattern observed in earlier years. In all othercentres except the Philippines (45.4%) and New Caledonia
(12.5%), the proportion of TRNG was below 10 per cent ofisolates tested (Table 4).
DiscussionThere was a slight change in the composition of the focalpoints of the WHO WPR in 1997 with Mongolia joining thegroup. The Solomon Islands and Papua New Guinea wereunable to supply data in 1997 but will do so in 1998. Datafrom Brunei and Cambodia were not available. Howeverthe majority of the focal points have contributed datacontinuously for a number of years. This continuoussurveillance has facilitated analysis of the trends ingonococcal susceptibility in the region. The number ofisolates examined in 1997 was the highest number testedsince the programme began.
Particular interest is once more centred on emerginggonococcal resistance to the quinolone group ofantibiotics. In 1995 the position with regard to QRNG in the WPR was summarised as a steady increase in theproportion of resistant isolates since 1992 when very fewresistant isolates were observed.7 The change wasmanifested as an increasing number of centres reportingthe presence of these strains, an increasing number ofstrains showing quinolone resistance in those centres andincreasing MICs in resistant isolates. This was again thepattern in 1997 and QRNG are now widely dispersedthroughout the region.
It should be remembered that resistance to the quinolonesin gonococci is chromosomally mediated and levels ofresistance increase incrementally due to a number ofcomplementary alterations in the organism. The firstclinically manifested resistance observed was at a low MIC level and was accommodated by increasing therecommended dose of antibiotic administered. Thesestrains, where identified, were those classified as lesssensitive in Table 2. Subsequently strains with higher MICs were detected and these were not amenable to therapywith then available quinolones, even with higher doseregimens. These isolates are shown in Table 2 as the‘resistant’ group. In 1997, one particular feature has beenthe increase or maintenance of high numbers of strainswith fully developed quinolone resistance.
The data shown apply to resistance to the group ofquinolones now called ‘second generation’ agents.11 Newly released quinolones with activity against some of strainsresistant to second generation agents are now available.Their activity and potential for use in the WHO WPR willneed to be assessed.
Some interest remains within and without the region in theextent and type of resistance to the penicillins. Because ofthe very high levels of resistance, the clinical usefulness of this group of antibiotics has decreased significantly in theWPR. Consequently the testing for susceptibility to thepenicillins is a decreasing priority. However this group ofagents is still used effectively in a number of specificsettings, and the data generated in the WPR continues tobe of interest to other regions.
There was no resistance detected to the later generationcephalosporins and very little to the injectable agentspectinomycin. Significant levels of spectinomycinresistance were recorded in parts of the region some years ago. The inappropriate use of antibiotics, and availability of
290 CDI Vol 22, No 13 24 December 1998
Article
Table 3. Spectinomycin resistance in isolates ofNeisseria gonorrhoeae in countries in theWHO WPR in 1997
Country Number tested Number resistant
Australia 2817 0
China 905 4 (0.045%)
Japan 85 0
Korea 382 0
Malaysia 9 0
New Caledonia 9 0
Philippines 22 0
Singapore 691 0
Vietnam 156 0
Table 4. High level tetracycline resistance - TRNG - in strains of Neisseria gonorrhoeae isolatedin 10 countries in the WHO WPR in 1997
Country Number TestedNumberTRNG % TRNG
Australia 2817 162 5.8
China 901 21 2.3
Japan 85 1 1.2
Korea 382 4 1.0
Malaysia 9 5 55.0
New Caledonia 16 2 12.5
New Zealand 309 17 5.5
Philippines 22 10 45.4
Singapore 691 567 82.0
Vietnam 156 56 35.9

agents in the informal health sector have both contributedto the development of antibiotic resistance in the past. The increasing availability of oral third generationcephalosporins and the consequent risk of inappropriateuse suggests that continuing surveillance of these agentsis prudent. Such surveillance is of greater importance nowthat the usefulness of the quinolones is rapidly declining inthe WPR.
Tetracyclines are a multiple dose treatment for gonorrhoea and are not a recommended therapy for gonorrhoea.However the presence of a particular form of high levelplasmid mediated tetracycline resistance - TRNG - hasbeen recognised. The programme has therefore monitored the spread of TRNG in the region. Considerable regionalvariation in the distribution of TRNG was again noted.Singapore, Malaysia, the Philippines and Vietnam inparticular have high numbers of TRNG.
The trend towards a decrease in susceptibility ofgonococci to various antimicrobials in the WPR hascontinued over a number of years poses additionalproblems for successful treatment of gonococcal diseasein the region.
AcknowledgementsDr. G. Poumerol Regional Adviser STD, WHO RegionalOffice for the Western Pacific, Manila, Philippines;
J. W. Tapsall, Area co-ordinator, Sydney,Australia.
The following supplied data in 1997 for the WPR GASP:
Members of the Australian gonococcal surveillanceprogramme throughout Australia;
Ye Shunzhang and Su Xiaohong, Nanjing, China;
M.Shah, Suva, Fiji;
K. M. Kam, Hong Kong;
Toshiro Kuroki, Yokohama Japan;
K. Lee and Y. Chong, Seoul, Korea;
Rohani MD Yasin, Kuala Lumpur, Malaysia;
Chimgee Erdenechimeg, Ulaanbaatar, Mongolia
P. Duval, and B. Gentile, Noumea, New Caledonia;
M. Brett, Wellington and M. Brokenshire, Auckland, NewZealand;
C. C. Carlos, Manila, Philippines;
A. E. Ling, Singapore;
Ane Tone Ika, Nuku’alofa, Tonga;
H. Wamle and D. Kalorib, Vanuatu;
Le Thi Phuong, Hanoi, Vietnam.
The regional reference laboratory is supported by atechnical services grant from the WHO.
References1. Cohen MS. Sexually transmitted diseases enhance HIV
transmission : no longer a hypothesis. Lancet 1998;351 (suppl III):5-7.
2. Grosskurth H, Mosha F, Todd J et al. Impact of improvedtreatment of sexually transmitted diseases on HIV infection inrural Tanzania: randomised controlled trial. Lancet1995;346:530-6.
3. Ison CA, Dillon J-A, Tapsall JW. The epidemiology of globalantibiotic resistance among Neisseria gonorrhoeae andHaemophilus ducreyi. Lancet 1998;351(suppl III):8-11.
4. The World Health Organization Western Pacific RegionGonococcal Surveillance Programme. 1992 Annual Report.Comm Dis Intell 1994,18:61-63.
5. The World Health Organization Western Pacific RegionGonococcal Surveillance Programme. 1993 annual report.Comm Dis Intell 1994;18:307-310.
6. The World Health Organization Western Pacific RegionGonococcal Surveillance Programme. 1994 annual report.Comm Dis Intell 1995;19:495-499.
7. The World Health Organization Western Pacific GonococcalAntimicrobial Surveillance Programme. Antimicrobialresistance in gonococci, Western Pacific region, 1995. CommDis Intell 1996;20:425-428.
8. Report on the gonococcal antimicrobial surveillanceprogramme (GASP). Antibiotic susceptibility of Neisseriagonorrhoeae, 1992 to 1994. World Health OrganizationWestern Pacific Region STD HIV AIDS surveillance report. No 7 July 1996 pp 6-8.
9. WHO Western Pacific Region Gonococcal AntimicrobialSurveillance Programme. Surveillance of antibioticsusceptibility of Neisseria gonorhoeae in the WHO WesternPacific Region 1992 - 1994. Genitourin Med 1997;73:353-361.
10. The gonococcal antimicrobial surveillance programme(GASP). WHO Western Pacific Region. WER1996;41:309-311.
11. Andriole VT. Current quinolone status and classification. In :The quinolones. Andriole VT editor. 2nd edition 1998Academic Press, San Diego p425.
CDI Vol 22, No 13 24 December 1998 291
Article

CDI Subject index, 1998 AACIR
See Australian Childhood Immunisation Register
Aedes Albopictus
In Townsville, Queensland; 3
AIDS
see HIV and AIDS
Anthrax
Overseas updates; 203
Sporadic human anthrax in urban Brisbane; 189
Arboviruses
See also separate disease names
Australian region, 1990 to 1998; 93
Surveillance reports; 23, 6, 81, 114, 139, 255,271
ASPREN
See Australian Sentinel Practice Research Network
Asthma
and immunisation; 38
Australian Childhood Immunisation Register
Interpreting data; 111
Methodology; 36
Surveillance reports; 36, 121, 170, 233, 278
Australian Gonococcal Surveillance Programme
See Gonococcal surveillance
Australian Paediatric Surveillance
Role of communicable disease in childhood; 283
Australian Sentinel Practice Research Network
Surveillance data in CDI; 5
Surveillance reports; 13, 28, 40, 61, 81, 114
BBotulism
Infant case SA; 110, 133
CCampylobacter
Surveillance report; 298
CDI
Instructions for authors; 9, 254
Internet web site; 31, 284
New address; 80,104
Surveillance data in; 4
Technical report series; 192
Cholera
A case of; 154
Overseas updates; 16, 32, 47, 68, 124, 147, 171, 203,236, 264, 281, 305
Communicable Diseases Surveillance Reports; 10, 23, 40, 61, 81, 114,139, 162, 194, 224, 255, 271, 298
Conference announcements
Control of Communicable Diseases in Australia; 39
Cryptosporidiosis Outbreak; 22
Current issues in immunisation
Occasional report series; 38, 58, 111
DDengue
Aedes Albopictus vector in Queensland; 3
Cases from Thailand; 107
In Cairns; 109
In Queensland, outbreak; 4
Overseas updates; 48, 68, 92, 123
Possible case, interpreting serology; 105
Diarrhoea
Outbreak overseas; 92, 264
Diphtheria
A case of diphtheria in New Zealand; 188
National Health and Medical Research Councilrecommendations on vaccination; 188
EEncephalitis
Japanese, case; 60, 80
Murray Valley, case; 60, 103
Enteroviruses
Surveillance reports; 41, 62
Outbreak in Asia; 171
Overseas updates; 148
Escherichia coli
VTEC; 223
FFlavivirus
See also individual diseases
Surveillance
See Sentinel Chicken Surveillance Programme
Food
Poisoning in Mozambique; 305
Regulation Review; 221
GGonococcal conjunctivitis
Non-sexually transmitted outbreak; 52
292 CDI Vol 22, No 13 24 December 1998
CDI Subject index

Outbreak; 39
Gonococcus
Annual Report 1997 - surveillance; 212
Resistance isolated in WHO Western Pacific Region;288
Surveillance data in CDI; 8
Surveillance reports; 2, 84, 230, 276
What is it telling us; 216
HHaemolytic uraemic syndrome
Cases in South Australia; 80
Surveillance reports; 255
Haemorrhagic fever
Crimean-Congo update; 124
HIV and AIDS
Changes in reporting in Australia; 161
Surveillance data in CDI; 5
Surveillance reports; 46, 63, 83, 121,147, 169, 199,231, 261, 278, 303
Hepatitis A
In STD data, letter; 113
Surveillance reports; 23, 114, 13, 255
IImmunisation
Administration of measles-mumps-rubella vaccine withother childhood schedule vaccinations; 159
and asthma; 38
Influenza, NHMRC recommendations; 75
Measles control; 33, 136, 156, 157
Measles vaccine, possible adverse effects;58
Measuring childhood coverage;
See Australian Childhood Immunisation Register
Moving the second dose of measles-mumps-rubellavaccine to school entry: implications for control
of rubella; 157
Occasional report series;
See Current issues in immunisation
Preterm infants; 218
Infection control
Revision of guidelines; 222
Influenza
Hong Kong, A (H5N1) outbreak; 16, 32, 68
Overseas update; 47
National surveillance
1997 Report; 69
Surveillance data in CDI; 8
Surveillance reports; 83, 120, 145, 168, 199, 229, 260
Vaccination,
NHMRC recommendations; 75,
Australian recommendations for 1999 season; 269
Internet web site
CDI, Communicable Diseases Australia; 31
CDI, Communicable Diseases Australia, new address;80, 104
Medical entomology; 22
JJapanese encephalitis
see encephalitis
KKokobera
Possible case, interpreting serology; 105
Kunjin virus
Activity, see Sentinel Chicken Surveillance Programme
LLabVISE
See Virology and Serology Laboratory ReportingScheme
Legionellosis
Disease outbreak; 155
Legionellosis and recent travel to Bali; 189
Overseas updates; 204
Surveillance reports; 162
Lyssavirus
Prophylaxis in Western Australia; 149
Recommendations for pre- and post-exposurevaccination; 153
Expert Group; 153
MMalaria
Acquired in Torres Strait; 1
Australian Register for 1992 and 1993; 237
Overseas update; 124
Trends in Australia 1991-1997; 247
Measles
Control campaign updates; 136, 156, 193, 220, 253,270
Control in Australia, workshop report; 33
Victoria 1992 to 1996; 17
Melioidosis
North Queensland, outbreak; 39
Meningococcal Disease
Annual Report 1997, surveillance;205
In Australia: 1997 and beyond; 134
Guidelines for prophylaxis; 270
Overseas updates; 32, 92, 203
Surveillance reports; 41, 139, 162, 194, 224, 255
CDI Vol 22, No 13 24 December 1998 293
CDI Subject index

Murray Valley Encephalitis
See Encephalitis
Activity, see Sentinel Chicken Surveillance Programme
Mycoplasma pneumoniae
Surveillance reports; 115
NNational Influenza Surveillance
See Influenza
National Notifiable Diseases Surveillance System
Surveillance data in CDI; 4
Surveillance reports; 10, 23, 40, 61, 81, 114
Newcastle disease
Outbreak in commercial poultry flocks; 222
NNDSS
See National Notifiable Diseases Surveillance System
Notifiable diseases
See National Notifiable Diseases Surveillance System
PParvovirus
Surveillance reports; 24, 115
Pertussis
South Australia 1883 to 1996; 76
Pertussis vaccines: past, present and future inAustralia; 125
Pertussis: the way it was; 133
Plasmodium vivax
Malaria acquired in the Torres Strait; 1
Pneumococcal disease
Seroepidemiology in Queensland 1990-1997; 265
Pneumonia outbreak overseas; 281
Polio
Global eradication; 221
QQ Fever
Outbreak report; 222
RRabies
Prophylaxis in Western Australia; 149
Recommendations for pre- and post-exposurevaccination; 153
Expert Group; 153
Human rabies in Russia; 154
Respiratory viruses
Surveillance reports; 41, 62, 82, 139, 162, 271, 298
Rift Valley fever
Overseas updates; 16, 32, 281
Ross River virus
Infection in Australia, 10
Infection in NW Sydney; 101
Surveillance reports; 298
Rotavirus
Surveillance reports; 115, 139
Rubella
Implications for control of;157
SSalmonellosis
Outbreak report; 155
Surveillance reports; 23,139
Sentinel Chicken Surveillance Programme
Surveillance data in CDI; 7
Surveillance reports; 30, 47, 85, 145, 169, 277
Serious Adverse Events following Vaccination Surveillance Scheme
Surveillance data in CDI; 6
Surveillance reports; 85, 146, 234
Sexually transmissible diseases
See also Gonococcal surveillance
Surveillance in Australia; 49
Shigella at a wake in Adelaide; 297
Surveillance
Data in CDI, description of schemes; 4
See also Communicable Diseases Surveillance
TTuberculosis
Tuberculosis notifications in Australia, 1996
Tuberculosis in Australia: bacteriologically confirmedcases and drug resistance, 1996; 183
Typhoid
Vaccine; 193
Overseas updates; 236
V Vaccination
See also Immunisation
Adverse events
See Serious Adverse Events following VaccinationSurveillance Scheme
Vaccine preventable diseases
Surveillance reports; 23, 40, 61, 81, 139, 162, 194, 224, 255, 271, 298
Vancomycin-Resistant Enterococci (VRE)
A public health context; 248
Emergence and epidemiology of in Australia; 249
Vectorborne diseases
Surveillance reports; 40
294 CDI Vol 22, No 13 24 December 1998
CDI Subject index

Verotoxin
Infections and associated syndromes; 223
Surveillance updates; 224
Virology and Serology Laboratory Reporting Scheme
Surveillance data in CDI; 8
Surveillance reports; 13, 23, 40, 61, 81, 114
YYellow fever
Overseas updates; 281
CDI Author index 1998 AAlfredson, David; 265
Amin, Janaki; 58, 101
BBapty, Greg; 265
Bell, John; 249
Broom, Annette; 93
Botham, Susan; 218
Bryan, Joan; 237
Burgess, Margaret; 33, 125, 136, 157, 159, 218
CCameron, Scott; 76
Capon, Anthony; 101
Carlisle, Jane; 265
Carney, Ian; 103
Coombs, Geoffrey; 249
Crome, Mark; 189
Curran, Margaret; 69
DDawson, David; 183
Darzenos, Jack 297
Davos, Dianne 297
Donovan, Basil; 216
Dore, Gregory; 49
Douglas, Ian; 189
Dwyer, Dominic; 101
EElliott, Elizabeth 283
Ewald, Dan; 1
FFa’afoi; Elekana 237
Foley, Peter; 3
Forrest, Jill; 33, 125, 157
Forsyth, Simon; 237
GGeorge, Narelle; 265
Geue, Alexandra; 248
Gilroy, Nicole; 173
Givney, Rod 297
Gratten, Mike; 265
HHall, Robert; 76, 93
Hampson, Alan; 69
Hanna, Jeffrey; 265
Harper, Jaqui; 189
Harvey, Bronwen; 125, 134, 173, 247
Heath, Timothy; 33, 38, 58,136, 157, 159,
Hemsley, Craig; 3
Holland, Rosalind; 110
Hueston, Linda; 101
IIsaacs, David; 218
JJohansen, Cheryl; 93
Jones, Andrew; 189
KKaldor, John; 49
Kelly, Robyn; 265
Krause, Vicki; 57
LLambert, Stephen; 17
Langrell, Jenni; 1
Lindsay, Michael; 93
Looke, David; 107, 189
MMackenzie, John; 93
Mak, Donna; 52
Matters, Rex; 52
Maroske, Gary; 3
CDI Vol 22, No 13 24 December 1998 295
CDI Author index

McCall, Brad; 189
McIntyre, Peter; 33, 38, 58, 125, 136,
Mead, Cathy; 36
Mein, Jacki; 105
Merianos, Angela; 105
Merritt, Anthony; 1, 103
Muller, Keith; 3
NNimmo, Graeme; 189, 265
Nuttall, Nichalas; 265
OO’Brien, Edward; 36, 38, 159
O’Brien, Frances; 249
O’Grady, Kerry-Ann; 105
O’Kane, Gabrielle; 189
Oliver, Graeme; 173
PPhillips, Debra; 93, 103, 107
Playford, Geoffrey; 107
RRitchie, Scott; 3, 93
Roberts, Christine; 76
Russell, Richard; 93
SSam, Greg; 36
Scheil, Wendy; 76
Schooneveldt, Jacqueline; 265
Smith, David; 93
Stephen, Seriako Jnr; 1
TTapsall, John 288
Torvaldsen, Siranda; 149
Turnidge, John; 249
Vvan den Hurk, Andrew; 1
WWatson, Tony; 149
Whelan, Peter; 103, 105
Whitby, Michael; 107, 189
Williams, Katrina 283
Wong, Ignatious; 52
Wright, Jill; 189
CDI Reviewers, 1998We gratefully acknowledge the assistance of the following specialist reviewers for providing valuable comment on CDIarticles published in 1998:
Ross Andrews, Dennis Aycliffe, Mary Beers,
Frank Bowden, Annette Broom, Margaret Burgess,
Scott Cameron, John Carnie, Peter Collignon,
Scott Crerar, Craig Dalton, Geoff Davis, John Ferguson,
Mark Ferson, Robert Fraser, Lyn Gilbert, Tom Gottlieb,
Robert Hall, Jeffrey Hanna, Ana Herceg, Geoff Hogg,
Tim Inglis, David Isaacs, Brian Kay, Ann Kempe,
Ed Kraa, Rosemary Lester, Peter Liehne, Diane Lightfoot,
Helen Longbottom, Yvonne Lossart, Jeremy McAnulty,
Brad McCall, John McKenzie, Cathy Mead,
Angela Merianos, Rosemary Munro, Terry Nolan,
Mahomed Patel, Debra Phillips, Aileen Plant, Ian Riley,
Tom Riley, Scott Ritchie, Richard Russell, Bryan Speed,
John Tapsall, Mark Veitch, John Watson
296 CDI Vol 22, No 13 24 December 1998
CDI Author index

Shigella at a wake in Adelaide, June 1998 Rod Givney,1 Jack Darzenos,2 Dianne Davos3
Thirteen out of 32 persons from two states who attended a lunch after a funeral in Adelaide on 2nd June 1998became ill with diarrhoea. Most had onset of illness withinthree days but one case occurred eight days after and one 28 days after the lunch. The person whose illnesscommenced eight days after was the sister of one of theearly onset cases and it was her boyfriend who became illafter 28 days. The duration of illness ranged from three to10 days (mean=6.2 days) with reported symptoms inaddition to diarrhoea being abdominal pain (11), vomiting(7) and macroscopic blood in the stool (3).
Only one person had a history of recent travel outsideAustralia before the funeral. This had been a medicallyuneventful trip to the Philippines six weeks previous.Similarly in the two months before the funeral one personhad returned from southern Queensland, one from a trip to Western Australia and the Northern Territory and one fromWestern Australia only. Of these travellers only the thirdhad suffered any illness during their travel. Six peoplecame from Melbourne to Adelaide to attend the funeral.
Most of the food for the function was purchased the daybefore from the refrigerated counter of a retail outlet,transported for 20 minutes in the boot of a car and thenrefrigerated overnight in the kitchen of the flat where thelunch was served. During that night one item (sliced ham)was removed from the fridge and some of it used. Theremainder of the ham was returned to the fridge. Theperson who handled the ham during the night hadrecovered earlier that week from a diarrhoeal illnesscontracted in the Kimberleys. The cause of this diarrhoeahad not been determined.
S. sonnei Biotype G was grown from the stool of three ofthe cases (onset 2 days (n=2) and 8 days), S. sonnei notbiotyped from one case (onset 28 days after the funeral)and S. dysenteriae Type 2 from the stool of one other case (onset of diarrhoea 1 day after the funeral). None of theother cases provided a stool specimen.
A cohort study implicated only the sliced ham of the foodsserved at the funeral lunch as a possible vehicle for thisoutbreak. Even including a probable secondary case (8day incubation) who did not eat ham as a primary caseand counting one of the early cases (who was notcompletely certain that she had eaten the ham) as anon-consumer, the relative risk was 2.77 (95% confidencelimits 1.05-7.27). With these conservative case definitionsthe attack rate for ham eaters was eight out of 13 (62%).The more likely situation with the late onset case as asecondary case and accepting the history that theuncertain person’s belief that she probably had eaten ham
gave a relative risk of 5.46 (95% confidence limits 1.40-21.27).The attack rate with these definitions was nine of14 (64%).
The retailer from whom the ham was purchased is a largesupplier which turns over multiple legs each week.Inspection of this premises two weeks after the funeral byan environmental health officer of the Adelaide CityCouncil revealed no poor food handling practices.Laboratory cultures of ham collected at that time did notgrow Shigella. If there had been a problem at or before the retail stage we would also have expected moremetropolitan cases of Shigella notified unrelated to thefuneral.
Our suspicion is that the person recently recovered fromdiarrhoea acquired in the north west of Australia whohandled the ham the night before the funeral contaminated it. This person also consumed the ham but did not sufferfurther illness.
Some person-to-person transmission at the lunch was also possible. The meal was served to a large group of peoplein a very small flat and one person reported that the handtowel in the bathroom became sodden from hand wipingduring the afternoon. The multiple Shigella isolates,especially in a metropolitan outbreak, are surprising but itseems unlikely that there would be multiple sources.Nevertheless the one isolate of S. dysenteriae came froma person who did not eat ham and who had a flu-likeillness on the day of the funeral but developed prolonged(10 days) of diarrhoea the day after.
This is only the second S. dysenteriae Type 2 infectionnotified in South Australia since 1990. By contrast in 1997and 1998 S. sonnei Biotype G has been the commonestShigella notified. Before 1996 most cases of S. sonneiBiotype G were acquired overseas but only four of the 30notified so far in 1998 had recent travel histories outsideAustralia.
AcknowledgmentsNotifying doctors: S Hadges, B Kitchener, S Nield, C Teh. ClinPathLaboratories, Kent Town SA; Infectious Diseases Laboratories,Institute of Medical & Veterinary Science, Adelaide SA
1. Corresponding author: Communicable Disease ControlBranch, Department of Human Services, PO Box 6 Rundle StAdelaide SA Phone 08 8226 7177 Fax 8226 [email protected]
2. Environmental Health, Adelaide City Council
3. Australian Salmonella Reference Centre, Infectious DiseasesLaboratories, Institute of Medical & Veterinary Science,Adelaide
CDI Vol 22, No 13 24 December 1998 297
Outbreak Report

Communicable Diseases SurveillanceHighlights
Communicable Diseases Surveillance consists of datafrom various sources. The National Notifiable DiseasesSurveillance System (NNDSS) is conducted under theauspices of the Communicable Diseases NetworkAustralia New Zealand. The CDI Virology and SerologyLaboratory Reporting Scheme (LabVISE) is a sentinelsurveillance scheme. The Australian Sentinel PracticeResearch Network (ASPREN) is a generalpractitioner-based sentinel surveillance scheme. In thisreport, data from the NNDSS are referred to as‘notifications’ or ‘cases’, whereas those from ASPREN arereferred to as ‘consultations’ or ‘encounters’ while datafrom the LabVISE scheme are referred to as ‘laboratoryreports’.
Vaccine Preventable DiseasesThe number of notifications of pertussis infection whichhad been falling and then appeared to plateau have nowrisen with 395 reports for this period compared with 324 inthe previous reporting period. Examination of the historical data (Figure 3) shows that pertussis notifications arerelatively low, mainly because of the large numbersreported in late 1997 and early 1998. Laboratory reporting of pertussis for this period and for the year to date is lowerin comparison with similar periods in 1997.
Laboratory reports of measles and rubella continue todecline this month with the lowest number of reports foryear to date since the LabVISE scheme was started. Thenumber of reports through the NNDSS is also low and iscompared with historical data in Figure 3.
Respiratory Syncytial Virus (RSV)The number of reports of RSV from the labVISE systemcontinued to decline this month after peaking in August this year with 1,767 reports. Although overall laboratoryreporting was similar to that for previous years this year’speak was both higher and later than previous peaks(Figures 1 and 2). Eighty-three per cent of reports were forinfants in the under five-year age group.
Ross River Virus InfectionThe total number of notifications for 1998 has been lowerthan in the previous couple of years but a rise has beenseen for this reporting period (from 50 in the previousreporting period to 198 in the current one). Whenexamined by onset date, number of cases has risen from72 in October to 172 in November 1998. Most reports arefrom NSW and Qld. This may represent the beginning ofthe increase expected in the Summer months.
CampylobacterThe total number of notifications with onset in October andNovember 1998 has risen compared with the numbersseen in previous years, particularly in Victoria and SouthAustralia. This is reflected in the historical figure (Figure3).
298 CDI Vol 22, No 13 24 December 1998
Communicable diseases surveillance Highlights
0
200
400
600
800
1000
1200
1400
1600
1800
2000
Jan Feb Mar Apr May Jun Jul Aug Sep Oct Nov Dec
199619971998
Figure 1. LabVISE reports of RSV, 1996 to 1998,by month
0
200
400
600
800
1000
1200
1400
1600
1800
2000
1993 1994 1995 1996 1997 1998
Figure 2. LabVISE reports of RSV, January 1993to November 1998

Tables
There were 5,530 notifications to the National Notifiable Diseases Surveillance System (NNDSS) in the four week period, 11 November to 8 December 1998 (Tables 1 and 2). The numbers of reports for selected diseases have been comparedwith historical data for corresponding periods in the previous three years (Figure 3).
There were 1,634 reports received by the CDI Virology and Serology Laboratory Reporting Scheme (LabVISE) in thefour week period, 5 November to 2 December 1998 (Tables 3 and 4).
The Australian Sentinel Practice Research Network (ASPREN) data for weeks 44 to 47, ending 29 November 1998, areincluded in this issue of CDI (Table 5).
CDI Vol 22, No 13 24 December 1998 299
Tables Communicable diseases surveillance
0 200 400 600 800 1000 1200 1400 1600
Salmonellosis
Rubella
Q fever
Pertussis
Meningococcal infection
Measles
Legionellosis
Hepatitis A
Campylobacteriosis
Ross River virus infection
Historical Data
Reporting Period 11/11/98 to 8/12/98
Notifications
Figure 3. Selected National Notifiable Diseases Surveillance System reports, and historical data1
1. The historical data are the averages of the number of notifications in the corresponding 4 week periods of the last 3 years and the 2 week periodsimmediately preceding and following those.
Table 1. Notifications of diseases preventable by vaccines recommended by the NHMRC for routinechildhood immunisation, received by State and Territory health authorities in the period11 November to 8 December 1998.
Disease1,2 ACT NSW NT Qld SA Tas Vic WA
Thisperiod1998
Thisperiod1997
Year todate1998
Year todate1997
Diphtheria 0 0 0 0 0 0 0 0 0 0 0 0
H. influenzae type b infection 0 3 0 2 0 0 0 0 5 3 34 47
Measles3 6 6 0 1 0 3 8 2 26 114 332 782
Mumps 0 1 0 0 2 0 8 5 16 10 172 181
Pertussis 16 154 3 111 27 4 75 5 395 1,600 6,208 9,464
Rubella4 1 7 0 11 2 2 8 5 36 101 764 1,391
Tetanus 0 0 0 0 0 1 0 0 1 0 7 7

300 CDI Vol 22, No 13 24 December 1998
Communicable diseases surveillance Tables
Table 2. Notifications of diseases received by State and Territory health authorities in the period 11 November to 8 December 1998.
Disease1,2,3,4 ACT NSW NT Qld SA Tas Vic WA
Thisperiod1998
Thisperiod1997
Year todate
19985
Year todate1997
Arbovirus infection (NEC)6 0 1 0 4 0 0 9 0 14 0 80 36
Barmah Forest virus infection 0 12 3 18 0 0 0 1 34 30 534 676
Brucellosis 0 0 0 3 0 0 0 0 3 5 44 37
Campylobacteriosis7 30 - 13 456 349 23 506 137 1,514 1,035 11,928 10,980
Chlamydial infection (NEC)8 12 NN 57 345 67 19 197 124 821 676 10,272 8,547
Cholera 0 0 0 1 0 0 0 0 1 0 5 3
Dengue 0 2 1 67 0 0 0 0 70 2 500 207
Donovanosis 0 NN 0 0 NN 0 0 0 0 8 35 36
Gonococcal infection9 1 60 115 80 13 0 44 63 376 257 5,053 4,326
Hepatitis A 0 22 5 23 6 0 16 14 86 156 2,478 2,908
Hepatitis B incident 0 3 2 5 1 0 7 0 18 12 226 233
Hepatitis C incident10 0 3 0 - 6 0 - - 23 13 323 74
Hepatitis C unspecified5 21 NN 26 268 NN 18 421 87 902 1,649 10,109 18,493
Hepatitis (NEC) 0 0 0 0 0 0 0 NN 0 0 4 5
Haemolytic uraemic syndrome11 NN 0 NN 1 0 0 NN 0 1 1 13 3
Hydatid infection 0 0 0 0 0 0 4 0 4 11 42 59
Legionellosis 1 4 0 0 9 0 4 3 21 20 245 145
Leprosy 0 0 0 0 0 0 0 0 0 1 2 11
Leptospirosis 0 1 0 7 0 1 7 2 18 11 179 117
Listeriosis 0 2 0 0 0 1 0 0 3 3 51 68
Malaria 2 6 1 22 3 0 4 1 39 17 665 710
Meningococcal infection 0 6 2 9 3 0 3 4 27 23 448 466
Ornithosis 2 NN 0 0 0 0 15 0 17 2 51 43
Q Fever 0 21 0 15 0 0 11 0 47 40 548 561
Ross River virus infection 1 76 5 72 9 0 29 6 198 67 2,757 6,571
Salmonellosis (NEC) 5 96 41 197 36 4 101 36 516 551 7,373 6,611
Shigellosis7 NN 0 NN NN 0 0 NN NN 0 2 15 17
SLTEC, VTEC12 2 - 7 13 4 0 9 13 48 55 582 757
Syphilis13 1 24 30 67 1 0 1 4 128 75 1,444 1,205
Tuberculosis 0 10 2 9 2 2 29 5 59 98 903 926
Typhoid14 0 0 0 1 0 0 2 0 3 3 68 70
Yersiniosis (NEC)7 0 - 0 6 3 0 1 0 10 20 197 235
1. Diseases preventable by routine childhood immunisation arepresented in Table 2.
2. For HIV and AIDS, see Tables 6 and 7.
3. Totals comprise data from all States and Territories. Cumulativefigures are subject to retrospective revision so there may bediscrepancies between the number of new notifications and theincrement in the cumulative figure from the previous period.
4. No notifications have been received during 1998 for the following rarediseases: botulism (foodborne), lymphogranuloma venereum,plague, rabies, yellow fever, or other viral haemorrhagic fevers. There have also been no cases of thromotic thrombocytopaenic purpura(TTP), which became nationally reportable in August 1998.
5. Data from Victoria for 1998 are incomplete.
6. NT: includes Barmah Forest virus.
7. Not reported for NSW because it is only notifiable as ‘foodbornedisease’ or ‘gastroenteritis in an institution’.
8. WA: genital only.
9. NT, Qld, SA and Vic: includes gonococcal neonatal ophthalmia.
10. Qld and Vic incident cases of Hepatitis C are not separately reported.
11. Nationally reportable from August 1998.
12. Infections with Shiga-like toxin (verotoxin) producing E. Coli(SLTEC/VTEC) became nationally reportable in August 1998.
13. Includes congenital syphilis.
14. NSW, Qld, Vic: includes paratyphoid.
NN Not Notifiable.
NEC Not Elsewhere Classified.
- Elsewhere Classified.
NA Not applicable, as reporting for this condition did not commence until1998.

CDI Vol 22, No 13 24 December 1998 301
Tables Communicable diseases surveillance
State or Territory1 Totalreported
ACT NSW NT Qld SA Tas Vic WATotal this
periodin CDI in
1998
Measles, mumps, rubella
Measles virus 1 1 1 3 57
Mumps virus 5 5 48
Rubella virus 1 4 4 9 112
Hepatitis viruses
Hepatitis A virus 4 4 13 16 37 380
Hepatitis D virus 1 1 2 8
Arboviruses
Ross River virus 4 5 39 7 55 667
Barmah Forest virus 1 7 1 9 39
Dengue type 3 7 7 7
Dengue not typed 4 4 40
Flavivirus (unspecified) 10 10 74
Adenoviruses
Adenovirus type 1 6 6 69
Adenovirus type 3 7 7 54
Adenovirus type 6 2 2 17
Adenovirus type 7 2 2 19
Adenovirus type 40 2 2 15
Adenovirus not typed/pending 30 3 15 12 21 81 833
Herpes viruses
Cytomegalovirus 17 2 20 10 1 16 5 71 778
Varicella-zoster virus 16 2 55 6 2 28 29 138 1,256
Epstein-Barr virus 14 10 69 29 12 51 185 1,781
Other DNA viruses
Contagious pustular dermatitis(Orf virus)
1 1 9
Parvovirus 1 11 2 2 12 28 248
Picorna virus family
Coxsackievirus B5 1 1 5
Echovirus type 11 7 7 33
Echovirus type 30 3 3 3
Echovirus not typed/pending 1 1 2
Poliovirus type 1 (uncharacterised) 4 4 11
Poliovirus type 2 (uncharacterised) 2 1 3 14
Rhinovirus (all types) 1 25 5 4 35 442
Enterovirus not typed/pending 3 3 8 2 5 53 74 502
Ortho/paramyxoviruses
Influenza A virus 6 4 21 2 3 36 2,780
Influenza B virus 1 1 2 4 169
Parainfluenza virus type 1 7 1 8 284
Parainfluenza virus type 3 17 12 9 8 8 54 374
Parainfluenza virus type 4 1 1 1
Parainfluenza virus typing pending 1 1 5
Respiratory syncytial virus 22 5 57 2 7 16 109 4,797
Table 3. Virology and serology laboratory reports by State or Territory1 for the reporting period 5 November to 2 December 1998, and total reports for the year.

302 CDI Vol 22, No 13 24 December 1998
Communicable diseases surveillance Tables
State or Territory1 Totalreported
ACT NSW NT Qld SA Tas Vic WATotal this
periodin CDI in
1998
Other RNA viruses
HTLV-1 1 1 19
Rotavirus 1 98 23 10 16 2 150 1,325
Astrovirus 1 1 10
Norwalk agent 1 1 38
Other
Chlamydia trachomatis not typed 33 16 95 18 3 7 78 250 3,332
Chlamydia psittaci 10 1 11 64
Chlamydia species 1 5 6 58
Mycoplasma pneumoniae 20 1 25 10 33 9 98 1,314
Coxiella burnetii (Q fever) 10 10 1 6 1 28 137
Bordetella pertussis 4 1 36 34 3 78 968
Legionella pneumophila 1 1 6
Legionella longbeachae 1 3 4 33
TOTAL 2 343 46 439 231 19 209 345 1,634 23,237
1. State or Territory of postcode, if reported, otherwise State or Territory of reporting laboratory.
Table 3. Virology and serology laboratory reports by State or Territory1 for the reporting period 5 November to 2 December 1998, and total reports for the year (continued).
Table 4. Virology and serology laboratory reports by contributing laboratories for the reporting period 5 November to 2 December 1998.
State or Territory Laboratory Reports
New South Wales Institute of Clinical Pathology & Medical Research, WestmeadNew Children's Hospital, WestmeadRoyal Prince Alfred Hospital, CamperdownSouth West Area Pathology Service, Liverpool
815260
120
Queensland Queensland Medical Laboratory, West EndTownsville General Hospital
47820
South Australia Institute of Medical and Veterinary Science, Adelaide 230
Tasmania Royal Hobart Hospital, Hobart 16
Victoria Royal Children's Hospital, MelbourneVictorian Infectious Diseases Reference Laboratory, Fairfield
12389
Western Australia PathCentre Virology, PerthWestern Diagnostic Pathology
31451
TOTAL 1,634

The NNDSS is conducted under the auspices of the Communicable Diseases Network Australia New Zealand. Thesystem coordinates the national surveillance of more than 40 communicable diseases or disease groups endorsed by the National Health and Medical Research Council (NHMRC). Notifications of these diseases are made to State andTerritory health authorities under the provisions of their respective public health legislations. De-identified core unit dataare supplied fortnightly for collation, analysis and dissemination. For further information, see CDI 1998;22:4-5.
LabVISE is a sentinel reporting scheme. Twenty-onelaboratories contribute data on the laboratory identificationof viruses and other organisms. Data are collated andpublished in Communicable Diseases Intelligence everyfour weeks. These data should be interpreted with cautionas the number and type of reports received is subject to anumber of biases. For further information, see CDI1998;22:8.
ASPREN currently comprises about 100 generalpractitioners from throughout the country. Up to 9,000consultations are reported each week, with specialattention to 12 conditions chosen for sentinel surveillancein 1998. CDI reports the consultation rates for all of these.For further information, including case definitions, see CDI1998;22:5-6.
Additional Reports
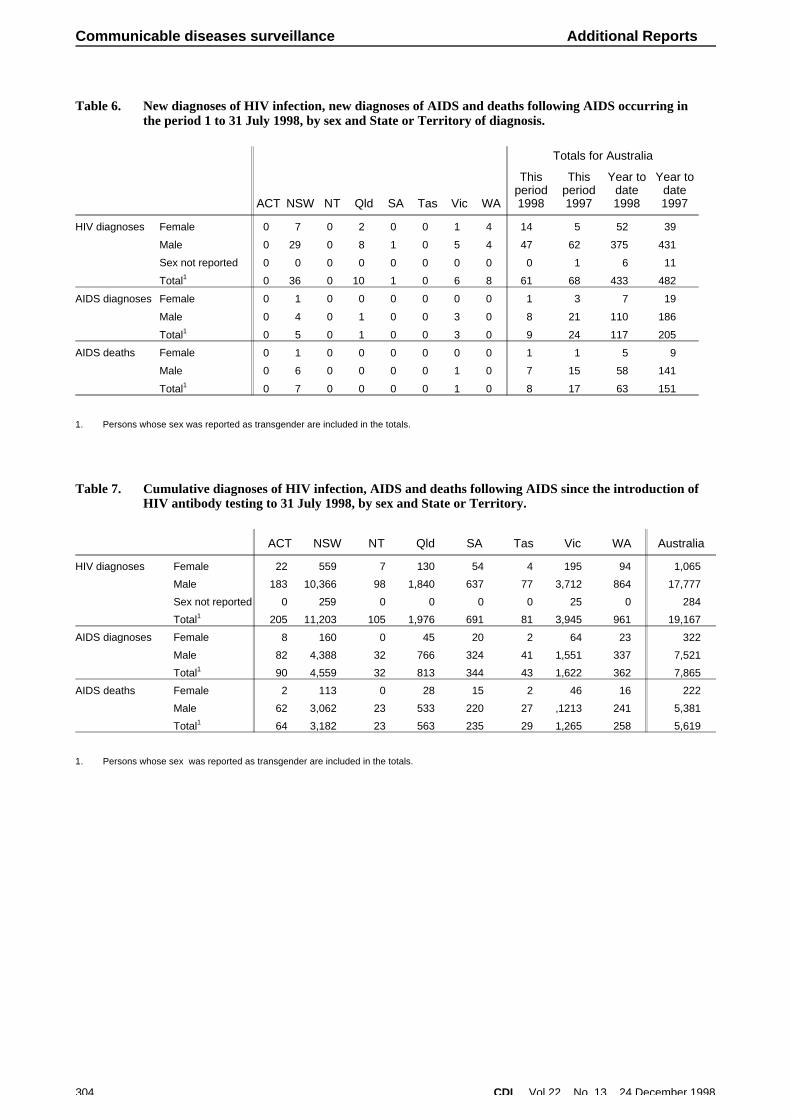
HIV and AIDS SurveillanceNational surveillance for HIV disease is coordinated by theNational Centre in HIV Epidemiology and ClinicalResearch (NCHECR), in collaboration with State andTerritory health authorities and the Commonwealth ofAustralia. Cases of HIV infection are notified to theNational HIV Database on the first occasion of diagnosis in Australia, by either the diagnosing laboratory (ACT, NewSouth Wales, Tasmania, Victoria) or by a combination oflaboratory and doctor sources (Northern Territory,Queensland, South Australia, Western Australia). Cases of AIDS are notified through the State and Territory healthauthorities to the National AIDS Registry. Diagnoses ofboth HIV infection and AIDS are notified with the person's
date of birth and name code, to minimise duplicatenotifications while maintaining confidentiality.
Tabulations of diagnoses of HIV infection and AIDS arebased on data available three months after the end of thereporting interval indicated, to allow for reporting delay and to incorporate newly available information. More detailedinformation on diagnoses of HIV infection and AIDS ispublished in the quarterly Australian HIV SurveillanceReport, available from the National Centre in HIVEpidemiology and Clinical Research, 376 Victoria Street,Darlinghurst NSW 2010. Telephone: (02) 9332 4648Facsimile: (02) 9332 1837.
HIV and AIDS diagnoses and deaths following AIDSreported for 1 to 31 July 1998, as reported to 31 October1998, are included in this issue of CDI (Tables 6 and 7).
CDI Vol 22, No 13 24 December 1998 303
Additional Reports Communicable diseases surveillance
Table 5. Australian Sentinel Practice Research Network reports, weeks 44 to 47, 1998
Week number 44 45 46 47
Week ending on 8 November 1998 15 November 1998 22 November 1998 29 November 1998
Doctors reporting 53 57 58 53
Total encounters 6560 7401 6854 6546
Condition Reports
Rate per1,000
encounters Reports
Rate per1,000
encounters Reports
Rate per1,000
encounters Reports
Rate per1,000
encounters
Influenza 2.8 17 2.6 9 1.2 16 2.3 14
Rubella 0.1 2 0.3 3 0.4 1 0.1 0
Measles 0.0 0 0.0 0 0.0 0 0.0 0
Chickenpox 2.0 13 2.0 13 1.8 15 2.2 14
Pertussis 1.1 0 0.0 0 0.0 0 0.0 0
HIV testing (patient initiated) 1.6 7 1.1 10 1.4 12 1.8 10
HIV testing (doctor initiated) 0.4 2 0.3 7 0.9 3 0.4 0
Td (ADT) vaccine 7.0 41 6.3 51 6.9 39 5.7 45
Pertussis vaccination 6.1 43 6.6 56 7.6 54 7.9 36
Reaction to pertussis vaccine 0.1 1 0.2 1 0.1 1 0.1 2
Ross River virus infection 0.0 1 0.2 0 0.0 1 0.1 2
Gastroenteritis 9.0 85 13.0 98 13.2 103 15.0 86
304 CDI Vol 22, No 13 24 December 1998
Communicable diseases surveillance Additional Reports
Table 6. New diagnoses of HIV infection, new diagnoses of AIDS and deaths following AIDS occurring inthe period 1 to 31 July 1998, by sex and State or Territory of diagnosis.
ACT NSW NT Qld SA Tas Vic WA
Totals for Australia
Thisperiod1998
Thisperiod1997
Year todate1998
Year todate1997
HIV diagnoses Female 0 7 0 2 0 0 1 4 14 5 52 39
Male 0 29 0 8 1 0 5 4 47 62 375 431
Sex not reported 0 0 0 0 0 0 0 0 0 1 6 11
Total1 0 36 0 10 1 0 6 8 61 68 433 482
AIDS diagnoses Female 0 1 0 0 0 0 0 0 1 3 7 19
Male 0 4 0 1 0 0 3 0 8 21 110 186
Total1 0 5 0 1 0 0 3 0 9 24 117 205
AIDS deaths Female 0 1 0 0 0 0 0 0 1 1 5 9
Male 0 6 0 0 0 0 1 0 7 15 58 141
Total1 0 7 0 0 0 0 1 0 8 17 63 151
1. Persons whose sex was reported as transgender are included in the totals.
Table 7. Cumulative diagnoses of HIV infection, AIDS and deaths following AIDS since the introduction ofHIV antibody testing to 31 July 1998, by sex and State or Territory.
ACT NSW NT Qld SA Tas Vic WA Australia
HIV diagnoses Female 22 559 7 130 54 4 195 94 1,065
Male 183 10,366 98 1,840 637 77 3,712 864 17,777
Sex not reported 0 259 0 0 0 0 25 0 284
Total1 205 11,203 105 1,976 691 81 3,945 961 19,167
AIDS diagnoses Female 8 160 0 45 20 2 64 23 322
Male 82 4,388 32 766 324 41 1,551 337 7,521
Total1 90 4,559 32 813 344 43 1,622 362 7,865
AIDS deaths Female 2 113 0 28 15 2 46 16 222
Male 62 3,062 23 533 220 27 ,1213 241 5,381
Total1 64 3,182 23 563 235 29 1,265 258 5,619
1. Persons whose sex was reported as transgender are included in the totals.

Overseas briefsSource: World Health Organization (WHO)This material has been condensed from information on the WHO internet site. A link to this site can be foundunder ‘Related sites’ on the CDI homepage.
Food poisoning in northernMozambiqueThere have recently been reports of a small number ofdeaths and a larger number of cases of diarrhoea (withand without vomiting) in the province of Cabo Delgado.This outbreak has been attributed to the consumption offish contaminated with pesticides, but little scientific dataare available to substantiate these claims. Concurrently,there are outbreaks of both cholera and dysentery in thecountry and local health services have difficultydifferentiating between symptoms of chemical poisoningand illness caused by microbial pathogens. Approximately100 deaths have occurred and about 600 cases of illnesshave been reported by the provincial health authorities, but attributing these to either chemical or microbiologicalcontamination of food or water consumed is not possiblebecause of lack of reliable scientific data.
According to local health authorities in Cabo Delgado,there have been 2 deaths since 24 November, and theoutbreak is under control. Data from the Ministry of Healthsuggest that most of the cases of diarrhoea reported inCabo Delgado province have been associated with cholera and dysentery, rather than with pesticide poisoning. Thuscaution is advised in the absence of reliableepidemiological data.
It would appear that the “toxic event” associated withpesticide poisoning has passed its peak. The consumptionof dried fish may be a possible route of exposure to toxiclevels of pesticides, as the use of non-food-gradepesticides has been frequently reported in different parts of the world as a method for reducing insect spoilage of dried fish. The fisheries services in Mozambique are taking theappropriate prevention and control measures, and arecollecting samples to be forwarded to an internationalreference laboratory for analysis. WHO has assembled amultidisciplinary advisory team in consultation with thenational government agencies concerned and FAO.
Cholera/acute diarrhoea in SomaliaA significant increase in the number of cases of acutediarrhoea has been reported to WHO by Médecins sansfrontières (Spain), who have opened their choleratreatment centre in North Mogadishu as a result. Anaverage of 14 cases are being admitted daily to thisfacility. There have also been reports of a considerableincrease in the number of cases of acute diarrhoea
admitted to Benadir hospital in South Mogadishu sincemid-November. Of 22 stool samples tested, 20 werepositive for cholera. In areas surrounding Mogadishu, there has been no significant increase in acute diarrhoea cases.
CholeraBrazil
According to data from the National Centre forEpidemiology of the Ministry of Health in Brazil, 376 casesof cholera have been notified between 12 and 23November 1998, 24 of which have beenlaboratory-confirmed. The cases are occurring in the urban area of Cortez municipality (which has a population ofapproximately 13 000) in the region of Mata-Sul,Pernambuco State, in north-eastern Brazil. The source ofcontamination is thought to be the Rio Sirinhaém, fromwhich 80% of the water used by the population originates.The Health Department, in collaboration with water andsanitation authorities from the State of Pernambuco arecoordinating epidemiological surveillance, health education activities, water chlorination and case management. Themedical team will be reinforced with professionals fromother States. Supplies for the treatment of patients are inplace and the central laboratory is active in the area.Suspected cases have been notified in neighbouringareas, but without confirmation. This cholera outbreak isthe first to be reported in Brazil in l998.
Sri Lanka
An increase in the number of cholera cases has beenreported in the capital city Colombo. Of the 60 new casesreported in the week 16-22 November, 40 were registeredin Colombo district (including 32 in the city itself). Nodeaths have been reported.
Public health inspectors have been mobilized to trackdown sources of infection in Colombo city. In addition, theMinistry of Health has already implemented many choleracontrol activities throughout the country. However, cholerahas spread to several districts previously free of thedisease, where sanitation remains inadequate.
Sri Lanka is suffering from a cholera outbreak whichstarted at the end of September 1997. A total of 431 cases were reported for 1997. As of 13 November 1998, the total number of cases notified for 1998 is 1,264, with 36 deaths. On average, 125 cases per month have been reported this year, with a case-fatality rate of 2.7 %.
CDI Vol 22, No 13 24 December 1998 305
Overseas briefs

Overseas briefs
Editorial and Production Staff
Nicole Gilroy, Peter Mazzarol, Alison Milton, Kim Moser, EddieO’Brien
Editorial Advisory Board
Charles Watson (Chair), Mary Beers, Margaret Burgess, ScottCameron, John Kaldor, Margery Kennett, Cathy Mead
CDI is produced every four weeks by the National Centre forDisease Control, Department of Health and Family Services, GPOBox 9848 Canberra ACT 2601; fax: (02) 6289 7791, phone: (02)6289 6895. email; [email protected]
This journal is indexed by Index Medicus and Medline.
Subscriptions
Canberra Mailing, PO Box 650, Fyshwick ACT 2609, fax (02) 6269 1212
Website
Http://www.health.gov.au/pubhlth/cdi/cdihtml.htm
Contributions
Contributions covering any aspects of communicable diseasesare invited. All contributions are subject to the normalrefereering process. Instructions to authors can be found in CDI1998;22:11.
Copyright
Commonwealth of Australia 1998
This work is copyright. Apart from any use as permitted underthe Copyright Act 1968, no part may be reproduced by anyprocess without prior written permission from theCommonwealth available from AusInfo. Requests and inquiresconcerning reproduction and rights should be addressed to theManager, Legislative Services, AusInfo, GPO Box 1920,Canberra ACT 2601.
Opinions expressed in CDI are those of the authors and notnecessarily those of the Department of Health and FamilyServices or the Communicable Diseases Network Australia New Zealand. Data may be subject to revision.
A note from the Editorial TeamThe editorial team of Communicable Diseases Intelligence (CDI) would like to wish all our readers andcontributors a very Merry Christmas, and all the best for 1999.
This is the last issue of CDI for 1998 and thus it is timely for us to express our thanks to all those who have contributed articles, surveillance reports, correspondence, commentaries, editorials, outbreak reports and data to CDI during 1998. We would also like to thank the article reviewers for their valued time and expert comment.
During 1998 we have lost the services of many of the people who helped to put CDI together. Theseinclude Ross Andrews, Scott Crerar, Graeme Oliver, Htoo Myint (our computer guru), Margaret Curran(who was the Assistant Editor), Corrine Rann (Deputy Editor) and Bronwen Harvey (Editor). We wishthese people well in their later endeavours.