rome june 4 - europa
TRANSCRIPT

Pier Carlo Padoan
Deputy Secretary-General and
Chief Economist, OECD
European Parliament
Addressing macroeconomic
imbalances in Europe
20 January, 2014 - Brussels

2
Growth prospects remain strongest in the
emerging economies, weak in EU
Projected change in real GDP in 2014-15 Annual average, per cent
1. BRIICS countries comprise Brazil, China, India, Indonesia, Russia and South Africa.
Source: OECD Economic Outlook database 94.
CHN IND MEX KOR ZAF USA POL AUS SWE CAN SVK BRA IRL HUN DNK FIN FRA ITA ESP NLD-1
0
1
2
3
4
5
6
7
8
-1
0
1
2
3
4
5
6
7
8
IDN CHL TUR ISR EST NZL NOR ISL RUS CHE GBR LUX AUT DEU CZE BEL JPN PRT GRC SVN
BRIICS1
Euro area countries
Other OECD member countries

3
The current recovery is still weak by past
standards…
Note: The point labelled “t” on the horizontal axis corresponds to the pre-recession peak quarter for each cycle.
Source: OECD National Accounts database.
OECD-wide real GDP, relative to pre-recession peak Per cent
-5
0
5
10
15
20
-5
0
5
10
15
201970s; Peak at 1974Q3 1980s; Peak at 1981Q3
1990s; Peak at 1990Q4 2000s; Peak at 2008Q1

4
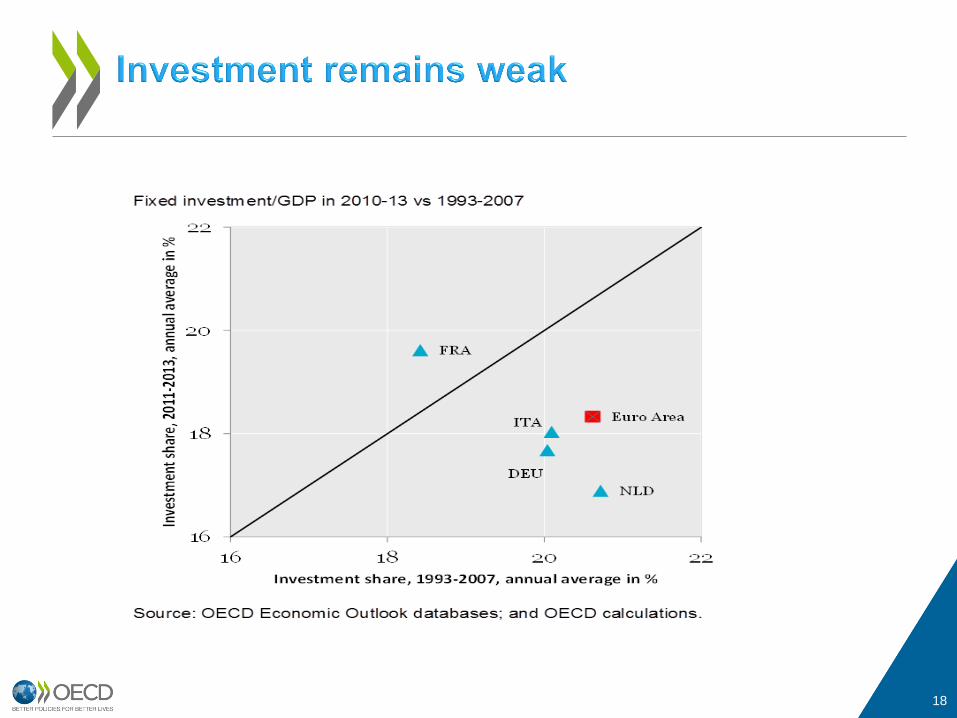
Weakness in investment…
OECD-wide fixed investment Volume, 2007 = 100
Note: Fixed investment values are the weighted average of OECD member countries, where the weights are GDP
measured at 2005 PPP USD.
Source: OECD Economic Outlook 94 database, OECD Foreign Direct Investment (FDI) Statistics.
World FDI flows Index of USD values, 2007 = 100
75
80
85
90
95
100
105
75
80
85
90
95
100
105
0
20
40
60
80
100
120
0
20
40
60
80
100
120

5
Credit lagging in EA …
Bank loans to non-financial private sector 2007 = 100
80
85
90
95
100
105
110
Euro area United States Japan
Note: Major OECD economies is calculated as the weighted average of the indices (2007 = 100) of nominal bank credit
to the non-financial private sector for the United States, the euro area and Japan, where the weights are GDP in 2007
measured at USD PPP.
Source: Datastream and European Central Bank.
80
85
90
95
100
105
110
Major OECD economies
6
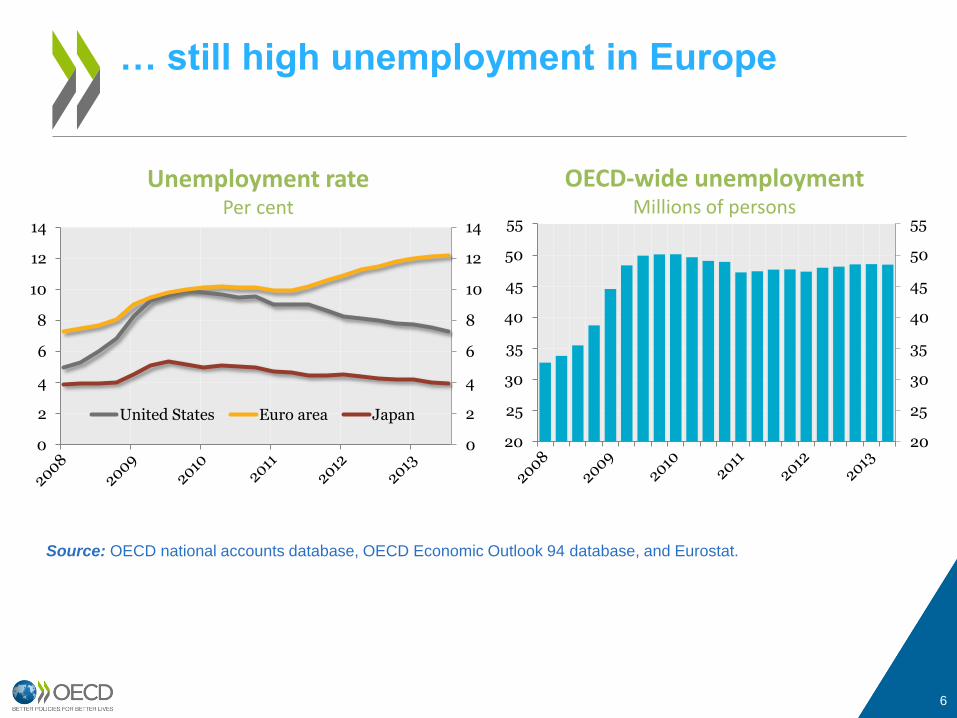
… still high unemployment in Europe
Unemployment rate Per cent
Source: OECD national accounts database, OECD Economic Outlook 94 database, and Eurostat.
0
2
4
6
8
10
12
14
0
2
4
6
8
10
12
14
United States Euro area Japan
OECD-wide unemployment Millions of persons
20
25
30
35
40
45
50
55
20
25
30
35
40
45
50
55

7
CA imbalances (misallocation)
Fragmentation (credit market imbalances)
Competitiveness (structural imbalances)
Adjustment, macroeconomic and structural
EA macroeconomic imbalances
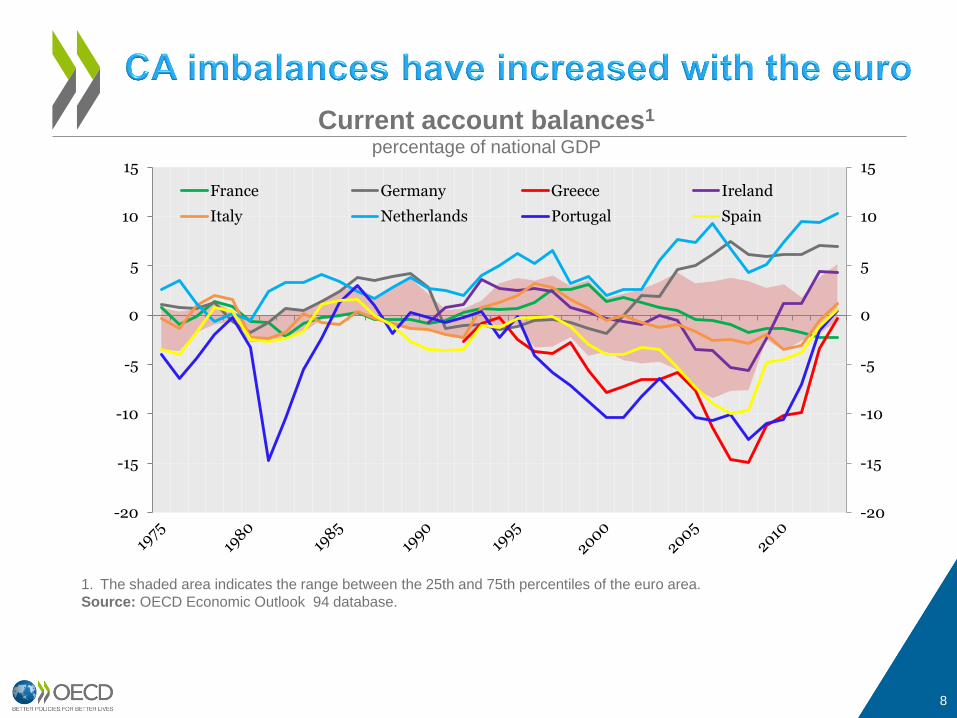
8
Current account balances1 percentage of national GDP
1. The shaded area indicates the range between the 25th and 75th percentiles of the euro area.
Source: OECD Economic Outlook 94 database.
-20
-15
-10
-5
0
5
10
15
-20
-15
-10
-5
0
5
10
15
France Germany Greece Ireland
Italy Netherlands Portugal Spain

9
In the EA, CA imbalances reflected divergence
in growth and competitiveness...
Source: OECD Economic Outlook 94database.
AUT
BEL
FIN
FRA
DEU
GRC IRL
ITA NLD PRT
SVK
SVN
ESP
0
1
2
3
4
5
6
7
-10 -5 0 5 10 15
To
tal
do
me
sti
c d
em
an
d g
ro
wth
, %
Current account balance, % of GDP
Unweighted average
Change in total domestic demand and unit labour cost in relation to
current account balance, Annual average, 2002-2007
AUT
BEL
FIN FRA
DEU
GRC
IRL
ITA
NLD
PRT
ESP
-2
-1
0
1
2
3
4
5
-10 -5 0 5 10
ch
an
ge
in
no
min
al
un
it l
ab
ou
r c
os
t, %
Current account balance, % of GDP
Eu
ro a
rea
av
era
ge

10
... in interest rates and loan accumulation
External balances, interest rate gaps and loan growth Annual average, 2002-07
1. Interest rate gap defined as the deviation of short-term interest rates from a simple Taylor rule with coefficients of 0.5 on the
output and inflation gaps, a core HICP inflation target of 1.9% and neutral real interest rate of 2.1%.
Source: OECD Economic Outlook 94 database; European Central Bank.
AUT BEL FIN
FRA
DEU
GRC
IRL
ITA NLD PRT
ESP
-3,5
-3,0
-2,5
-2,0
-1,5
-1,0
-0,5
0,0
-10 -5 0 5
Inte
re
st
ra
te g
ap
1
Current account balance, % of GDP
AUT
BEL
FIN
FRA
DEU
GRC
IRL
ITA NLD PRT
ESP
-5
0
5
10
15
20
25
-10 -5 0 5 10
Gr
ow
th o
f M
FIs
lo
an
s t
o n
on
MF
Is,
%
Current account balance, % of GDP

11
Markets assessments have increasingly
reflected CA imbalances, sovereign debt
dynamics and systemic factors
Sovereign bond yields percentage points
0
10
20
30
40
0
10
20
30
40DEU ESP FRA GRC
IRL ITA PRT
Note: Sovereign bond is 10-year benchmark government bond.
Source: Datastream.

12
Risk assessments have spilled over into private
funding conditions, aggravating divergence and
hindering rebalancing
Interest rates on loans to non-financial corporations Per cent
1
3
5
7
1
3
5
7
DEU ESP FRA IRL
ITA PRT GRC
Note: Interest rate is defined as an interest rate on new loans to non-financial corporations
(all maturities) with the exception of Greece where it refers to new loans with maturity of up
to one year.
Source: European Central Bank.

13
Sovereign spreads and yields have gone down in periphery reflecting market optimism. But credit fragmentation remains
The Asset Quality Review and stress tests must be implemented rigorously – and followed up by bank recapitalisation where needed
Further progress must be made on establishing a fully fledged banking union with an adequate joint fiscal backstop
Addressing fragmentation requires
financial repair…

14
…and real adjustment. EA countries have
made progress on structural reform…
Responsiveness to Going for Growth recommendations, 2011-12 Adjusted for the difficulty of undertaking reform¹
1. The adjusted responsiveness rate is calculated as the share of recommendations in Going for Growth 2011
for which 'significant' action has been taken, where each recommendation is weighted by the inverse of average
responsiveness to priorities in this area in non-crisis circumstances, in order to reflect the fact that some areas of
reform are more difficult than others. The euro area and OECD rates are calculated as an unweighted average;
the OECD rate is not adjusted.
Source: OECD Going for Growth 2013.
0,0
0,5
1,0
0,0
0,5
1,0
GRC IRL PRT ESP ITA Euroarea
OECD
15
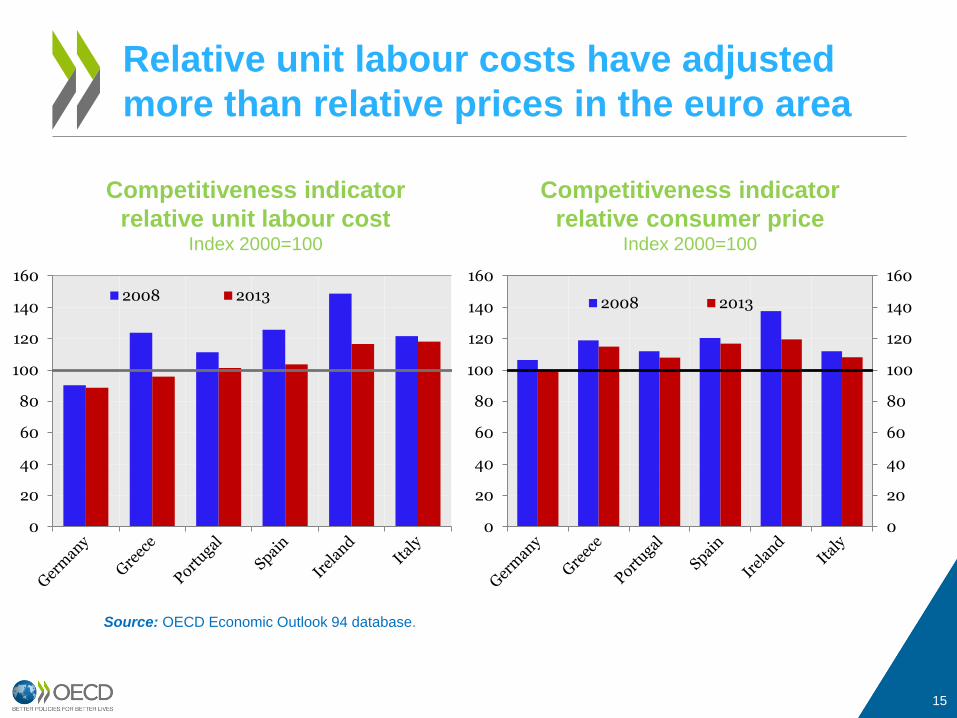
Relative unit labour costs have adjusted
more than relative prices in the euro area
Competitiveness indicator
relative unit labour cost Index 2000=100
Competitiveness indicator
relative consumer price Index 2000=100
0
20
40
60
80
100
120
140
160
2008 2013
0
20
40
60
80
100
120
140
160
0
20
40
60
80
100
120
140
160
2008 2013
Source: OECD Economic Outlook 94 database.

16
Structural reforms are assisting
internal rebalancing…
Contributions to improvement in net exports since 2007-081
In per cent of 2007-08 euro area GDP1
1. The values shown are the changes between Q4 2007 – Q3 2008 and Q3 2012 – Q2 2013.
Source: OECD Economic Outlook 94 database.
-0,5
0,0
0,5
1,0
1,5
-0,5
0,0
0,5
1,0
1,5
Greece Ireland Italy Portugal Spain
Fall in imports Rise in exports Change in net exports

17
Although adjustment must be more
symmetric
Current account balance/GDP Per cent, 4-quarter moving average
Source: OECD National Accounts database.
-20
-15
-10
-5
0
5
10
-20
-15
-10
-5
0
5
10
DEU GRC ITA PRT ESP
18

19
ADDITIONAL SLIDES
20
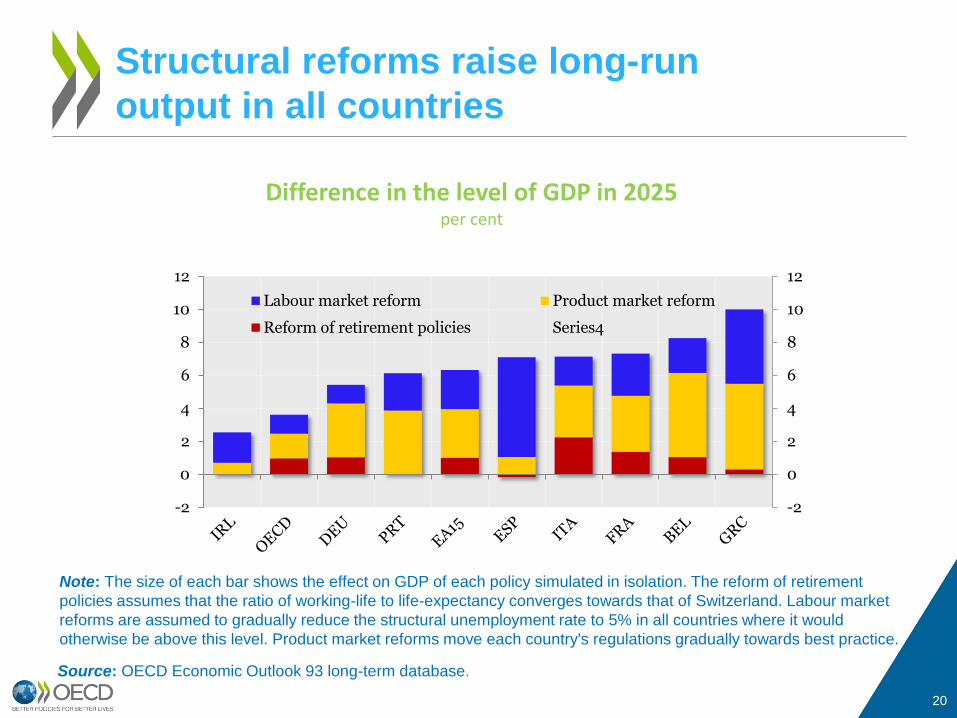
Structural reforms raise long-run
output in all countries
Source: OECD Economic Outlook 93 long-term database.
Difference in the level of GDP in 2025 per cent
Note: The size of each bar shows the effect on GDP of each policy simulated in isolation. The reform of retirement
policies assumes that the ratio of working-life to life-expectancy converges towards that of Switzerland. Labour market
reforms are assumed to gradually reduce the structural unemployment rate to 5% in all countries where it would
otherwise be above this level. Product market reforms move each country's regulations gradually towards best practice.
-2
0
2
4
6
8
10
12
-2
0
2
4
6
8
10
12
Labour market reform Product market reform
Reform of retirement policies Series4

21
SR can produce benefit (higher growth) also in the short
term but full impact takes time
SR impact requires confidence (e.g. product market
reforms increase investment opportunities through more
competition, but investment requires confidence… and
finance)
SR impact can be limited if financial markets are not
repaired
SR short term impact may be weak if activity is low
Political and economic contagion can frustrate reform
efforts if market confidence does not improve

22
SR more intense in crisis countries, but risk of
reform fatigue
SR effort limited in core surplus countries.
“excessive competitiveness” ?
Contractual agreements?
Stronger links to budget consolidation?
More Single Market pressure?
New trade agreements can accelerate the
agenda ?
Incentives for structural reforms