romspen mortgage investment fund 2015 spreads.pdf · trustees’ letter dear fellow investors: we...
TRANSCRIPT

2015 annual r eport
ROMSPEN MORTGAGE
INVESTMENT FUND

Romspen has a long-term track record of
successful mortgage investing. With its origins
in the mid-60’s, Romspen is one of the largest
non-bank commercial/industrial mortgage lenders
in Canada with a portfolio in excess of $1.5 billion.
Our investors are high net worth individuals,
foundations, endowments and pension plans.
The Fund’s investment mandate is focused on
capital preservation, strong absolute returns and
performance consistency.
We originate, own and service short-term first
mortgages tailored to specific borrower requirements.
Loans are conservatively underwritten and we keep
to a limited, but diversified, pool of mortgages to
maintain a “high-touch” approach to investing.
Romspen has had 20 consecutive years of positive
net investor returns (7.4% - 10.8%) with positive
returns each and every month.
Investor ValueOur primary objective is to protect unitholder capital while providing a safe and consistent strong absolute cash return.
CommitmentManagers should be owners. As such, we have committed a significant portion of our net worth to the Fund and as a management group, are the largest non-institutional investor in the Fund.
PartnershipWe work collaboratively with our borrowers and syndication partners to ensure mutual success, even through difficult and unforeseen circumstances.
Long-term PerspectiveWhile we don’t choose to own property, we make lending decisions on the assumption we would be comfortable owning a property for the value of the mortgage. Our intention is to achieve consistent long-term returns through mortgage lending by applying proven strategies for financial and real estate management.
Risk ManagementAs managers, it is our responsibility to identify and manage the risk inherent with the mortgage portfolio. Rigorous property and borrower due diligence is fundamental to our lending decisions. Diversification by borrower, geography, property type and size is a deliberate strategy to smooth the effect of the business cycle over the long term.
ResponsibilityIt is our responsibility to provide forthright reporting to our unitholders at all times. We will communicate fully and promptly about problems and opportunities facing the Fund.
Romspen Business PrinciplesOur Business
Cover image: Hotel X construction project Toronto, Ontario Romspen Mor tgage Investment Fund 1

Key Metrics
$77.
4
2013
$91
.9
2014
$1
20.2
2015
Net Earnings ($ millions)
Strong net earnings
2013
$1,1
53.7
2014
$1,3
23.8
2015
$1,5
19.8
Investment Portfolio ($ millions)
Strong portfolio growth
$0.7
2
2013
$0.7
5
2014
$0.7
9
2015
Unitholder Distributions ($/unit)
Growing distributions
7.4%
2013
7.8
%
2014
8.2
%
2015
Unitholder Returns (net annual compounded %)
Improving returns
6%
2013
12
%
2014
10
%
2015
Net Leverage (% investment portfolio)
Low financial leverage Solid unit value
$9.9
4
2013
$9.9
7
2014
$9.9
5
2015
Unitholder Value* ($/unit)
23%construction
38%pre-development
39%term
28%$10-$20 million
21%$5-$10 million
39%over $20 million
12%under $5 million
34%Ontario
12%British Columbia
36%US8%
Other
10%Alberta
82%under 1 year
1%over 2 years
17%1-2 years
By Type
By Amount
By Geography
By Maturity
Well diversified portfolio
Comparative Performance Annual % Return
2014 20152013
S&P/TSX FTSE-TMX STBI T-bills Romspen
3.1
%
0.9
%
7.8
%
10.6
%
-8.3
%
8.2
%
2.6
%
0.5
%1.7
%
1.0
%
13
.0%
7.4
%
Strong outperformance
3 Year Accumulated Compounded Returns1
Romspen 25%S&P/TSX 15%FTSE-TMX STBI 8%T-bills 2%
1 Romspen returns are net; comparative benchmarks are gross returns | Source: Bank of Canada, TSX, RMIF Annual Reports
* Unitholder value equals NAV (net asset value) adjusted for material unrealized foreign exchange gains.
Investment Portfolio Profile As of December 31, 2015
Romspen Mortgage Investment Fund - 2015 Highlights
Romspen Mor tgage Investment Fund Romspen Mor tgage Investment Fund2 3

Trustees’ Letter
Dear Fellow Investors:
We are pleased to report that Romspen Mortgage Investment Fund (“the Fund”) performed well during 2015 and posted improved results from last year. For 2015, the Fund returned 8.2% net, reflecting both a strong absolute return and continued significant comparative outperformance against all major benchmarks. These results were ahead of last year and achieved despite an increasingly competitive lending environment and persistent record-low interest rates.
The Fund’s medium and long-term results also reflected similarly strong return performance. Romspen’s five and ten-year cumulative net returns have been 46% and 131% respectively, strongly outpacing all major benchmarks.
Financial Highlights
For the year ending December 31, 2015, the Fund earned net income of $120.2 million or $0.93 per unit compared to $91.9 million or $0.78 per unit in 2014. Approximately $21.6 million or $0.17 per unit of these earnings reflect unrealized foreign exchange gains. Distributions were $0.79 per unit for 2015 compared to $0.75 per unit for 2014. The compounded monthly net return to investors, based on distributions, was 8.2% compared to 7.8% last year. The increased return in 2015 primarily relates to increased interest income from greater operating line utilization throughout the year. Total provisions for credit losses were increased from $26.4 million to $37.3 million in the year to maintain a solid margin of safety with a larger portfolio and shift in asset mix. Actual losses of $3.0 million were realized during the year and charged against the provision previously established to deal with these properties.
At December 31, 2015, the net portfolio was $1.5 billion, an increase of 15% compared to 2014. Investors held units totalling $1.4 billion compared to $1.2 billion last year. The Fund’s portfolio and earnings remain well diversified by property type, geography, size and currency. Net debt (debt less cash) was $155.3 million compared to last year’s net debt of $152.8 million. The weighted average interest rate of the portfolio in 2015 was 10.6% compared to 10.5% in the previous year.
Unitholder value was $9.95 per unit compared to $9.97 per unit in 2014. These fluctuations arise as taxable income differs from IFRS income due to differences in the treatment of loss reserves, non-accrued interest and other tax considerations. The Fund intends to distribute 100% of its taxable income annually. Approximately 91% of the Fund’s foreign exchange exposure is hedged either by the borrowers directly or through forward contracts.
Economy, Markets & Portfolio
Canadian mortgages and investments represented $1 billion, or 64% of the investment portfolio, with the majority (34%) concentrated in Ontario. Increased interest from foreign buyers, low cost borrowing and limited available product caused Canadian real estate to perform well overall in 2015.
Investors shifted their attention from commodity-based markets such as Calgary and Edmonton in favour of markets such as Toronto and Montreal to capitalize on the economic shift to export and consumer-oriented companies. Lack of attractive product acted to constrain activity and the finite nature of Canada’s investible universe and high relative prices caused some investors to invest abroad. The frequent absence of appropriate risk premiums in Canada underscores the merits of diversification into the US market. This has enhanced yields and represents prudent risk management through diversification into a recovering economy where real estate valuations are less elevated.
US mortgages represented $556 million, or 36% of the portfolio in 2015 compared to $351 million, or 26% last year. The US portfolio includes 48 loans that are well diversified across 17 states. The US market strengthened in 2015 as the availability of capital, an improving economy and historically low interest rates pushed sales volumes higher for all asset classes, particularly in the retail and multi-residential property sectors. Domestic investors broadened their focus beyond the top investment destination cities as the availability of financing from traditional and nontraditional channels improved. International interest in US real estate accelerated resulting in increased purchases by foreign buyers seeking to take advantage of the relative stability and improving economic fundamentals of the US economy.
Despite improving credit conditions in the US, the competitive landscape for the highly customized lending we offer remains relatively underserved. Our multi-year presence in the market and reputation for providing “high-touch” service, continues to generate numerous opportunities to deploy capital into a diverse set of projects within the parameters of our strict lending criteria. The majority of the portfolio and our attention remains solidly grounded in Canada where the competitive environment remains challenging.
Non-performing loans totalled 21% of the portfolio. The expectation that some portion of mortgages will become non-compliant is taken into account in pricing and setting the terms of our mortgages. Non-compliant loans should not, however, be equated with losses. More typically, they result in extended terms, foregone interest and increased administration to achieve successful outcomes, but rarely result in losses of principal. In the past decade, since the Fund’s inception, realized loan losses have amounted to only $16.7 million on over $4 billion of invested capital, or about 0.4%. Managing these non-compliant
mortgages effectively is an important aspect in preserving capital and generating strong, consistent returns over the long run. Right-siding certain of these mortgages will facilitate profitable redevelopment opportunities for the Fund.
Strategy & Investment Approach
The Fund follows a focused business model and strategy concentrated on first mortgage lending to commercial and industrial properties in North America. Since inception, our mandate has remained unchanged and focused on capital preservation, absolute returns and consistent performance. Our objective is to make money for our investors on a constant basis, regardless of prevailing market and economic conditions. Disciplined execution of this mandate has produced superior performance metrics spanning more than four decades. This is perhaps most evident in the fact that the Fund has not had a single month of negative investment performance over the past 20 years while convincingly outperforming the major benchmarks consistently. A detailed profile of this performance is presented at the end of this report (pp. 46-47).
In the next section of this report we profile a range of recent and typical mortgage investments within the portfolio. All of these examples provide insight into how investment objectives and strategy are reflected in actual transactions that create value for our investors. While they illustrate the diversity of borrowers, property types, loan requirements and locations, they share a commonality in aggregate, as they have the key characteristics we look for in meeting our investor mandate.
Strong Investment Track Record Continues
The Fund’s 8.2% net return significantly outperformed T-bills (0.5%), FTSE/TMX Short-Term Bond Index (“FTSE/TMX-STBI”) (2.6%) and the poor performing S&P/TSX (-8.3%) during 2015. Looking at long-term performance over the past ten years to December 31, 2015, the Fund significantly outperformed these benchmarks with accumulated net returns of 131%; compared to 17% for T-bills; 46% for the FTSE/TMX-STBI and 54% for the S&P/TSX. Viewed simplistically, a $10.00 investment in January 2005 would have returned $13.10 to an investor in the Fund compared to only $1.70 in T-bills; $4.60 in the FTSE/TMX-STBI; and $5.40 in the stock market.
As well, the Fund has shown positive returns each month over the past ten years, highlighting its conservative investing strategy through a significantly challenging economic cycle. While we appreciate the importance of yearly performance, we principally concentrate on making informed and prudent decisions to ensure optimal outcomes for the portfolio over the long term, which is what matters most to our investors.
Outlook
2015 saw a clear divergence between the recoveries of the US and Canadian economies. Evidence of a strengthening US economy resulted in the first interest rate increase since the financial crisis, in stark contrast to Canada where ongoing structural weakness will necessitate the continuation of accommodative monetary policy for years to come. The flexibility to invest capital in both countries facilitates enhanced risk management options during periods of uneven or sluggish economic advancement and increased market volatility.
The Canadian economy stalled in the fourth quarter as exports to the US lagged and the shock of low commodity prices, particularly for oil, continued to spread and hinder economic growth. While structural change in the economy is under way as the focus for economic growth shifts from commodity-based activity to manufacturing and export-oriented industries, it will take years for the beneficial impact of this shift to become evident. Canadian real estate activity has favoured a shift to Eastern Canada and overall valuations remain high as a result of capital aggressively seeking limited sources of yield. These valuations seem unsustainable in the current economic environment and we are ever mindful of this when evaluating and pricing risk.
Despite the recent rate increase in the US, interest rates will remain historically low in North America for an extended period as the Fed remains committed to gradual rate increases and the Bank of Canada considers the possibility of utilizing quantitative easing or negative interest rates as monetary tools to stimulate the economy. Observing the impact of foreign demand for real estate assets in politically stable countries, coupled with the actions of investors seeking relief from the increasing volatility of global markets, makes us cognizant that we must remain skeptical about current valuations and mindful that stubborn adherence to our proven risk management framework has never been more important. We will continue to patiently sift through opportunities to deploy capital in a manner that will deliver 2016 returns for the Fund that are consistent with the returns of 2015.
We are pleased with our 2015 performance and particularly proud of our long track record of consistent, predictable returns while ensuring investor capital is well protected. With our strong track record, management depth and diverse relationship network, the Fund is securely positioned to perform well during periods of market volatility and in the years ahead. On behalf of the Romspen team, we thank our investors for their on-going support, our borrowers who place their trust in us, and our loyal employees who work so hard to help achieve everyone’s expectations.
Respectfully submitted,
Sheldon Mark Arthur Wesley Esbin Hilson Resnick Roitman
Trustees of the Fund April 5, 2016
Romspen Mor tgage Investment Fund Romspen Mor tgage Investment Fund4 5

HIGH NET WORTH INDIVIDUALS.
FAMILY OFFICES.PENSION FUNDS.ENDOWMENTS.FOUNDATIONS.
TRUSTS.
At Romspen, we serve a broad investor mix each with different constituents and mandates. Whether it’s a major museum trust looking to add to a curated collection; a university pension fund focused on satisfying future retiree obligations; a family office building a legacy for future generations; or a charitable foundation dedicated to serving the community, they all share the common financial goals of capital preservation, strong absolute returns and consistent performance. Romspen plays an important role for all of these investors by helping them meet their financial objectives on a reliable basis under all prevailing market conditions.
Architectural Detail Maison de Jésus-Marie Montreal, Quebec
Romspen Mor tgage Investment Fund6

M O N T R E A L
MAISON DE JESUS-MARIE
Q U E B E C
Prior to year-end, Romspen financed this $23.2 million mortgage on the peak of Mont Royal, located in the posh Outremont neighbourhood of Montreal. This beautiful and historically designated former convent, originally constructed in 1925, encompasses 426,000 square feet and includes an extensively detailed limestone and brick façade, 12 foot ceilings and large windows, all set in lush landscaped surroundings. The property is within walking distance of the Metro, a short distance to the trendy boutiques, restaurants and upscale shopping on Avenue Laurier below and has arguably the best views in Montreal. The project will be redeveloped into a 200 unit luxury condo with high-end amenities.
Romspen Mor tgage Investment Fund 9

B R O O K LY N
200 KENT AVENUEN E W Y O R K
Romspen provided a US$21.5 million mortgage to refinance a full city block of vacant property for an experienced Brooklyn-based developer. The half-acre site is located in the vibrant Williamsburg neighbourhood of Brooklyn, a rapidly gentrifying area, filled with trendy restaurants and bistros, bars, boutiques, galleries and condos. The property is located adjacent to the East River with iconic views of Manhattan’s skyline and an easy subway commute to Midtown. A mixed-use development is planned for the site, with a lower level lease in place for upscale retailer Trader Joe’s, a top-rated and trendy supermarket chain.
Romspen Mor tgage Investment Fund10

C H I C A G O
GARVEY COURTI L L I NO I S
Romspen assisted in the purchase of this downtown Chicago retail and food court site from a bankruptcy proceeding in mid-2014. Our US$9.3 million mortgage helped finance the purchase and settlement of claims from the bankruptcy. Although the property is a prime high-density redevelopment site, being centrally located on a downtown corner at North Clark Street in the heart of Chicago, the project was somewhat complex and time consuming to undertake. Unfortunately, the borrower was unable to execute and ultimately defaulted on this loan. Romspen, however, was fully paid-out on all principal and interest owed by the second mortgagee who assumed the project. While not the anticipated outcome, this possibility did factor into our security analysis and the presence of a US$7 million subsequent charge materially reduced the possibility of any impairment to the Romspen loan.
Romspen Mor tgage Investment Fund 13

J E R S E Y C I T Y
107 MORGAN STREETN E W J E R S E Y
With commanding views of both Wall Street and the Statue of Liberty, this remarkably attractive 1.4 acre site with development potential of 850,000 square feet is close to unbeatable. As the photo illustrates, it’s the classic, “hole in the donut” real estate site as it is surrounded by substantial development in close proximity and is one of the few remaining large scale sites in this highly desirable neighbourhood. The area is a prime location for New Yorkers priced out of the central Manhattan market who can live here at half the comparable occupancy cost, access a full venue of high-end neighbourhood amenities and commute to the World Trade Center in Lower Manhattan by subway in under 10 minutes. Romspen lent US$32.7 million to help the borrower refinance an existing mortgage as they work to negotiate a sale of the property, which is generating substantial interest with offers to purchase well in excess of our loan.
Romspen Mor tgage Investment Fund14

T O R O N T O
H O T E L XO N TA R I O
Situated on just over nine acres of near-lakefront property on the Exhibition grounds and encompassing more than a half million square feet, the $250 million Hotel X complex ranks as one of Toronto’s larger construction projects. Romspen’s $100 million construction facility is well supported in the project economics, an experienced entrepreneurial, New York City-based hotelier with a strong track record across a range of hotel concepts, significant equity backing and a top-notch construction management firm. The 29-storey, 406 room hotel will include conference facilities, a large sports club, retail space, theatres and a stunning rooftop pool/bar/entertainment venue with 360 degree views of the Toronto skyline. Construction is now well advanced and opening is scheduled for Fall 2016.
Romspen Mor tgage Investment Fund 17

V I C T OR I A
R O U N DHOUS E DE V E LOPM E N T
B R I T I S H C O L U M B I A
This $78 million multi-facility financing, comprising four properties in Alberta and British Columbia, was extended to an experienced and successful developer Romspen had previously lent to. This project, located in Victoria, British Columbia, comprised 9.2 acres of former Canadian Pacific rail yards and had environmental issues that made traditional financing challenging, yet were well within the scope of what we have seen and managed in other projects. The site is approved for 800,000 square feet of mixed-use development and will be built out in phases following the environmental remediation that will include the preservation and restoration of the former railroad roundhouse.
Romspen Mor tgage Investment Fund18

M O N T R E A L
L E M U R R AYQ U E B E C
In the Fall of 2014, Romspen provided a $45 million refinancing and construction facility to complete this 284 unit condo situated on just under an acre of land in the Griffintown neighbourhood of Montreal. With 75% pre-sales, large buyer deposits, a strong location and experienced developers, it was clearly in the sweet spot of what we look for. This stunning project was a resounding success, sold out quickly and our loan retired.
Romspen Mor tgage Investment Fund 21

Management’s Discussion & Analysis
Responsibility of Management
This Management’s Discussion and Analysis (“MD&A”) for Romspen Mortgage Investment Fund (“the Fund”) should be read in conjunction with the financial statements and notes thereto for the year ended December 31, 2015 included herein and the audited financial statements and MD&A for the year ended December 31, 2014. Investment in the Fund is subject to certain risks and uncertainties described in the Fund’s Offering Memorandum, which should be read in conjunction with this MD&A. These documents are available on our website at: www.romspen.com.
Management is responsible for the information disclosed in this MD&A. The Fund has in place appropriate procedures, systems and controls to ensure such information is materially complete and reliable. In addition, the Fund’s trustees have reviewed and approved the MD&A and the financial statements for the year ended December 31, 2015.
This MD&A contains certain forward-looking statements and non-IFRS financial measures, see “Forward-Looking Statements” and “Non-IFRS Financial Measures”.
Forward-Looking Statements
From time to time, the Fund makes written and verbal forward- looking statements. These are included in its quarterly and annual Management’s Discussion and Analysis, Fund presentations and other Fund communications.
Forward-looking statements include, but are not limited to, business objectives and targets, Fund strategies, operations, anticipated financial results and the outlook for the Fund, its industry, and the Canadian economy. These statements regarding future performance are “financial outlooks” within the meaning of National Instrument 52 102. Forward-looking statements are typically identified by words such as “believe”, “expect”, “anticipate”, “estimate”, “plan”, “may”, and “could” or other similar expressions. By their very nature, these statements require us to make assumptions and are subject to inherent risks and uncertainties, general and specific, which may cause actual results to differ materially from the expectations expressed in the forward-looking statements. These risks and uncertainties include, but are not limited to, global capital market activity, changes in government monetary and economic policies, changes in interest rates, changes in foreign exchange rates, inflation levels and general economic conditions, legislative and regulatory developments, competition and technological change.
The preceding list is not exhaustive of possible factors. These and other factors should be considered carefully and readers are cautioned not to place undue reliance on these forward- looking statements. The Fund does not undertake to update
any forward-looking statements, whether written or verbal, that may be made from time to time by it or on its behalf except as required by securities laws.
Non-IFRS Financial Measures
This MD&A contains certain non-IFRS financial measures. A non-IFRS financial measure is defined as a numerical measure of the Fund’s historical or future financial performance, financial position, or cash flows that excludes amounts or is subject to adjustments that have the effect of excluding amounts, that are included in the most directly comparable measure calculated and presented in accordance with IFRS in the financial statements or includes amounts, or is subject to adjustments that have the effect of including amounts, that are excluded from the most directly comparable measure so calculated and presented. Non-IFRS financial measures disclosed herein are meant to provide additional information and insight regarding the historical operating results and financial position of the Fund. These measures are not in accordance with or a substitute for IFRS and may be different from or inconsistent with non-IFRS financial measures used by others.
Introduction
The Fund is an unincorporated closed-end investment trust established under the laws of the Province of Ontario pursuant to a trust indenture dated as at May 20, 2005. The Fund is a non-bank lender providing and investing primarily in short-term and medium-term commercial mortgages. The Fund is the sole limited partner in the Romspen Mortgage Limited Partnership (the “Partnership”) and conducts its lending activities primarily through the Partnership. The objective of the Fund is to provide stable and secure cash distributions of income while preserving equity.
Romspen Investment Corporation (“Romspen”) is the Fund Manager and acts as the primary loan originator, underwriter, administrator and syndicator for the Partnership. Romspen also acts as administrator of the Fund’s affairs. Romspen and its principals, through predecessor companies, have been in the business of mortgage origination, servicing and syndication since 1966.
The Fund commenced operations on January 16, 2006, and raised $158.9 million pursuant to the Exchange Offering, whereby Romspen’s investors exchanged their syndicated mortgage interests for units of the Fund, and $15.3 million pursuant to the Unit Offering described in its Offering Memorandum dated March 15, 2005.
On June 22, 2007, new federal legislation came into force that altered the taxation regime for specified investment flow-through trusts or partnerships (“SIFT”) (the “SIFT Rules”). Under the SIFT Rules, certain distributions from a SIFT will no longer be
deductible in computing a SIFT’s taxable income and a SIFT will be subject to tax on such distributions at a rate that is substantially equivalent to the general corporate tax rate. Distributions paid by a SIFT as returns of capital will not be subject to the tax. As its units are not listed on a stock exchange or other public market, the Fund is not subject to the SIFT tax regime.
The Offering Memorandum, financial statements and additional information on the Fund are available and updated regularly on the Fund’s website at: www.romspen.com. Unitholders who would like further information may also contact the Investor Relations department of the Fund at: 416-966-1100.
Portfolio
As of December 31, 2015, the Fund’s mortgage and investment portfolio (the “Portfolio”), net of fair value provisions, was $1.5 billion compared with $1.3 billion at December 31, 2014. This increase of $196 million or 15% reflects the increased activity in mortgage markets supported by a strong inflow of investor capital. The Portfolio included 153 mortgages and investments compared to 149 at the same time last year.
Approximately 96% of the Portfolio was invested in first mortgages at December 31, 2015 which is the same as the prior year. The weighted average interest rate of the Portfolio increased slightly at 10.6% compared to a year ago at 10.5%. Portfolio interest rates have remained relatively flat reflecting the prevailing interest rate environment.
The Portfolio continues to consist mainly of short-term mortgages to third parties and mortgages to the Fund’s investment subsidiaries. Approximately 82% of the Portfolio’s investments mature within one year (December 31, 2014 - 90%) and 99% mature within two years (December 31, 2014 - 99%). In addition, all of our mortgages are open for repayment prior to maturity. The short-term nature of the Fund’s portfolio permits opportunities to continually and rapidly evolve the portfolio in response to changes in the real estate and credit markets. The Fund Manager believes this flexibility is far more important in our market niche than securing long-term fixed interest rates.
As of December 31, 2015, approximately 34% of our investments were in Ontario, compared to 43% a year ago. Approximately 23% of the Portfolio was invested in Western Canada, 7% in other provinces and 36% in the US. The Fund Manager believes this broad level of North American diversification adds stability to the Fund’s performance by reducing dependency on the economic activity and cycles in any given geographic region.
Total fair value provisions as of December 31, 2015 were $37 million, which represented 2% of the original cost of the Fund’s investments or $0.27 per unit outstanding as at December 31, 2015. During 2015, the Fund realized $3.0 million of losses in the Portfolio that
were fully reserved for in previous years. The establishment of the fair value provision is based on facts and interpretation of circumstances
relating to the Fund’s portfolio. Thus, it is a complex and dynamic process influenced by many factors. The provision relies on the judgment and opinions of individuals on historic trends, prevailing legal, economic, and regulatory trends and on expectations of future developments. The process of determining the provision necessarily involves risk that the actual outcome will deviate, perhaps substantially, from the best estimates made. The fair value provision will continue to be reviewed by the Fund Manager and the Fund’s trustees on a regular basis and, if appropriate, will be adjusted.
Income Statement Highlights
Total revenues for the year ended December 31, 2015 were $155.1 million compared to $124.6 million in the previous year, a 24% increase. Current year revenues are higher because of the inclusion of higher unrealized foreign exchange gains from the appreciation of the US dollar and growth in the size of the Portfolio.
Similarly, net earnings for the year ended December 31, 2015 were higher at $120.2 million compared to $91.9 million for the prior year. This increase reflects the Portfolio growth and foreign exchange gains noted above, principally offset by the increase in reserve expense compared to 2014. The basic weighted average earnings per unit for the year were $0.93 per unit, compared to $0.78 last year.
For the year ended December 31, 2015, the Fund distributed $101.9 million or $0.79 per unit versus $88.2 million or $0.75 per unit for the year ended December 31, 2014. The simple and compounded net yield to unitholders for the twelve month period ended December 31, 2015 were 7.9%1 and 8.2%1 respectively.
Provisions for losses on the Portfolio value reflected an increase of $10.9 million in 2015 while realized losses were $3.0 million in 2015 compared to $3.2 million in the prior year. Management and other fees payable to the Fund Manager and other general and administrative expenses of the Fund were $16.5 million for the year ended December 31, 2015 compared to $13.9 million in the prior year. These expenses were marginally higher than the previous year and reflect the larger Portfolio value.
Total revenues for the quarter ended December 31, 2015 were $41.4 million compared with $36.4 million for the comparative year ago period and are attributable to a larger Portfolio and unrealized foreign exchange gains in the last quarter of 2015.
Net earnings after all expenses for the fourth quarter were $31.2 million compared to $22.9 million for the quarter ended December 31, 2014. Basic weighted average earnings per unit for the three months ended December 31, 2015 were $0.23 compared to $0.19 in the prior year.
1 These are non-IFRS financial measures (see “Non-IFRS Financial Measures”).
Romspen Mor tgage Investment Fund Romspen Mor tgage Investment Fund22 23

Management fees payable to the Fund Manager and other general and administrative expenses of the Fund were $5.0 million for the quarter compared to $3.5 million in the previous year. These expenses were marginally higher than the previous year and reflect the larger portfolio value and the revolving loan facility.
For the three-month period ended December 31, 2015, the Fund distributed $25.7 million or $0.19 per unit, versus $24.0 million or $0.20 per unit for the three months ended December 31, 2014.
Detailed financial information by quarter for 2015 is outlined in the chart below:
Balance Sheet Highlights
Total assets as of December 31, 2015 were $1.6 billion compared to $1.4 billion a year ago. Under IFRS, mortgages that are owed from subsidiary companies holding foreclosed properties have been reclassified from mortgage investments to investment in subsidiaries. Total assets are comprised primarily of mortgages recorded at fair market value, investments in subsidiaries, and accrued interest receivable. In addition, the Fund had $12.8 million of excess cash at year end.
Total liabilities excluding units submitted for redemption as of December 31, 2015 were $197.7 million compared with $178.3 million a year earlier. Liabilities at the year end were comprised mainly of a $168.1 million line of credit, and $9.8 million in accounts payable and distribution payable to unitholders. Drawings under the revolving loan facility, together with net cash proceeds of the Unit Offering, are used to
increase the Portfolio. The revolving loan facility bears interest not exceeding prime plus 1.0% and is secured by all assets of the Partnership and a pledge of all Partnership units held by the Fund. Net debt (debt less unrestricted cash) stood at $155.3 million (10% of the Portfolio) at the year end versus $152.8 million (12% of the Portfolio) a year ago.
Unitholders’ equity plus units submitted for redemption as of December 31, 2015 were $1.4 billion compared with $1.2 billion as of December 31, 2014. The increase is primarily from proceeds of issuances of $221.1 million in excess of redemptions of $56.6 million during the previous 12 months. There were a total of 137,286,096 units outstanding on December 31, 2015 compared to 120,847,181 on December 31, 2014. There are no options or other commitments to issue additional units.
Liquidity And Capital Resources
Pursuant to the trust indenture, 100% of the Fund’s taxable earnings are intended to be distributed to unitholders. This means that growth in the Portfolio can only be achieved through the raising of additional unitholder equity and utilizing available borrowing capacity. Pursuant to the Fund’s investment policies, the Fund may borrow up to 35% of the book value of mortgages held by the Fund. As of December 31, 2015 borrowings net of cash totalled approximately 10%3 of the book value of investments held by the Fund compared to 12%3 net borrowings as of December 31, 2014.
During the year ended December 31, 2015, proceeds from the issuance of units, net of redemptions and costs, were $164.5 million compared to $95.6 million during the same period in 2014.
The Fund’s mortgages are largely short-term in nature with the result that continual repayment by borrowers of existing mortgages creates liquidity for new mortgage investments. We expect next year’s growth in the Portfolio to outstrip our funding capability based on current resources. As such, we expect to raise additional equity in future periods and syndicate a portion of new loans to third parties.
Related Party Transactions
Romspen acts as mortgage manager for the Partnership and administrator for the Fund. The trustees of the Fund are all principals of Romspen. In consideration for its mortgage origination and capital raising services, Romspen receives a fee equal to 1% per annum, calculated daily and paid monthly, of the total of all mortgage investments plus the fair value of any non-mortgage investments. Romspen also receives all lender, broker, origination, commitment, renewal, extension, discharge, participation, and other administrative fees charged to borrowers. In addition, the Partnership has granted to Romspen the option to purchase any mortgage investment held by the Partnership for a purchase price equal to the principal amount of such mortgage plus any accrued interest.
From time to time, the Partnership may invest in mortgage loans made to borrowers who are related to Romspen or the trustees of the Fund. The Partnership may also invest in mortgages which are syndicated among Romspen, the Fund’s trustees, or related parties. These related party transactions are further discussed in the notes to the accompanying consolidated financial statements.
Risk Management
The Fund is exposed to various financial instrument risks in the normal course of business. The Fund manager and trustees have put in place various procedures and safeguards to mitigate these risks in order to ensure the preservation of capital as well as the achievement of acceptable and consistent rates of return. For details on financial instrument risks and management’s response to these risks, please see note 15 of the Financial Statements.
Outlook
Global economies burdened by high and increasing debt levels, a lack of synchronized economic performance and persistent weakness in business investments, particularly for commodity-producing nations, showed little signs of growth in 2015. Much of the underperformance is attributable to the familiar theme of China’s shift from a traditional manufacturing and industrial economy to higher value-added production and consumer-oriented economy, the subsequent collapse in commodity prices and the resultant cutbacks in investment and hiring. Globally, and out of necessity, monetary policy will remain accommodative resulting in low or in some instances, negative interest rates for the foreseeable future.
Canada’s lacklustre growth in 2015 was characterized by retrenchment in investment in hiring and investment in energy-dominated provinces while BC and the central provinces benefited from economies that are more diversified into manufacturing, services, retail-wholesale activity and residential construction. Weakness in commodity prices was broadly based with overall declines of approximately 30% in 2015 as compared to 2014. The impact of lower prices, particularly for oil and a low dollar will necessitate significant structural change in the economy to capitalize on stable domestic demand and a shift to export-oriented industries. This shift will evolve over several years and will require the Bank of Canada to maintain an accommodative monetary policy until the economy’s excess capacity is absorbed making a low interest rate environment a certainty for years to come.
In 2015, housing investment was the fastest growing component of Canadian GDP fueled by a limited supply of single family homes, low interest rates, foreign buyers and job gains. This performance is unlikely to be repeated in 2016 due to affordability issues in Canada’s largest markets, particularly Vancouver and Toronto. Prices for commercial real estate have enjoyed steady appreciation since the recession which does not appear to be broadly sustainable in 2016, given economic headwinds, particularly in commodity-based markets.
Quarterly Financial Information 2015$ in millions, except per unit amounts
Dec. 31 Sept. 30 Jun. 30 Mar. 31
Total revenue excluding unrealized foreign exchange gain (loss) $ 36.5 $ 38.0 $ 30.2 $ 30.8
Unrealized foreign exchange gain (loss) 7.9 13.6 0.2 (0.2)
Realized foreign exchange gain (loss) (2.9) 1.6 (0.6) 0.0
Interest expense and deferred financing costs 2.0 1.1 1.0 0.9
Net interest income 39.5 52.1 28.8 29.8
Management fees and other expenses 5.0 4.0 3.8 3.7
Fair value provision on investment portfolio and losses 1.9 6.1 1.0 1.9
Realized losses on investment portfolio 1.7 1.4 - -
Other losses (0.3) (0.0) (0.0) (0.1)
Net earnings 31.2 40.6 24.0 24.3
Per unit - net earnings $ 0.23 $ 0.31 $ 0.19 $ 0.20
- distributions $ 0.19 $ 0.21 $ 0.19 $0.20
Trailing 12 month compounded return2 8.2% 8.3% 8.0% 8.0%
Revolving loan net of cash as a percentage of net mortgages2 11% 15% 14% 17%
3 These are non-IFRS financial measures (see “Non-IFRS Financial Measures”).2 These are non-IFRS financial measures (see “Non-IFRS Financial Measures”).
Romspen Mor tgage Investment Fund Romspen Mor tgage Investment Fund24 25

While investor interest has been high in view of the volatility of equity markets and the low yield environment, lack of attractively valued product has shifted investor capital abroad to more reasonably priced markets.
In the US, economic fundamentals remain solid as the economy slowly recovers. Household spending will continue to be supported by low energy prices, improving jobs and income. At year end, in response to growing inflationary pressures, the Federal Reserve shifted to a slightly less accommodative monetary policy with the implementation of the first interest rate increase since the recession. Interest rates are expected to increase very gradually over 2016 as the US faces headwinds from a softening global economy and the adverse impact of a high dollar on exports and corporate overseas earnings.
In the US, there is evidence of easing in residential mortgage conditions and as long as credit is available, housing will be an important source of growth for the American economy as supply has not kept pace with increased household formation and growing consumer demand. Commercial real estate prices in selected US markets have risen significantly from lows achieved during the recession. Aside from markets such as San Francisco and New York, where prices have more than doubled, much of the appreciation is based on the fundamentals of a solidly improving economy.
Romspen continues to enjoy robust deal flow as a result of the reach of our North American platform, large capital base relative to our competitors, reputation for service and proven capabilities to understand and manage complex projects. While we continue to lend to carefully vetted projects in Canada, a growing number of opportunities that conform to our proven risk management metrics are located in the US where credit conditions for borrowers have improved in line with a recovering economy. As a result, the US component of the Portfolio has grown to 36% at year end and is expected to increase throughout 2016. Given the favourable lending landscape, we anticipate that returns in 2016 will be on par with those of 2015.
Consolidated Financial Statements
Romspen Mortgage Investment FundYear ended December 31, 2015
Romspen Mor tgage Investment Fund26

To the Unitholders of Romspen Mortgage Investment Fund
We have audited the accompanying consolidated financial statements of Romspen Mortgage Investment Fund, which comprise the consolidated statement of financial position as at December 31, 2015, the consolidated statements of comprehensive income, changes in unitholders’ equity and cash flows for the year then ended, and notes, comprising a summary of significant accounting policies and other explanatory information.
Management’s Responsibility for the Consolidated Financial Statements
Management is responsible for the preparation and fair presentation of these consolidated financial statements in accordance with International Financial Reporting Standards, and for such internal control as management determines is necessary to enable the preparation of consolidated financial statements that are free from material misstatement, whether due to fraud or error.
Auditors’ Responsibility
Our responsibility is to express an opinion on these consolidated financial statements based on our audit. We conducted our audit in accordance with Canadian generally accepted auditing standards. Those standards require that we comply with ethical requirements and plan and perform the audit to obtain reasonable assurance about whether the consolidated financial statements are free from material misstatement.
An audit involves performing procedures to obtain audit evidence about the amounts and disclosures in the consolidated financial statements. The procedures selected depend on our judgment, including the assessment of the risks of material misstatement of the consolidated financial statements, whether due to fraud or error. In making those risk assessments, we consider internal control relevant to the entity’s preparation and fair presentation of the consolidated financial statements in order to design audit procedures that are appropriate in the circumstances, but not for the purpose of expressing an opinion on the effectiveness of the entity’s internal control. An audit also includes evaluating the appropriateness of accounting policies used and the reasonableness of accounting estimates made by management, as well as evaluating the overall presentation of the consolidated financial statements.
We believe that the audit evidence we have obtained is sufficient and appropriate to provide a basis for our audit opinion.
Opinion
In our opinion, the consolidated financial statements present fairly, in all material respects, the consolidated financial position of Romspen Mortgage Investment Fund as at December 31, 2015, and its consolidated financial performance and its consolidated cash flows for the year then ended in accordance with International Financial Reporting Standards.
Chartered Professional Accountants, Licensed Public Accountants
March 30, 2016 Toronto, Canada
Independent Auditors’ Report
KPMG LLP is a Canadian limited liability partnership and a member firm of the KPMG network of independent member firms affiliated with KPMG International Cooperative (“KPMG International”), a Swiss entity. KPMG Canada provides services to KPMG LLP.
Romspen Mor tgage Investment Fund 29

2015 2014
Assets
Cash $ 12,833 $ 14,772
Accrued interest receivable 49,392 41,754
Mortgage investments (notes 3 and 16) 1,339,939 1,179,711
Investments in subsidiaries (notes 4 and 16) 179,811 144,106
Other assets (note 5) 3,878 3,265
$ 1,585,853 $ 1,383,608
Liabilities and Unitholders’ Equity
Liabilities:
Revolving loan facility (note 6) $ 168,088 $ 167,611
Accounts payable and accrued liabilities (note 12(f)) 1,526 791
Unrealized loss on foreign exchange forward contracts (note 7) 10,750 1,073
Deferred revenue 67 212
Prepaid unit capital 9,060 180
Unitholders’ distributions payable 8,237 8,459
197,728 178,326
Units submitted for redemption (note 8) 7,230 34,906
Unitholders’ equity (note 8) 1,380,895 1,170,376
Commitments and contingent liabilities (note 13)
$ 1,585,853 $ 1,383,608
Net asset value per unit (note 9) $ 10.11 $ 9.97
See accompanying notes to consolidated financial statements.
Approved by the Trustees:
“Mark Hilson” Trustee
“Wesley Roitman” Trustee
2015 2014
Revenue:
Mortgage interest $ 133,908 $ 112,567
Other 1,566 1,668
Realized gain (loss) on foreign exchange (note 7) (1,887) 2,506
Unrealized gain on foreign exchange (note 7) 21,560 7,898
155,147 124,639
Expenses:
Management fees (note 12(a)) 14,717 12,379
Interest 5,056 3,105
Change in fair value of mortgage investments and investments in subsidiaries (note 16) 10,872 10,283
Realized loss on mortgage investments 3,044 3,243
Other (gains) losses (note 5) (471) 2,227
Audit fees 197 166
Legal fees 91 123
Other 1,453 1,211
34,959 32,737
Net income and comprehensive income $ 120,188 $ 91,902
Net income and comprehensive income per unit (note 9) $ 0.93 $ 0.78
Weighted average number of units issued and outstanding (note 9) 129,100,461 117,666,519
See accompanying notes to consolidated financial statements.
Consolidated Statement of Comprehensive IncomeIn thousands of dollars, except per unit amounts, unless otherwise noted Year ended December 31, 2015, with comparative information for 2014
Consolidated Statement of Financial PositionIn thousands of dollars, except per unit amounts, unless otherwise noted Year ended December 31, 2015, with comparative information for 2014
Romspen Mor tgage Investment Fund Romspen Mor tgage Investment Fund30 31
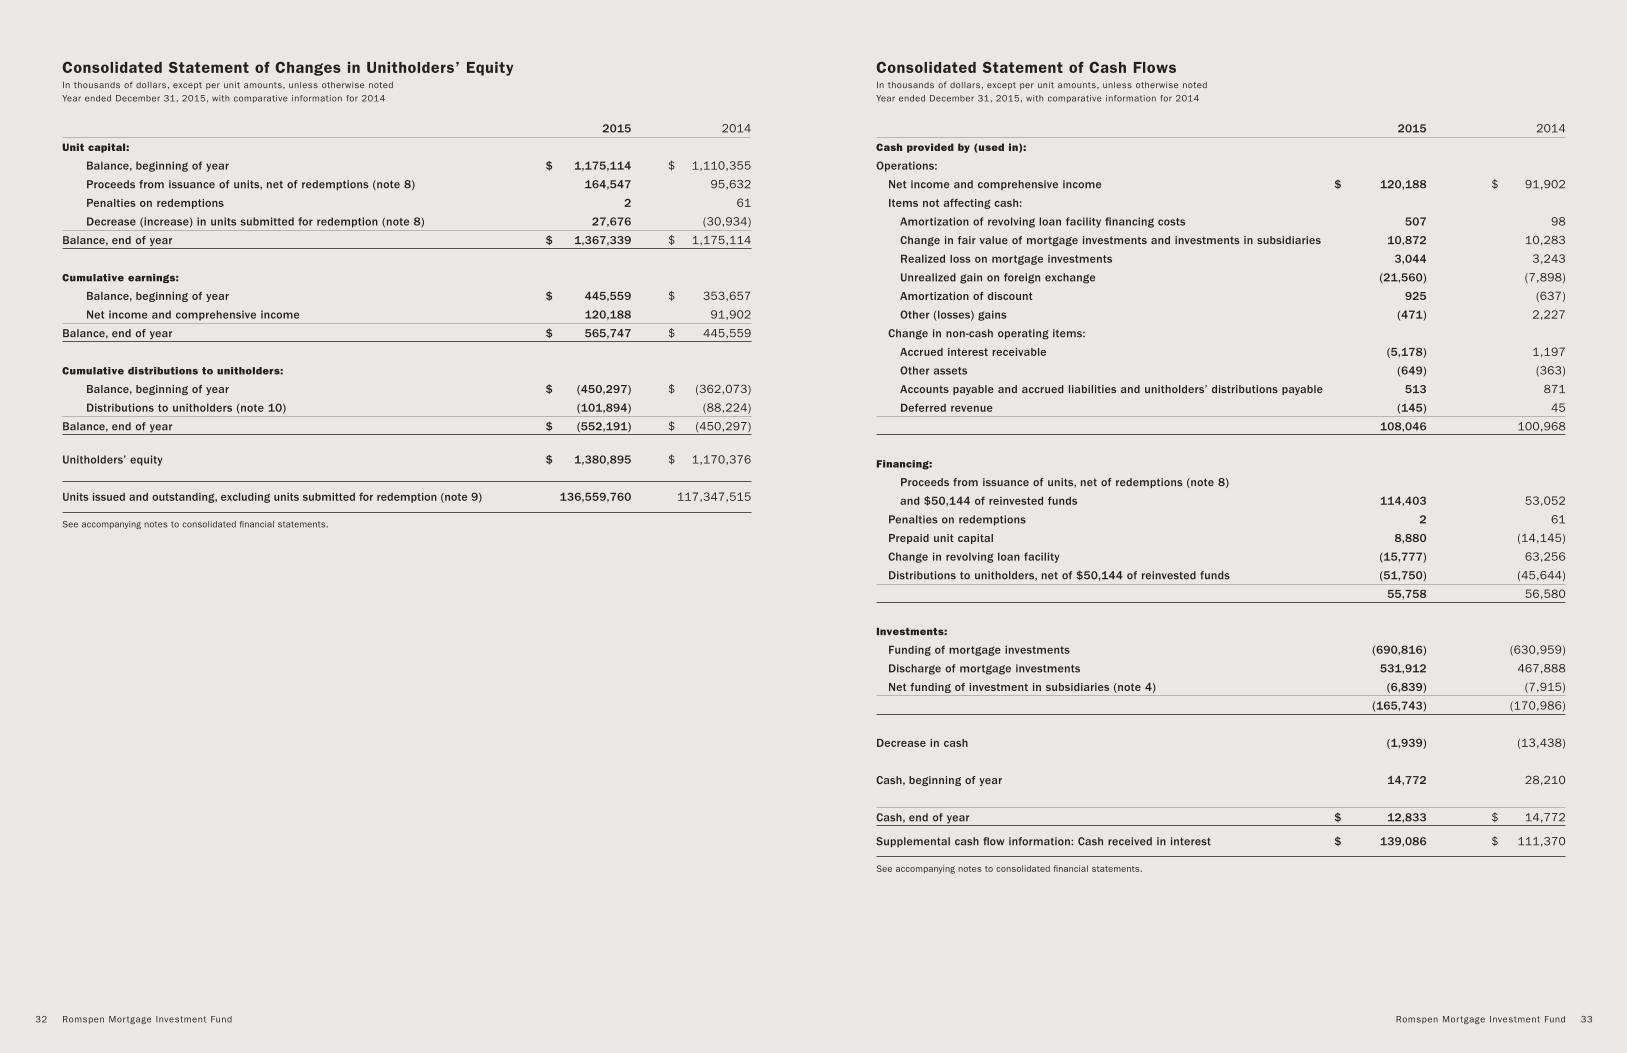
2015 2014
Unit capital:
Balance, beginning of year $ 1,175,114 $ 1,110,355
Proceeds from issuance of units, net of redemptions (note 8) 164,547 95,632
Penalties on redemptions 2 61
Decrease (increase) in units submitted for redemption (note 8) 27,676 (30,934)
Balance, end of year $ 1,367,339 $ 1,175,114
Cumulative earnings:
Balance, beginning of year $ 445,559 $ 353,657
Net income and comprehensive income 120,188 91,902
Balance, end of year $ 565,747 $ 445,559
Cumulative distributions to unitholders:
Balance, beginning of year $ (450,297) $ (362,073)
Distributions to unitholders (note 10) (101,894) (88,224)
Balance, end of year $ (552,191) $ (450,297)
Unitholders’ equity $ 1,380,895 $ 1,170,376
Units issued and outstanding, excluding units submitted for redemption (note 9) 136,559,760 117,347,515
See accompanying notes to consolidated financial statements.
2015 2014
Cash provided by (used in):
Operations:
Net income and comprehensive income $ 120,188 $ 91,902
Items not affecting cash:
Amortization of revolving loan facility financing costs 507 98
Change in fair value of mortgage investments and investments in subsidiaries 10,872 10,283
Realized loss on mortgage investments 3,044 3,243
Unrealized gain on foreign exchange (21,560) (7,898)
Amortization of discount 925 (637)
Other (losses) gains (471) 2,227
Change in non-cash operating items:
Accrued interest receivable (5,178) 1,197
Other assets (649) (363)
Accounts payable and accrued liabilities and unitholders’ distributions payable 513 871
Deferred revenue (145) 45
108,046 100,968
Financing:
Proceeds from issuance of units, net of redemptions (note 8)
and $50,144 of reinvested funds 114,403 53,052
Penalties on redemptions 2 61
Prepaid unit capital 8,880 (14,145)
Change in revolving loan facility (15,777) 63,256
Distributions to unitholders, net of $50,144 of reinvested funds (51,750) (45,644)
55,758 56,580
Investments:
Funding of mortgage investments (690,816) (630,959)
Discharge of mortgage investments 531,912 467,888
Net funding of investment in subsidiaries (note 4) (6,839) (7,915)
(165,743) (170,986)
Decrease in cash (1,939) (13,438)
Cash, beginning of year 14,772 28,210
Cash, end of year $ 12,833 $ 14,772
Supplemental cash flow information: Cash received in interest $ 139,086 $ 111,370
See accompanying notes to consolidated financial statements.
Consolidated Statement of Cash FlowsIn thousands of dollars, except per unit amounts, unless otherwise noted Year ended December 31, 2015, with comparative information for 2014
Consolidated Statement of Changes in Unitholders’ EquityIn thousands of dollars, except per unit amounts, unless otherwise noted Year ended December 31, 2015, with comparative information for 2014
Romspen Mor tgage Investment Fund Romspen Mor tgage Investment Fund32 33

Romspen Mortgage Investment Fund (the “Fund”) is an unincorporated closed-end investment trust established under the laws of the Province of Ontario, pursuant to a trust indenture dated as at May 20, 2005. The Fund is the sole limited partner in the Romspen Mortgage Limited Partnership (the “Partnership”) and conducts its lending activities primarily through the Partnership. The objective of the Fund is to provide stable and secure cash distributions of income, while preserving unitholders’ equity. The Fund’s registered office is 162 Cumberland Street, Suite 300, Toronto, Ontario M5R 3N5.
Romspen Investment Corporation (“Romspen”) is the Fund’s mortgage manager and acts as the primary loan originator, underwriter and syndicator for the Partnership.
The Fund commenced operations on January 16, 2006. Under an exchange offering completed in January 2006, mortgages in the aggregate principal amount of $158,855 were exchanged for 15,885,461 units of the Fund. These consolidated financial statements and accompanying footnotes have been authorized for issue by the trustees of the Fund on March 30, 2016.
1. Basis of presentation
These consolidated financial statements have been prepared in accordance with International Financial Reporting Standards (“IFRS”), as issued by the International Accounting Standards Board (“IASB”).
The consolidated financial statements are measured and presented in Canadian dollars; amounts are rounded to the nearest thousand, unless otherwise stated. The consolidated financial statements have been prepared on a historical cost basis, except for financial assets and financial liabilities at fair value through profit or loss (‘’FVTPL’’), which are presented at fair value. The Fund has chosen to consolidate the Partnership in accordance with IFRS 10, Investment Entities - Exception to Consolidation (“IFRS 10”).
2. Significant accounting policies
A) Investment portfolio
i) Mortgage investments All mortgages have been designated as FVTPL. Mortgage investments are recorded at fair value, with any changes in fair value reflected in the consolidated statement of comprehensive income, in accordance with International Accounting Standard (“IAS”) 39, Financial Instruments - Recognition and Measurement (“IAS 39”) and IFRS 13, Fair Value Measurement (“IFRS 13”).
In determining fair value of individual mortgages, management considers the length of time the mortgage has been in arrears, the overall financial strength of the borrowers and the residual value of the security pledged.
Any unrealized changes in the fair value of mortgage investments are recorded in the consolidated statement of comprehensive income as an unrealized fair value adjustment.
ii) Investments in subsidiaries Entities are formed by the Fund to obtain legal title of the underlying security of certain impaired mortgage investments. These entities are considered to be subsidiaries due to the Fund’s control and exposure to variable returns from its involvement in these entities. The Fund is an investment entity and measures investments in its subsidiaries at FVTPL, except for its investment in the Partnership as noted in note 1. The carrying value of the mortgage investment, which comprises principal, accrued interest and a fair value adjustment, if any, is reclassified from mortgage investments to investments in subsidiaries. At each reporting date, the Fund uses management’s best estimates to determine fair value of the subsidiaries (note 14). Subsidiaries that provide investment-related services to the Fund continue to be consolidated, which includes the Partnership. Transactions and balances with subsidiaries that are consolidated are eliminated on consolidation.
B) Revenue recognition
i) Interest income Interest income, funding and participation
fees are recognized using the effective interest method (“EIM”).
The EIM discounts the estimated future cash receipts through
the expected life of the loan and mortgage to its carrying amount.
ii) Discount income The Fund may acquire mortgage portfolios
from third parties at fair market value. A mortgage discount
will exist to the extent that the fair market value of a mortgage
is less than its par value. The discount is allocated between
a valuation reserve component and an accretion component.
The valuation reserve component represents the risk of credit
loss, while the accretion component represents the part of
the discount to be recognized to income over time, thereby
adjusting the yield on the mortgage from its face rate to an
effective yield. The accretion component is amortized to income
over the term of the related mortgage through the application
of the effective interest rate method. The valuation reserve
component is only recognized into income upon payout, less
any realized credit loss.
C) Use of estimates
The preparation of consolidated financial statements in compliance with IFRS requires management to make judgements, estimates and assumptions that affect the reported amounts of assets and liabilities and disclosure of contingent assets and liabilities at the reporting date and the reported amounts of revenue and expenses during the year. The Fund’s investments are recorded in the consolidated statement of financial position at fair value. The estimates may include: assumptions regarding local real estate market conditions; interest rates and the
Notes to Consolidated Financial StatementsIn thousands of dollars, except per unit amounts, unless otherwise noted Year ended December 31, 2015
availability of credit; cost and terms of financing; the impact of present or future legislation or regulation; prior encumbrances and other factors affecting the mortgage and underlying security of the mortgage investments. Actual results may differ from those estimates.
The fair value of the other financial instruments is determined using valuation techniques described in note 14.
These assumptions are limited by the availability of reliable comparable data, economic uncertainty, ongoing geopolitical concerns and the uncertainty of predictions concerning future events. Credit markets, equity markets and consumer spending are factors in the uncertainty inherent in such estimates and assumptions. Accordingly, by their nature, estimates of fair value are subjective and do not necessarily result in precise determinations. Should the underlying assumptions change, the estimated fair value could change by a material amount.
In determining its status as an investment entity, the most significant judgments made include the determination by the Fund that its investment in subsidiaries do not represent a separate substantial business activity and that FVTPL is the primary measurement attribute used to monitor and evaluate substantially all of its investments.
Additionally, the determination of whether the Fund exercises significant influence or control over entities in which it invests also requires significant management judgment.
D) Foreign currency translation
Investment transactions and income and expenses in foreign currencies have been translated into Canadian dollars at the rates of exchange prevailing at the time of the transactions. The fair value of mortgages and cash denominated in foreign currencies has been translated into Canadian dollars at the rates of exchange prevailing at year end. Foreign exchange gains and losses on the receipts of payments on mortgage investments are included in realized gain/loss on foreign exchange on the consolidated statement of comprehensive income. All unrealized foreign exchange gains and losses on each financial position item are included in unrealized foreign exchange gain/loss on the consolidated statement of comprehensive income.
E) Foreign exchange forward contracts The Fund may hold derivative financial instruments to hedge its foreign currency risk exposure on mortgage investments denominated in a foreign currency. Derivatives are recognized initially at fair value, with transaction costs recognized in profit or loss as incurred. Subsequent to initial recognition, derivatives are measured at fair value at the end of each reporting year. Any resulting gain or loss is recognized in profit
or loss, unless the derivative is designated and effective as a hedging instrument under IFRS. The Fund has elected to not account for derivative instruments as a hedge.
The Fund determines fair value on its foreign exchange forward contracts based on the difference between the contract forward rate and the forward rate at the reporting date.
Net gain from financial instruments at FVTPL includes all realized and unrealized fair value changes and foreign exchange differences, but excludes interest and dividend income. Aside from realized gains and loss on foreign exchange forward contracts (note 7), which are classified as held-for-trading, all other realized and unrealized gains and losses are on financial assets designated at FVTPL.
F) Net income and comprehensive income per unit Net income and comprehensive income per unit is computed by dividing net income and comprehensive income for the year by the weighted average number of units issued and outstanding during the year.
G) Prepaid unit capital Prepaid unit capital consists of subscription amounts received in advance of the unit issuance dates.
H) Financial assets and financial liabilities
Financial assets or liabilities at FVTPL are initially recognized on the trade date, which is the date the Fund becomes a party to the contractual provisions of the instrument. Other financial assets and financial liabilities are recognized on the date on which they are originated. The Fund becomes a party to the contractual provisions for mortgage investments when cash is advanced to the third party borrower.
Financial assets and financial liabilities at FVTPL are initially measured at fair value, with transaction costs recognized in profit or loss. Financial assets and financial liabilities not at FVTPL are initially measured at fair value plus transaction costs that are directly attributable to their acquisition or issue.
The Fund derecognizes a financial asset when the contractual rights to the cash flows from the asset expire, or it transfers the rights to receive the contractual cash flows in a transaction in which substantially all of the risks and rewards of ownership are transferred, or in which the Fund neither transfers nor retains substantially all of the risks and rewards of ownership and does not retain control of the financial asset. The Fund derecognizes a liability when its contractual obligations are discharged, cancelled or expired.
IAS 39 and IFRS 13 establish standards for recognizing and measuring financial assets and financial liabilities, including non-financial derivatives. In accordance with these standards, the Fund has classified its financial assets as one of the
Notes to Consolidated Financial StatementsIn thousands of dollars, except per unit amounts, unless otherwise noted Year ended December 31, 2015
Romspen Mor tgage Investment Fund Romspen Mor tgage Investment Fund34 35

following: FVTPL or loans and receivables. All financial liabilities must be classified as: FVTPL or other financial liabilities. The Fund’s designations are as follows:
i) Mortgage investments are classified as debt instruments and are designated as FVTPL, categorized into Level 3 of the fair value hierarchy.
ii) Investments in subsidiaries - entities over which the Fund has control are designated as FVTPL and categorized into Level 3 of the fair value hierarchy, as permitted by IFRS 10.
iii) Cash, accrued interest receivable and other assets (excluding shares in Skyline International Development Inc. (“SID”), which are carried at fair value (note 5)), are classified as loans and receivables and are measured at amortized cost.
iv) The revolving loan facility, accounts payable and accrued liabilities, prepaid unit capital, unitholders’ distributions payable and units submitted for redemption are classified as other financial liabilities and are measured at amortized cost using the effective interest rate method.
Financial assets classified as FVTPL are carried at fair value on the consolidated statement of financial position. The net realized and unrealized gains and losses from fair value changes and foreign exchange differences, excluding interest, are recorded in the consolidated statement of comprehensive income and as an operating activity in the consolidated statement of cash flows.
I) Offsetting financial instruments Financial assets and financial liabilities are offset and the net amount presented on the consolidated statement of financial position where there is legal right to offset the amounts and it intends either to settle on a net basis or to realize the asset and settle the liability simultaneously. As at December 31, 2015, the Fund had foreign exchange forward contracts, which were subject to master netting arrangements, none of whose amounts have been or were able to be offset at the reporting date (note 7).
J) Future accounting changes
i) IFRS 9, Financial Instruments (“IFRS 9”):
IFRS 9 was published by the IASB in July 2014 and will replace IAS 39. It includes revised guidance on the classification and measurement of financial instruments, including new expected credit loss model for calculating impairment on financial assets, and the new general hedge accounting requirements. It also carries forward the guidance on recognition and derecognition of financial instruments from IAS 39.
IFRS 9 is effective for the annual periods beginning on or after January 1, 2018, with early adoption permitted. Based on the initial assessment, this standard is not expected to have a material impact on the Fund. The impact of this standard on the Fund has not yet been assessed.
ii) Investment Entities: Applying the Consolidation Exception (Amendments to IFRS 10, IFRS 12 and IAS 28):
These amendments were issued by the IASB in December 2014, which require an investment entity to measure all investment entity subsidiaries at FVTPL, regardless of whether they provide investment-related services.
These amendments are effective for annual periods beginning on or after January 1, 2016. The Fund is assessing the potential impact on its consolidated financial statements resulting from the application of these amendments. These amendments are expected to have an impact on the consolidated financial statements given that currently, subsidiaries providing investment-related services are consolidated.
2015 2014
Number of mortgages Original cost Fair value Fair value
First mortgages 127 $ 1,299,729 $ 1,288,879 $ 1,141,759Second mortgages 6 52,984 51,060 37,952
133 $ 1,352,713 $ 1,339,939 $ 1,179,711
3. Mortgage investments (excluding mortgages to investments in subsidiaries)
The following is a summary of the mortgages:
Interest Rates 2015 2014
Less than 10.00% $ 302,551 $ 382,51510.01% - 11.00% 504,134 424,64911.01% - 12.00% 407,536 291,18412.01% - 20.00% 137,432 89,336Over 20.00% 1,060 2,012
$ 1,352,713 $ 1,189,696
The following is a summary of the original cost of mortgages segmented by interest rate:
2015 2014
Pre-development $ 567,068 $ 416,724Construction 300,447 153,949Term 485,198 619,023
$ 1,352,713 $ 1,189,696
The following is a summary of the original cost of the mortgages segmented by type of mortgage:
2015 2014
Ontario $ 479,683 $ 529,696Alberta 109,666 108,604British Columbia 141,792 156,145Other provinces 113,676 79,867United States 507,896 315,384
$ 1,352,713 $ 1,189,696
The following is a summary of the original cost of the mortgages segmented by geography:
2015 2014
Investments balance, beginning of year $ 1,179,711 $ 1,056,650 Funding of mortgage investments 690,816 630,959 Discharge of mortgage investments (531,912) (467,888) Non-cash transfer to investments in subsidiaries (33,317) (47,007)Unrealized gain (loss) in the value of investments (2,787) 2,451Realized loss on investments (3,044) (3,243)Amortization of discount (925) 637 Foreign currency adjustment on investments 41,397 7,152
Investments balance, end of year $ 1,339,939 $ 1,179,711
A reconciliation of Level 3 assets for the years ended December 31, 2015 and 2014 is as follows:
Notes to Consolidated Financial StatementsIn thousands of dollars, except per unit amounts, unless otherwise noted Year ended December 31, 2015
Notes to Consolidated Financial StatementsIn thousands of dollars, except per unit amounts, unless otherwise noted Year ended December 31, 2015
Romspen Mor tgage Investment Fund Romspen Mor tgage Investment Fund36 37

Credit risk arises from the possibility that mortgagors may be unable to fulfill their obligations. In accordance with the Fund’s policies, the Fund mitigates this risk by ensuring that its mix of mortgages is diversified and by limited exposure to any one mortgagor or property.
As part of the assessment of fair value, management of the Fund routinely reviews each mortgage for impairment to determine whether or not a mortgage should be recorded at its estimated realizable value.
Principal repayments based on contractual maturity dates are as follows:
2015 and earlier $ 409,931
2016 669,868
2017 257,366
2018 and after 15,548
$ 1,352,713
Included in the 2015 and earlier category are loans which are past due or on a month-to-month arrangement. Borrowers have the option to repay principal at any time prior to the maturity date.
4. Investments in subsidiaries
The controlled subsidiaries acquired control of properties in order to finish development and divest of the property with the goal of maximizing return to investors, which may involve, but not specifically require, the advancement of additional funds. These subsidiaries are not consolidated by the Fund and are described as follows (chart below).
In 2015, the Partnership subscribed for 100% of the shares of RIC (Midland Land) Inc. and RIC (Midland Condo) Inc. (together referred to as, “Midland”). Subsequently, Midland acquired land for residential development in Georgian Bay, Ontario. Midland is preparing the property for future development. As at December 31, 2015, a mortgage to Midland for $7,576 is included in investment in subsidiaries.
In 2015, Romspen Club Holdings acquired a golf course in Tucson, Arizona. Romspen Club Holdings is operating and preparing the property for future sale and the potential creation of development tracts of land within the property with the investment of additional funds, net of repayments of $7,315, which have been advanced from the Fund.
Investment value
Name Legal Entity Ownership Description Location 2015 2014
Guild 1460518 Alberta Ltd. 100% Office complex CA $ 19,589 $ 18,774
Camperdown 2220740 Ontario Inc. 100% Land for residential development CA 996 821
Railside 3231451 Nova Scotia Ltd. 100% Condominium development CA 3,050 5,150
Aspen Lakes Aspen Lakes Communities Ltd. 100% Residential development CA 16,460 18,199
Almonte 2241497 Ontario Ltd. 50% Retail plaza CA 5,555 5,555
Bear Mountain Big Mac Athletic Corp. 100% Office complex CA 7,008 7,929
Falconridge Romspen FC Homes Inc. 100% Residential subdivision CA 34,727 13,070
Beach One 2242078 Ontario Inc. 100% Commercial development CA 1,500 969
Medallion 1604954 Alberta Ltd. 100% Office complex CA 108 108
Planetwide 1411786 Alberta Ltd. 100% Land for residential development CA 3,860 2,777
Royal Oaks Royal Oaks Homes Ltd. 100% Residential subdivision CA 11,651 11,036
Haldimand 2270386 Ontario Ltd. 100% Landfill CA 23,482 21,035
High Street 2204604 Ontario Inc. 100% Commercial/residential CA 15,488 14,538
Egreen 1593785 Alberta Ltd. 100% Land for industrial development CA 1,421 1,101
Romspen Club Holdings Romspen Club Holdings Inc. 100% Various golf courses US 47,691 35,796
Big Nob Big Nob Development Corp. 100% Land for residential development CA 2,224 1,870
RIC (Kash) Ric (Kash) Inc. 100% Recreational land CA 1,932 1,800
Midland Ric (Midland Land) Inc.
and Ric (Midland Condo) Inc. 100% Land for residential development CA 7,576 –
204,318 160,528Fair value adjustment (24,507) (16,422)
$ 179,811 $ 144,106
In 2015, Aspen Lakes acquired 26 recreational vehicle lots near Shuswap Lake, British Columbia. Aspen Lakes is preparing the lots for sale with the investment of additional funds, net of repayments of $967, which has been advanced from the Fund.
In 2015, Falconridge acquired land in Abbotsford, British Columbia. Falconridge is preparing the land for residential development with the investment of additional funds, net of repayments of $17,459, which have been advanced from the Fund.
The Fund’s investments in subsidiaries are measured at fair value using Level 3 unobservable inputs. As a result, all investments in subsidiaries have been classified in Level 3 of the valuation hierarchy.
A reconciliation of Level 3 assets for the years ended December 31, 2015 and 2014 is as follows:
Investments in subsidiaries 2015 2014
Investments balance, beginning of year $ 144,106 $ 97,033
Funding of investments 12,078 9,181
Discharge of investments (5,239) (1,266)
Non-cash transfer from mortgage investments 33,317 47,007
Unrealized loss in the value of investments (8,085) (12,734)
Foreign currency adjustment on investments 3,634 4,885
Investments balance, end of year $ 179,811 $ 144,106
5. Other gains (losses)
In 2012, as a loan repayment, the Fund received shares in SID valued at $3,900. In 2014, SID became a public company and the Fund’s shares in SID as of December 31, 2015 are valued at $2,144 (2014 - $1,673) and are included within other assets on the consolidated statement of financial position, and an unrealized gain of $471 (2014 - loss of $2,227) is recognized under other losses on the consolidated statement of comprehensive income.
6. Revolving loan facility
The Partnership entered into a revolving loan facility on July 16, 2012 and it was amended on November 12, 2015 with an increased maximum amount of $298,000 (2014 - $200,000), including borrowings of equivalent amount denominated in U.S. dollars. Approximately $129,912 (2014 - $32,389) is available and $168,088 has been drawn as at December 31, 2015 (2014 - $167,611) of which, $148,088 (U.S. $107,000) (2014 - $127,611; U.S. $110,000) is denominated in U.S. dollars. Interest on the loan is charged at a maximum of prime rate plus 1.0%. The minimum and maximum amounts
drawn under the revolving loan facility during the year ended December 31, 2015 were $100,000 and $195,500 (2014 - $26,000 and $170,000), respectively. The loan is secured by all assets of the Partnership and a pledge of all Partnership units held by the Fund. The loan matures on July 18, 2017.
The costs associated with the establishment of the revolving loan facility are amortized over the two-year initial term of the facility and have been included in other assets for $481 (2014 - $337), net of accumulated amortization of $54 (2014 - $98).
7. Foreign exchange forward contracts
The foreign exchange forward contracts are used to hedge the Fund’s exposure to loans denominated in U.S. dollars. The following table sets out the fair values and the notional amount of foreign exchange forward contract derivative assets and liabilities held by the Fund as at December 31, 2015 and 2014:
Foreign exchange loss on forward contracts as of December 31, 2015:
Currency Fair value received at foreign to be exchange delivered in rate of UnrealizedExpiration date U.S.$ (CDN$) $1.384 loss
January 6, 2016 $ 6,246 $ 6,920 $ (674)
January 13, 2016 19,368 20,760 (1,392)
April 1, 2016 5,898 6,920 (1,022)
April 8, 2016 14,918 16,608 (1,690)
April 13, 2016 12,500 13,840 (1,340)
May 2, 2016 8,784 9,688 (904)
May 5, 2016 13,124 13,840 (716)
June 8, 2016 6,500 7,335 (835)
June 30, 2016 15,044 16,885 (1,841)
September 15, 2016 7,968 8,304 (336)
Total $ 110,350 $ 121,100 $ (10,750)
Foreign exchange loss on forward contracts as of December 31, 2014:
Currency Fair value received at foreign to be exchange delivered in rate of UnrealizedExpiration date U.S.$ (CDN$) $1.1601 loss
March 5, 2015 $ 74,334 $ 75,407 $ (1,073)
Notes to Consolidated Financial StatementsIn thousands of dollars, except per unit amounts, unless otherwise noted Year ended December 31, 2015
Notes to Consolidated Financial StatementsIn thousands of dollars, except per unit amounts, unless otherwise noted Year ended December 31, 2015
Romspen Mor tgage Investment Fund Romspen Mor tgage Investment Fund38 39

The foreign exchange forward contracts are used to hedge the Fund’s exposure to loans denominated in U.S. dollars and are classified as held-for-trading (“HFT”).
Included in the consolidated statement of comprehensive income are unrealized foreign exchange losses on forward contracts, which are economically offset by unrealized gains for a net amount of $21,560 (2014 - $7,898) on assets classified as FVTPL.
The realized foreign exchange gain (loss) in the consolidated statement of comprehensive income consists mainly of realized foreign exchange losses of $8,679 (2014 - $1,495) on forward contracts, which are offset by $6,792 (2014 - $4,665) net gains on assets classified as FVTPL and revolving credit facility.
8. Unitholders’ equity
The beneficial interests in the Fund are represented by a single class of units, which are unlimited in number. Each unit carries a single vote at any meeting of unitholders and carries the right to participate pro-rata in any distributions. These units are classified as equity as they are puttable instruments that entitle the holder to a pro-rata share of the Fund’s net assets in the event of the Fund’s liquidation. They are in a class of instruments that are subordinate to all other classes of instruments, and have identical features. Unitholders have a limited right to redeem their units, on a monthly basis, upon a minimum of 30 days’ notice. Partial or complete redemption of units is limited on a monthly basis to 1% of the aggregate fair market value of total units outstanding on the valuation date immediately preceding the said redemption date. Redemption notices on any given redemption date shall maintain their order of priority until the unit redemption price for such units has been paid in full. Additionally, the trustees shall be entitled in their sole discretion to extend the time for payment of any unit redemption prices if, in the reasonable opinion of the trustees, such payment would be materially prejudicial to the interests of the remaining unitholders in the Fund.
In the extraordinary circumstance where the number of units properly tendered for redemption (“Tendered Units”) by unitholders (“Tendering Unitholders”) on any given redemption date exceeds 3% of the total number of units outstanding on such redemption date, the trustees are entitled in their sole discretion to modify or suspend unitholder redemption rights.
Specifically, if the extraordinary circumstance referenced above occurs, the trustees are entitled, in their sole discretion, to implement one of the following measures:
A) Discounted redemptions The trustees shall give notice to Tendering Unitholders that their Tendered Units shall be redeemed on the next redemption date at a redemption price discounted by a discount factor to be determined by the trustees in their sole discretion, acting reasonably. In determining the discount factor, the trustees may consider such factors as market prices for similar investments that are traded on a stock exchange in Canada, the variation inherent in any estimates used in the calculation of the fair market value of the Tendered Units to be redeemed, the liquidity reasonably available to the Fund and general economic conditions in Canada. Unitholders may choose to retract their redemption request upon receiving notice from the trustees of a discounted redemption; however, unitholders who retract will be prohibited from redeeming the Tendered Units to which their retraction applies for a period of up to twelve months following the date the discounted redemptions are processed.
B) Temporary suspension of redemptions The trustees shall give notice to all unitholders that normal course redemption rights are suspended for a period of up to six months. Issuance of a suspension notice by trustees will have the effect of cancelling all pending redemption requests. At the end of the suspension period, the trustees may call a special meeting of unitholders to approve an extension of the suspension period, failing which, normal course redemptions will resume.
As at December 31, 2015, unitholders representing approximately 726,336 (2014 - 3,499,666) units have requested redemption of their units, the redemption of which is subject to the above restrictions. These units have been re-classed to liabilities from unitholders’ equity in order to comply with applicable accounting rules. These units, however, continue to have the same rights and no priority over the remaining units. Units submitted for redemption are redeemed at the net asset value.
A) The following units are issued and outstanding
During the normal course of business, the Fund receives unit issuance and redemption requests from the investors. In 2015, the Fund received requests for redemption of 2,895,527 units (2014 - 8,755,233) and redeemed 5,671,833 units (2014 - 5,655,923) for $56,561 (2014 - $56,293) in accordance with its policies.
The Fund continues to issue new units and receive redemption requests, which will be processed in accordance with the above-mentioned policies.
B) Distribution reinvestment plan and direct unit purchase plan The Fund has a distribution reinvestment plan and direct unit purchase plan for its unitholders, which allows participants to reinvest their monthly cash distributions in additional units at a unit price equivalent to $10.00 per unit.
9. Net asset value per unit and net income and comprehensive income per unit
Net asset value per unit is calculated as total assets less total liabilities allocable to outstanding units, excluding units submitted for redemption, of 136,559,760 as at December 31, 2015 (2014 - 117,347,515).
Net income and comprehensive income per unit have been computed using the weighted average number of units issued and outstanding of 129,100,461 for the year ended December 31, 2015 (2014 - 117,666,519).
10.Distributions
The Fund makes distributions to the unitholders monthly on or about the 15th day of each month. The Fund’s trust indenture indicates that the Fund intends to distribute 100% of the net income and comprehensive income of the Fund, determined in accordance with the Income Tax Act (Canada), to the unitholders.
For the year ended December 31, 2015, the Fund declared distributions of $0.79 (2014 - $0.75) per unit and a total of $101,894 (2014 - $88,224) was distributed to the unitholders.
11. Income taxes
The Fund is taxed as a mutual fund trust for income tax purposes. Pursuant to the trust indenture, the Fund intends to distribute 100% of its income for income tax purposes each period to such an extent that it will not be liable for income tax under the Income Tax Act (Canada). Therefore, no provision for income taxes is required on earnings of the Fund.
On June 22, 2007, new legislation relating to the federal income taxation of a specified investment flow-through trust or partnership (“SIFT”) received royal assent (the “SIFT Rules”).
Under the SIFT Rules, certain distributions from a SIFT will no longer be deductible in computing a SIFT’s taxable income and a SIFT will be subject to income taxes on such distributions at a rate that is substantially equivalent to the general tax rate applicable to a Canadian corporation. Distributions paid by a SIFT as returns of capital will not be subject to income taxes.
The Fund is not subject to the SIFT tax regime as its units are not listed or traded on a stock exchange or other public market. Accordingly, the Fund has not recorded a provision for income taxes or future income tax assets or liabilities in respect of the SIFT Rules.
12. Related party transactions and balances
Transactions with related parties are in the normal course of business and are recorded at the exchange amount, which is the amount of consideration established and agreed to by the related parties and which represents fair market value.
Other than the transactions disclosed elsewhere in these consolidated financial statements, the Fund had the following significant related party transactions:
A) The majority of the trustees of the Fund are owners of Romspen. Under various agreements, Romspen manages all the day-to-day affairs of the Fund and the Partnership. Romspen receives fees totalling 1% per annum, calculated daily and payable monthly,
2015 2014
Units Amount Units Amount
Balance, beginning of year 120,847,181 $ 1,209,822 111,310,601 $ 1,114,190
New units issued 17,096,384 170,964 10,934,536 109,345
New units issued under distribution reinvestment plan 5,014,364 50,144 4,257,967 42,580
Units redeemed (5,671,833) (56,561) (5,655,923) (56,293)
Proceeds from issuance of units, net of redemptions 16,438,915 164,547 9,536,580 95,632
Balance, end of year 137,286,096 $ 1,374,369 120,847,181 $ 1,209,822
Notes to Consolidated Financial StatementsIn thousands of dollars, except per unit amounts, unless otherwise noted Year ended December 31, 2015
Notes to Consolidated Financial StatementsIn thousands of dollars, except per unit amounts, unless otherwise noted Year ended December 31, 2015
Romspen Mor tgage Investment Fund Romspen Mor tgage Investment Fund40 41

of the principal balance of all mortgage investments and the fair market value of all other non-mortgage investments. For the year ended December 31, 2015, the amount was $14,717 (2014 - $12,379).
B) Romspen and related entities also receive certain fees directly from the borrower, generated from Fund mortgage investments, as follows: all lender, broker, origination, commitment, renewal, extension, discharge, participation, insufficient funds and administration fees generated on the mortgages. For the year ended December 31, 2015, this amount was $23,387 (2014 - $20,078).
C) Romspen charges the Fund for brokering and originating the acquisition of a portfolio of existing loans, calculated as 2% of the loan portfolio. For the year ended December 31, 2015, the amount was nil (2014 - nil).
D) Several of the Fund’s mortgages are syndicated with other investors of Romspen, which may include Romspen, members of management of Romspen and officers or trustees of the Fund. The Fund ranks equally with, or in priority to, other members of the syndicate as to receipt of principal and income. Employees and directors of Romspen, along with related parties, are also permitted to invest in the Fund.
E) As at December 31, 2015, the Fund had two (2014 - two) investments outstanding with an original cost of $31,238 (2014 - $24,607), including accrued interest of $382 (2014 - $1,748) and fair value of $23,559 (2014 - $23,355) due from mortgagors and investments in which members of management of Romspen own non-controlling equity interests.
F) Included in accounts payable and accrued liabilities is an amount of $156 (2014 - $130) payable to Romspen.
13. Commitments and contingent liabilities
A) In the event that management agreements are terminated, the various management agreements between the Fund, the Partnership and Romspen contain provisions for the payment of termination fees of an amount equal to 2% of the fair market value of the Partnership’s assets under administration on the date on which the termination notice is received, in addition to any other amounts owing by the Partnership. These amounts will be satisfied by the payment of cash, interests in mortgages or in such combination thereof as determined by the mortgage manager. These agreements continue in force until terminated in accordance with their provisions.
B) The Partnership has granted an irrevocable option to Romspen to purchase, at any time, any or all Partnership mortgages at a purchase price equal to the principal amount of such mortgage plus accrued interest.
C) The Partnership in certain situations provides guarantees for its subsidiaries. As of December 31, 2015, there were $15,400 of guarantees outstanding (2014 - $15,400).
D) The Fund has letters of guarantee outstanding at December 31, 2015 of $22,400 (2014 - $8,802).
14. Fair values of financial instruments
IFRS 13 establishes enhanced disclosure requirements for fair value measurements of financial instruments and liquidity risks. A three-level valuation hierarchy is used for disclosure of financial instruments measured at fair value based upon the degree to which the inputs used to value an asset or liability as of the measurement date are observable:
• Level 1 - quoted (unadjusted) in active markets for identical assets or liabilities;
• Level 2 - inputs other than quoted prices in Level 1 that are observable for the asset or liability, either directly (i.e., as prices) or indirectly (i.e., derived from prices); and
• Level 3 - inputs for the asset or liability that are not based on observable market data (unobservable inputs).
Foreign exchange forward contracts have been classified in Level 2 of the hierarchy.
The Fund’s mortgage investments are measured at fair value using unobservable inputs. As a result, all mortgage investments have been classified in Level 3 of the valuation hierarchy.
The Fund’s investments in subsidiaries are measured at fair value using Level 3 unobservable inputs, including comparable market property values, appraisals, and discounted cash flows.
Fair value of the portfolio is the amount of consideration that would be agreed upon in an arm’s-length transaction between knowledgeable, willing parties under no compulsion to act. As there is no quoted price in an active market for these mortgages, Romspen makes its determination of fair value based on the assessment of the current lending market for investments of same or similar terms. Typically, the fair value of mortgages approximate their carrying values given the mortgage and loan investments consist of short-term loans that are repayable at the option of the borrower without yield maintenance or penalties. When collection of the principal amount of a mortgage or loan is no longer reasonably assured, the fair value of the investment is adjusted to the fair value of the underlying security.
The fair value of the Fund’s investments in subsidiaries is generally determined using a variety of methodologies including comparable market property values, market research data, third party and in-house appraisals, and discounted cash flow analysis, which would include inputs related to discount rates, future cash flows, liquidity, etc.
The fair values of cash, accrued interest receivable, revolving loan facility, accounts payable and accrued liabilities, unitholders’ distributions payable and prepaid unit capital approximate their carrying values due to their short-term maturities.
Romspen regularly reviews significant unobservable inputs and valuation adjustments and will use market observable data when available. When third party appraisals are used to
measure fair values of its investments in subsidiaries, the Fund will assess the evidence obtained to support valuations that meet the requirements of IFRS.
As at December 31, 2015 and 2014, the fair value of investments as categorized by valuation methodology, and the sensitivity to fair value by using other reasonable inputs in the respective methodologies, is as follows:
15. Financial instrument risk management
The Fund is exposed in varying degrees to a variety of risks from its use of financial instruments. The trustees and Romspen discuss the principal risks of the business on a day-to-day basis. The trustees set the policy framework for the implementation of systems to manage, monitor and mitigate identifiable risks. The Fund’s risk management objective in relation to these instruments is to protect and minimize volatility to net assets and mitigate financial risks including
interest rate risk, credit risk, liquidity risk, market risk, currency risk and capital management risk. Romspen seeks to minimize potential adverse effects of risk by retaining experienced analysts and advisors, monitoring the Fund’s positions, market events and entering into hedge contracts. The types of risks the Fund is exposed to, the source of risk exposure and how each is managed is outlined hereafter:
A) Interest rate risk
Interest rate risk is the risk that the fair value or future cash
2015 2014
Investments in Sensitivity subsidiaries rate Value Increase Decrease Value Increase Decrease
Direct capitalization approach(i) 1.00% $ 69,821 $ 10,017 $ (7,993) $ 63,581 $ 13,781 $ (8,971)
Market comparison approach(ii) 5.00% 109,990 5,500 (5,500) 80,524 4,026 (4,026)
Total $ 179,811 $ 15,517 $ (13,493) $ 144,105 $ 17,807 $ (12,997)
(i) The rates used in the direct capitalization model range from 7.5% to 12.3% (2014 - 7% to 10.60%), with a weighted average capitalization rate of 10.0% (2014 - 8.5%).
An increase in capitalization rate will decrease the fair value of the investment and a decrease in capitalization rate will increase the fair value of the investment. (ii) Market comparison approach uses comparable sales and applies a weighted average discount of 24.62% (2014 - 20.94%) in certain cases, where applicable.
An increase in market value of the sales price will increase the fair value and a decrease in the market value of the sales price will decrease the fair value.
2015 2014
Mortgage SensitivityInvestments rate Value Increase Decrease Value Increase Decrease
Direct capitalization(i) 1.00% $ – $ – $ – $ – $ – $ –
Market comparison approach(ii) 5.00% 119,558 5,978 (5,978) 35,825 1,791 (1,791)
Total $ 119,558 $ 5,978 $ (5,978) $ 35,825 $ 1,791 $ (1,791)
(i) An increase in capitalization rate will decrease the fair value of the investment and a decrease in capitalization rate will increase the fair value of the investment.(ii) Market comparison approach uses comparable sales and applies a weighted average discount of 9.6% (2014 - 21.66%) in certain cases, where applicable.
An increase in market value of the sales price will increase the fair value and a decrease in the market value of the sales price will decrease the fair value.
Notes to Consolidated Financial StatementsIn thousands of dollars, except per unit amounts, unless otherwise noted Year ended December 31, 2015
Notes to Consolidated Financial StatementsIn thousands of dollars, except per unit amounts, unless otherwise noted Year ended December 31, 2015
Romspen Mor tgage Investment Fund Romspen Mor tgage Investment Fund42 43
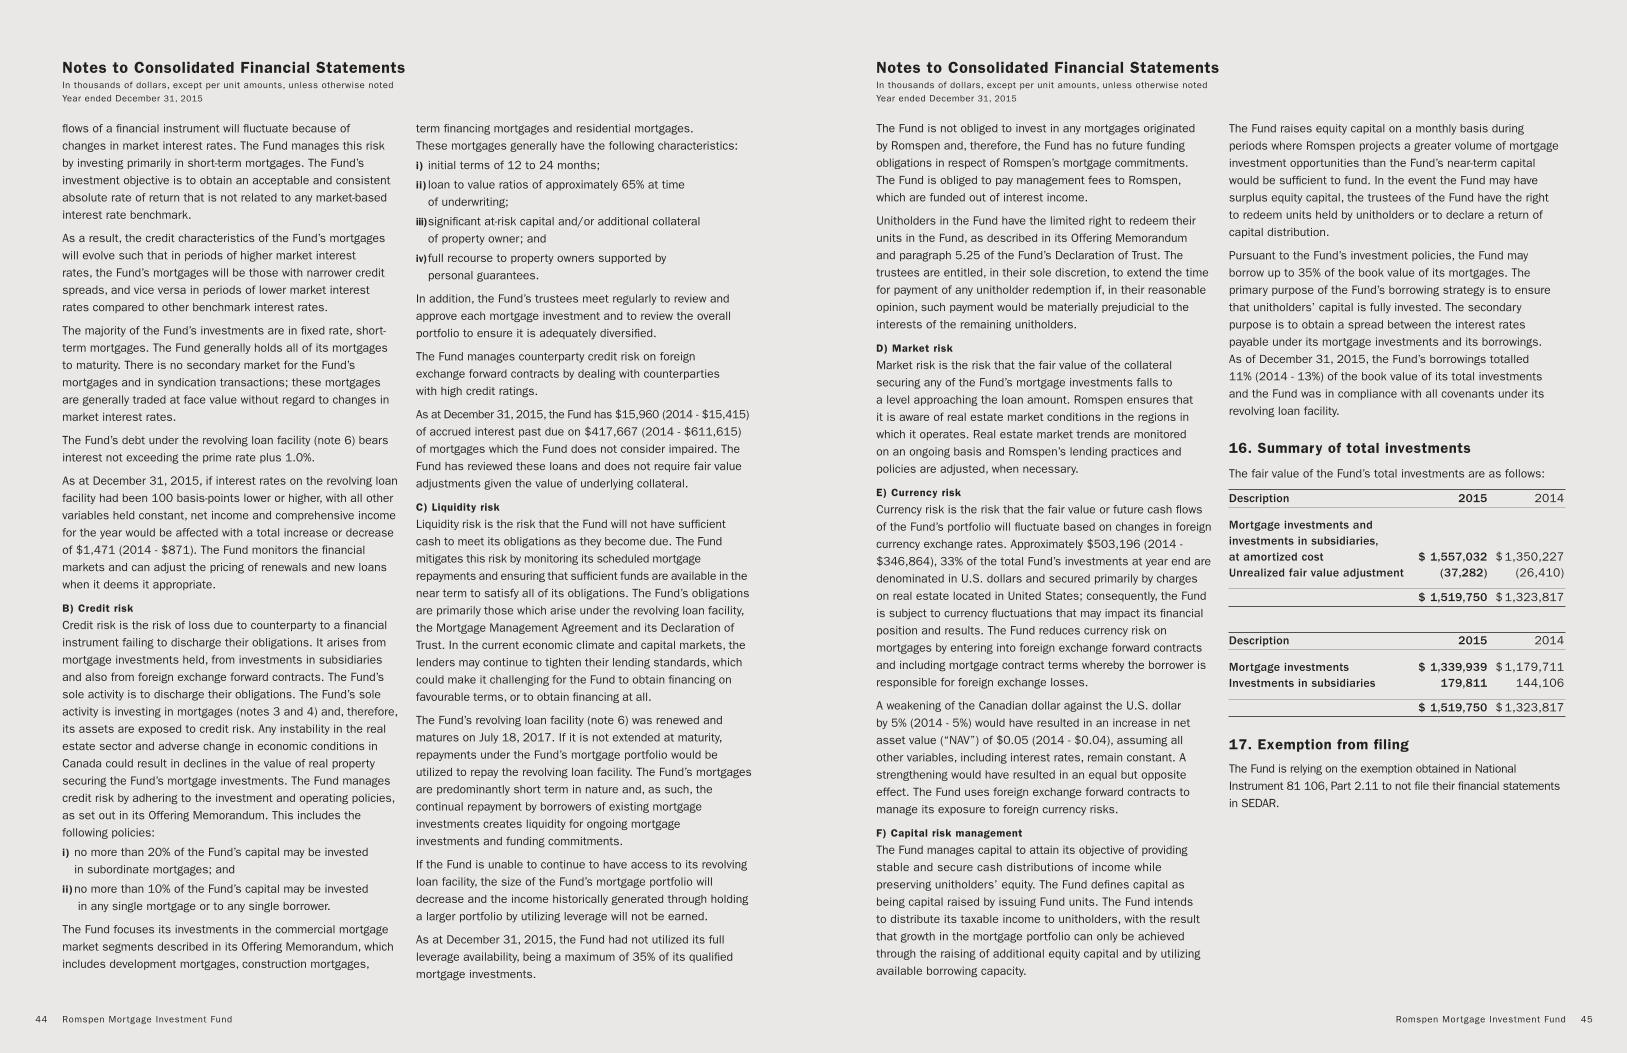
flows of a financial instrument will fluctuate because of changes in market interest rates. The Fund manages this risk by investing primarily in short-term mortgages. The Fund’s investment objective is to obtain an acceptable and consistent absolute rate of return that is not related to any market-based interest rate benchmark.
As a result, the credit characteristics of the Fund’s mortgages will evolve such that in periods of higher market interest rates, the Fund’s mortgages will be those with narrower credit spreads, and vice versa in periods of lower market interest rates compared to other benchmark interest rates.
The majority of the Fund’s investments are in fixed rate, short-term mortgages. The Fund generally holds all of its mortgages to maturity. There is no secondary market for the Fund’s mortgages and in syndication transactions; these mortgages are generally traded at face value without regard to changes in market interest rates.
The Fund’s debt under the revolving loan facility (note 6) bears interest not exceeding the prime rate plus 1.0%.
As at December 31, 2015, if interest rates on the revolving loan facility had been 100 basis-points lower or higher, with all other variables held constant, net income and comprehensive income for the year would be affected with a total increase or decrease of $1,471 (2014 - $871). The Fund monitors the financial markets and can adjust the pricing of renewals and new loans when it deems it appropriate.
B) Credit risk Credit risk is the risk of loss due to counterparty to a financial instrument failing to discharge their obligations. It arises from mortgage investments held, from investments in subsidiaries and also from foreign exchange forward contracts. The Fund’s sole activity is to discharge their obligations. The Fund’s sole activity is investing in mortgages (notes 3 and 4) and, therefore, its assets are exposed to credit risk. Any instability in the real estate sector and adverse change in economic conditions in Canada could result in declines in the value of real property securing the Fund’s mortgage investments. The Fund manages credit risk by adhering to the investment and operating policies, as set out in its Offering Memorandum. This includes the following policies:
i) no more than 20% of the Fund’s capital may be invested in subordinate mortgages; and
ii) no more than 10% of the Fund’s capital may be invested in any single mortgage or to any single borrower.
The Fund focuses its investments in the commercial mortgage market segments described in its Offering Memorandum, which includes development mortgages, construction mortgages,
term financing mortgages and residential mortgages. These mortgages generally have the following characteristics:
i) initial terms of 12 to 24 months;
ii) loan to value ratios of approximately 65% at time of underwriting;
iii) significant at-risk capital and/or additional collateral of property owner; and
iv) full recourse to property owners supported by personal guarantees.
In addition, the Fund’s trustees meet regularly to review and approve each mortgage investment and to review the overall portfolio to ensure it is adequately diversified.
The Fund manages counterparty credit risk on foreign exchange forward contracts by dealing with counterparties with high credit ratings.
As at December 31, 2015, the Fund has $15,960 (2014 - $15,415)
of accrued interest past due on $417,667 (2014 - $611,615) of mortgages which the Fund does not consider impaired. The Fund has reviewed these loans and does not require fair value adjustments given the value of underlying collateral.
C) Liquidity risk Liquidity risk is the risk that the Fund will not have sufficient cash to meet its obligations as they become due. The Fund mitigates this risk by monitoring its scheduled mortgage repayments and ensuring that sufficient funds are available in the near term to satisfy all of its obligations. The Fund’s obligations are primarily those which arise under the revolving loan facility, the Mortgage Management Agreement and its Declaration of Trust. In the current economic climate and capital markets, the lenders may continue to tighten their lending standards, which could make it challenging for the Fund to obtain financing on favourable terms, or to obtain financing at all.
The Fund’s revolving loan facility (note 6) was renewed and matures on July 18, 2017. If it is not extended at maturity, repayments under the Fund’s mortgage portfolio would be utilized to repay the revolving loan facility. The Fund’s mortgages are predominantly short term in nature and, as such, the continual repayment by borrowers of existing mortgage investments creates liquidity for ongoing mortgage investments and funding commitments.
If the Fund is unable to continue to have access to its revolving loan facility, the size of the Fund’s mortgage portfolio will decrease and the income historically generated through holding a larger portfolio by utilizing leverage will not be earned.
As at December 31, 2015, the Fund had not utilized its full leverage availability, being a maximum of 35% of its qualified mortgage investments.
The Fund is not obliged to invest in any mortgages originated by Romspen and, therefore, the Fund has no future funding obligations in respect of Romspen’s mortgage commitments. The Fund is obliged to pay management fees to Romspen, which are funded out of interest income.
Unitholders in the Fund have the limited right to redeem their units in the Fund, as described in its Offering Memorandum and paragraph 5.25 of the Fund’s Declaration of Trust. The trustees are entitled, in their sole discretion, to extend the time for payment of any unitholder redemption if, in their reasonable opinion, such payment would be materially prejudicial to the interests of the remaining unitholders.
D) Market risk Market risk is the risk that the fair value of the collateral securing any of the Fund’s mortgage investments falls to a level approaching the loan amount. Romspen ensures that it is aware of real estate market conditions in the regions in which it operates. Real estate market trends are monitored on an ongoing basis and Romspen’s lending practices and policies are adjusted, when necessary.
E) Currency risk Currency risk is the risk that the fair value or future cash flows of the Fund’s portfolio will fluctuate based on changes in foreign currency exchange rates. Approximately $503,196 (2014 - $346,864), 33% of the total Fund’s investments at year end are denominated in U.S. dollars and secured primarily by charges on real estate located in United States; consequently, the Fund is subject to currency fluctuations that may impact its financial position and results. The Fund reduces currency risk on mortgages by entering into foreign exchange forward contracts and including mortgage contract terms whereby the borrower is responsible for foreign exchange losses.
A weakening of the Canadian dollar against the U.S. dollar by 5% (2014 - 5%) would have resulted in an increase in net asset value (“NAV”) of $0.05 (2014 - $0.04), assuming all other variables, including interest rates, remain constant. A strengthening would have resulted in an equal but opposite effect. The Fund uses foreign exchange forward contracts to manage its exposure to foreign currency risks.
F) Capital risk management The Fund manages capital to attain its objective of providing stable and secure cash distributions of income while preserving unitholders’ equity. The Fund defines capital as being capital raised by issuing Fund units. The Fund intends to distribute its taxable income to unitholders, with the result that growth in the mortgage portfolio can only be achieved through the raising of additional equity capital and by utilizing available borrowing capacity.
The Fund raises equity capital on a monthly basis during periods where Romspen projects a greater volume of mortgage investment opportunities than the Fund’s near-term capital would be sufficient to fund. In the event the Fund may have surplus equity capital, the trustees of the Fund have the right to redeem units held by unitholders or to declare a return of capital distribution.
Pursuant to the Fund’s investment policies, the Fund may borrow up to 35% of the book value of its mortgages. The primary purpose of the Fund’s borrowing strategy is to ensure that unitholders’ capital is fully invested. The secondary purpose is to obtain a spread between the interest rates payable under its mortgage investments and its borrowings. As of December 31, 2015, the Fund’s borrowings totalled 11% (2014 - 13%) of the book value of its total investments and the Fund was in compliance with all covenants under its revolving loan facility.
16. Summary of total investments
The fair value of the Fund’s total investments are as follows:
Description 2015 2014
Mortgage investments and investments in subsidiaries, at amortized cost $ 1,557,032 $ 1,350,227Unrealized fair value adjustment (37,282) (26,410)
$ 1,519,750 $ 1,323,817
Description 2015 2014
Mortgage investments $ 1,339,939 $ 1,179,711Investments in subsidiaries 179,811 144,106
$ 1,519,750 $ 1,323,817
17. Exemption from filing
The Fund is relying on the exemption obtained in National Instrument 81 106, Part 2.11 to not file their financial statements in SEDAR.
Notes to Consolidated Financial StatementsIn thousands of dollars, except per unit amounts, unless otherwise noted Year ended December 31, 2015
Notes to Consolidated Financial StatementsIn thousands of dollars, except per unit amounts, unless otherwise noted Year ended December 31, 2015
Romspen Mor tgage Investment Fund Romspen Mor tgage Investment Fund44 45

Notes:1. Romspen results from January 1996 to January 16, 2006 reflect the pool of individually syndicated mortgages. Net returns are calculated on a cash-on-cash basis. Results from January 16, 2006 to present reflect the Romspen Mortgage Investment Fund, the successor business to the individually syndicated mortgages.
Notes:1. Romspen results from January 1996 to January 16, 2006 reflect the pool of individually syndicated mortgages. Net returns are calculated on a cash-on-cash basis. Results from January 16, 2006 to present reflect the Romspen Mortgage Investment Fund, the successor business to the individually syndicated mortgages.
2. DEX Short-Term Bond Index was renamed the FTSE TMX Short-Term Bond Index. FTSE STBI returns are based on 17 years of data due to data restrictions.
3. Romspen returns are net, comparative returns are gross.
Performance - 20 Years By MonthRomspen has had 20 consecutive years of positive net investor returns (7.4% - 10.8%) with positive returns each and every month.
Romspen Total Portfolio Annual % Return Comparison (1996-2015)Romspen has consistently and significantly outperformed stocks, short-term bonds and T-bills with meaningfully less volatility over virtually every time period.
Source: PricewaterhouseCoopers repor t, Romspen audited financial statements, Romspen analysis
Source: Bank of Canada, TSX, PricewaterhouseCoopers repor t, Romspen audited financial statements, Romspen analysis
January February March April May June July August September October November DecemberAnnual
CompoundNet Return
0.80 0.85 0.87 0.83 0.91 0.77 0.88 0.750.96 1.03 0.83 0.78 10.81996
0.89 0.76 0.83 0.83 0.77 0.71 0.87 0.730.91 0.87 0.73 0.35 9.71997
0.92 0.89 0.92 0.77 0.69 0.76 1.02 0.800.75 0.93 0.77 0.87 10.61998
0.77 0.74 0.77 0.84 0.88 0.79 0.89 0.960.71 0.74 0.84 0.72 10.11999
0.87 0.78 0.93 0.74 0.88 0.75 0.81 0.730.75 0.79 0.82 0.80 10.12000
0.91 0.67 0.83 0.69 0.82 0.76 0.82 0.730.87 0.92 0.83 0.73 10.02001
0.88 0.71 0.86 0.86 1.01 0.67 0.94 0.770.81 0.76 0.77 1.06 10.62002
0.84 0.78 0.76 0.70 0.71 0.77 0.83 0.870.72 0.76 0.68 0.90 9.72003
0.67 1.08 0.83 0.88 0.71 1.02 0.76 0.630.83 0.62 0.74 0.68 9.82004
0.65 0.06 0.86 0.58 0.88 1.91 0.57 0.741.08 0.74 0.57 0.88 9.92005
0.80 0.80 0.80 0.80 0.80 0.80 0.80 0.800.90 0.80 0.80 0.95 10.32006
0.80 0.80 0.90 0.80 0.80 0.90 0.80 0.900.80 0.81 0.80 0.92 10.52007
0.80 0.80 0.90 0.80 0.80 0.80 0.80 0.800.80 0.80 0.70 0.70 9.92008
0.70 0.70 0.70 0.70 0.70 0.70 0.70 0.700.70 0.70 0.70 0.70 8.72009
0.70 0.70 0.70 0.70 0.70 0.70 0.70 0.700.70 0.70 0.70 0.70 8.72010
0.70 0.60 0.70 0.70 0.60 0.70 0.70 0.700.60 0.60 0.60 0.70 8.22011
0.70 0.60 0.60 0.60 0.70 0.60 0.60 0.600.60 0.60 0.60 0.60 7.72012
0.60 0.60 0.60 0.60 0.60 0.60 0.60 0.600.60 0.60 0.60 0.60 7.42013
0.60 0.60 0.60 0.70 0.60 0.60 0.60 0.600.60 0.60 0.70 0.70 7.82014
0.70 0.70 0.60 0.70 0.60 0.60 0.70 0.700.70 0.60 0.70 0.60 8.22015
Year40%
30%
20%
10%
0%
-10%
-20%
-30%
-40%
1996 1997 1999 2000 2001 2002 2003 2004 2005 2006 2007 2008 2009 2010 2011 2012 2013 2014 20151998
Romspen Mortgage Investment Fund 91-Day T-bills FTSE TMX Short-Term Bond Index Common Stocks (S&P/TSX Composite Index)
Historical Performance Overview
As of December 31, 2015
3 Yrs 7.8% 7.8% 8.7% 9.4%5 Yrs 10 Yrs 20 Yrs
Romspen Mor tgage Investment Fund Romspen Mor tgage Investment Fund46 47

Romspen’s team of investment professionals is led by nine Managing Partners who collectively have over 180 years of finance and real estate experience. The investment team is supported by more than 30 professionals dedicated to the financial control, underwriting, legal and reporting matters of our business. The trustees and management team are collectively the largest non-institutional investor in the Fund. This alignment is central to preserving capital and generating strong consistent returns for all investors.
Romspen Mortgage Investment FundSheldon Esbin Trustee
Mark Hilson Trustee
Arthur Resnick Trustee
Wesley Roitman Trustee
Romspen Investment CorporationSheldon Esbin Managing General Partner
Mark Hilson Managing General Partner
Wesley Roitman Managing General Partner
Blake Cassidy Managing Partner
Richard Weldon Managing Partner
Arthur Resnick Managing Partner
Peter Oelbaum Managing Partner
Steven Gross Managing Partner
Mary Gianfriddo Managing Partner
Arnie Bose Vice President, Finance
Bonnie Bowerman Vice President, Underwriting
Lisa Calandra Vice President, Investor Relations
Vitor Fonseca Vice President and Treasurer
Joel Mickelson Corporate Counsel
Dianna Price Executive Vice President, Investor Relations
UnitsThe Fund units represent a beneficial ownership interest in the Romspen Mortgage Investment Fund. The Fund is an unincorporated closed-end investment trust and is the sole limited partner in the Romspen Mortgage Limited Partnership.
DistributionsDistributions on Fund units are payable on or about the 15th day of each month. The Fund intends to distribute its taxable earnings each year to the unitholders.
Distribution Reinvestment PlanThe distribution reinvestment plan provides unitholders a means to reinvest cash distributions in new units of the Fund. To participate, registered unitholders should contact Romspen.
Investor Relations ContactRequests for the Fund’s annual report, quarterly reports, or other corporate communications should be directed to:Investor Relations Romspen Mortgage Investment Fund Suite 300, 162 Cumberland Street Toronto, Ontario M5R 3N5416-966 -1100
Annual General Meeting of UnitholdersRomspen Mortgage Investment Fund’s Annual General Meeting of unitholders will be held on Friday, June 3, 2016 at 10 a.m. in the Willard Room (mezzanine level) of the InterContinental Toronto Yorkville Hotel at 220 Bloor Street West, Toronto, Ontario.
Duplicate CommunicationRegistered holders of Romspen units may receive more than one copy of shareholder mailings. Every effort is made to avoid duplication, but when units are registered under different names and/or addresses, multiple mailings result. Unitholders who receive but do not require more than one mailing for the same ownership are requested to contact Investor Relations and arrangements will be made to combine the accounts for mailing purposes.
AuditorsKPMG LLP Chartered Accountants
Legal CounselGardiner Roberts LLP
Websitewww.romspen.com
Unitholder InformationTrustees & Management
Romspen Investment Corporation FSCO licence #10172, 11600
Romspen Mor tgage Investment Fund48