rookery bay report final - duke university
TRANSCRIPT

Ecosystem Services Resources for Mangrove Restoration at Rookery Bay NERRSara Mason, Rachel Karasik, and Lydia Olander
NICHOLAS INSTITUTEFOR ENVIRONMENTAL POLICY SOLUTIONS
Nicholas Institute for Environmental Policy Solutions nicholasinstitute.duke.edu

Author AffiliationsSara Mason is a Policy Associate at the Nicholas Institute for Environmental Policy Solutions.
Rachel Karasik is a Policy Associate at the Nicholas Institute for Environmental Policy Solutions.
Lydia Olander is Director of the Ecosystem Services Program at the Nicholas Institute for Environmental Policy Solutions.
CitationMason, S. , R. Karasik, and L. OLander. 2020. Ecosystem Services Resources for Mangrove Restoration at Rookery Bay NERR. NI R 20-04. Durham, NC: Duke University
AcknowledgementsThis work was sponsored by the National Estuarine Research Reserve System Science Collaborative, which supports collaborative research that addresses coastal management problems important to the reserves. The Science Collaborative is funded by the National Oceanic and Atmospheric Administration and managed by the University of Michigan Water Center (NAI4NOS4190145). We would also like to thank our partners at Rookery Bay National Estuarine Research Reserve, Brita Jessen and Jessica McIntosh, without whom this work would not have been possible.
Cover Photo: Florida Fish & Wildlife (CC BY-NC-ND 2.0)
Published by the Nicholas Institute for Environmental Policy Solutions in 2020. All Rights Reserved.
Publication Number: NI R 20-05
CONTENTSSummary 2
Conceptual Models as a Way to Systematically Think About Ecosystem Services 3
Case Study: Ecosystem Services for Mangrove Restoration in Rookery Bay NERR 3
Possible Next Steps for Rookery Bay 15
Summary The NERRS Is Interested in Incorporating Ecosystem Services into Research, Management, and Decision-Making
Ecosystem services are the benefits that flow from nature to people, and an ecosystem services approach to coastal management is defined by the consideration of these benefits in decision-making. The National Estuarine Research Reserve System (NERRS) has acknowledged that using an ecosystem services lens for research, management, and decision-making is important to reflect the numerous social, economic, and environmental benefits that estuarine systems provide.
While ecosystem services are at the forefront of many NERRS activities, there is not yet a standard approach for integrating a broad suite of ecosystem services into the management decision-making process. Using a common approach to describe and monitor ecosystem services across the Reserve System could enable more efficient knowledge transfer, data sharing, and tracking of trends in ecosystem services provision across sites.
This case study describes the use of Ecosystem Services Conceptual Models (ESCMs) as a framework for considering the ecosystem services provided by a mangrove restoration project at Rookery Bay NERR. The mangrove model was used to assess research gaps and inform ecosystem service metric selection. The model (and associated metrics) could likely be used at other sites as a template for consideration of the ecosystem services effects of mangrove restoration.
Ecosystem Services Resources for Mangrove Restoration at Rookery Bay NERR

Nicholas Institute for Environmental Policy Solutions, Duke University | 3
CONCEPTUAL MODELS AS A WAY TO SYSTEMATICALLY THINK ABOUT ECOSYSTEM SERVICES
Ecosystem Services Conceptual Models represent a possible entry point for beginning to incorporate a suite of ecosystem services considerations into a program or project. These models illustrate the way that a management intervention or external driver cascades through an ecological system and results in changes to ecosystem service and other human welfare impacts (Figure 1). Generalized ESCMs can be developed for a broad category of management or an ecosystem type, and specified ESCMs are versions of these generalized models, but developed to describe a specific context and intervention. Generalized models will usually be higher level and less specific to enhance transferability, while site-specific models are often more detailed and precisely tailored to the conditions and processes of a particular location. For further information on ESCMs, see a primer here.
Figure 1. Structure of an Ecosystem Services Conceptual Model
Ecosystem services are the handoff between ecological and social systems and can be measured as changes in eco-logically linked human activity (e.g., # of people recreating at a site due to restoration; # of homes at risk of flooding due to loss of a wetland) or socioeconomic activity (e.g., jobs or revenue generated from an increase in fishing or recreational activity).
CASE STUDY: ECOSYSTEM SERVICES FOR MANGROVE RESTORATION IN ROOKERY BAY NERR
This case study describes a project that built a new generalized mangrove ESCM in partnership with Rookery Bay NERR, specified it to a specific restoration site, identified associated ecosystem services metrics, and developed educational and outreach materials based on these models.
Rookery Bay NERRRookery Bay is a 110,000-acre Research Reserve in southwest Florida, consisting of mangrove forest, uplands, and protected waters. This area represents a portion of one of the largest remaining intact mangrove estuaries in North America. These habitats harbor important populations of coastal and marine wildlife, including 150 species of birds, 400 plants, and 250 fishes (Rookery Bay NERR Management Plan).

Nicholas Institute for Environmental Policy Solutions, Duke University | 4
BOX 1. POSSIBLE USES FOR ESCMSESCMs have multiple uses, which are summarized below. Where possible, we have linked to an example of ESCMs being used in each of the ways listed.
ESCMs can:
• Be adapted to different contexts. General coastal habitat models can be adapted to any site where the habitat exists.
• Act as a foundation for socioecological systems thinking. Building and working with these models can help managers and researchers move beyond examining ecological outcomes of habitat management to mapping out impacts to people and what they care about. By clearly illustrating connections between different ecological and social aspects of a system, these models can help spur thinking about the variety of partners and expertise needed to fully understand the impacts that a particular management action or external driver will have.
• Identify services and beneficiary groups. By extending these models all the way out to ecosystem services and social outcomes you can start to think about how different groups will be impacted by ecological changes resulting from management decisions. (link to beneficiary case).
• Act as a pathway for consistency in ecosystem service assessment. Ecosystem services tend to be context-specific because they are unique to the communities/groups/stakeholders receiving benefits from a particular ecosystem, but there is still a need for consistency in how they are considered across contexts so that comparisons can be made. These models can act as a consistent framework to identify central themes or outcomes across different contexts.
• Jump-start ecosystem services and/or socioeconomic metric selection. Since ESCMs help to identify the full suite of socioeconomic outcomes linked to an intervention, they are a useful starting place for selecting common metrics that would allow for easier comparison between ecosystem services outcomes of different projects (link to metrics web page).
• Create a foundation for ecosystem service quantification and valuation. These models can act as a framework for thinking about necessary data and analytical models for quantifying the range of outcomes relevant to a particular site. (See a journal article discussing an example of this)
• Become an evidence framework. By considering available evidence for each link in the chain, we have an easy way of mapping what is known about these ecosystems, the expected direction and magnitude of changes, and to where there are gaps in evidence suggesting research or monitoring priorities. (e.g., an evidence library for a general salt marsh model)
• Act as a communication tool. You don’t need to understand what the term ‘ecosystem services’ means to read and react to one of these models. They act as a visual summary of the socio-ecological system and can be a good way to engage some stakeholder groups and start conversations about how ecological and human systems interact. (link to communications examples)

Nicholas Institute for Environmental Policy Solutions, Duke University | 5
Project ProcessOur process is outlined below in Table 1. We typically use an iterative and interactive process to incorporate feedback from multiple experts on the usefulness of ESCMs and associated products from those who we hope would use them most.
Table 1. Rookery Bay Project Process Summary
Project Step Details
Draft ESCM created We performed a limited literature review to develop a draft ESCM. This gave participants at our model-building workshop something to respond to.
Potential metrics collected
A basic literature review was conducted to develop a list of metrics that had previously been used to measure ecosystem services. These metrics were meant to serve as a catalyst for deeper discussion with stakeholders about what they perceive to be valid metrics at the site.
Workshop hosted
We hosted a one-day workshop at Rookery Bay with representatives from the NERR, Naples Botanical Garden, the City of Naples, and the Southwest Conservancy of Florida. We updated the general ESCM and drafted a specified ESCM for the Fruit Farm Creek restoration project. We also selected a set of ecosystem services metrics that seemed most important and feasible for use at the Fruit Farm Creek site.
Experts consulted
We consulted 2 different types of experts to provide feedback and advice on the workshop-constructed models.
Habitat experts: we discussed the model with mangrove experts who did not attend the workshop to ensure what was created aligns with their knowledge of mangrove systems.
Social experts: these are people closely tied to the intersection between habitat change and social outcomes (e.g., ecotourism operators, charter captains). We wanted input on how they view habitat restoration (or change) and the outcomes most important to them. This was done to ensure we had incorporated the proper nuance in our model for the connections between the ecological and social system.
Models updated Models were updated based on expert feedback, and were redistributed to workshop participants for input and approval.
Metric assessment
The metric lists generated at our workshop represent what participants thought would be feasible and applicable to measure. These suggested metrics were ranked against a set of criteria relating to feasibility and applicability to better identify which metrics could be adopted into the NERRS framework and perhaps be useful across other NERRS sites.
Development of education and communication materials
We worked with Rookery Bay site staff and stakeholders to develop a number of education and communication materials built off of ESCMs and priorities identified by the NERR.
Development of facilitation guide
A multiphase facilitation guide for coastal managers hoping to develop ESCMs, metrics, and related content was developed.

Nicholas Institute for Environmental Policy Solutions, Duke University | 6
Project ResourcesWe created a set of resources from our project work at Rookery Bay. These resources are summarized in table 2, and more detail on each item can be found in the sections below.
Table 2. Rookery Bay Outputs
Output Details Link
ES Conceptual Models
Ecosystem services conceptual models were created: one for Florida mangrove sites generally, and one for a specific restoration site, Fruit Farm Creek.
Mangrove model
Fruit Farm Creek Model
Metrics assessmentEcosystem services metrics for prioritized model outcomes were selected at the workshop and then assessed using metric criteria.
Metrics list, with notation of how each metric scored against our criteria
Education and outreach materials
Ecosystem services education and outreach materials based on the model content were created for Rookery Bay.
Mangrove Education Materials
Social interview findings
Interviews with experts on the socioeconomic outcomes of restoration were interviewed and responses were summarized.
Social interviews write-up findings/summary
ModelsA general mangrove ESCM was designed for Rookery Bay based on a stakeholder engagement processes, literature reviews, and expert elicitation. The general model includes significant ecological, human activity, and socioeconomic outcomes linked to restoration of that habitat type. A site-specific model for the Fruit Farm Creek mangrove restoration site was also created to test the adaptability and applicability of the generalized Florida mangrove model. Model images can be viewed below, and examined online here.
Attendees at the Florida model-building workshop and in subsequent stakeholder conversations raised important points about what was included in the generalized and specified mangrove models. Important notes about the model are provided below:
• Education and science opportunities provided by restoration sites will link back to increased restoration elsewhere. With increased awareness about the need for and benefit of habitat restoration, there will (hopefully) be increased demand for healthy habitats by the public and policy makers. This important linkage is not shown in the current model because it is such a long-term outcome.
• Mangrove restoration sites could potentially generate nutrient credits, but due to a lack of current nutrient credit programs and markets, this was removed from the general model.
• Going through the model building process was viewed by researchers as a way to systematically think about research gaps. Seeing the entire socioecological system summarized in one place helped the group examine where there are local gaps in knowledge about how different parts of the system interact and connect.
Nicholas Institute for Environmental Policy Solutions, Duke University | 7
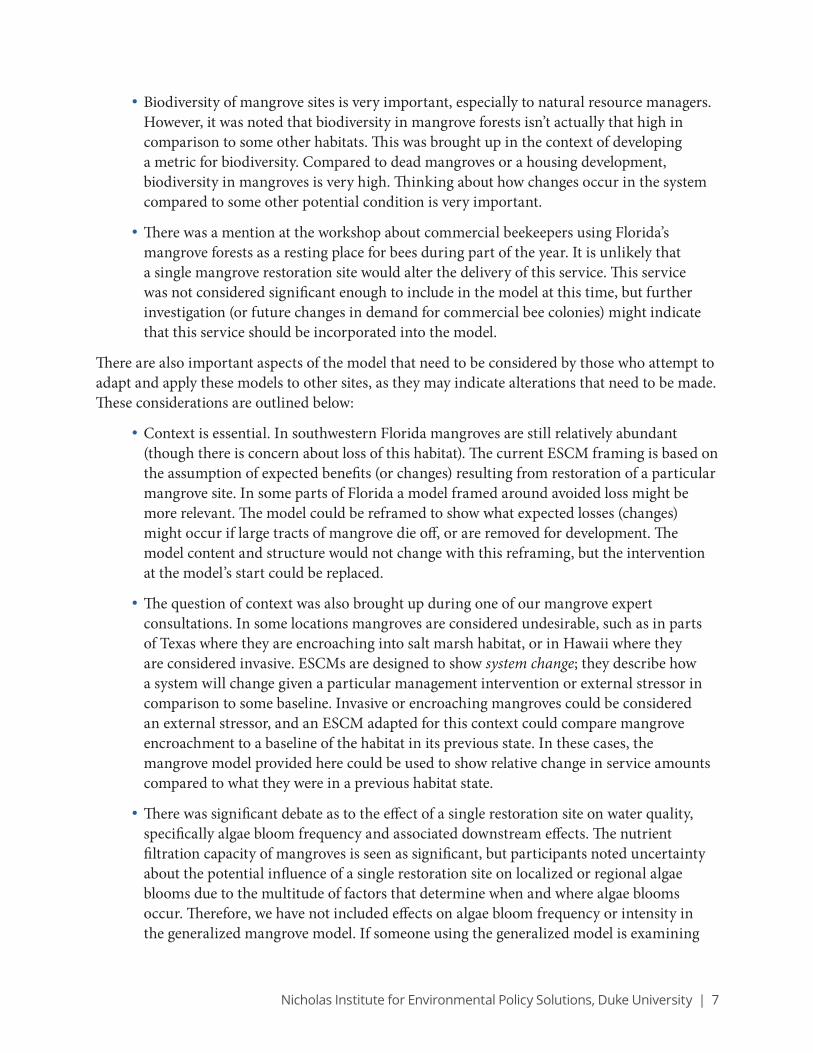
• Biodiversity of mangrove sites is very important, especially to natural resource managers. However, it was noted that biodiversity in mangrove forests isn’t actually that high in comparison to some other habitats. This was brought up in the context of developing a metric for biodiversity. Compared to dead mangroves or a housing development, biodiversity in mangroves is very high. Thinking about how changes occur in the system compared to some other potential condition is very important.
• There was a mention at the workshop about commercial beekeepers using Florida’s mangrove forests as a resting place for bees during part of the year. It is unlikely that a single mangrove restoration site would alter the delivery of this service. This service was not considered significant enough to include in the model at this time, but further investigation (or future changes in demand for commercial bee colonies) might indicate that this service should be incorporated into the model.
There are also important aspects of the model that need to be considered by those who attempt to adapt and apply these models to other sites, as they may indicate alterations that need to be made. These considerations are outlined below:
• Context is essential. In southwestern Florida mangroves are still relatively abundant (though there is concern about loss of this habitat). The current ESCM framing is based on the assumption of expected benefits (or changes) resulting from restoration of a particular mangrove site. In some parts of Florida a model framed around avoided loss might be more relevant. The model could be reframed to show what expected losses (changes) might occur if large tracts of mangrove die off, or are removed for development. The model content and structure would not change with this reframing, but the intervention at the model’s start could be replaced.
• The question of context was also brought up during one of our mangrove expert consultations. In some locations mangroves are considered undesirable, such as in parts of Texas where they are encroaching into salt marsh habitat, or in Hawaii where they are considered invasive. ESCMs are designed to show system change; they describe how a system will change given a particular management intervention or external stressor in comparison to some baseline. Invasive or encroaching mangroves could be considered an external stressor, and an ESCM adapted for this context could compare mangrove encroachment to a baseline of the habitat in its previous state. In these cases, the mangrove model provided here could be used to show relative change in service amounts compared to what they were in a previous habitat state.
• There was significant debate as to the effect of a single restoration site on water quality, specifically algae bloom frequency and associated downstream effects. The nutrient filtration capacity of mangroves is seen as significant, but participants noted uncertainty about the potential influence of a single restoration site on localized or regional algae blooms due to the multitude of factors that determine when and where algae blooms occur. Therefore, we have not included effects on algae bloom frequency or intensity in the generalized mangrove model. If someone using the generalized model is examining

Nicholas Institute for Environmental Policy Solutions, Duke University | 8
restoration on a large scale or for multiple sites in a single estuary, they may want to consider adding these effects back into the model.
Florida Generalized Mangrove Model
Figure 3. The Florida Generalized Mangrove ESCM
Site-Specific Mangrove Model: Fruit Farm CreekWe applied the general mangrove model to a specific restoration site at Rookery Bay called Fruit Farm Creek (FFC), and Figure 5 displays the site-specific model. You can see that parts of the Figure 5 model have been “turned off” (shown in gray) to illustrate those elements of the general model that are not relevant at the FFC site. FFC is a 225-acre site of dead and dying mangroves situated between Marco Island and Goodland, Florida. A road that bisects FFC prevents tidal flows from sufficiently reaching the southern part of this site and inhibits drainage when heavy rains occur. Rookery Bay and partners recently received funds to complete culverts that would restore hydrological connection of the FFC mangrove site.

Nicholas Institute for Environmental Policy Solutions, Duke University | 9
Figure 4. Image of Dead Mangroves at the Fruit Farm Creek Site (Fall 2018)
Figure 5. The Site-Specific Mangrove ESCM Developed for the Fruit Farm Creek Site
Boxes and arrows that have been grayed out indicate those parts of the general model that are not relevant at the Fruit Farm Creek site.

Nicholas Institute for Environmental Policy Solutions, Duke University | 10
Metrics for Mangrove Restoration in FloridaESCMs are a useful starting place for understanding the ecosystem services outcomes from interventions like restoration. They can be a jumping off place for integrating ecosystem services into management in many ways, including the development of metrics used to monitor outcomes of restoration projects. One of the benefits of monitoring ecosystem services is that these metrics can resonate with stakeholders who aren’t normally interested in environmental data. Ecosystem services data record information about how natural systems affect people, and it is important to select metrics that represent those outcomes that people care about. There are multiple ways to observe and measure ecosystem services or socio-economic outcomes, and it is a significant challenge to select metrics that are meaningful but also feasible to measure.
Using a set of metrics extracted from a literature review as a starting point, workshop participants were asked to identify a minimum of three metrics that could be used to measure each dominant ecosystem services outcome for mangrove restoration projects in Florida. Some of the identified metrics are already being measured or are considered feasible to measure. Other metrics were viewed by our stakeholders as less feasible, idealized metrics, and we chose to identify these metrics as “dream” metrics to document what our stakeholders would most like to measure, even if it might not be feasible at this time.
Metric Assessment In order to rank and compare the metrics developed at our workshop we assessed the metrics through a set of six criteria (described in Table 3 below) that would comprehensively relay the feasibility and relevance of each metric.
Table 3. Metric Criteria and How Each Criterion Was Scored
Criteria Score 1 Score 2 Score 3
Metric has been measured elsewhere
There is no clear or published method for measuring this metric
Measurement of this metric has not taken place at a NERR but there are publications that include clear guidelines on how to measure the metric in relevant contexts
Measurement of this metric has taken place in similar contexts and a replicable method within NERR sites exists
Ease and cost of data collection
Very difficult and/or costly
Somewhat difficult and/or costly
Relatively easy and/or cheap
Metric captures the ecosystem services outcome of interest
Important aspects of outcome are not captured
Metric captures some important aspects of the outcome
Metric captures the outcome fully or directly
Changes in the metric can be attributed to a restoration project
Attribution is difficult/impossible
Attribution might be possible
Change in metric is likely directly attributable to restoration

Nicholas Institute for Environmental Policy Solutions, Duke University | 11
Criteria Score 1 Score 2 Score 3
Changes in the metric could be detected within a typical project lifecycle
No, unlikely to see this change within 5 years
Might see minor changes within 5 years
Yes, likely to see this change within 5 years
Data on this metric would resonate with important stakeholders
No, data on this metric will not resonate well with people outside the academic community
Somewhat, select stakeholders will be able to connect with this metric
Yes, the metric connects easily to things that people care about
For each criterion, scores of 1 through 3 were assigned, with 1 being the least suitable and 3 being the most suitable, based on the authors’ knowledge of the metric and the methods described in the literature review. When they are summed, the six individual metric criteria scores range from 6 to 18, with higher scores representing more suitable metrics. It is important to note that this metrics feasibility assessment, while an effort to standardize and qualify the potential metrics, is still somewhat subjective and relies on the literature review and knowledge of the authors of this report. A sample of assessed metrics are shown below in Tables 4–6, and the full metrics list can be found here with a breakdown of how each metric scored on the six criteria. Metrics with “**” represent ‘dream’ metrics.
It is important to note that these metrics are focused on sampling for a single restoration site and as a result the ecosystem services metrics tend to measure ecological outcomes that are providing a service to people in the area or human activities that indicate use of a service, rather than socioeconomic metrics like jobs or revenue which tend to measure larger scale impacts.
Top-Scoring Metrics There are nine metrics developed from the Rookery Bay workshop that scored 15 and 16 out of 18 total possible points. Three are ecological metrics, while the others are measures of human activities indicating social links to ecosystems (ecosystem services). Though we prefer to select ecosystem services metrics that move beyond ecological measures, ecological metrics likely scored highly as they tend to be more attributable and easier to measure. Those metrics related to education opportunities associated with habitat restoration ranked highly because those data are readily available for NERRS sites and attributable to restoration activities on the site.
Table 4. Top-Scoring Mangrove Metrics
Metric Outcome from ESCM
Total score Brief description of methods
Habitat extent/size of the site Habitat Persistence 16 Field surveys of site size
Number of scientists and students conducting research at the site
Scientific Opportunities 16 NERRS site tracks and monitors this
data.Research opportunities for students/ number of papers or presentations about the site or project
Scientific Opportunities 16 NERRS site tracks and monitors this
data.Number of grants awarded for scientific research at the site
Scientific Opportunities 16 NERRS site tracks and monitors this
data.

Nicholas Institute for Environmental Policy Solutions, Duke University | 12
Metric Outcome from ESCM
Total score Brief description of methods
Scientific trainings held at the site Scientific Opportunities 16 NERRS site tracks and monitors this
data.Area of dead/unhealthy mangroves at the site
Aesthetics & Odor 16 Site surveys of dead/unhealthy trees.
Number of species of particular importance found at the site (FL); abundance/presence of a particular fish species at a reef (NC)
Fish Populations 15 Visual survey conducted before, during,
and after restoration.
Number of species at the site Biodiversity 15
Species Counts—user decides which taxa to include and survey those taxa using appropriate methods (variable by taxa).
Area of dead/unhealthy mangroves at the site Aesthetics 15 Remote sensing techniques
Dream Metrics The workshop group identified “dream” metrics for outcomes based on their personal and professional expertise. These are the metrics that stakeholders felt best captured the ecosystem services outcome of interest in a meaningful way, but that were considered difficult to monitor due to difficulty or cost of collecting the requisite data. We recognize that in many cases the ease and cost of collecting data on a particular metric is the ultimate deciding factor in whether a metric gets monitored, indicating that many of these metrics are unlikely to be used in the near future.
Table 5. Dream Metrics and Their Metric Assessment Scores
Metric Outcome from ESCM
Total score Brief description of methods
**Biodiversity metric/diversity index Biodiversity 12 One or combination of metrics for biodiversity, such
as species richness or Shannon index**Self-reported symptoms of mental health issues (by survey) Mental Health 9
Wide-spread survey of mental health (self-reported symptoms in particular) that includes questions relating to access to or knowledge of natural spaces.
**Self-reported use of medications for depression and anxiety (by survey)
Mental Health 8Wide-spread survey of mental health (self-reported symptoms in particular) that includes questions relating to access to or knowledge of natural spaces.
**Support for policies that protect mangroves (survey technique)
Mangrove Habitat Persistence
7
The Florida Department of Environmental Protection has a summary of policies (and management plans) that aim to protect mangroves. This metric requires a survey of the locals to understand support for these policies.
**Survey on what participants learned about mangroves and their restoration after an educational program
Educational Opportunities 14
Information on the details of educational trips to Rookery Bay mangrove sites are on the website, but additional surveys would need to be designed and implemented.
**Willingness to pay for a certain habitat type
Habitat Persistence 11
Willingness to pay study where each respondent is asked their willingness to pay for one of four oyster reef restoration projects of different sizes.
Nicholas Institute for Environmental Policy Solutions, Duke University | 13
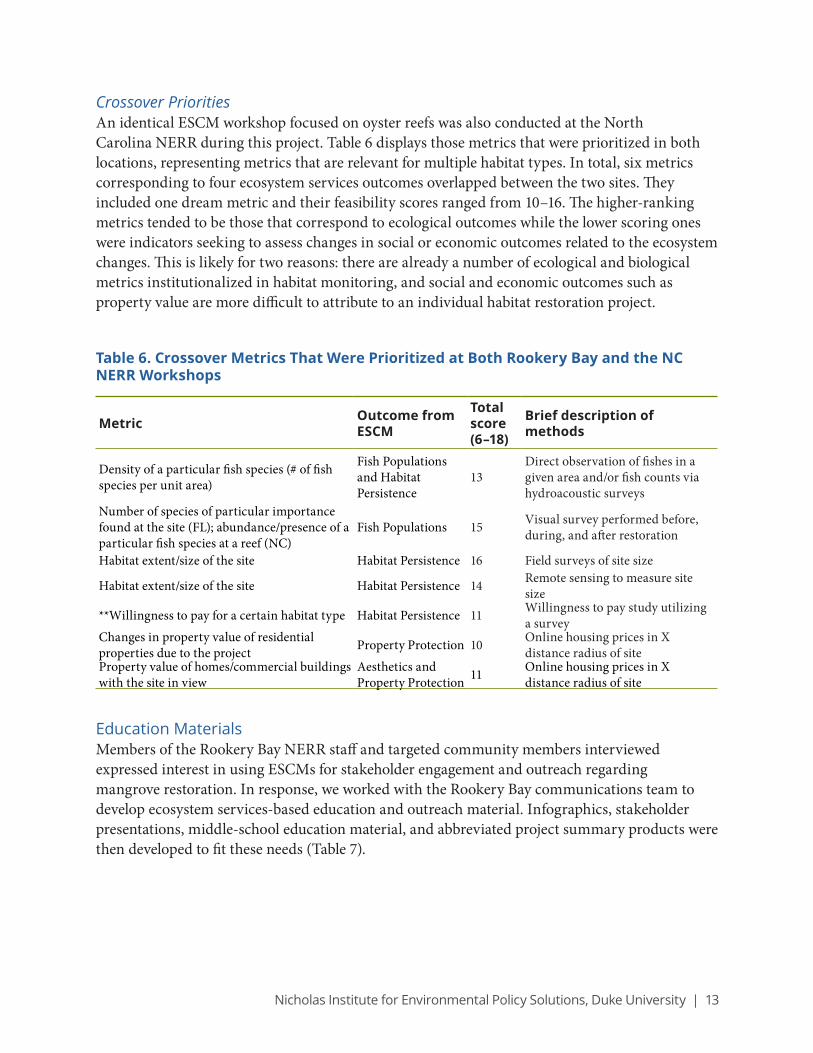
Crossover PrioritiesAn identical ESCM workshop focused on oyster reefs was also conducted at the North Carolina NERR during this project. Table 6 displays those metrics that were prioritized in both locations, representing metrics that are relevant for multiple habitat types. In total, six metrics corresponding to four ecosystem services outcomes overlapped between the two sites. They included one dream metric and their feasibility scores ranged from 10–16. The higher-ranking metrics tended to be those that correspond to ecological outcomes while the lower scoring ones were indicators seeking to assess changes in social or economic outcomes related to the ecosystem changes. This is likely for two reasons: there are already a number of ecological and biological metrics institutionalized in habitat monitoring, and social and economic outcomes such as property value are more difficult to attribute to an individual habitat restoration project.
Table 6. Crossover Metrics That Were Prioritized at Both Rookery Bay and the NC NERR Workshops
Metric Outcome from ESCM
Total score (6–18)
Brief description of methods
Density of a particular fish species (# of fish species per unit area)
Fish Populations and Habitat Persistence
13Direct observation of fishes in a given area and/or fish counts via hydroacoustic surveys
Number of species of particular importance found at the site (FL); abundance/presence of a particular fish species at a reef (NC)
Fish Populations 15 Visual survey performed before, during, and after restoration
Habitat extent/size of the site Habitat Persistence 16 Field surveys of site size
Habitat extent/size of the site Habitat Persistence 14 Remote sensing to measure site size
**Willingness to pay for a certain habitat type Habitat Persistence 11 Willingness to pay study utilizing a survey
Changes in property value of residential properties due to the project Property Protection 10 Online housing prices in X
distance radius of site Property value of homes/commercial buildings with the site in view
Aesthetics and Property Protection 11 Online housing prices in X
distance radius of site
Education Materials Members of the Rookery Bay NERR staff and targeted community members interviewed expressed interest in using ESCMs for stakeholder engagement and outreach regarding mangrove restoration. In response, we worked with the Rookery Bay communications team to develop ecosystem services-based education and outreach material. Infographics, stakeholder presentations, middle-school education material, and abbreviated project summary products were then developed to fit these needs (Table 7).

Nicholas Institute for Environmental Policy Solutions, Duke University | 14
Table 7. Summary of Education and Outreach Material Created for Rookery Bay
General Outreach Material Middle School Education Material
Stakeholder ES PowerPoint presentation
Twitter infographics (Graphic 1, Graphic 2)
Simplified ESCM (for communication purposes)
ESCM Fact Sheet
ES PowerPoint Lesson
Mangrove Mania PowerPoint game
ES Bingo and ES Sorting (printable activities)
Figure 6. Example of an Infographic Created to Describe the Ecosystem Services of Mangroves in Florida
Social Interviews Regarding Mangrove RestorationIn addition to engagement with natural resource and habitat experts, we conducted interviews with people impacted by mangrove restoration in southwest Florida, but not directly involved in restoration on the NERRS project site. This was done to determine if the final set of ecosystem services outcomes aligns well with these stakeholders’ perceptions of what the important impacts of restoration are. For Rookery Bay, we conducted four semi-structured phone interviews. The people with whom we spoke represented industries including tourism, recreational fisheries, and real estate. Interviewees indicated that the final list of ecosystem services outcomes developed at the workshop correctly reflected their understanding of important restoration impacts. The most prevalent theme across the interviews was that the tourism community relies on revenue from mangrove-related services. Therefore, stakeholders depend on reliable and continuous presence of healthy mangroves to maintain the tourism industry in southwestern Florida. See a full write up of the social interviews here.

Nicholas Institute for Environmental Policy Solutions, Duke University | 15
POSSIBLE NEXT STEPS FOR ROOKERY BAY
Using an ESCM framework represents a relatively easy entry point to more fully and consistently incorporate the consideration of ecosystem services into coastal decision-making. The mangrove model developed for Rookery Bay can be used and adapted for any mangrove restoration the reserve considers in the future. Rookery Bay can also use its familiarity with these models and their uses to adapt ESCMs for other habitats that may be a focus of work at this NERR.
There are also ways to build upon these initial models. Additional information and value can be gained by building additional layers of information on the ESCMs, such as collecting data on a subset of the metrics developed during this project. These ESCMs can also be the basis for understanding research gaps and monitoring priorities, identifying affected communities (see example beneficiaries case), and developing predictive models for examining alternative scenarios. All of these could be built using the framework of the Mangrove model developed for Rookery Bay.
In addition, if the ESCMs and associated products (metrics, evidence assessments, predictive models) are shared as a consistent and common set of models, tools, and resources and adopted by the NERR network more broadly; there is potential for shared knowledge to advance these products across the network, and for more meaningful cross comparison and interconnections on ecosystem services across the Reserve System.
Box 2. Ecosystem Services Workshop Facilitation Guide
We have heard multiple times that the process of hosting and taking part in a workshop to develop ESCMs and think about ecosystem services metrics was a valuable experience for both NERR staff and partners in attendance. The process of adapting models is a good way to start thinking more intentionally about ecosystem services at reserves, and it promotes thinking about the socioecological system more holistically. Model discussion is helpful for identifying gaps in knowledge, starting to normalize ecosystem services thinking across different stakeholders, and thinking very specifically about how NERR management decisions affect different stakeholder groups.
We have documented our workshop process in a facilitation guide that would allow any coastal manager to take one of our draft models and work with a stakeholder group to develop a specified model that fits their site’s context. Find the guide here.

Nicholas Institute for Environmental Policy Solutions, Duke University | 16
Nicholas Institute for Environmental Policy SolutionsThe Nicholas Institute for Environmental Policy Solutions at Duke University is a nonpartisan institute founded in 2005 to help decision makers in government, the private sector, and the nonprofit community address critical environmental challenges. The Nicholas Institute responds to the demand for high-quality and timely data and acts as an “honest broker” in policy debates by convening and fostering open, ongoing dialogue between stakeholders on all sides of the issues and providing policy-relevant analysis based on academic research. The Nicholas Institute’s leadership and staff leverage the broad expertise of Duke University as well as public and private partners worldwide. Since its inception, the Nicholas Institute has earned a distinguished reputation for its innovative approach to developing multilateral, nonpartisan, and economically viable solutions to pressing environmental challenges.
Copyright © 2020 Nicholas Institute for Environmental Policy Solutions, Duke University
ContactNicholas Institute Duke UniversityP.O. Box 90335Durham, NC 27708
1201 Pennsylvania Avenue NWSuite 500Washington, DC 20004
nicholasinstitute.duke.edu