rosenzweig, courtine, et al. extensive spontaneous ... · supplementary figure 1: primate...
TRANSCRIPT

Supplementary Figure 1: Primate corticospinal system. A: Schematic diagram of the corticospinal tract in intact and hemisected primate spinal cords. Dextran-conjugated Alexa488 (D-A488) was injected into the left motor cortex. Biotinylated dextran-amine (BDA) was injected into the right motor cortex, but is omitted here for simplicity. 87% of corticospinal axons initially decussate in the medullary pyramids and descend to the spinal cord in the contralateral, right dorsolateral tract; 11% and 2% of corticospinal axons descend in the ipsilateral, left dorsolateral and ipsilateral ventromedial tracts, respectively 10. Corticospinal terminal arbors are most dense contralateral to the cortex of origin. Lateral hemisection at C7 transects the main right corticospinal projection, but spares the two smaller contralateral projections. Note the right-sided terminal arbors of some ipsilateral (left) descending corticospinal axons 10, which maintain axons below the right-sided lesions, providing a potential substrate for axonal sprouting. B: Horizontal Nissl-stained section (near the dorsoventral midpoint) from a Long-term lesion subject. Dashed line indicates the spinal cord midline. Scale bar: 1 mm. C: Representative lesion reconstruction from a Long-term lesion subject. Lesioned area marked in red. Lesion borders were reconstructed from a 1-in-24 series of Nissl-stained horizontal sections (as in panel B). This was the median-sized lesion in the present experiment.
Rosenzweig, Courtine, et al. Extensive spontaneous plasticity of corticospinal projections after primate spinal cord injury
S1Nature Neuroscience: doi:10.1038/nn.2691

Supplementary Figure 2: Lesion extent in Short-term and Long-term subjects. For each subject, lesion extent was determined in a series of 1-in-24 Nissl-stained horizontal sections and reconstructed as depicted. Red regions denote lesion extent.
S2Nature Neuroscience: doi:10.1038/nn.2691
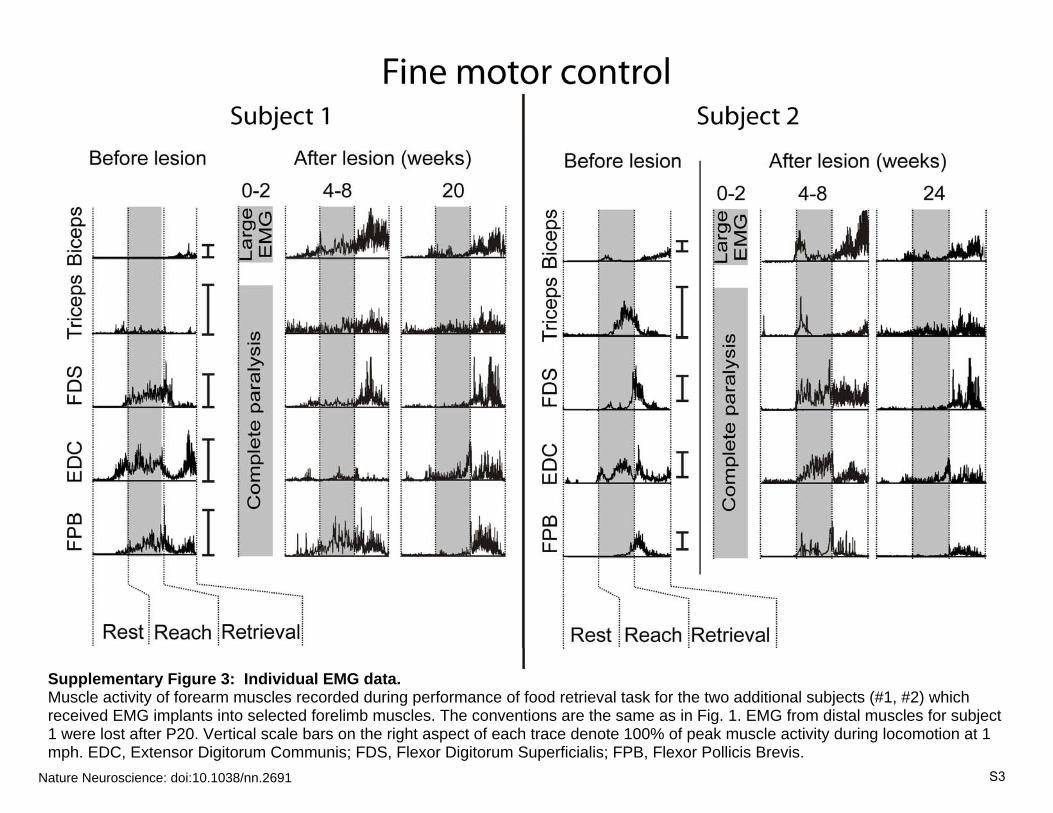
Supplementary Figure 3: Individual EMG data. Muscle activity of forearm muscles recorded during performance of food retrieval task for the two additional subjects (#1, #2) which received EMG implants into selected forelimb muscles. The conventions are the same as in Fig. 1. EMG from distal muscles for subject 1 were lost after P20. Vertical scale bars on the right aspect of each trace denote 100% of peak muscle activity during locomotion at 1 mph. EDC, Extensor Digitorum Communis; FDS, Flexor Digitorum Superficialis; FPB, Flexor Pollicis Brevis.
S3Nature Neuroscience: doi:10.1038/nn.2691

Supplementary Figure 4: Limbs contralateral to lesion. The lateral hemisection did not affect locomotion and fine motor control in the limbs contralateral to the lesion. A: Mean (+SEM) values for the backward (BW, negative direction) and forward (FW, positive direction) positions reached by the hindlimb and right forelimb on the non-lesioned side during locomotion on the treadmill before the lesion, and at different time points after the lesion. Paw and hand displacements were measured with respect to the hip and shoulder, respectively. B: Mean (+SEM) values (n = 5 monkeys) for success/failure rate in the food retrieval task when using the hand contralateral to the lesion. *, P<0.05.
Supplementary Figure 5: Positive correlations among forelimb fine motor control, forelimb locomotor recovery, and hindlimb locomotor recovery. A: Correlation between hindlimb and forelimb locomotor performance recorded at 24 weeks post-lesion for the 5 tested subjects. Pre-lesion values on multiple measures of locomotion (e.g., paw drag, kinematics variability) were run through principal components analysis (see Methods) to compute single values for the forelimb and hindlimb; smaller values correspond to higher levels of functional recovery. B: Correlations between hindlimb and forelimb locomotor impairment vs. success rate in the platform food retrieval task. Least-squares lines are shown, along with their correlation coefficients. All correlations shown in A and B are significant (p < 0.001).
S4Nature Neuroscience: doi:10.1038/nn.2691

Supplementary Figure 6: Incomplete Wallerian degeneration 2 weeks after SCI. All panels show axons in the right dorsolateral corticospinal tract caudal to the complete transection that was performed two weeks earlier. A: Transverse section below the lesion in a Short-term subject demonstrating axotomized, D-A488-labeled axons in the right dorsolateral CST. Note the large number of persistently labeled axons despite transection two weeks earlier. Panels B, C, and D are higher-magnification images taken from the locations indicated on panel A. B: A thick axotomized axon of passage (arrow). C: Two axons of passage (arrows) exhibiting morphology similar to intact axons, despite complete transection two weeks earlier. D: A fine, axotomized axon exiting the dorsolateral CST. E: Another example, from a different Short-term subject, of a fine axon exiting the white matter caudal to the transection site two weeks after injury. The persistence of the axonal tracer below the lesion site in all subjects two weeks post-axotomy indicates that Wallerian degeneration is ongoing at this time point. This in turn suggests that our estimates of axon density two weeks post-lesion are likely overrepresentations that include density counts from transected axons still undergoing Wallerian degeneration. Actual axon density arising solely from midline-decussating axons would therefore be lower than numbers presented in Fig. 4 of the main paper. This in turn indicates that spontaneous axonal sprouting and recovery in density 6 months after the lesion is likely even greater than the reported 2.3-fold recovery reported in the main text. Images in panels A-E are composites of stacks of 7, 6, 6, 7, and 7 thinner focal planes, respectively. Scale bar: A,E 50 µm; B,C,D 25 µm.
S5Nature Neuroscience: doi:10.1038/nn.2691

Supplementary Figure 7: Axons originating in the right motor cortex also exhibit extensive spontaneous sprouting after C7 hemisection A: BDA-labeled axons arborizing in cervical gray matter caudal to the C7 hemisection lesion, transverse section. Dashed line indicates border between gray matter and white matter. B: Quantification of axon density. The Short-term group had significantly lower axon densities than either Intact or Long-term groups, (P<0.05). C: Quantification of axon caliber. The Long-term group had significantly thicker axons below the lesion than both the Intact and Short-term groups, (P<0.05). There were no significant differences between groups in axon density or caliber above the lesion level. Scale bar: 125 µm. Error bars represent SEM, dots are individual animals’ data points, asterisks denote significant differences.
S6Nature Neuroscience: doi:10.1038/nn.2691

Supplementary Figure 8: Quantification of CST axons crossing spinal cord midline. There was not a significant increase (from Short-term to Long-term groups) in the number of CST axons crossing the spinal cord midline (p=0.20). It is possible, however, that the non-significance of the observed trend is a Type II error caused by limited sample sizes. Note that, because CST axons cross the spinal cord midline in both directions (Suppl. Fig. 1), both Short-term and Long-term groups had fewer midline-crossing axons below the lesion level than did Intact animals. Error bars represent SEM, dots are individual animals’ data points, asterisks denote significant differences.
Supplementary Figure 9: Quantification of axon caliber. Increased average axon caliber in Long-term subjects after C7 hemisection results from an increased number of thick axons, rather than a loss of thin axons. Error bars represent SEM (n = 3 Intact, 4 Short-term, 6 Long-term). Squares and triangles indicate significant differences (Student’s t-test, P<0.05) at that caliber.
S7Nature Neuroscience: doi:10.1038/nn.2691

Supplementary Figure 10: Stability of PCA pattern revealed by bootstrapping. An iterative bootstrapping algorithm was employed whereby each subject was excluded in turn prior to PCA extraction to test the stability of the PC clustering of sprouting measures with functional performance. The loading patterns and the proportional variance accounted for by PC1 were pooled by averaging across the different bootstrapping iterations. The replicability of the PC1 pattern was evaluated using Cattell’s salient similarity index (s) and Pearson correlation (r). The results indicate that the PC1 pattern was robustly conserved, and individual subjects did not have a strong biasing effect on the overall structure of the PC1. This provides strong support for a robust statistical association between sprouting and recovery of function after SCI.
Supplementary Figure 11: The density of raphespinal axons does not change between 2 weeks and 8 months after C7 hemisection. 5HT-positive axons were quantified in Rexed Lamina IX (motoneuronal pools) below the C7 lesion and corrected for labeling intensity on the intact side of the same tissue section. Both Short-term and Long-term groups had significantly fewer 5HT axons on the lesion side than the Intact group. This result differs from findings in rat models (Saruhashi et al., Exp Neurol, 1996; Holmes et al., Exp Neurol, 2005). It is possible either that: a) the responses of raphespinal axons to injury fundamentally differ between rodent and primate species, or b) that raphespinal sprouting was already complete by the two week time point post-injury in our primate model. Error bars represent SEM (n = 2 Intact, 4 Short-term, 5 Long-term), dots are individual animals’ data points, asterisks denote significant differences.
S8Nature Neuroscience: doi:10.1038/nn.2691

Subject Behavioral testing EMG recording Corticospinal tracing
1 + + + 2 + + + 3 + - + 4 + - + 5 + + - 6 - - + 7 - - +
Supplementary Table 1: Summary of analyses on Long-term subjects. EMG implants failed in subjects 3 and 4. Efficacy of corticospinal tracing in subject 5 was too low for analysis. Subjects 6 and 7 were restricted a priori to corticospinal tracing and analysis.
Group (N) D-A488 axon density above lesion
Intact (3) 5,500 ± 2,635 Short-term (4) 6,380 ± 1,319 Long-term (6) 8,272 ± 1,012
Supplementary Table 2: Axon densities above lesion. There were no significant differences between groups in the density of D-A488-labeled corticospinal axons at the C5-6 segment above the lesion (p = 0.4; it is possible that study of larger numbers of subjects would show significant differences at this location).
S9Nature Neuroscience: doi:10.1038/nn.2691