route 1 transit study sj292 -...
TRANSCRIPT

1
Route 1 Transit StudySJ292
2
Background – Legislative Action
• Senate Joint Resolution (SJ 292) – 2011 General Assembly Session
Requesting the Department of Rail and Public Transportation to evaluate the level of study necessary to identify and advance potential public transportation services to Fort Belvoir in Fairfax County and the Marine Corps Base at Quantico in Prince William and Stafford Counties

3
Background – Existing Conditions27 miles long from the Capital Beltway (I-495/I-95) to Prince William County/Stafford Line.
Off-Peak Travel Time (via auto)– From Huntington to Fort Belvoir: 20-25 minutes– From Huntington to Quantico: 50-55 minutes
Travel Time (via transit)– Huntington to Fort Belvoir: 20 min. (REX) / 40 min. (Rt. 171)– Huntington to Lorton: 50 minutes (Rt. 171)– Woodbridge VRE to Quantico: 50 minutes
Corridor serves an important north-south link for residents, commuters, transit vehicles, visitors, retail businesses and military installations.
– “Main Street” for local residents (Mount Vernon District /Town of Dumfries)
– Access to Activity Centers – Alternative to Interstate 95 (traffic congestion, accidents,
summer travel)– Fairfax Connector 171– WMATA REX – PRTC Local and Commuter Services
Upcoming BRAC action combined with persistent levels ofextreme congestion on the corridor prompted VirginiaSenator Toddy Puller’s and Delegate Scott Surovell’s Legislative action to conduct a Route 1 Transit Study.
4
Existing Corridor-wide Transit Service
• WMATA – “Rex” Service– King Street Metro to Fort Belvoir Main Post– 12 stops / 12 minute peak and 30 minute off peak period headways– 35-40 mins. from Huntington Metro to Fort Belvoir– Traffic Signal Priority emitter on some buses– Limited intersections outfitted to receive signal– Ridership (May 2011)
• Weekday total 71,386• Average weekday 3,386• Saturday total 7,942• Saturday Average 1,986• Sunday Total 5,237• Sunday Average 873• Monthly total 84,284
• Fairfax Connector– Route 171 (local route)– Huntington Metro to Franconia/Springfield Metro via Fort Belvoir and Lorton– Multiple stops / 30 minute headways– Fall Service Change will terminate route at Lorton VRE
• Currently looking to split the 171 route and terminate at Lorton• Create new route 371 from Lorton to Franconia/Springfield Metro
• PRTC OmniLink– Route 1 (Woodbridge VRE to Quantico)– 55 stops total (28NB, 29SB) / 50-55 minute headways– Route Deviation– Ridership
• FY11 Total Ridership 91,225• Average Daily 355• FY11 Total Saturday Ridership 7648• Saturday Average Daily 153
Note: - WMATA, Fairfax Connector, and PRTC have other bus routes that operate on portions of Route 1- FRED does not provide service to Quantico and there are no plans to provide additional service

5
Existing Conditions
6
Summary of Background Research

7
Studies and Efforts• Route 1 has been the subject of numerous roadway and transit-related
studies and efforts.
– Fairfax County Comprehensive Plan– Mount Vernon District Long-Range Visioning Report– BRAC EIS / BRAC Existing Conditions Report– VDOT Location Study / Corridor Study– Fairfax Connector & PRTC TDP– WMATA Regional Bus Study– Richmond Highway Public Transportation Initiatives– BRT Feasibility Study (Prince William County)– Potomac Communities, Urban Land Use Institute Report– North Woodbridge Study Area Long Range Plan– WMATA US 1 Fort Belvoir to Huntington Metro Rail Station ~ Transit
Improvement Study– Prince William County BRAC Report– NVTC ~ Route 1 Corridor Bus Study 2001
8
Transit Related RecommendationsFairfax County Comprehensive Plan• Implement enhanced transit service along Richmond Highway, such as Metro, Light Rail, Bus Rapid
Transit• Establish transit stations at North Kings Hwy; at Beacon Hill Road; near Fordson Lane; near Mohawk
Lane; near Sacramento; near Railroad line on Fort Belvoir Base; and at Telegraph Road
Fairfax County Transit Development Plan• Modify schedule for Metrobus 11Y Mt. Vernon Express Line trips• Restructure and Improve Metrobus REX service• Increase service and revise routing on Connector 151/152 and 161/162
Prince William County Comprehensive Plan• Identify and develop alternative transit concepts such as bus rapid transit, light rail transit, Potomac
ferry service, Metro Rail extension (Blue Line) to Potomac Mills• Establish a transit center on Belvoir Road at Pence Gate• Extend PRTC’s Route 1 OmniLInk Route from Prince William County to South Post entrance and
improving connections to existing transit centers by extending the Metrobus REX line to Lorton VRE and improve local bus connections to the Franconia-Springfield Station
Prince William County / PRTC BRT Feasibility Study (2011)• Implement two local BRT routes to service the PRTC Transit Center and the Route 1 123 Commuter
Lot as land use and ridership demand increase to support the investment• To offset travel time due to traffic congestion implement queue jump lanes and transit signal priority

9
Transit Related Recommendations Continued
Mount Vernon District Visioning Task Force (2010)• Implement a peak period HOV/bus lane on Richmond Highway• Encourage VDOT to install traffic responsive technology on all of the traffic signals in the Mount
Vernon District
Potomac and Rappahannock Transportation Commission TDPOmniLink – Route 1 Extension to Ft. Belvoir (timeframe 2011 – 2020)• Improve weekday peak period service frequency from 30 minutes to 20 minutes, • Improve weekday midday service frequency from 45 minutes to 30 minutes, • Improve weekday night service frequency from 45 minutes to 30 minutes, • Improve Saturday service frequency from 110 minutes to 60 minutes, and • Add Sunday service at a frequency of 110 minutes
VDOT Centerline Study (2009)• Widen Route 1 from Capital Beltway to the Stafford County line with accommodations for trails and
transit bus pullouts in key locations
10
Transit Related Recommendations Continued
WMATA US 1 Ft. Belvoir to Huntington Metro Station Transit Improvement Study
Three phases of recommendations:Phase one (2003 – 2010)
– Streamline bus service and routes– Add GPS and SmartCard payment technology to buses– Implement signal priority in the corridor for buses– Improve/enhance pedestrian and passenger facilities
Phase two (2010 – 2025)– Implement Bus Rapid Transit
Phase three (2025+)– Implement light rail transit in the corridor as ridership demand and land-use density
and development will support the major capital investment

11
InfrastructureRecommendations
• Widen Route 1 from the Capital Beltway to the Stafford County line with accommodations for trails, right shoulder bus lane pull-offs and shelters at high-demand stops
• Encourage VDOT to install traffic responsive technology on all of traffic signals in the Mount Vernon District
• Procure and Deploy Traffic Signal Priority on Richmond Highway• Improve pedestrian network along the corridor and passenger
experience at bus stops (e.g., shelters)
12
Current Efforts
Transit• Richmond Highway Public Transportation Initiative
– $55 Million Program ($28 M allocated for initiative so far)– Some sidewalk and bus stop improvements completed– Route 1 Transit Center (near Fordson Road) – conceptual study
• Fairfax Connector– Streamline Route 171 to improve overall route performance
• Fort Belvoir Area / Route 1 Transit Study (Fairfax County)– Scoping Underway
Road Improvements• Route 1 Widening from Joplin and Brady’s Hill in Prince William County
(near Quantico)• Route 1/ VA 123 Intersection (Woodbridge)
– Phased Construction due to funding availability

13
Potential “Next Steps” for Transit in the Route 1 Corridor
Near-term• Improve conditions for transit operations and riders
– Conduct necessary study and analysis to implement BRT– Conduct pedestrian facility and shelter assessment and develop
a funding strategy to improve the existing conditions– Focus redevelopment to the corridor
Long-term• Plan for the future:
– Conduct land use analysis and develop a vision for economic development/redevelopment in the corridor
– Feasibility analysis to determine potential for extending metro or implementing light rail
14
Comparable Capital and O&M Costs
Broad Street BRT, 7 miles: $68M Capital$5.4M Annual O&M
The Tide LRT, 7 miles$300+M Capital$15M Annual O&M
Metro Silver Line, 11.6 miles:$2.5B Capital~$50M Annual O&M

15
Federal Funding Programs
Section 5309 provides federal funding for three major project types
New Starts: Large major capital investment that require significant project planning, environmental analysis and ridership forecastingSmall Starts: Smaller projects that may pursue federal
funds with streamlined planning and ridership forecastingVery Small Starts: Very small capital investment
requiring a simplified planning process and project criteria
16
New Starts vs. Small Starts
New Starts Small Starts and Very Small Starts
Alternatives Alternatives AnalysisAnalysis
Preliminary Preliminary EngineeringEngineering
Final DesignFinal Design
ConstructionConstruction
Service BeginsService Begins
Environmental Environmental AnalysisAnalysis
Alternatives Alternatives AnalysisAnalysis
Project Project DevelopmentDevelopment
ConstructionConstruction
Service BeginsService Begins
Environmental Environmental AnalysisAnalysis
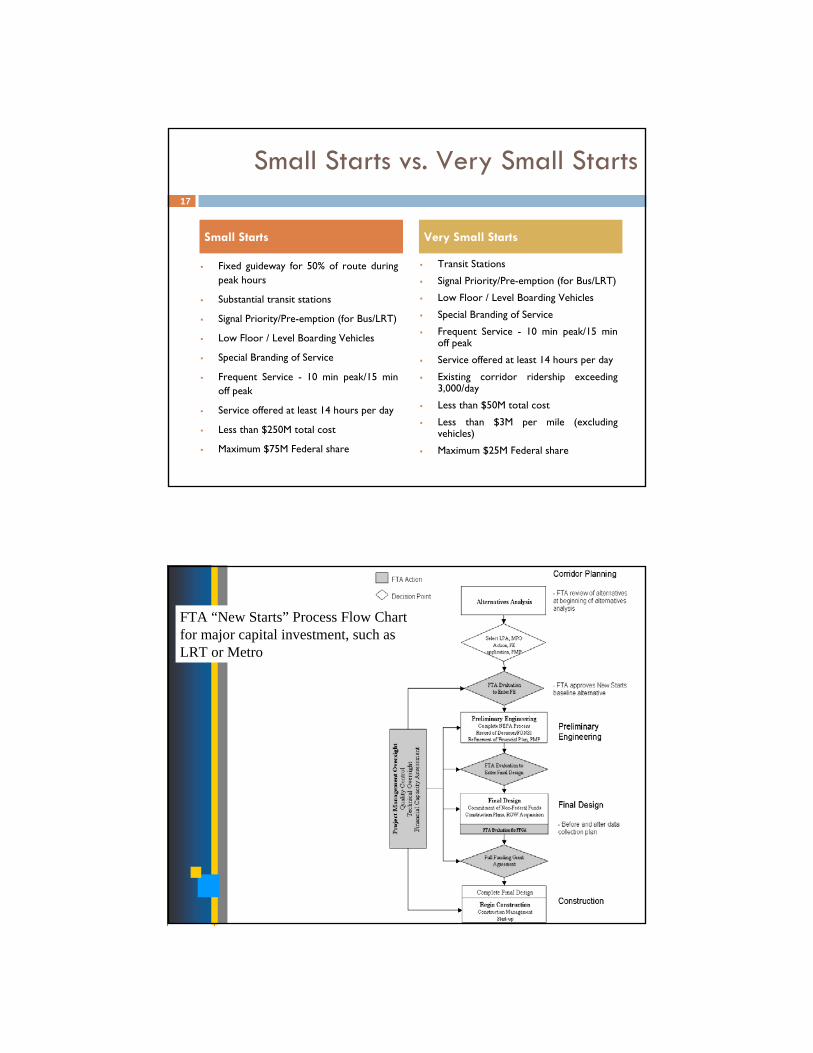
17
Small Starts vs. Very Small Starts
Transit Stations
Signal Priority/Pre-emption (for Bus/LRT)
Low Floor / Level Boarding Vehicles
Special Branding of Service
Frequent Service - 10 min peak/15 min off peak
Service offered at least 14 hours per day
Existing corridor ridership exceeding 3,000/day
Less than $50M total cost
Less than $3M per mile (excluding vehicles)
Maximum $25M Federal share
Small Starts Very Small Starts
Fixed guideway for 50% of route during peak hours
Substantial transit stations
Signal Priority/Pre-emption (for Bus/LRT)
Low Floor / Level Boarding Vehicles
Special Branding of Service
Frequent Service - 10 min peak/15 min off peak
Service offered at least 14 hours per day
Less than $250M total cost
Maximum $75M Federal share
FTA “New Starts” Process Flow Chartfor major capital investment, such asLRT or Metro
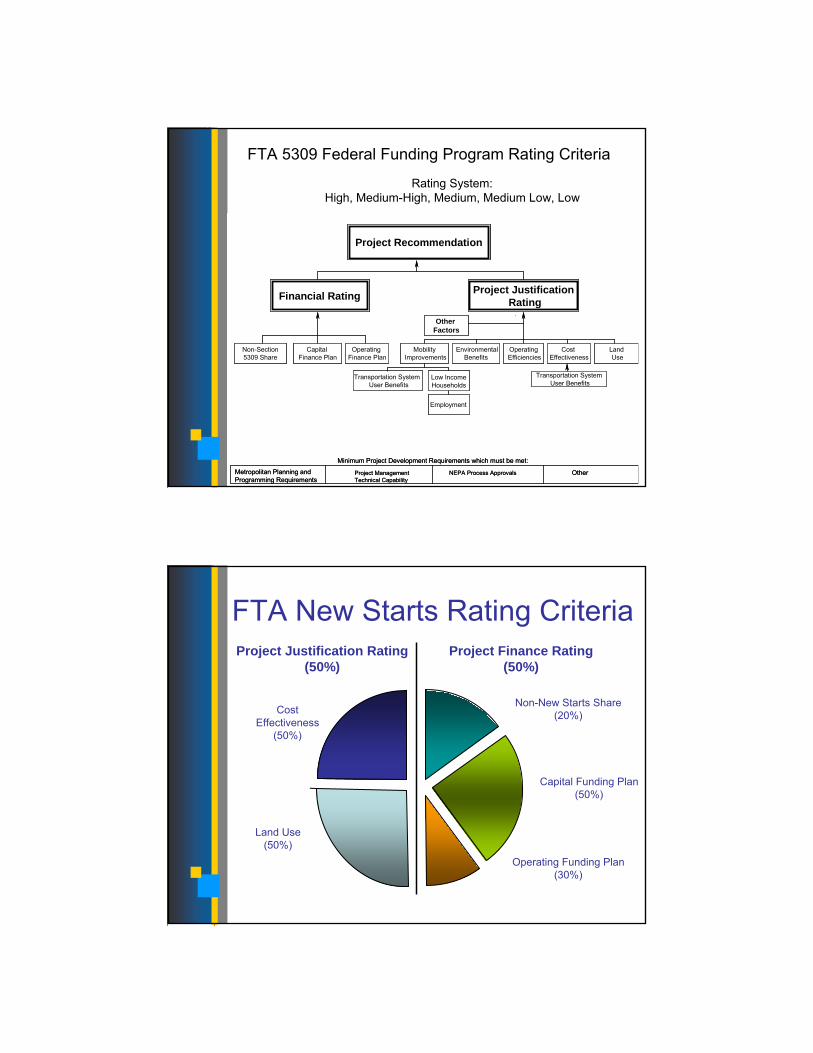
Project Recommendation
Project JustificationRatingFinancial Rating
Non-Section5309 Share
Capital Finance Plan
Operating Finance Plan
Other Factors
Low IncomeHouseholds
Transportation System User Benefits
MobilityImprovements
Environmental Benefits
OperatingEfficiencies
Cost Effectiveness
LandUse
Metropolitan Planning and Programming Requirements
NEPA Process ApprovalsProject Management Technical Capability
Other
Minimum Project Development Requirements which must be met:
Transportation SystemUser Benefits
Employment
FTA 5309 Federal Funding Program Rating Criteria
Rating System:High, Medium-High, Medium, Medium Low, Low
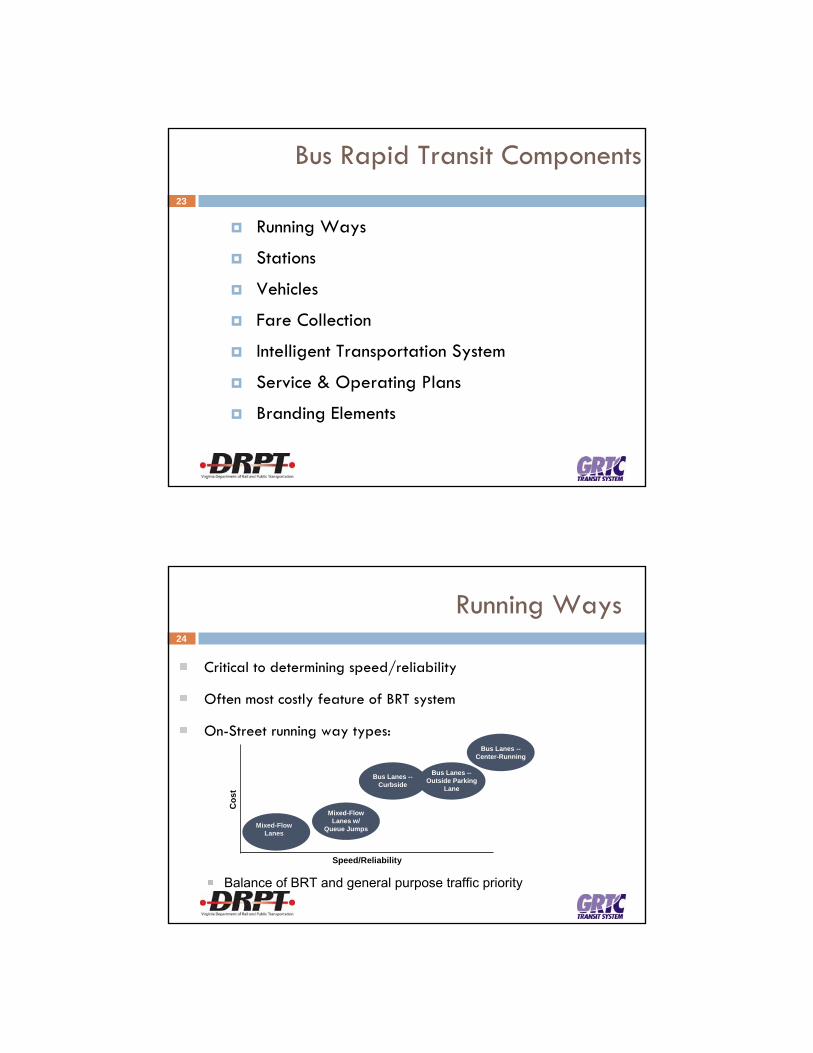
FTA New Starts Rating CriteriaProject Justification Rating
(50%)Project Finance Rating
(50%)
CostEffectiveness
(50%)
Land Use(50%)
Non-New Starts Share(20%)
Capital Funding Plan(50%)
Operating Funding Plan(30%)

Reasons for Land Use Study
Encourage economic development intransit corridors• Mobility benefits• Economic benefits• Health benefits
Transit-Oriented Development
Ridership
System Expansion
Accessibility to Jobs and Workers
Land Values
Congestion Relief
Reduced Urban
Expansion
Economic Development
Neighborhood Revitalization
22
Definition of Bus Rapid Transit
A form of transit using a combination of services, facilities, and branding to provide premium level of serviceTwo main objectives• Provide travel times comparable to rail• Provide a travel experience comparable to rail
23
Bus Rapid Transit Components
Running Ways
Stations
Vehicles
Fare Collection
Intelligent Transportation System
Service & Operating Plans
Branding Elements
24
Running Ways
Critical to determining speed/reliability
Often most costly feature of BRT system
On-Street running way types:
Balance of BRT and general purpose traffic priority
Speed/Reliability
Cos
t
Mixed-FlowLanes
Mixed-FlowLanes w/
Queue Jumps
Bus Lanes --Curbside
Bus Lanes --Outside Parking
Lane
Bus Lanes --Center-Running

25
Running Way Types
Side-runningBoston Silver Line
Center RunningRouen, France
Dedicated BuswayOttawa, Canada
26
Running Way Features
Running way markings distinguish running way
Signs &PavementMarkings
(FTA Requirement)
Raised LaneDelineators
Pavement Color
& Material
Running way guidance: higher speeds, precision docking
Curb Guidance Optical Guidance

27
Running Way Features
Lane Delineators Pavement Markings and Material
28
Station Examples
Los AngelesOrlando Lymmo

29
Station Examples
Boston Silver Line Brisbane, Australia
York, Ontario
30
Vehicles
Symbol of the system
Impacts to speed, capacity, environment, and comfort
Conventional Standard
Stylized Standard
Stylized Articulated(partial low-floor)
Stylized Articulated(full low-floor)
Conventional Articulated
31
Vehicles
York, Ontario Las Vegas
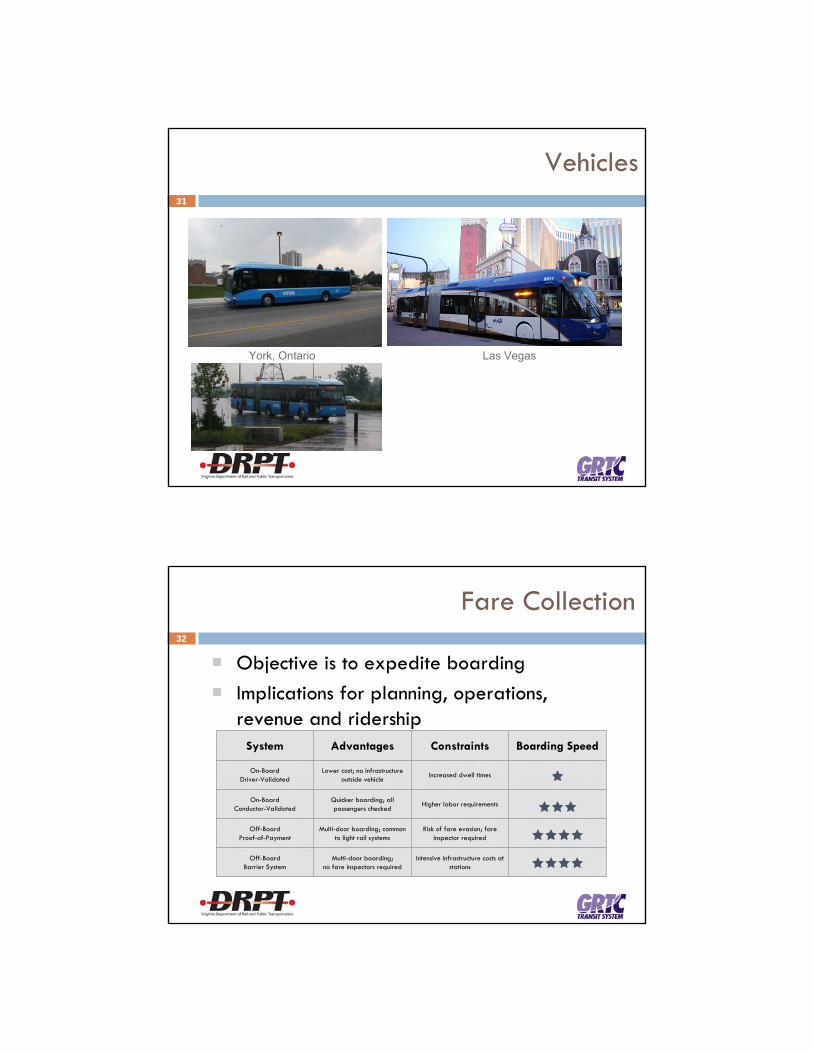
32
Fare Collection
Objective is to expedite boardingImplications for planning, operations, revenue and ridership
System Advantages Constraints Boarding Speed
On-BoardDriver-Validated
Lower cost; no infrastructure outside vehicle
Increased dwell times
On-BoardConductor-Validated
Quicker boarding; all passengers checked
Higher labor requirements
Off-BoardProof-of-Payment
Multi-door boarding; common to light rail systems
Risk of fare evasion; fare inspector required
Off-BoardBarrier System
Multi-door boarding;no fare inspectors required
Intensive infrastructure costs at stations

33
Intelligent Transportation System
Transit Signal Priority (TSP)‣ Critical ITS technology
SafetyEfficiencyReliability
Two common types: early green & green extension
TSP ≠ Signal Preemption
FTA requires signal timing optimization for BRT
34
Branding
Communicates BRT system attributes and performanceReinforce impression of premium service
VIVA OntarioOrlando Lymmo
35
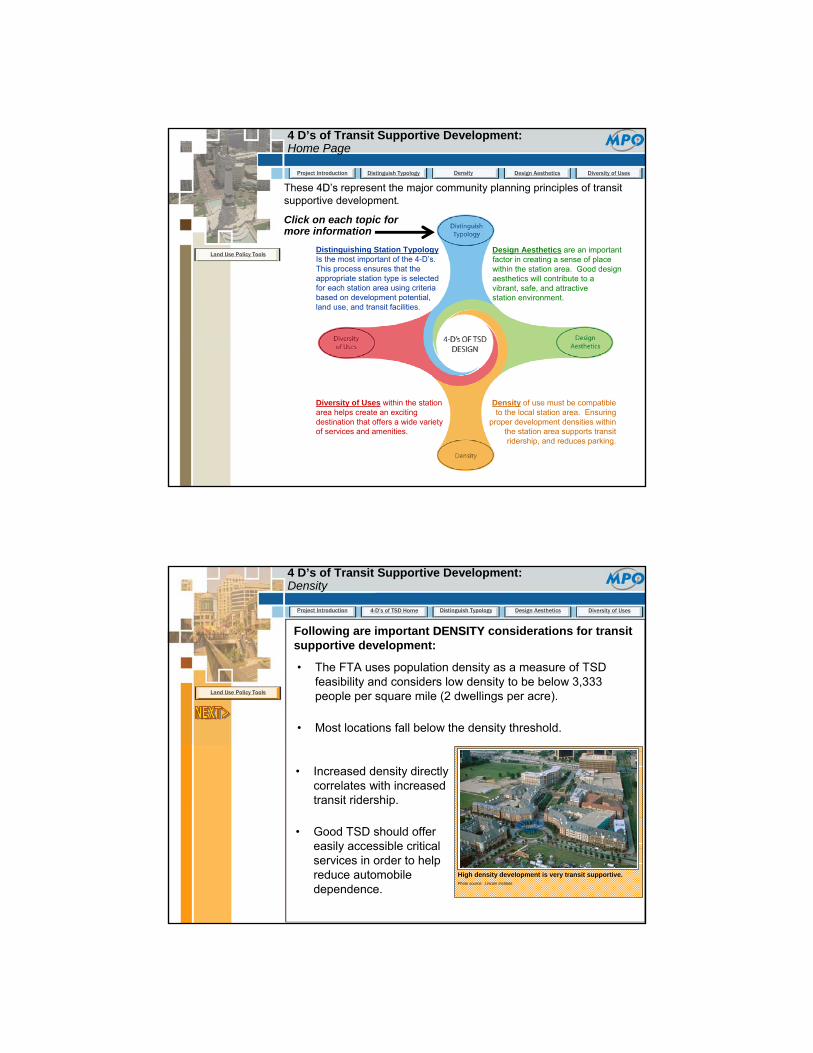
4 D’s of Transit Supportive Development:Home Page
These 4D4D’’ss represent the major community planning principles of transit supportive development.
Click on each topic for more information
Project Introduction Distinguish Typology Density Design Aesthetics Diversity of Uses
Land Use Policy ToolsDistinguishing Station TypologyIs the most important of the 4-D’s. This process ensures that the appropriate station type is selected for each station area using criteria based on development potential, land use, and transit facilities.
Design Aesthetics are an important factor in creating a sense of place within the station area. Good design aesthetics will contribute to a vibrant, safe, and attractive station environment.
Density of use must be compatible to the local station area. Ensuring
proper development densities within the station area supports transit ridership, and reduces parking.
Diversity of Uses within the station area helps create an exciting destination that offers a wide variety of services and amenities.
36
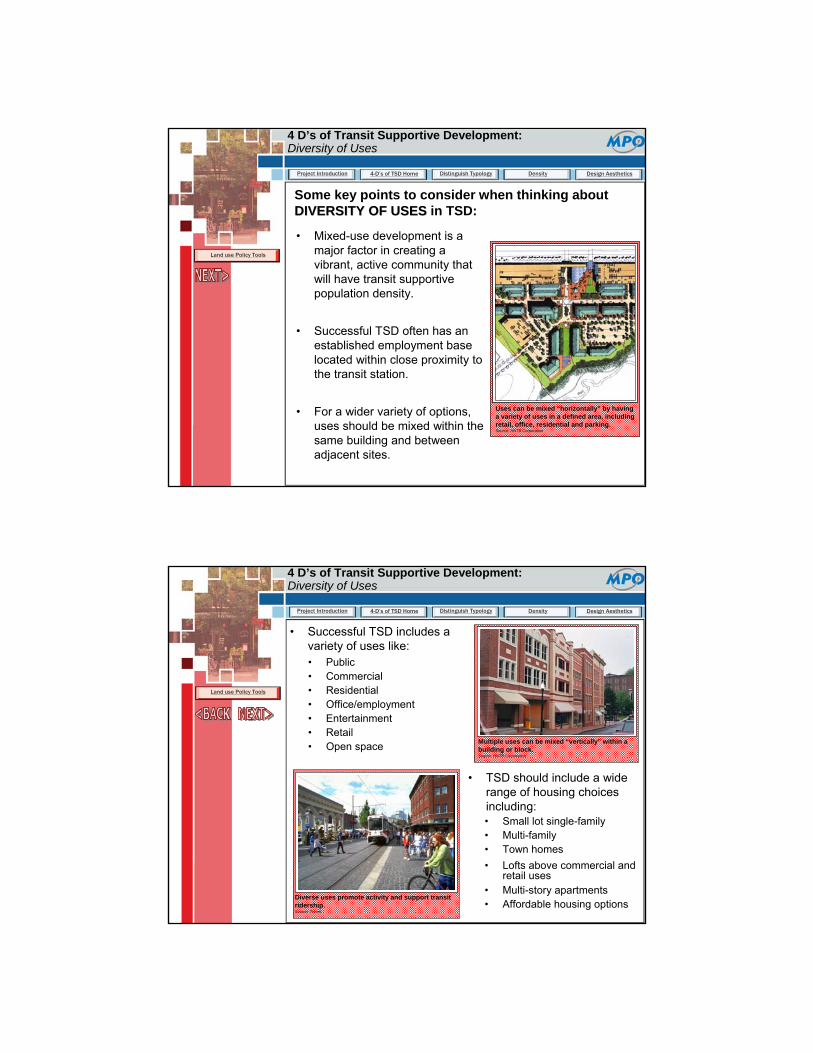
4 D’s of Transit Supportive Development:Density
• The FTA uses population density as a measure of TSD feasibility and considers low density to be below 3,333 people per square mile (2 dwellings per acre).
• Most locations fall below the density threshold.
Following are important DENSITYDENSITY considerations for transit supportive development:
• Increased density directly correlates with increased transit ridership.
• Good TSD should offer easily accessible critical services in order to help reduce automobile dependence.
4-D’s of TSD Home Distinguish Typology Design Aesthetics Diversity of UsesProject Introduction
Land Use Policy Tools
High density development is very transit supportive.Photo source: Lincoln Institute

37
4 D’s of Transit Supportive Development:Density
2 dwellings per acre or less is considered “low” densitySource: FTA and Lincoln Institute
At least 4 dwellings per acre is considered “medium” densitySource: FTA and Lincoln Institute
• Using structured parking increases density by increasing the availability of developable land.
• Compact building design and infill development strategies are both ways to help increase density.
• Highest density development should be placed nearest transit stations.
4-D’s of TSD Home Distinguish Typology Design Aesthetics Diversity of UsesProject Introduction
Land Use Policy Tools
38
4 D’s of Transit Supportive Development:Design Aesthetics
Some AESTHETICAESTHETIC treatment considerations for TSD are:• Use well crafted design guidelines
and building standards to create a unique sense of place.
• Scale the size and variety of the development to fit the needs of the local community
4-D’s of TSD Home Distinguish Typology Density Diversity of UsesProject Introduction
Land use Policy Tools
Design aesthetics are an important factor in creating a sense of place
• Define community character with coordinated visual treatments like:
• Streetscape elements unique to the development• Unique street signage• Way finding elements designed specifically for the TSD• Landscape treatments unique to the TSD• Varied architectural style and building height• Unique entry monuments

39
4 D’s of Transit Supportive Development:Design Aesthetics
• Create prototypical design examples to exhibit the desired community look.
4-D’s of TSD Home Distinguish Typology Density Diversity of UsesProject Introduction
Land use Policy Tools
• Provide for easy pedestrian access by considering the following:
• A network of interconnected trails and pathways• Place storefront development close to the street• Reduce required walking distances by providing direct
pedestrian shortcuts throughout the development • Match the building scale to suit the pedestrian environment
Station aesthetics are an integral part of the TSD design process Graphic source: HNTB
Multi-use pathways help enhance pedestrian access and aesthetic qualityPhoto source: Nashville.gov
40
4 D’s of Transit Supportive Development:Design Aesthetics
• Reduce the impacts of automobile traffic by considering the following:
• Limit or eliminate off-street parking
• Place off-street parking facilities behind buildings and at the edges of the community
• Provide structured parking facilities instead of surface parking
• Limit automobile access to the outer edges of the development
• Include traffic calming devices along street corridors
Building color, texture, and spacing are all important aesthetic considerationsPhoto source: wikimedia.org
Good TSD design provides a vibrant, well lit atmospherePhoto source: transitgallery.com
4-D’s of TSD Home Distinguish Typology Density Diversity of UsesProject Introduction
Land use Policy Tools
41
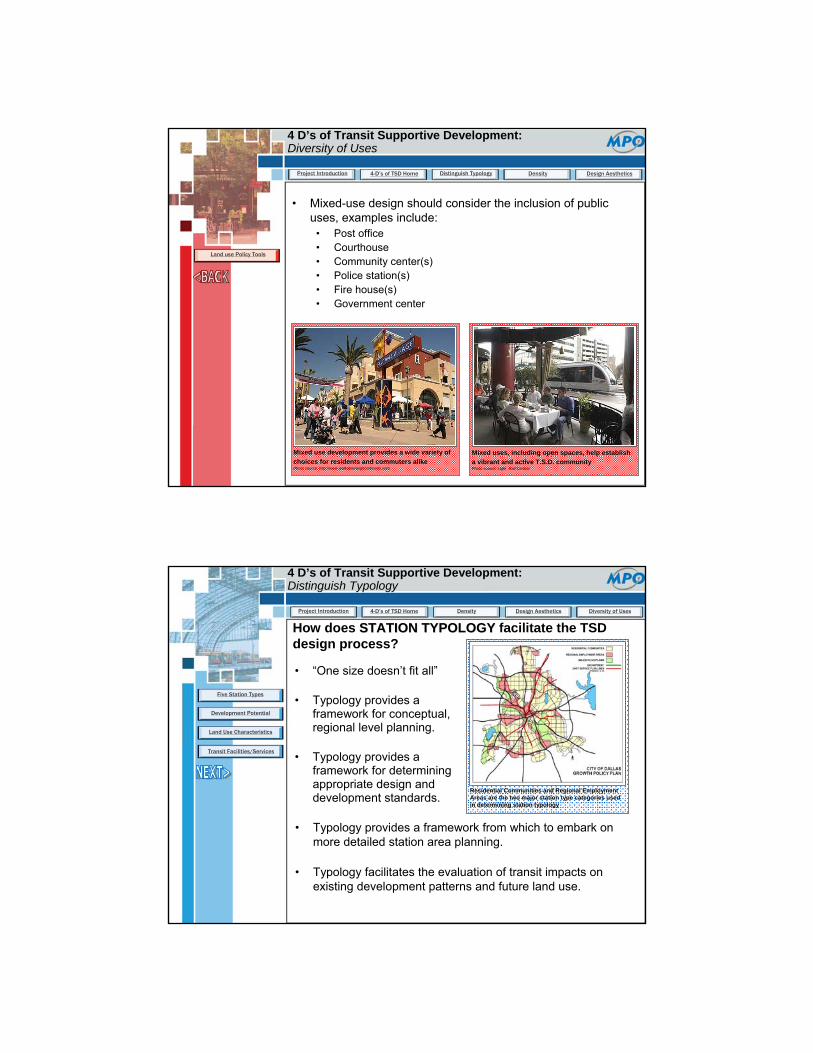
4 D’s of Transit Supportive Development:Diversity of Uses
Uses can be mixed “horizontally” by having a variety of uses in a defined area, including retail, office, residential and parking.Source: HNTB Corporation
• Mixed-use development is a major factor in creating a vibrant, active community that will have transit supportive population density.
• Successful TSD often has an established employment base located within close proximity to the transit station.
• For a wider variety of options, uses should be mixed within the same building and between adjacent sites.
Some key points to consider when thinking about DIVERSITY OF USESDIVERSITY OF USES in TSD:
4-D’s of TSD Home Distinguish Typology Density Design AestheticsProject Introduction
Land use Policy Tools
42
• Public • Commercial • Residential • Office/employment • Entertainment• Retail• Open space
4 D’s of Transit Supportive Development:Diversity of Uses
• Small lot single-family• Multi-family• Town homes• Lofts above commercial and
retail uses• Multi-story apartments• Affordable housing options
Multiple uses can be mixed “vertically” within a building or block.Source: HNTB Corporation
• TSD should include a wide range of housing choices including:
• Successful TSD includes a variety of uses like:
4-D’s of TSD Home Distinguish Typology Density Design AestheticsProject Introduction
Land use Policy Tools
Diverse uses promote activity and support transit ridership.Source: Trimet
43
• Mixed-use design should consider the inclusion of public uses, examples include:
• Post office• Courthouse• Community center(s)• Police station(s)• Fire house(s)• Government center
4 D’s of Transit Supportive Development:Diversity of Uses
Mixed use development provides a wide variety of choices for residents and commuters alikePhoto source: http://www.walkableneighborhoods.com
Mixed uses, including open spaces, help establish a vibrant and active T.S.D. communityPhoto source: Light Rail Central
4-D’s of TSD Home Distinguish Typology Density Design AestheticsProject Introduction
Land use Policy Tools
44
4 D’s of Transit Supportive Development:Distinguish Typology
• “One size doesn’t fit all”
• Typology provides a framework for conceptual, regional level planning.
• Typology provides a framework for determining appropriate design and development standards.
How does STATION TYPOLOGYSTATION TYPOLOGY facilitate the TSD design process?
• Typology provides a framework from which to embark on more detailed station area planning.
• Typology facilitates the evaluation of transit impacts on existing development patterns and future land use.
Density Design Aesthetics Diversity of Uses
Five Station Types
Development Potential
Land Use Characteristics
Transit Facilities/Services
4-D’s of TSD HomeProject Introduction
Residential Communities and Regional Employment Areas are the two major station type categories used in determining station typology
45
Distinguish Typology:5 Station Area Types
Distinguish Typology Home
Development Potential
Land Use Characteristics
Transit Facilities/Services
Density Design Aesthetics Diversity of Uses4-D’s of TSD HomeProject Introduction
46
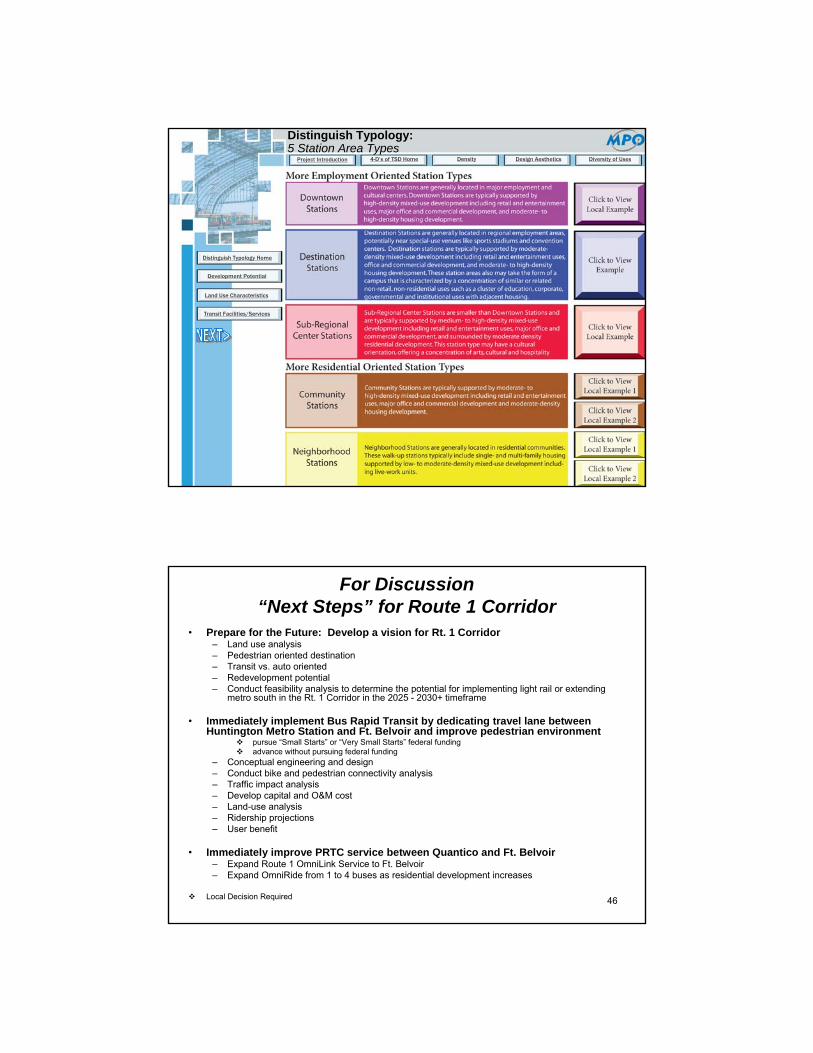
For Discussion“Next Steps” for Route 1 Corridor
• Prepare for the Future: Develop a vision for Rt. 1 Corridor– Land use analysis– Pedestrian oriented destination– Transit vs. auto oriented– Redevelopment potential– Conduct feasibility analysis to determine the potential for implementing light rail or extending
metro south in the Rt. 1 Corridor in the 2025 - 2030+ timeframe
• Immediately implement Bus Rapid Transit by dedicating travel lane between Huntington Metro Station and Ft. Belvoir and improve pedestrian environment
pursue “Small Starts” or “Very Small Starts” federal fundingadvance without pursuing federal funding
– Conceptual engineering and design – Conduct bike and pedestrian connectivity analysis– Traffic impact analysis– Develop capital and O&M cost – Land-use analysis– Ridership projections– User benefit
• Immediately improve PRTC service between Quantico and Ft. Belvoir– Expand Route 1 OmniLink Service to Ft. Belvoir – Expand OmniRide from 1 to 4 buses as residential development increases
Local Decision Required
47
Discussion