routine turtle and dugong monitoring program report ...€¦ · routine turtle and dugong...
TRANSCRIPT

Routine Turtle and Dugong Monitoring Program Report – Dredging Report 3
Ichthys Nearshore Environmental Monitoring Program L384-AW-REP-10247
Prepared for INPEX November 2013
Routine Turtle and Dugong Monitoring Program Report – Dredging Report 3
Ichthys Nearshore Environmental Monitoring Program L384-AW-REP-10247

Routine Turtle and Dugong Monitoring Program Report – Dredging Report 3 Ichthys Nearshore Environmental Monitoring Program
Prepared for INPEX Cardno Page ii
Document Information Prepared for INPEX Project Name Ichthys Nearshore Environmental Monitoring Program File Reference L384-AW-REP-10247_0_Turtle and Dugong Monitoring Dredging Report 3.docm Job Reference L384-AW-REP-10247 Date November 2013
Contact Information Cardno (NSW/ACT) Pty Ltd Cardno (WA) Pty Ltd Cardno (NT) Pty Ltd Level 9, The Forum 11 Harvest Terrace Level 6, 93 Mitchell Street 203 Pacific Highway West Perth WA 6005 Darwin NT 0800 St Leonards NSW 2065 Telephone: 02 9496 7700 Telephone: 08 9273 3888 Telephone: 08 8942 8200 Facsimile: 02 9499 3902 Facsimile: 08 9486 8664 Facsimile: 08 8942 8211 International: +61 2 9496 7700 International: +61 8 9273 3888 International: +61 8 8942 8211 www.cardno.com.au www.cardno.com.au www.cardno.com.au
Document Control Version Date Author Author
Initials Reviewer Reviewer
Initials
A 10/10/2013 Michelle Blewitt Megan Rice Lachlan Barnes
MLB MR LB
Will Macbeth WM
B 31/10/2013 Michelle Blewitt MLB Will Macbeth Craig Blount Joanna Lamb
WM CB JL
0 13/11/2013 Michelle Blewitt Megan Rice
MLB MR
Joanna Lamb JL
This document is produced by Cardno solely for the benefit and use by the client in accordance with the terms of the engagement for the performance of the Services. Cardno does not and shall not assume any responsibility or liability whatsoever to any third party arising out of any use or reliance by any third party on the content of this document.

Routine Turtle and Dugong Monitoring Program Report – Dredging Report 3 Ichthys Nearshore Environmental Monitoring Program
Prepared for INPEX Cardno Page iii
Executive Summary The Turtle and Dugong Monitoring Program (TDMP) has been developed to monitor the abundance and distribution of turtles and dugongs in waters around Darwin during dredging and spoil disposal activities associated with the Ichthys Gas Field Development Project (the Project). The TDMP incorporates aerial and land-based survey techniques to estimate and monitor turtle and dugong populations in Darwin Harbour and surrounding inshore waters. Finer-scale aspects of abundance and distribution of dugongs and turtles within Darwin Harbour in relation to potential habitat use are also assessed.
This report outlines the findings of the second during dredging survey (D3), undertaken between 27 July 2013 and 11 August 2013 and approximately eight months after the commencement of Cutter Suction Dredger (CSD) operations on 4 November 2012. It should be noted that the third and final Baseline survey (B3), completed in October 2012 and initially designated as Dredging survey 1 (D1), was undertaken after the commencement of the Backhoe Dredger (BHD) operations, but prior to the start of CSD operations. During B3, sediment plumes from BHD operations were minimal and localised to a very small area and, as such, it was considered part of the Baseline Phase despite its initial designation. The first ‘during dredging’ survey, which was designated as Dredging survey 2 (D2), was undertaken in May 2013, while the second during dredging survey which is outlined in this report was designated as Dredging survey 3 (D3).
Data collected via standardised aerial transects during D3 has enabled a comparison of turtle and dugong sightings, population estimates and density at three locations (or blocks) – Bynoe Harbour (Control location 1 - C1), Darwin Harbour/Hope Inlet region (Impact location - IM), and the Vernon Islands and Melville Island (Control location 2 - C2) – with data collected prior to the initiation of CSD activities (Baseline Phase). During D3, each block was further sub-divided into sections relating to habitat and bathymetry. The addition of land observations during the Dredging Phase has enabled examination of alternate observational methods to identify finer-scale turtle and dugong habitat associations at two locations within Darwin Harbour.
During D3, an average of 1,322 km of linear transect was flown during aerial surveys, equating to an average survey area of approximately 547 km2 over an approximate 23 hour flying period. The overall monitoring area (i.e. area within the total transect boundaries) during D3 equated to 2,850.5 km2 across all three blocks. Fewer dugongs were sighted during D3 (71 individuals), compared to the average observed per survey throughout the Baseline Phase (88 individuals). Based on raw sighting data, the mean number of dugongs (± SE) sighted per flight within each block during D3 (C1 = 6.3 ± 1.2, IM = 13.0 ± 2.1, C2 = 4.3 ± 0.3; n = 3 flights) were lower than the corresponding averages for the Baseline Phase (C1 = 7.0, IM = 16.6, C2 = 9.3), particularly in the case of C2. Similarly, the means for D3 were also lower than those recorded during B2 at the same time period last year (C1 = 7.0 ± 4.5, IM = 14.3 ± 8.3, C2 = 9.3 ± 5.8). Dugong population estimates (± SE) during D3, derived from the Marsh and Sinclair (1989) and Pollock et al. (2006) methods, were 134 ± 58 and 48 ± 12 in C1, respectively, and 316 ± 121 and 167 ± 39 in IM, respectively. No population estimates could be calculated for C2 as there were too few dugong sightings per replicate flight. These D3 estimates were generally lower than the average of survey estimates recorded during the Baseline Phase for C1 (190 ± 103 SE and 167 ± 168 SE) and IM (359 ± 154 SE and 231 ± 138 SE). The relatively high variability among replicate population estimates for all surveys may have been as a result of the inherent behaviour of dugongs (i.e. highly mobile and constantly submerging), migration or seagrass seasonality, as well as variable environmental conditions experienced during aerial surveys, such as fluctuating sea states and high turbidity.
During D3, no dugongs were observed in Darwin Harbour Inner, while at the same time of year during the Baseline Phase surveys (i.e. B2) some (n=18) dugongs were sighted around Blaydin Point, Channel Island and other areas around the inner harbour. The greatest density of dugong sightings during D3 in IM was again within the Shoal Bay and Lee Point areas, similar to other surveys. More recent seagrass mapping completed within Shoal Bay has recorded Halophila decipiens, which is a preferred diet of dugongs, in the area. Given that an observed relationship between the distribution of dugongs and H. decipiens was also noted during the Baseline Phase and D2, the presence, distribution, density and species composition of seagrass habitats is significant.
Five hundred and twenty nine turtles were sighted in D3 in comparison to an average of 598 turtles recorded during the Baseline Phase. The mean numbers of turtle sightings per replicate flight (± SE) within survey

Routine Turtle and Dugong Monitoring Program Report – Dredging Report 3 Ichthys Nearshore Environmental Monitoring Program
Prepared for INPEX Cardno Page iv
blocks during D3 (C1 = 58 ± 0.3, IM = 54 ± 2.0, C2 = 64 ± 10.4) were lower than the means of those recorded across Baseline Phase surveys (C1 = 65 ± 12.3, IM = 86 ± 14.4, C2 = 87 ± 13.6) and in the case of IM, lower than that reported at the same time last year during the second Baseline Phase survey (B2) (69 ± 8.5). In contrast, mean numbers of turtles were similar between D3 and B2 for blocks C1 (62 ± 20.7 in B2) and C2 (64 ± 7.6 in B2).
The density of sighted turtles during D3 was at least 0.2 turtles per km2 higher or lower than the mean of Baseline Phase densities in 24% and 61% of IM grid cells, respectively. A relatively small change (between -0.2 and 0.2 turtles per km2) was observed for 14% of IM grid cells. No turtles were sighted in approximately 2% of IM during D3, the Baseline Phase, or both. In comparison with B2 (July 2012), D3 densities were 0.2 turtles per km2 higher in 12% of IM grid cells and lower in 23.3% of IM grid cells, with little change or no turtles recorded for the remaining cells. Similarly to dugongs, while a number of turtles were sighted within the Upper East Arm of Darwin Harbour during the Baseline Phase surveys (B2), there was a relative decrease in turtle sightings in that area during D3. Similar decreases were also evident for other areas outside the inner harbour, such as around Shoal Bay.
Temporal and spatial variation in dugong and turtle distribution and abundance may be a result of movement in and out of specific areas, possibly due to avoidance behaviour and/or the pursuit of more optimal foraging areas. Further surveys have the potential to provide greater insight into the ongoing use of these areas by turtles within Darwin Harbour and surrounding regions.
Aerial survey blocks were further partitioned into non-overlapping sub-blocks comprised of relatively homogeneous characteristics (i.e. habitat type and depth profile), with the aim of reducing imprecision associated with block population estimates. Variances associated with dugong block population estimates derived via sub-blocks were similar to those derived from whole block estimates regardless of the population estimation method used. Conversely, the non-uniform distribution and abundance of turtles within blocks facilitated an observed reduction in variance associated with estimated population sizes based on sub-blocks compared to whole block population estimates. If the distribution of turtles remains non-uniform during future surveys, combining sub-block population estimates may prove beneficial in improving precision associated with turtle block population estimates.
Land observations during D3 were completed at Channel Island and Cullen Bay, which have been previously recognised as ‘hotspots’ for marine megafaunal sightings. At Channel Island, 280 turtles were sighted, with 95% of these turtles confirmed as green turtles and mostly juveniles. No dolphins or dugongs were observed from Channel Island Bridge during D3. It is recognised that Channel Island provides important habitat and foraging grounds for turtles, and possibly also for dugongs and inshore delphinids despite the lack of sightings. Reef and foraging grounds extend below the observation platform (bridge) bringing turtles closer to observers and increasing the potential for observers to detect and identify turtle species.
In contrast, at Cullen Bay no turtles were sighted during D3, while one dugong was sighted off the rock wall. Dugongs recorded at Cullen Bay during the Dredging Phase surveys were sighted close to a high-confidence seagrass habitat (Geo Oceans 2013a), and were displaying long dive times suggesting possible foraging behaviour.
Since the commencement of the Project, ten turtles have been taken to the Arafura Timor Research Facility or Department of Land Resource Management (DLRM) for rehabilitation. No satellite tagging of these turtles was undertaken by Cardno due to their unsuitability. Reasons included the small number of targeted species rehabilitated to date and the nature of injuries preventing effective tagging.

Routine Turtle and Dugong Monitoring Program Report – Dredging Report 3 Ichthys Nearshore Environmental Monitoring Program
Prepared for INPEX Cardno Page v
Glossary
Term or Acronym Definition
Availability bias A bias in the data affected by an animal being concealed by an environmental factor so that is not visible to the observer
ACF Availability Correction Factor
B1 Baseline survey 1: 1 June 2012 to 8 June 2012 (2 replicate flights)
B2 Baseline survey 2: 18 July 2012 to 5 August 2012 (3 replicate flights)
B3 Baseline survey 3: 30 September 2012 to 21 October 2012 (3 replicate flights)
BACI Before, After, Control, Impact
BHD Backhoe Dredger
BSS
Beaufort Sea State is an empirical measure (0 to 12) for the intensity of the wind based mainly on sea-state or wave conditions with 0 refering to calm, mirror like seas and 12 refers to hurricane conditions
C1 Control block 1 (Bynoe Harbour)
C2 Control block 2 (Vernon Islands to Melville Island)
CI Confidence Interval
CL Condifence Level
CSD Cutter Suction Dredger
CV Coefficient of Variation is used to compare the standard deviations between populations with different means and it provides a measure of variation that is independent of the measurement units
D1 Completed during Bachhoe Dredger (BHD) operations only where impacts are considered minimal and thus D1 survey is referred to as Baseline survey 3 (B3)
D2 Dredging survey 2: 11 May 2013 to 26 May 2013 (3 replicate flights)
D3 Dredging survey 3: 27 July 2013 to 11 August 2013 (2-3 replicate flights)
Double platform
A sampling method using two observers to sample a given species in the same area at the same time. The two observers must be independent of each other and isolated visually and acoustically. On aerial surveys, the two observers are normally arranged as a front and rear observer

Routine Turtle and Dugong Monitoring Program Report – Dredging Report 3 Ichthys Nearshore Environmental Monitoring Program
Prepared for INPEX Cardno Page vi
Term or Acronym Definition
DLPE Department of Lands, Planning and the Environment
DLRM Department of Land Resource Management
DSDMP Dredging and Spoil Disposal Management Plan – East Arm
EBPC Act The Commonwealth Environment Protection and Biodiversity Conservation Act (1999)
GEP Gas export pipeline
GIS Geographic Information System
Group size Mean group size of a group of dugongs or turtles observed during aerial surveys
h Hour/s
HSE Health Safety Environment
IM Impact block (Darwin Harbour/Hope Inlet to Gunn Point)
IPDEP Ichthys Project Dredging Expert Panel
km/h Kilometres per hour
kn Knots: Nautical miles per hour
LAT Lowest Astronomical Tide
MSL Mean Sea Level
min Minute/s
MNES Matter of National Environmental Significance
n Sample size
NEMP Ichthys Project Nearshore Environmental Monitoring Plan
NT Northern Territory
NTC National Tidal Centre
Paj Probability of availability which is used for population estimates
PB Port observers - both front and rear
PCF Perception Correction Factor
PERMANOVA Permutational Analysis of Variance
Perception bias A bias in the data caused by an observer not seeing an animal despite it being visible

Routine Turtle and Dugong Monitoring Program Report – Dredging Report 3 Ichthys Nearshore Environmental Monitoring Program
Prepared for INPEX Cardno Page vii
Term or Acronym Definition
PF Port observer - front only
Population estimate An estimate of the number of individual animals living in one place at the one time
p-perm Equivalent to the traditional p-value but derived from a permutational analyses (PERMANOVA)
PR Port observer - rear only
QA/QC Quality Assurance/Quality Control
Recapture The event of one individual or group of animals being counted (and thus recorded) a subsequent time, usually by the rear observer during aerial surveys
SB Starboard observers - both front and back observers
SE Standard error of the mean
SF Starboard observer - front only
SR Starboard observer - rear only
TDMP Turtle and Dugong Monitoring Program
Turbidity Turbidity gives an indication of water clarity

Routine Turtle and Dugong Monitoring Program Report – Dredging Report 3 Ichthys Nearshore Environmental Monitoring Program
Prepared for INPEX Cardno Page viii
Table of Contents Executive Summary iii Glossary v
1 Introduction 1 1.1 Overview 1 1.2 Background 1 1.3 Aims and Objectives 1
2 Methodology 2 2.1 Monitoring of Rehabilitated Turtles 2 2.2 Field Monitoring Schedule 2 2.3 Field Sampling Locations 5
2.3.1 Aerial Surveys 5 2.3.2 Land Surveys 5
2.4 Field Methods 8 2.4.1 Aerial Surveys 8 2.4.2 Land Surveys 8
2.5 Data Analysis 9 2.5.1 Aerial Surveys 9 2.5.2 Land Surveys 10
2.6 Assumptions and Constraints 11 2.6.1 Aerial Surveys 11 2.6.2 Land Surveys 11
2.7 Quality Assurance and Quality Control 11 3 Results 12
3.1 Aerial Surveys 12 3.1.1 Survey Effort 12 3.1.2 Dugongs 12 3.1.3 Turtles 31
3.2 Land Surveys 49 3.2.1 Survey Effort 49 3.2.2 Channel Island Bridge 49 3.2.3 Cullen Bay Rock Wall 49
3.3 Rehabilitated Turtle Update 52 3.4 Quality Assurance and Quality Control 52
4 Discussion 53 4.1 Aerial Surveys 53
4.1.1 Dugongs 53 4.1.2 Turtles 54 4.1.3 Block vs. sub-block population and variance estimates 55
4.2 Land Surveys 55 4.3 Rehabilitated Turtle Update 55
5 Conclusions 56
6 Acknowledgements 57
7 References 58

Routine Turtle and Dugong Monitoring Program Report – Dredging Report 3 Ichthys Nearshore Environmental Monitoring Program
Prepared for INPEX Cardno Page ix
Tables Table 2-1 Monitoring schedule for the TDMP 3 Table 3-1 Details of group size estimates and correction factors used in dugong population estimates for
D3 (July 2013) aerial surveys (based on Marsh and Sinclair (1989) method) 22 Table 3-2 Sighting histories for dugong groups sighted during D3 aerial surveys in July 2013 by (a)
individual observers for each replicate flight; and (b) all combined* 23 Table 3-3 Comparison of dugong population estimates for each block during D3 and the Baseline Phase
based on Marsh and Sinclair (1989) and Pollock et al. (2006) 23 Table 3-4 Results of univariate PERMANOVA testing for differences in the density of dugongs per km2
based on raw sightings 27 Table 3-5 Dugong population estimates for each sub-block during D3 based on average Marsh and
Sinclair (1989) and Pollock et al. (2006) methods across replicate flights for all sub blocks where sightings occurred 28
Table 3-6 Dugong density estimates (per km2) for each sub-block during D3 based on Marsh and Sinclair (1989) and Pollock et al. (2006) population estimate methods 29
Table 3-7 Details of turtle group size estimates for whole blocks and correction factors used in population estimates for the D3 aerial survey 40
Table 3-8 Sighting histories for turtles sighted during D3 aerial surveys in July 2013 by (a) individual observers for each replicate flight and (b) all combined* 41
Table 3-9 Comparison of turtle population estimates within each block during D3 and the Baseline Phase, based on Marsh and Sinclair (1989) and Pollock et al. (2006) methods 41
Table 3-10 Results of univariate PERMANOVA tests for differences in the density of turtles per km based on: a) the Marsh and Sinclair (1989) population estimate method; b) the Pollock et al. (2006) population estimate method; and c) raw sightings between two Phases (Baseline and Dredging), Phase (B1, B2 and B3 within Baseline Phase and D3 within Dredging Phase), two Treatments (Control and Impact) and three Blocks (C1 and C2 within Control and IM within Impact) 45
Table 3-11 Turtle population estimates for each sub-block during D3 based on average Marsh and Sinclair (1989) and Pollock et al. (2006) methods across replicate flights for each sub-block during D3 46
Table 3-12 Turtle density estimates (per km2) for each sub-block during D3 based on Marsh and Sinclair (1989) and Pollock et al. (2006) population estimate methods 47
Table 3-13 Survey effort for land-based observations during D3 49 Table 3-14 Number of megafaunal sightings and number of individual animals observed at Channel Island
Bridge and Cullen Bay rock wall during D3 50
Figures Figure 2-1 Aerial survey blocks and sub-divisions encompassing Bynoe Harbour (C1), Darwin
Harbour/Hope Inlet region (IM) and Vernon Islands (C2) 6 Figure 2-2 Land survey sites in Darwin Harbour during D3 – Cullen Bay Rock Wall (left) and Channel
Island Bridge (right) 7 Figure 3-1 Distribution of dugongs (based on raw sightings) during D3 aerial survey 14 Figure 3-2 Mean counts per replicate (±SE) of dugongs in each block (C1, IM and C2) during D3 aerial
survey and the same time period last year (B2). The mean number of dugongs recorded in the Baseline Phase in each block is indicated by the solid lines 15
Figure 3-3 Density of dugong sightings (based on raw counts) per km2 of transect area sampled over water within 6 km x 6 km grids at IM during D3 16
Figure 3-4 Relative difference in the density of dugong sightings (based on raw counts) per km2 of transect area sampled over water within 6 km x 6 km grids in IM during D3 compared to the Baseline Phase 17

Routine Turtle and Dugong Monitoring Program Report – Dredging Report 3 Ichthys Nearshore Environmental Monitoring Program
Prepared for INPEX Cardno Page x
Figure 3-5 Relative difference in the density of dugong sightings (based on raw counts) per km2 of transect area sampled over water within 6 km x 6 km grids at IM during D3 compared to the same time period last year (B2, July 2012) 18
Figure 3-6 Proportion of dugong sightings within different depth ranges (m) in: a) C1; b) IM; and c) C2 during D3 and the Baseline Phase 20
Figure 3-7 Proportion of dugong sightings with respect to benthic habitat types at: a) C1; b) IM; and c) C2 during D3 and the Baseline Phase 21
Figure 3-8 Mean population estimates for dugongs in each block during D3 and the Baseline Phase based on: a) Marsh and Sinclair (1989); and b) Pollock et al. (2006) population estimate methodologies. N.B. insufficient data were available for population estimates to be made for C2 in D3 24
Figure 3-9 Mean dugong density per km2 (±SE) in each location during D3 and the Baseline Phase based on: a) Marsh and Sinclair (1989) population estimate method; b) Pollock et al. (2006) population estimate method; and c) raw sightings 26
Figure 3-10 Mean population estimates (±SE) for dugongs during D3 derived from whole block and sub-block calculations based on: a) Marsh and Sinclair (1989); and b) Pollock et al. (2006) population estimate methods in C1 and IM (no dugong population estimates were calculated for C2 during D3) 30
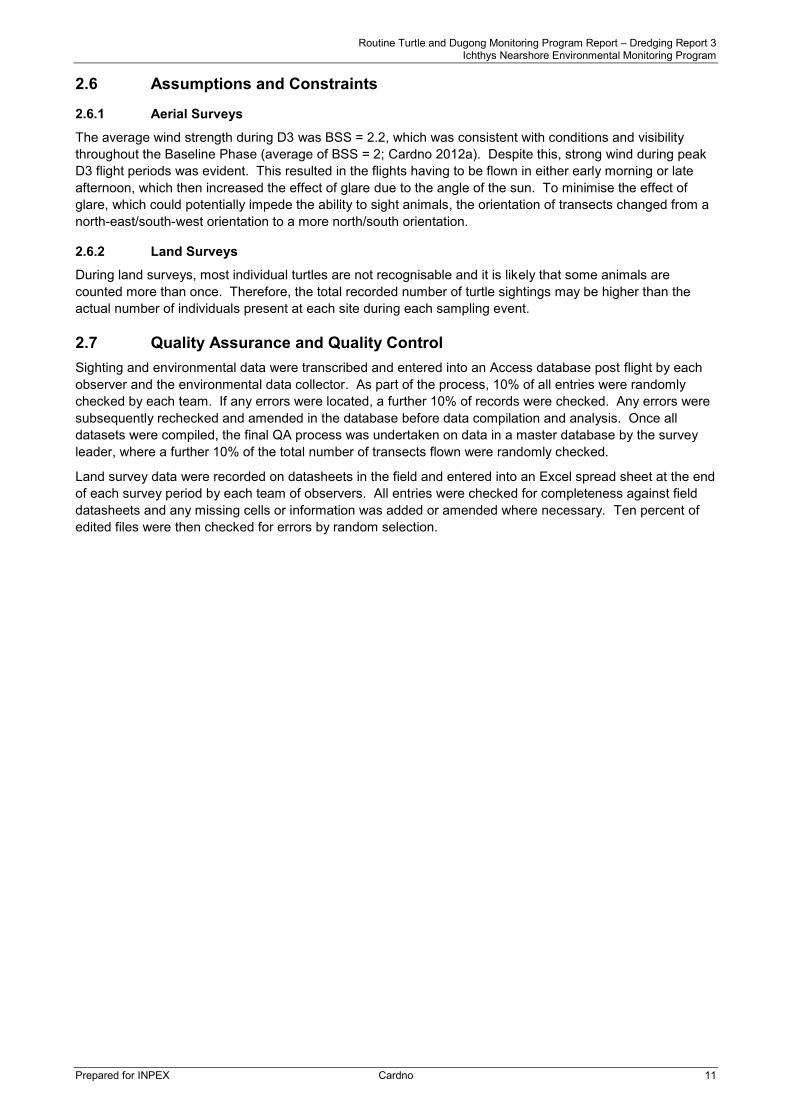
Figure 3-11 Distribution of turtles (based on raw sightings) during D3 aerial survey 32 Figure 3-12 Mean counts per replicate (±SE) of turtles in each block (C1, IM and C2) during D3 and the
same time period last year (B2). The mean number of turtles recorded during the Baseline Phase at each block is indicated by the solid line 33
Figure 3-13 Density of turtle sightings (based on raw counts) per km2 of transect area sampled over water within 6 km x 6 km grids in IM during D3 34
Figure 3-14 Relative difference in the density of turtle sightings (based on raw counts) per km2 of transect area sampled over water within 6 km x 6 km grids in IM during D3 compared to the Baseline Phase 35
Figure 3-15 Relative difference in the density of turtle sightings (based on raw counts) per km2 of transect area sampled over water within 6 km x 6 km grids in IM during D3 compared to the same time period last year (B2, July 2012) 36
Figure 3-16 Proportion of turtle sightings within different depth ranges (m) at: a) C1; b) IM; and c) C2 during D3 and the Baseline Phase 38
Figure 3-17 Proportion of turtle sightings with respect to benthic habitat types at: a) C1; b) IM; and c) C2 during D3 and the Baseline Phase 39
Figure 3-18 Mean population estimates of turtles within each block during D3 and the Baseline Phase based on: a) Marsh and Sinclair (1989); and b) Pollock et al. (2006) population estimate methodologies42
Figure 3-19 Mean turtle density per km2 (±SE) at each location during D3 and the Baseline Phase based on: a) the Marsh and Sinclair (1989) population estimate method; b) the Pollock et al. (2006) population estimate method; and c) raw sightings 44
Figure 3-20 Mean population estimates (±SE) for turtles derived from whole block and sub-block calculations based on the: a) Marsh and Sinclair (1989); and b) Pollock et al. (2006) population estimate methods at each location during D3 48
Figure 3-21 Distribution of species sighted during land surveys in D3 (July 2013). N.B. Sightings of dolphins (blue dots) at Cullen Bay are a group of between 4 and 10 individuals sighted over a 2 hour period 51

Routine Turtle and Dugong Monitoring Program Report – Dredging Report 3 Ichthys Nearshore Environmental Monitoring Program
Prepared for INPEX Cardno Page xi
Appendices Appendix A Summary of Aerial Survey Effort During Baseline Phase and Dredging surveys Appendix B Summary of Dugong Sightings across Baseline Phase and Dredging surveys Appendix C Summary of Turtle and Dugong Sightings Overlaid with confirmed seagrass habitat during
B2 and D3 surveys Appendix D Dugong Population Size Estimates During Baseline Phase and Dredging Surveys Appendix E Corrected Dugong Densities During Baseline Phase and Dredging Surveys Appendix F Dugong Sub-block Population Size Estimates during D3 Aerial Surveys Appendix G Corrected Dugong Sub-block Densities during D3 Aerial Surveys Appendix H Summary of Turtle Sightings Across Baseline Phase and Dredging Surveys Appendix I Turtle Population Size Estimates during Baseline Phase and Dredging Surveys Appendix J Corrected Turtle Densities during Baseline Phase and Dredging Surveys Appendix K Turtle Sub-block Population Size Estimates during D3 Aerial Surveys Appendix L Corrected Sub-block Turtle Densities during D3 Aerial Surveys Appendix M Land-based Observation Sightings Data Appendix N Rehabilitated Turtle Summary Data

Routine Turtle and Dugong Monitoring Program Report – Dredging Report 3 Ichthys Nearshore Environmental Monitoring Program
Prepared for INPEX Cardno Page 1
1 Introduction
1.1 Overview INPEX is the operator of the Ichthys Gas Field Development Project (the Project). The Project comprises the development of offshore production facilities at the Ichthys Field in the Browse Basin, some 820 km west-south-west of Darwin, an 889 km long subsea gas export pipeline (GEP) and an onshore processing facility and product loading jetty at Blaydin Point on Middle Arm Peninsula in Darwin Harbour. To support the nearshore infrastructure at Blaydin Point, dredging works will be carried out to extend safe shipping access from near East Arm Wharf to the new product loading facilities at Blaydin Point which will be supported by piles driven into the sediment. A trench will also be dredged to seat and protect the GEP for the Darwin Harbour portion of its total length. Dredged material will be disposed at the spoil ground located approximately 12 km north-west of Lee Point. A detailed description of the dredging and spoil disposal methodology is provided in Section 2 of the Dredging and Spoil Disposal Management Plan – East Arm (DSDMP) (INPEX 2012).
1.2 Background This report outlines the findings of the second Dredging Phase survey of the Turtle and Dugong Monitoring Program (TDMP) undertaken from 27 July 2013 to 11 August 2013 (D3). It includes results from aerial and land surveys and where appropriate, comparisons were also undertaken with Baseline Phase survey 2 (B2; 18 July 2012 to 5 August 2012), which was completed at the corresponding time of year in 2012.
Baseline survey 3 (B3) was undertaken after the commencement of the Backhoe Dredger (BHD) operations on 27 August 2012 and originally termed Dredging survey 1 (D1); however, given this was prior to the start of the Cutter Suction Dredger (CSD) on 4 November 2012, it was renamed B3. This was further supported by statistical analyses, which found no statistical difference between the three surveys.
The first ‘during dredging’ survey undertaken for the TDMP was in May 2013 and was termed D2. Results presented in this report are for aerial and land surveys undertaken in July 2013 and August 2013 and referred to as D3. The field protocol utilised in this program follows the methodology outlined in the Nearshore Environmental Monitoring Plan (NEMP) (Rev 2) (Cardno 2013a).
1.3 Aims and Objectives The key objectives of the TDMP are to:
> Quantify the variability of turtle and dugong relative abundance and distribution in the inshore waters of Darwin Harbour and nearshore waters between and within surveys. Observe changes in these parameters over the duration of the Dredging and Post Dredging Phases; and
> Assess fine scale aspects of dugong and turtle populations within Darwin Harbour in relation to potential habitat use and identify foraging areas (if possible).
The aim of this Report is to continue the collection of robust data on turtle and dugong distribution and abundance around the monitoring area during the Dredging Phase that can then be used for temporal comparison with data collected in previous surveys done during the Baseline and Dredging Phases.

Routine Turtle and Dugong Monitoring Program Report – Dredging Report 3 Ichthys Nearshore Environmental Monitoring Program
Prepared for INPEX Cardno Page 2
2 Methodology
Full details on methodology for aerial surveys and turtle tagging for the TDMP can be found in Appendix K of the NEMP (Rev 2) (Cardno 2013a) and the TDMP Baseline Report and Dredging Report 1 (Cardno 2012a, 2013b). Where methodology has been refined, or when there has been additional analyses utilised, details are provided in this report.
2.1 Monitoring of Rehabilitated Turtles Around Darwin, turtles are occasionally found stranded as a result of predatory attack, vessel strike, entanglement or more frequently, from unknown injuries. Many of these turtles are rehabilitated at either the Animal Ark Hospital or at Charles Darwin University. During the TDMP, any turtles bought in for rehabilitation were assessed for possible tagging as part of the monitoring program. Results are summarised in Section 3.3 and in Appendix N.
2.2 Field Monitoring Schedule D3 was undertaken in July 2013 and August 2013, following three Baseline Phase surveys undertaken in 2012 and the first ‘during dredging’ survey (D2) in May 2013. Table 2-1 outlines the monitoring schedule for the TDMP during the Baseline and Dredging Phases to date.

Routine Turtle and Dugong Monitoring Program Report – Dredging Report 3 Ichthys Nearshore Environmental Monitoring Program
Prepared for INPEX Cardno 3
Table 2-1 Monitoring schedule for the TDMP Sampling Periods
Baseline Phase Dredging Phase
Field Method Site B1 B2 B3 D2 D3
Aerial surveys Darwin Harbour and surrounding waters
Aerial Survey
May/June 2012
Training and Safety Inductions
7 days 2 replicate flights
Aerial Survey
July/August 2012
Training and Safety Inductions
14 days 3 replicate flights
Aerial Survey
September/October 2012
Training and Safety Inductions
17 days 3 replicate flights
Aerial Surveys
May 2013
Training and Safety Inductions
16 days 2 to 3 replicate flights*
Aerial Surveys
July 2013
Training and Safety Inductions
16 days 3 replicate flights
Boat surveys Darwin Harbour and surrounding waters
Transects and Point-Sampling
June/ July 2012
Training and Safety Inductions
6 days, 1 replicate of 15 point sampling sites and transects between sites
Transects and Point-Sampling
August 2012
Training and Safety Inductions
11 days, 1 replicate of 20 point-sampling sites and transects between sites, 2nd replicate of area from Lee Point to Vernon Islands
Point-Sampling
October 2012
Training and Safety Inductions
10 days, 2 replicate of 20 point sampling sites
-- --
Land surveys -- -- -- --
Land surveys
May 2013
Channel Island Bridge
Cullen Bay Rock Wall
4 days
Land surveys
July 2013
Channel Island Bridge
Cullen Bay Rock Wall
4 days

Routine Turtle and Dugong Monitoring Program Report – Dredging Report 3 Ichthys Nearshore Environmental Monitoring Program
Prepared for INPEX Cardno 4
Sampling Periods
Baseline Phase Dredging Phase
Field Method Site B1 B2 B3 D2 D3
Turtle satellite tagging
Channel Island Bridge -- --
1 x satellite tagging event (hand netting)
September/ October 2012
6 days
1 x satellite tagging event (net capture via boat)
November 2012
4 days
-- --
Casuarina Beach -- --
1 x satellite tagging event
September/ October 2012
13 nights
-- --
Rehabilitated turtle update 2 turtles^ 3 turtles^ 5 turtles^
* D2 surveys: C1 and IM blocks - 3 replicate flights; C2 - 2 replicate flights ^ turtles in rehabilitation that were released during this period since the end of the previous survey (not suitable for tagging)

Routine Turtle and Dugong Monitoring Program Report – Dredging Report 3 Ichthys Nearshore Environmental Monitoring Program
Prepared for INPEX Cardno 5
2.3 Field Sampling Locations
2.3.1 Aerial Surveys
Aerial surveys were used to collect data over a broad spatial scale within three geographical regions (or blocks) (Figure 2-1):
> ‘Block 1’ Bynoe Harbour (Control location 1 – C1);
> ‘Block 2’ encompassing Darwin Harbour/Hope Inlet to Gunn Point (Impact location – IM); and
> ‘Block 3’ located to the east, from Gunn Point and the Vernon Islands and across to Melville Island (Control location 2 – C2).
2.3.2 Land Surveys
Baseline Phase boat surveys undertaken during 2012 using transects and point sampling methods resulted in few turtle and dugong observations compared to aerial surveys. Therefore, boat-based surveying was not yielding sufficient data to meet its main objective which was the assessment of finer-scale data concerning behaviour and habitat use. As a consequence, it was proposed by the Ichthys Project Dredging Expert Panel (IPDEP) that land surveys from recognised ‘hotspots’ around Darwin Harbour (discrete areas with potentially the highest number of marine fauna sightings) be introduced to replace vessel transects and point sampling. These ‘hotspots’ would allow for longer observation periods and greater likelihood of encountering turtles or dugongs than vessel-based surveys, thus allowing more insight into finer-scale behaviour of turtles and dugongs. A review of historical sighting data, as well as consultation with local experts in the region, identified potential ‘hotspots’ from which suitable locations for land-based observations for turtles and dugongs were selected.
In order to assess finer scale aspects of turtle and dugong populations in relation to frequently utilised habitats within Darwin Harbour during D3, land surveys during D3 were undertaken from two locations around Darwin Harbour – Channel Island Bridge and Cullen Bay rock wall (Figure 2-2).

Routine Turtle and Dugong Monitoring Program Report – Dredging Report 3 Ichthys Nearshore Environmental Monitoring Program
Prepared for INPEX Cardno 6
Figure 2-1 Aerial survey blocks and sub-divisions encompassing Bynoe Harbour (C1), Darwin Harbour/Hope Inlet region (IM) and Vernon Islands (C2)

Routine Turtle and Dugong Monitoring Program Report – Dredging Report 3 Ichthys Nearshore Environmental Monitoring Program
Prepared for INPEX Cardno 7
Figure 2-2 Land survey sites in Darwin Harbour during D3 – Cullen Bay Rock Wall (left) and Channel Island Bridge (right)

Routine Turtle and Dugong Monitoring Program Report – Dredging Report 3 Ichthys Nearshore Environmental Monitoring Program
Prepared for INPEX Cardno 8
2.4 Field Methods
2.4.1 Aerial Surveys
Aerial surveys of marine megafauna during D3 were flown from 24 July 2013 to 11 August 2013. Three replicate sets of transects (termed replicate ‘flights’) were completed in each of the three main blocks (C1, IM, C2) (Figure 2-1).
The aerial survey methodology followed the traditional strip transect survey design technique as described by Marsh and Sinclair (1989). A Dornier 220, (a high winged turbo engine aircraft), flown at a speed of approximately 110 kn and at an altitude of 500 ft (152 m), was used to complete each transect.
Transect width was 200 m on each side of the aircraft, where each observer’s window was demarcated into four horizontal subsections (50 m (Low), 100 m (Medium), 150 m (High) and 200 m (Very High)). Sightings on the ‘inside’ or the ‘outside’ of these subsections, which refers to sightings inside or beyond the 200 m transect width either side of the plane, were also recorded. Further details of the aerial survey methods are given in the TDMP Baseline Report (Cardno 2012a).
During Baseline Phase and D2 surveys, each transect followed an approximate north-east to south-west alignment, spaced equally at 2 km intervals. During D3, transects were spaced at 2 km intervals, although the orientation of transects within the C1 and C2 blocks were altered slightly where necessary to accommodate for glare. Transect orientation varied depending on the time of day surveys were undertaken, with morning transects flown in the original north-east to south-west alignment and afternoon transects flown in a north to south alignment. Each of the three replicate flights flown within the IM block during D3 were flown in a north-east to south-west alignment at 2 km intervals regardless of the time of day. Placement of transects at 2 km intervals minimised the chance of sighting the same animal twice, while maximising the aerial coverage (approximately 19%) of the survey block.
Dolphins, dugongs and turtles were sighted and recorded in the aerial surveys; however, dolphins were not reported as part of the TDMP. Raw data pertaining to dolphins sighted during the TDMP aerial surveys will be supplied to the Department of Land Resource Management (DLRM).
2.4.2 Land Surveys
Land surveys were undertaken from Channel Island Bridge and the rock wall at Cullen Bay during D3. At each location, a total of six hours (from 07:30) of observations were undertaken per day for two days. Survey periods incorporated eight 30-minute observations, each separated by a 15-minute (‘off-effort’) window.
Surveys were undertaken when the Beaufort Sea State (BSS) was less than or equal to three to maximise observability of marine megafauna (turtles, dugongs and inshore dolphins). During each 30-minute observation period, observers continuously scanned the water (aided by polarised sunglasses) and assessed any surface disturbance with binoculars to identify the presence of any marine megafauna.
When megafauna were sighted, the following data was recorded on a data sheet:
> Date and time of each sighting (if more than one animal was sighted at any one time, the priority was to gather data for the first animal sighted);
> Animal type: turtle, dugong, dolphin or other incidental sightings (including an identification ranking e.g. certain, probable or uncertain). Species identification was also attempted, and then ranked as certain or uncertain;
> Number of individuals (where multiple individuals were involved in a sighting);
> Bearing of sighting from the observer (using a hand-held compass);
> Estimated distance from observer to animal; and
> Behavioural activity or sighting cue.
Environmental and water variables (BSS, glare and turbidity) were recorded at the start and end of each observation period, while the position of each observer was recorded using a hand-held GPS. Where

Routine Turtle and Dugong Monitoring Program Report – Dredging Report 3 Ichthys Nearshore Environmental Monitoring Program
Prepared for INPEX Cardno 9
possible, confirmed cases of multiple sightings of individuals were noted; however, this was generally not reliable for turtles or dugongs.
2.4.2.1 Channel Island Bridge
Two observers were concurrently used per survey at Channel Island Bridge (Figure 2-2). One observer was positioned on the northern side of the bridge observing north, while the second observer was located on the southern side of the bridge observing to the south. Each observer was situated in the middle of the bridge and observed the width of the channel on their observation side.
2.4.2.2 Cullen Bay Rock Wall
Two observers were concurrently used per survey at the Cullen Bay Rock Wall (Figure 2-2). The observers were located on the rock wall, with one observing the east to north quadrant around towards Fannie Bay, while the other is observing the west to north quadrant, which included Cullen Bay.
2.5 Data Analysis
2.5.1 Aerial Surveys
2.5.1.1 Distribution and Habitat Use
For each turtle or dugong sighting, the water depth was determined by estimating the vertical difference between the tidal water level and the underwater bed strata depth. This involved combining the tidal height at the time and position of each sighting (relative to mean sea level (MSL) and the bed strata depth at that position (also relative to MSL).
The tidal level at the time of each sighting was obtained through interrogation of the predicted tides for the Darwin area, which were provided by the National Tidal Centre (NTC). Spatial variation among blocks in the heights and timing associated with the tidal cycle was assumed to be negligible, although it is acknowledged that such variations exist.
The bed strata depths were determined through interrogation of two different bathymetric data sets. The primary source of bathymetric data was via nautical charts provided by the Australian Hydrographical Service (AUS Charts 24-28). For sightings that occurred outside the boundaries of these charts, depths were sourced from the Geoscience Australia Bathymetry and Topography Grid (Whiteway 2009), which has a 250 m grid cell resolution.
2.5.1.2 Dugong and Turtle Population Estimates and Densities
Dugong and turtle population estimates were calculated separately for each survey block (C1, IM and C2) and were based on the estimated number of animals (turtles or dugongs) for each tandem team per transect, corrected by the appropriate correction factors, mean group size sighted by the observers and density. Population estimates were calculated using methods described in Marsh and Sinclair (1989) and Pollock et al. (2006). Both methods attempt to correct for availability bias (animals not available to observers because of water turbidity) by applying Availability Correction Factors (ACFs) and perception bias (animals visible in the survey transect but missed by observers) by applying Perception Correction Factors (PCFs). However, spatial heterogeneity in sighting conditions among observations were only addressed by the ACF associated with the Pollock et al. (2006) method, while the Marsh and Sinclair (1989) ACF method averages conditions within each replicate flight for a spatial block (or sub-block) and only corrects for differences in availability bias between spatial or temporal partitions (i.e. blocks or surveys).
Blocks were then further partitioned into sub-blocks (C1, 4 sub-blocks; IM, 6 sub-blocks; C2, 4 sub-blocks), each of which comprised areas of similar bottom type and bathymetry, such as intertidal, inshore or offshore (Figure 2-1). Whilst population estimates can be calculated based on any number of sightings (including n = 1), it was recognised that the variance associated with estimates calculated using such data may be large, reducing their reliability. Therefore, only replicate flights in which five or more sightings were recorded were used for sub-block population estimation, which has been consistent across all flights throughout the Baseline and Dredging Phase aerial surveys. Where possible, dugong and turtle population estimates were calculated for each block (n = 3) and each sub-block (n = 14) using the Marsh and Sinclair (1989) and Pollock et al. (2006) methods.

Routine Turtle and Dugong Monitoring Program Report – Dredging Report 3 Ichthys Nearshore Environmental Monitoring Program
Prepared for INPEX Cardno 10
For calculation of PCF values using the Marsh and Sinclair (1989) method and for modelling of perception bias in MARK (a program that provides parameters used to estimate population size in the Pollock et al. (2006) method), data were pooled by block instead of by replicate flight. The latter was done in previous surveys. D3 aerial transect data were pooled within blocks for D3 calculations as, unlike during previous surveys, the observer team was consistent across all replicate flights and the order of transects flown was haphazardly determined (usually based on weather considerations) rather than in a strict, structured order. Furthermore, the orientation of the flights in C1 and C2 varied depending on the time of day (to minimise the negative influence of glare) and similar environmental conditions were experienced within each block and among replicate flights. As with previous analyses conducted within other surveys, group size and corresponding coefficients of variation (CV) values were determined for each replicate flight.
Dugong and turtle density estimates were calculated by dividing the derived population estimates or raw sightings data by the total transect area sampled over water within each of the three blocks, 14 sub-blocks and 43 individual 6 km x 6 km grid cells overlayed within the IM block.
2.5.1.3 Statistical Analysis
Population density estimates (number per km2) for dugongs and turtles were derived, where appropriate, for replicate flights undertaken in blocks and sub-blocks using three methods:
> Marsh and Sinclair (1989) population estimates;
> Pollock et al. (2006) population estimates; and
> Raw sightings data.
Datasets derived via these three methods were statistically analysed separately. Density estimates, derived from raw sightings in D3, were calculated for only replicate flights (within each survey block) with five or more sightings per flight.
Spatial and temporal differences in dugong and turtle densities were investigated via permutational univariate analyses of variance (PERMANOVA; Anderson 2001), using Euclidean dissimilarity resemblance matrices with unrestricted data permutation methodology.
The four factors used in the analysis of each density dataset were:
> Phase (fixed, orthogonal): 2 levels (Baseline Phase and Dredging Phase, equivalent to the ‘Before – After’ comparison in BACI);
> Survey (random, nested within Phase): B1, B2 and B3 within Baseline Phase and D2 and D3 within Dredging Phase;
> Treatment (fixed, orthogonal): 2 levels (Impact and Controls); and
> Block (random, nested within Treatment): IM within Impact treatment and C1 and C2 within Controls treatment.
Pooling of lower-level terms with the residual term was undertaken where appropriate (i.e. if the p-value of the pooled term was ≥ 0.25). Results for both the pooled and the un-pooled versions were presented where applicable. Where a term (factor or interaction) was significant at p ≤ 0.05, pair-wise comparisons were used in post-hoc analyses to identify which levels of factors or interaction strata were significantly different.
Blocks in surveys for which less than two replicate flights were available for analysis (i.e. due to < 5 sightings in two or more of the three replicate flights) were not included in analyses. As very few dugongs were sighted during the D3 aerial surveys and only one population estimate could be calculated for IM and C2, statistical analyses of the density of dugongs were only undertaken using density data derived from raw sightings only.
2.5.2 Land Surveys
Variability in the land surveys arising from several sources, including variability in sea state, observing conditions (e.g. sea state, glare) and temporal changes in the distribution and movements of the animals themselves, compromised the potential for formal analyses to detect any spatial differences and/or temporal changes in abundance of dugongs and turtles. Land-based data have, therefore, been presented in a tabular format with spatial representation of sightings in the form of GIS mapping.
Routine Turtle and Dugong Monitoring Program Report – Dredging Report 3 Ichthys Nearshore Environmental Monitoring Program
Prepared for INPEX Cardno 11
2.6 Assumptions and Constraints
2.6.1 Aerial Surveys
The average wind strength during D3 was BSS = 2.2, which was consistent with conditions and visibility throughout the Baseline Phase (average of BSS = 2; Cardno 2012a). Despite this, strong wind during peak D3 flight periods was evident. This resulted in the flights having to be flown in either early morning or late afternoon, which then increased the effect of glare due to the angle of the sun. To minimise the effect of glare, which could potentially impede the ability to sight animals, the orientation of transects changed from a north-east/south-west orientation to a more north/south orientation.
2.6.2 Land Surveys
During land surveys, most individual turtles are not recognisable and it is likely that some animals are counted more than once. Therefore, the total recorded number of turtle sightings may be higher than the actual number of individuals present at each site during each sampling event.
2.7 Quality Assurance and Quality Control Sighting and environmental data were transcribed and entered into an Access database post flight by each observer and the environmental data collector. As part of the process, 10% of all entries were randomly checked by each team. If any errors were located, a further 10% of records were checked. Any errors were subsequently rechecked and amended in the database before data compilation and analysis. Once all datasets were compiled, the final QA process was undertaken on data in a master database by the survey leader, where a further 10% of the total number of transects flown were randomly checked.
Land survey data were recorded on datasheets in the field and entered into an Excel spread sheet at the end of each survey period by each team of observers. All entries were checked for completeness against field datasheets and any missing cells or information was added or amended where necessary. Ten percent of edited files were then checked for errors by random selection.

Routine Turtle and Dugong Monitoring Program Report – Dredging Report 3 Ichthys Nearshore Environmental Monitoring Program
Prepared for INPEX Cardno 12
3 Results
3.1 Aerial Surveys
3.1.1 Survey Effort
During D3 (27 July 2013 to 11 August 2013), 7,262 km were flown over an approximate 57 hours, including 22:45 hours on linear transects. The cumulative total length of transects flown over water during each replicate flight (blocks combined) was between 1,296.4 km and 1,346.9 km (depending on transect orientation), equating to an area of between 543.7 km2 and 549.8 km2 (based on a transect width of 400 m). The overall area surveyed (variable due to tidal level) was 2,850.5 km2 across all three geographical blocks (Appendix A). Approximately 19% of the available area was surveyed across each of the three blocks.
Conditions during replicate flights were variable (average BSS = 2.2, range 1 to 4). Turbidity, based on a standardised turbidity scale used in aerial surveys (Hodgson et al. 2011), ranged between 3 and 4 and averaged approximately 4. The orientation of transects flown over the C1 and C2 blocks were selected according to conditions on each flight day, allowing for the best possible sampling conditions (Figure 2-1). Surveys in the IM block were flown in a north-east to south-west alignment regardless of the time of day.
3.1.2 Dugongs
3.1.2.1 Sightings and Distribution
The distribution of dugongs within blocks during D3 is presented in Figure 3-1. Seventy-one dugongs were sighted across all three survey blocks (C1: 19, IM: 39, C2: 13). This total was slightly lower than the total for B2 (92 dugongs) which was undertaken at the same time of year (July) in 2012, and the mean of 88 dugongs per survey recorded during the Baseline Phase (B1, n = 58; B2, n = 92; B3, n = 113), (Appendix B). It was however, considerably higher than the total number of dugongs recorded during D2 (May 2013, n = 33 dugongs). Appendix C shows the distribution of dugongs in Darwin Harbour (IM), overlaid with confirmed seagrass habitat for D3 and the same time in 2012 (B2; seagrass data: Geo Oceans 2013a). In B2, dugongs were sighted sporadically throughout the inner harbour region; however, no dugongs were sighted in these areas during D3.
Based on raw sighting data, the mean number of dugongs (± SE) sighted per flight within each block during D3 (C1 = 6.3 ± 1.2, IM = 13.0 ± 2.1, C2 = 4.3 ± 0.3; n = 3 flights) were lower than the corresponding averages (across surveys) for the Baseline Phase (C1 = 7.0, IM = 16.6, C2 = 9.3), particularly in the case of C2. Similarly, the means for D3 were also lower than those recorded during B2, but within the associated error for that survey (C1 = 7.0 ± 4.5, IM = 14.3 ± 8.3, C2 = 9.3 ± 5.8) (Figure 3-2).
The highest densities of sighted dugongs recorded during D3 (based on raw sightings within designated 6 km x 6 km grids) were within Hope Inlet and around Lee Point (grid cells 20, 22 and 23, Figure 3-3), which was similar to spatial patterns in density reported during the Baseline Phase, including the same time of the year (B2). These grid cells were within the vicinity of recently mapped seagrass for this area (Figure 3-3) (Geo Oceans 2013a, b). The relative density of sighted dugongs during D3 increased by more than 0.2 dugongs per km2 from the mean of Baseline Phase relative densities in 4.7% of IM grid cells (grid cells 22 and 23), and decreased by more than 0.2 dugongs per km2 from mean Baseline Phase densities in 27.9% of IM grid cells (Figure 3-4). A relatively small change (between -0.2 and 0.2 dugongs per km2) was observed in the relative density of dugong sightings in 26% of IM grid cells during D3 compared to the mean of the Baseline Phase. No dugongs were sighted in 42% of IM grid cells during either D3 or the Baseline Phase (Figure 3-4). Similarly, 7% of IM grid cells exhibited an increase in the relative density of dugong sightings by more than 0.2 dugongs per km2 during D3 compared to the same time during the Baseline Phase (B2, July 2012), while the relative density of dugong sightings decreased by more than 0.2 dugongs per km2 in 23.3% of IM grid cells between the same time period.
While no dugongs were observed in the Upper East Arm of Darwin Harbour during D3, some dugongs were sighted around Blaydin Point and Channel Island during sampling undertaken at the corresponding time of the year during the Baseline Phase (i.e. B2). This disparity resulted in the decrease in density in grid cells 39 and 40 shown in Figure 3-5. However, the dugong density estimates were based on very small numbers of

Routine Turtle and Dugong Monitoring Program Report – Dredging Report 3 Ichthys Nearshore Environmental Monitoring Program
Prepared for INPEX Cardno 13
sightings (if any) within relatively small areas (grid cell 39: B2, n = 4 and D3, n = 0 dugongs; grid cell 40: B2, n = 3 and D3, n = 0 dugongs). An apparent decrease was also evident for grid cell 34, located around the west arm area and away from the vicinity of the dredging activities.
Dugongs sighted during D3 were predominantly adults, which has also been the case for all previous surveys. One cow/calf pair was sighted in C1, with another pair sighted in IM, while a further two pairs were recorded in C2. Similarly, during the Baseline Phase, calves were recorded in each block with more calves observed around IM.

Routine Turtle and Dugong Monitoring Program Report – Dredging Report 3 Ichthys Nearshore Environmental Monitoring Program
Prepared for INPEX Cardno 14
Figure 3-1 Distribution of dugongs (based on raw sightings) during D3 aerial survey

Routine Turtle and Dugong Monitoring Program Report – Dredging Report 3 Ichthys Nearshore Environmental Monitoring Program
Prepared for INPEX Cardno 15
Figure 3-2 Mean counts per replicate (±SE) of dugongs in each block (C1, IM and C2) during D3
aerial survey and the same time period last year (B2). The mean number of dugongs recorded in the Baseline Phase in each block is indicated by the solid lines
0
2
4
6
8
10
12
14
16
18
20
22
24
C1 IM C2
Mea
n du
gong
cou
nt
SE
Location
B2
D3
Updated dugong mean count – 22 Oct 2013

Routine Turtle and Dugong Monitoring Program Report – Dredging Report 3 Ichthys Nearshore Environmental Monitoring Program
Prepared for INPEX Cardno 16
Figure 3-3 Density of dugong sightings (based on raw counts) per km2 of transect area sampled over water within 6 km x 6 km grids at IM during D3

Routine Turtle and Dugong Monitoring Program Report – Dredging Report 3 Ichthys Nearshore Environmental Monitoring Program
Prepared for INPEX Cardno 17
Figure 3-4 Relative difference in the density of dugong sightings (based on raw counts) per km2 of transect area sampled over water within 6 km x 6 km
grids in IM during D3 compared to the Baseline Phase

Routine Turtle and Dugong Monitoring Program Report – Dredging Report 3 Ichthys Nearshore Environmental Monitoring Program
Prepared for INPEX Cardno 18
Figure 3-5 Relative difference in the density of dugong sightings (based on raw counts) per km2 of transect area sampled over water within 6 km x 6 km
grids at IM during D3 compared to the same time period last year (B2, July 2012)

Routine Turtle and Dugong Monitoring Program Report – Dredging Report 3 Ichthys Nearshore Environmental Monitoring Program
Prepared for INPEX Cardno 19
3.1.2.2 Dugong Bathymetric Distribution and Habitat Associations
During D3, dugongs were sighted in waters up to a depth of 35 m. Forty-five per cent of dugong sightings occurred in waters < 5 m deep, 35% in waters 6 m to 10 m deep, 15% occurring in water 11 m to 20 m deep and only 5% in waters > 20 m deep.
Compared to the Baseline Phase, a lower proportion of dugong sightings were recorded within the 0 m to 5 m depth range during D3 for the C1 and IM blocks (Figure 3-6). In contrast, a relatively higher proportion of sightings were recorded within the 6 m to 10 m depth range for those blocks, while fewer than 20% of sightings were recorded in depths > 10 m. In C2, dugongs were most frequently sighted in the 11 m to 20 m depth range during D3 (54% of sightings). The proportion of sightings recorded in the < 5 m, 11 m to 20 m and > 30 m depth categories were slightly greater during D3 compared to the Baseline Phase in C2, while no sightings were recorded during D3 in the cases of the 6 m to 10 m or the 21 m to 30 m depth ranges (Figure 3-6).
In C1, the vast majority (95%) of dugongs were sighted over gravel substrata during D3, with the remainder sighted over mud (Figure 3-7). During the Baseline Phase, C1 dugongs were most frequently observed over gravel, sand and mangroves, while none were sighted over mud. In IM, a higher proportion of sightings were recorded over mud during D3 compared to the Baseline Phase (Figure 3-7). In contrast, proportionally fewer IM dugongs were sighted over reef, sand, seagrass and gravel during D3 compared to the Baseline Phase. In C2, relatively higher proportions of sightings were recorded over reef and unsurveyed substrata during D3 compared to the Baseline Phase, while fewer sightings were recorded over gravel (Figure 3-7). While there were sightings recorded over sand and mud in C2 during the Baseline Phase, no dugongs were recorded over these substrata during D3.

Routine Turtle and Dugong Monitoring Program Report – Dredging Report 3 Ichthys Nearshore Environmental Monitoring Program
Prepared for INPEX Cardno 20
Figure 3-6 Proportion of dugong sightings within different depth ranges (m) in: a) C1; b) IM; and c)
C2 during D3 and the Baseline Phase
0
0.1
0.2
0.3
0.4
0.5
0.6
0.7
0.8
0.9
1
0
0.1
0.2
0.3
0.4
0.5
0.6
0.7
0
0.1
0.2
0.3
0.4
0.5
0.6
0 - 5 6 - 10 11 - 20 21 - 30 > 30
Depth range (m)
a) C1
b) IM
c) C2
Prop
ortio
n of
dug
ong
sigh
tings
Baseline PhaseD3
Baseline PhaseD3
Baseline PhaseD3

Routine Turtle and Dugong Monitoring Program Report – Dredging Report 3 Ichthys Nearshore Environmental Monitoring Program
Prepared for INPEX Cardno 21
Figure 3-7 Proportion of dugong sightings with respect to benthic habitat types at: a) C1; b) IM; and
c) C2 during D3 and the Baseline Phase
0
0.1
0.2
0.3
0.4
0.5
0.6
0.7
0.8
0.9
1
0
0.1
0.2
0.3
0.4
0.5
0.6
0.7
0
0.1
0.2
0.3
0.4
0.5
Habitat Type
a) C1
b) IM
c) C2
Prop
ortio
n of
dug
ong
sigh
tings
Baseline PhaseD3
Baseline PhaseD3
Baseline PhaseD3

Routine Turtle and Dugong Monitoring Program Report – Dredging Report 3 Ichthys Nearshore Environmental Monitoring Program
Prepared for INPEX Cardno 22
3.1.2.3 Estimates of Dugong Population Size – Whole Blocks
Mean group sizes and correction factors (PCF and ACF) used for estimating the size of the dugong populations (using the Marsh and Sinclair (1989) method) in aerial survey blocks C1, IM and C2 during D3 are presented in Table 3-1. Due to the small number of dugong sightings, PCFs and ACFs were calculated using all sightings combined across blocks, while group sizes and CV were calculated for each replicate flight. Parameter estimates in Table 3-1 were based on all sightings including those in the ‘inside’ and ‘outside’ zones (refer to Section 2.4.1).
Table 3-1 Details of group size estimates and correction factors used in dugong population estimates for D3 (July 2013) aerial surveys (based on Marsh and Sinclair (1989) method)
Survey Block Replicate Mean group size (CV) PCF (CV) ACF (CV) Total mean
group size
Starboard Port
D3
C1 1 2 3
2.67 (0.3) 1.40 (0.3) 1.33 (0.1)
1.41 (0.17) 1.06 (0.05) 2.99 (0.17) 1.37 (0.66) IM 1 2 3
1.31 (0.1) 1.11 (0.1) 1.20 (0.1)
C2 1 2 3
1.25 (0.2) 1.33 (0.3) 2.00 (0.0)
During D3, five or more dugongs were sighted in four of the nine replicate flights (Reps 1, 2 and 3 in IM; Rep 2 in C1) (Table 3-2); while during B2, undertaken at the same time of year during the Baseline Phase, population estimates were calculated for again, only four of the nine replicate flights (Rep 1 and 2 in IM; Rep 3 for C1 and C2).
The estimated population size (± SE) of dugongs within IM during D3 ranged among replicate flights from 226 ± 113 to 391 ± 248 using the Marsh and Sinclair (1989) method and from 139 ± 54 to 195 ± 71 using the Pollock et al. (2006) method (Table 3-3). The mean of these population estimates was 316 ± 121 and 167 ± 39 for the two methods, respectively. Dugong population estimates for C1 during D3 were 134 ± 58 and 48 ± 12 based on the Marsh and Sinclair (1989) and Pollock et al. (2006) methods, respectively (Table 3-3). Dugong population size estimates derived for C1 and IM during D3 were lower than the corresponding estimates during the Baseline Phase (B2), although there was considerable imprecision associated with most of those estimates as indicated by the large, overlapping SE values (Figure 3-8, Appendix D). During B2, the calculated population estimate for IM was 411 ± 139 based on the Marsh and Sinclair (1989) method and 249 ± 150 using the Pollock et al. (2006) method.

Routine Turtle and Dugong Monitoring Program Report – Dredging Report 3 Ichthys Nearshore Environmental Monitoring Program
Prepared for INPEX Cardno 23
Table 3-2 Sighting histories for dugong groups sighted during D3 aerial surveys in July 2013 by (a) individual observers for each replicate flight; and (b) all combined*
a)
Block Rep Number of dugong groups seen by: # dugongs
sighted/ replicate
Total # dugong groups sighted
% dugong groups sighted by both
observers
SF SR SB PF PR PB Starboard Port
C1
1 2 0 0 1 0 0 8 3 0 0
2 1 0 0 2 0 2 7 5 0 50
3 1 0 0 1 0 1 4 3 0 50
IM
1 5 2 2 2 1 1 17 13 22 25
2 1 0 1 5 0 2 10 9 50 29
3 4 2 3 1 0 0 12 10 33 0
C2
1 0 0 0 2 0 2 5 4 -- 50
2 1 0 0 1 0 1 4 3 0 50
3 1 0 0 0 0 1 4 2 0 100
b)
Survey Number of dugong groups seen by: # dugongs
sighted/ replicate
Total # dugong groups sighted
% dugong groups sighted by both
observers
SF SR SB PF PR PB Starboard Port
D3 16 4 6 15 1 10 71 52 23 38
Starboard front (SF); starboard rear (SR); starboard both (SB); port front (PF); port rear (PR) and port both (PB) * All dugong sightings combined were used for estimates for PCF and MARK analysis in D3 survey.
Table 3-3 Comparison of dugong population estimates for each block during D3 and the Baseline Phase based on Marsh and Sinclair (1989) and Pollock et al. (2006)
Baseline Phase D3
Estimation Method Block Estimate SE n Estimate SE n
Marsh and Sinclair C1 190 103 5 134 58 1
IM 359 154 7 316 121 3
C2 227 109 5 -- -- 0
Pollock et al. C1 167 168 5 48 12 1
IM 231 138 7 167 39 3
C2 148 105 5 -- -- 0

Routine Turtle and Dugong Monitoring Program Report – Dredging Report 3 Ichthys Nearshore Environmental Monitoring Program
Prepared for INPEX Cardno 24
Figure 3-8 Mean population estimates for dugongs in each block during D3 and the Baseline Phase
based on: a) Marsh and Sinclair (1989); and b) Pollock et al. (2006) population estimate methodologies. N.B. insufficient data were available for population estimates to be made for C2 in D3
0
100
200
300
400
500
600Baseline PhaseD3
a) Marsh and Sinclair
0
50
100
150
200
250
300
350
400
C1 IM C2
Baseline PhaseD3
b) Pollock et al.
Mea
n du
gong
pop
ulat
ion
estim
ate
+SE
Location

Routine Turtle and Dugong Monitoring Program Report – Dredging Report 3 Ichthys Nearshore Environmental Monitoring Program
Prepared for INPEX Cardno 25
3.1.2.4 Dugong Densities – Whole Block
As per the population estimates (refer to Section 3.1.2.3), the density of dugongs per km2 was calculated for the second replicate flight at C1 and for each of the three replicate flights at IM during D3. The estimated mean density (± SE) of dugongs in C1 was 0.05 ± 0.01 per km2 and 0.17 ± 0.07 per km2 based on Pollock et al. (2006) and Marsh and Sinclair (1989) population estimate methods, respectively (Figure 3-9). At IM the estimated mean density (± SE) of dugongs was 0.15 ± 0.01 per km2 and 0.28 ± 0.04 per km2 based on Pollock et al. (2006) and Marsh and Sinclair (1989) population estimate methods, respectively, during D3 (Figure 3-9). Based on raw sightings, the mean density (± SE) of dugongs was 0.05 ± 0.01 per km2 at C1, 0.06 ± 0.01 per km2 in IM and 0.02 ± 0.001 per km2 in C2 during D3 (Figure 3-9).
The density of dugongs per km2 based on Marsh and Sinclair (1989) and Pollock et al. (2006) population estimate methods and raw counts for each replicate flight and survey period within each of the three blocks are presented in Appendix E.

Routine Turtle and Dugong Monitoring Program Report – Dredging Report 3 Ichthys Nearshore Environmental Monitoring Program
Prepared for INPEX Cardno 26
Figure 3-9 Mean dugong density per km2 (±SE) in each location during D3 and the Baseline Phase
based on: a) Marsh and Sinclair (1989) population estimate method; b) Pollock et al. (2006) population estimate method; and c) raw sightings
0
0.02
0.04
0.06
0.08
C1 IM C2
0
0.05
0.1
0.15
0.2
0.25
0
0.05
0.1
0.15
0.2
0.25
0.3
0.35
Location
Mea
n du
gong
den
sity
per
km
+SE
a) Marsh and Sinclair
b) Pollock et al.
c) Raw sightings
Baseline Phase
D3
Baseline Phase
D3
Baseline Phase
D3

Routine Turtle and Dugong Monitoring Program Report – Dredging Report 3 Ichthys Nearshore Environmental Monitoring Program
Prepared for INPEX Cardno 27
No significant Phase x Treatment interaction was detected for the density of dugongs derived from raw sightings, indicating that the mean density of dugongs did not significantly differ between Impact and Control Treatments in either Phase or between Baseline and Dredging Phases for either Treatment (Table 3-4). There were also no other significant interactions between Phases, or Surveys within Phases and Treatments, or Blocks within Treatments, nor significant differences between Phases (Treatments combined), Treatments (Phases combined), Blocks (within Treatments; Phases combined), or among Surveys (within Phases; Treatments combined). The analysis shows that the density of dugongs has not significantly differed through time or between different areas for the duration of the TDMP (Table 3-4).
Table 3-4 Results of univariate PERMANOVA testing for differences in the density of dugongs per km2 based on raw sightings Analysis compares two Phases (Baseline and Dredging), two Treatments (Control and Impact), among Surveys (B1, B2 and B3 within Baseline Phase and D3 within Dredging Phase) and between Blocks (C1 and C2 within Control and IM within Impact); pooled with those for the Residual/Pooled term in the final analysis
Source of Variation df MS Pseu-F p-(perm)
Raw sightings
Phase 1 < 0.01 3.15 0.33
Treatment 1 < 0.01 1.62 0.29
Phase x Treatment 1 < 0.01 0.44 0.47
Survey (Phase) 3 < 0.01 2.16 0.11
Block (Treatment) 1 < 0.01 < 0.01 0.98
Phase x Block (Treatment) 1 < 0.01 0.04 0.60
Treatment x Survey (Phase) 3 < 0.01 2.10 0.12
Survey (Phase) x Block (Treatment) (3) (< 0.01) (0.65) 0.58
Residual/ Pooled 26 < 0.01
Total 40

Routine Turtle and Dugong Monitoring Program Report – Dredging Report 3 Ichthys Nearshore Environmental Monitoring Program
Prepared for INPEX Cardno 28
3.1.2.5 Dugong Sub-block Population Estimates
During D3, replicate sub-block population estimates for dugongs were calculated for all sub-blocks where dugongs were sighted within IM and C1. No sub-block estimates were done for C2 as block population estimates were not calculated for this whole block. Population estimates within IM-4 were the highest recorded among sub-blocks. Within IM, mean dugong sub-block population estimates (± SE; averaged across replicate flights) among the six sub-blocks ranged between 19 ± 18 and 215 ± 64 dugongs and between 12 ± 4 and 130 ± 34 based on Marsh and Sinclair (1989) and Pollock et al. (2006) methods respectively (Table 3-5).
Within C1, mean population estimates among the four sub-blocks were only possible for sub-blocks two and three. Mean population estimates (± SE) ranged between 29 ± 27 and 12 ± 3 dugongs and between 85 ± 45 and 76 ± 19 dugongs using the Marsh and Sinclair (1989) and Pollock et al. (2006) methods respectively (Table 3-5, Appendix F).
Table 3-5 Dugong population estimates for each sub-block during D3 based on average Marsh and Sinclair (1989) and Pollock et al. (2006) methods across replicate flights for all sub blocks where sightings occurred
Marsh and Sinclair (1989) Pollock et al. (2006)
Block Sub-block n Population Estimate SE Population
Estimate SE
C1
1 1 - - - -
2 1 85 45 76 19
3 1 29 27 12 3
4 1 - - - -
IM
1 0 - - - -
2 1 20 17 13 4
3 3 30 19 17 4
4 3 215 64 130 34
5 0 - - - -
6 1 19 18 12 4
C2
1 0 - - - - 2 0 - - - - 3 0 - - - -
4 0 - - - -
n = number of replicate flights where sightings were recorded

Routine Turtle and Dugong Monitoring Program Report – Dredging Report 3 Ichthys Nearshore Environmental Monitoring Program
Prepared for INPEX Cardno 29
3.1.2.6 Dugong Sub-block Densities
In D3, the highest mean density of dugongs across sub-blocks was recorded within IM-4. Estimates of mean density of dugongs (± SE) among IM sub-blocks ranged between 0.1 ± 0.1 and 1.3 ± 0.4 per km2 based on Marsh and Sinclair (1989) population estimates and between < 0.01 ± < 0.01 and 0.8 ± 0.2 per km2 based on Pollock et al. (2006) population estimates (Table 3-6).
Mean density of dugongs (± SE) among C1 sub-blocks ranged between 0.2 ± 0.2 and 0.3 ± 0.2 per km2
based on Marsh and Sinclair (1989) population estimates and between 0.1 ± 0.0 and 0.3 ± 0.1 per km2 based on Pollock et al. (2006) population estimates (Table 3-6, Appendix G). As per the population estimates, no densities were calculated within any sub-blocks in C2.
Table 3-6 Dugong density estimates (per km2) for each sub-block during D3 based on Marsh and Sinclair (1989) and Pollock et al. (2006) population estimate methods
Marsh and Sinclair (1989) Pollock et al. (2006)
Block Sub-block Area (km2) Density Estimate SE Density Estimate SE
C1
1 94.7 - - - -
2 296.4 0.3 0.2 0.3 0.1
3 150.2 0.2 0.2 0.1 0.0
4 145.8 - - - -
IM
1 193.8 - - - -
2 128.7 0.2 0.1 0.1 0.0
3 121.5 0.2 0.2 0.1 0.0
4 171.5 1.3 0.4 0.8 0.2
5 85.9 - - - -
6 333.1 0.1 0.1 < 0.01 < 0.01
C2
1 224.5 - - - -
2 207.1 - - - -
3 393.6 - - - -
4 150.7 - - - -
3.1.2.7 Dugong Whole Block vs. Sub-block Population Estimates
Dugong block population estimates for D3 derived from whole block estimates and via the combination of replicate sub-block estimates were compared for each block and using the two estimation methods. Data used included all sightings (i.e. ≥ 1 sighting per replicate flight within each sub-block).
Based on the Marsh and Sinclair (1989) method, the mean population size estimates (± SE) for D3 derived from whole block estimates were 134 ± 58 for C1 and 215 ± 64 for IM. Estimates derived from the combination of sub-block estimates via the Marsh and Sinclair (1989) method were 114 ± 52 for C1 and 258 ± 64 for IM (Figure 3-10). Based on the Pollock et al. (2006) method, the mean population size estimates derived from whole block estimates were 48 ± 23 for C1 and 130 ± 34 for IM, which were both slightly lower than those derived from the combination of sub-block estimates (88 ± 19 for C1 and 155 ± 31 for IM; Appendix D and F.

Routine Turtle and Dugong Monitoring Program Report – Dredging Report 3 Ichthys Nearshore Environmental Monitoring Program
Prepared for INPEX Cardno 30
Figure 3-10 Mean population estimates (±SE) for dugongs during D3 derived from whole block and
sub-block calculations based on: a) Marsh and Sinclair (1989); and b) Pollock et al. (2006) population estimate methods in C1 and IM (no dugong population estimates were calculated for C2 during D3)
0
50
100
150
200
250
300
350
0
20
40
60
80
100
120
140
160
180
200
C1 IM C2
BlockSub-block
a) Marsh and Sinclair
b) Pollock et al. BlockSub-block
Location
Mea
n du
gong
pop
ulat
ion
estim
ate
+SE

Routine Turtle and Dugong Monitoring Program Report – Dredging Report 3 Ichthys Nearshore Environmental Monitoring Program
Prepared for INPEX Cardno 31
3.1.3 Turtles
3.1.3.1 Sightings and Distribution
Five hundred and twenty nine turtles were sighted across all three survey blocks during D3 (C1: 173, IM: 161, C2: 195), with observations consisting predominantly of individual turtles. Groups of two or more individuals were recorded in C2, including one group of four turtles (Appendix H). The D3 total was approximately 17% lower than the average number of turtles sighted per survey during the Baseline Phase (634 turtles), and approximately 10% lower than the number recorded during B2 (585 turtles) which was undertaken at the same time of year (July) in 2012.
Turtle sightings were widely distributed within each of the three survey blocks during D3 (Figure 3-11), with this distribution generally similar to that recorded during D2 and during the Baseline Phase (Cardno 2012a, 2013b). Appendix C shows the distribution of turtles in Darwin Harbour (IM), overlaid with confirmed seagrass habitat during D3 and at the same time in 2012 (B2; seagrass data: Geo Oceans 2013a). It is evident that turtles were sighted throughout the inner harbour region during the B2 survey in July 2013; however, there were no sightings in these areas during July 2013 (D3) survey.
The mean numbers of turtle sightings per replicate flight (± SE) within survey blocks during D3 (C1: 58 ± 0.3, IM: 54 ± 2.0, C2: 64 ± 10.4) were lower than the means of those recorded across the Baseline Phase (C1 = 65 ± 12.3, IM = 86 ± 14.4, C2 = 87 ± 13.6) and in the case of IM, lower than that reported during B2 (69 ± 8.5; Figure 3-12). Mean numbers of turtles were similar between D3 and B2 for blocks C1 (62 ± 20.7 in B2) and C2 (64 ± 7.6 in B2).
During D3, the highest densities per km2 of turtle sightings in the IM block were recorded around Lee Point and within Hope Inlet (grid cells 16 and 21 to 24), adjacent to Casuarina Beach (grid cell 20) and on the western edge of Darwin Harbour around Charles Point (grid cells 17 and 43) (Figure 3-13). Within Darwin Harbour Inner, the density per km2 of turtle sightings was higher within grid cells 36, 38 and 39 compared to adjacent grid cells.
The distribution of areas of high and low turtle density was similar to spatial patterns in density reported during the Baseline Phase (Cardno 2012a). The relative density of sighted turtles during D3 increased by more than 0.2 turtles per km2 from the mean Baseline Phase relative densities in 23% of IM grid cells and decreased by more than 0.2 turtles per km2 from mean Baseline Phase densities in 61% of IM grid cells (Figure 3-14). A relatively small change (between -0.2 and 0.2 turtles per km2) was observed in the relative density of turtle sightings in 14% of IM grid cells during D3 compared to the mean of the Baseline Phase. No turtles have been sighted in 2.3% of IM grid cells during either D3 or the Baseline Phase (Figure 3-14). Similarly, 12% of IM grid cells exhibited an increase in the relative density of turtle sightings by more than 0.2 turtles per km2 during D3 compared to B2 (July 2012), while the relative density of turtle sightings decreased by more than 0.2 turtles per km2 in 23% of IM grid cells between the same time period (Figure 3-15). Fewer turtles were observed in the Upper East Arm during D3 compared to the corresponding time of the year during the Baseline Phase (B2). Similarly to dugongs, this resulted in a decrease in turtle density from B2 to D3 that was relatively large compared with most other grid cells inside and outside the inner harbour (Figure 3-15). However, decreases of a similar extent were also apparent for other grid cells outside the inner harbour (i.e. grid cells 7 and 27).
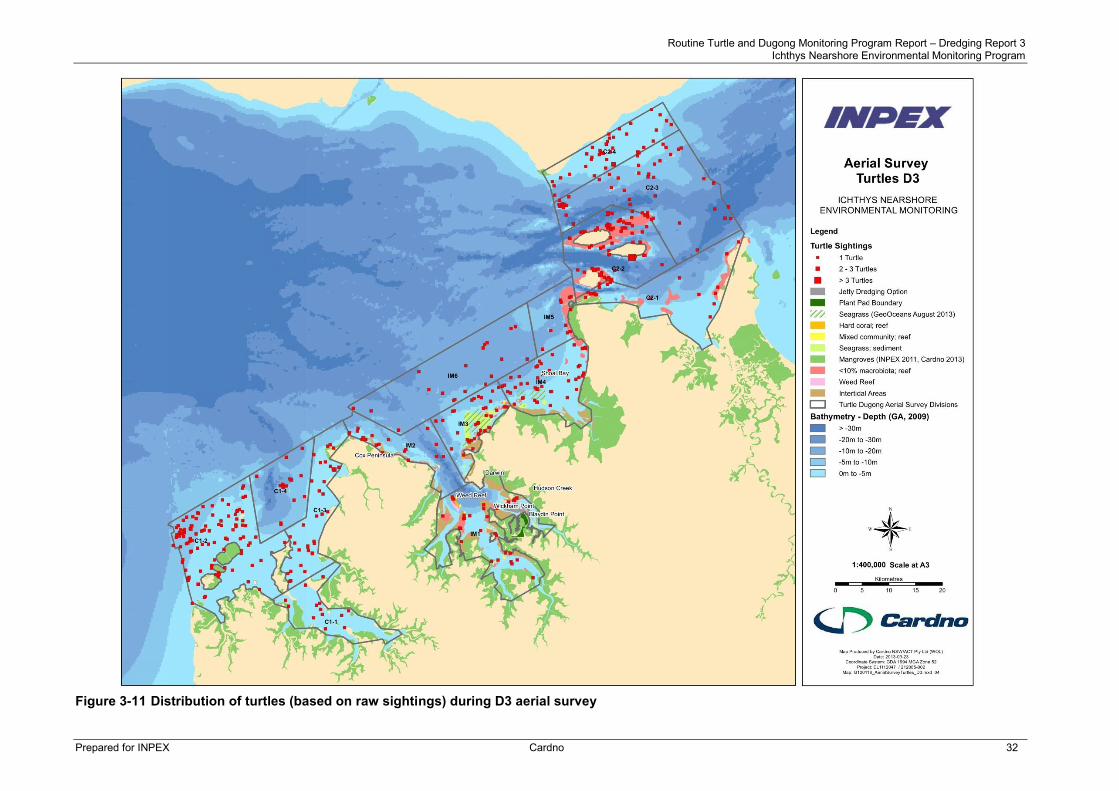
Routine Turtle and Dugong Monitoring Program Report – Dredging Report 3 Ichthys Nearshore Environmental Monitoring Program
Prepared for INPEX Cardno 32
Figure 3-11 Distribution of turtles (based on raw sightings) during D3 aerial survey
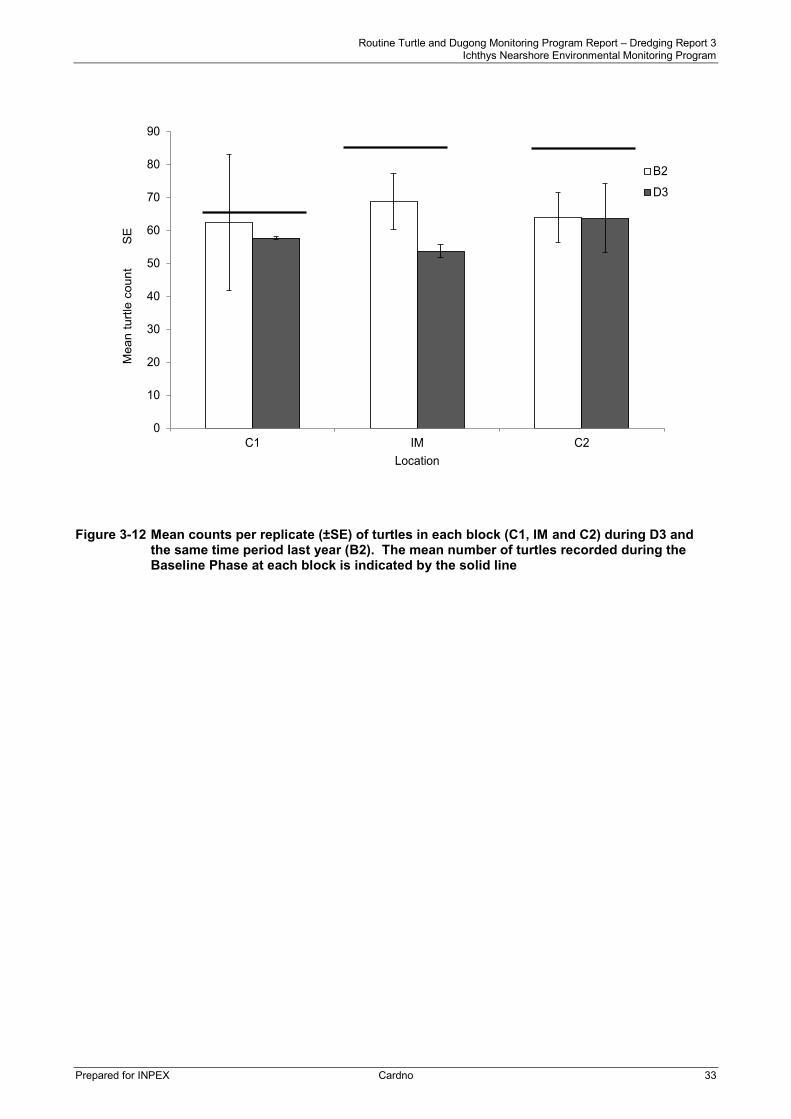
Routine Turtle and Dugong Monitoring Program Report – Dredging Report 3 Ichthys Nearshore Environmental Monitoring Program
Prepared for INPEX Cardno 33
Figure 3-12 Mean counts per replicate (±SE) of turtles in each block (C1, IM and C2) during D3 and the same time period last year (B2). The mean number of turtles recorded during the Baseline Phase at each block is indicated by the solid line
0
10
20
30
40
50
60
70
80
90
C1 IM C2
Mea
n tu
rtle
coun
t
SE
Location
B2
D3
Updated turtle mean count – 22 Oct 2013

Routine Turtle and Dugong Monitoring Program Report – Dredging Report 3 Ichthys Nearshore Environmental Monitoring Program
Prepared for INPEX Cardno 34
Figure 3-13 Density of turtle sightings (based on raw counts) per km2 of transect area sampled over water within 6 km x 6 km grids in IM during D3
Routine Turtle and Dugong Monitoring Program Report – Dredging Report 3 Ichthys Nearshore Environmental Monitoring Program
Prepared for INPEX Cardno 35
Figure 3-14 Relative difference in the density of turtle sightings (based on raw counts) per km2 of transect area sampled over water within 6 km x 6 km
grids in IM during D3 compared to the Baseline Phase

Routine Turtle and Dugong Monitoring Program Report – Dredging Report 3 Ichthys Nearshore Environmental Monitoring Program
Prepared for INPEX Cardno 36
Figure 3-15 Relative difference in the density of turtle sightings (based on raw counts) per km2 of transect area sampled over water within 6 km x 6 km
grids in IM during D3 compared to the same time period last year (B2, July 2012)

Routine Turtle and Dugong Monitoring Program Report – Dredging Report 3 Ichthys Nearshore Environmental Monitoring Program
Prepared for INPEX Cardno Page 37
3.1.3.2 Turtle Bathymetric Distribution and Habitat Associations
Turtles were sighted across all depth ranges during D3, with most turtle sightings in C1 (64%) and IM (39%) recorded in waters < 5 m deep (Figure 3-16). In contrast, the most turtle sightings in C2 (47%) were recorded in the 11 m to 20 m depth range. There was also a small number of turtles sighted in association with deep channel habitats (> 35 m deep) near the Vernon Islands in C2 (5%). The depth distributions of turtle sightings recorded during D3 were similar to those reported during the Baseline Phase in each of the three blocks (Figure 3-16).
During D3, habitat associations of turtles were generally consistent with those observed during the Baseline Phase for all three blocks (Figure 3-17). Turtles were most frequently sighted over gravel in C1 (72% of sightings), sand in IM (63% of sightings) and over unsurveyed substrata in C2 (45% of sightings). In C2, 29% of sightings were over reef, 17% over gravel and 7% over sand (Figure 3-17).

Routine Turtle and Dugong Monitoring Program Report – Dredging Report 3 Ichthys Nearshore Environmental Monitoring Program
Prepared for INPEX Cardno Page 38
Figure 3-16 Proportion of turtle sightings within different depth ranges (m) at: a) C1; b) IM; and c) C2 during D3 and the Baseline Phase
Depth range (m)
a) C1
b) IM
c) C2
Prop
ortio
n of
turt
le s
ight
ings
Baseline PhaseD3
Baseline PhaseD3
Baseline PhaseD3
0
0.1
0.2
0.3
0.4
0.5
0.6
0.7
0.8
0.9
0
0.05
0.1
0.15
0.2
0.25
0.3
0.35
0.4
0.45
0.5
0
0.05
0.1
0.15
0.2
0.25
0.3
0.35
0.4
0.45
0.5
0 - 5 6 - 10 11 - 20 21 - 30 > 30

Routine Turtle and Dugong Monitoring Program Report – Dredging Report 3 Ichthys Nearshore Environmental Monitoring Program
Prepared for INPEX Cardno Page 39
Figure 3-17 Proportion of turtle sightings with respect to benthic habitat types at: a) C1; b) IM; and c)
C2 during D3 and the Baseline Phase
0
0.1
0.2
0.3
0.4
0.5
0
0.1
0.2
0.3
0.4
0.5
0.6
0.7
0.8
0
0.1
0.2
0.3
0.4
0.5
0.6
0.7
Habitat Type
a) C1
b) IM
c) C2
Prop
ortio
n of
turt
le s
ight
ings
Baseline PhaseD3
Baseline PhaseD3
Baseline PhaseD3
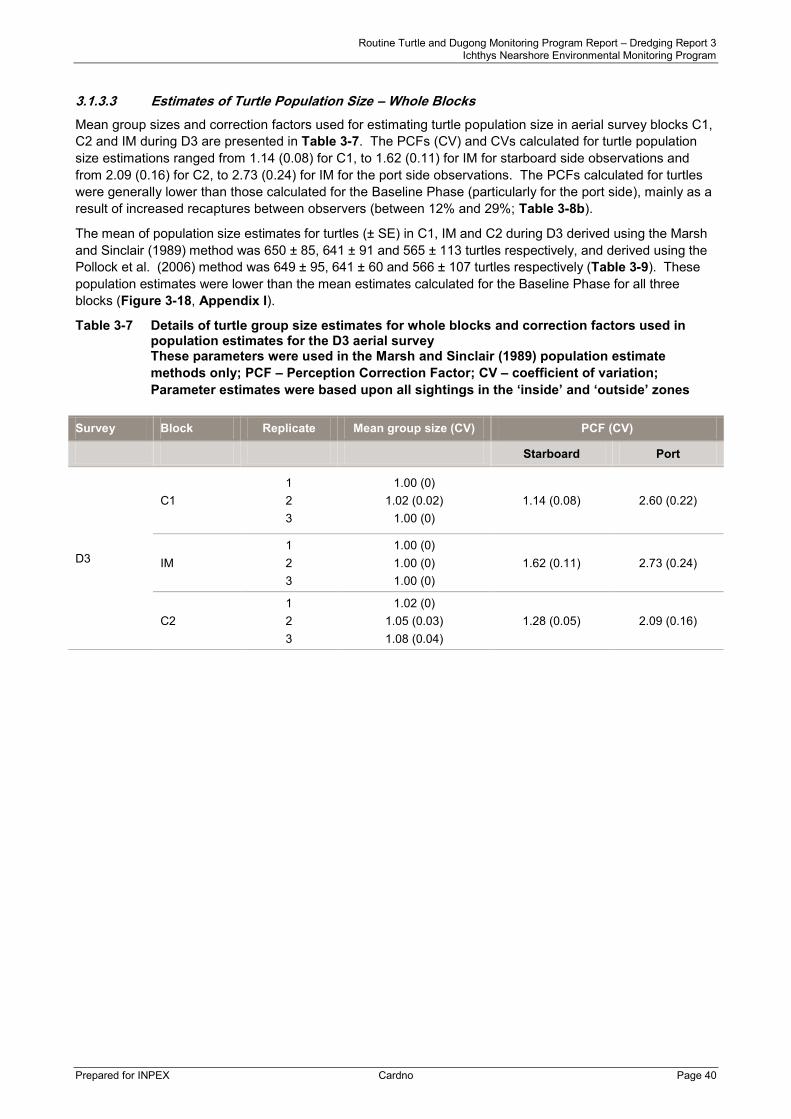
Routine Turtle and Dugong Monitoring Program Report – Dredging Report 3 Ichthys Nearshore Environmental Monitoring Program
Prepared for INPEX Cardno Page 40
3.1.3.3 Estimates of Turtle Population Size – Whole Blocks
Mean group sizes and correction factors used for estimating turtle population size in aerial survey blocks C1, C2 and IM during D3 are presented in Table 3-7. The PCFs (CV) and CVs calculated for turtle population size estimations ranged from 1.14 (0.08) for C1, to 1.62 (0.11) for IM for starboard side observations and from 2.09 (0.16) for C2, to 2.73 (0.24) for IM for the port side observations. The PCFs calculated for turtles were generally lower than those calculated for the Baseline Phase (particularly for the port side), mainly as a result of increased recaptures between observers (between 12% and 29%; Table 3-8b).
The mean of population size estimates for turtles (± SE) in C1, IM and C2 during D3 derived using the Marsh and Sinclair (1989) method was 650 ± 85, 641 ± 91 and 565 ± 113 turtles respectively, and derived using the Pollock et al. (2006) method was 649 ± 95, 641 ± 60 and 566 ± 107 turtles respectively (Table 3-9). These population estimates were lower than the mean estimates calculated for the Baseline Phase for all three blocks (Figure 3-18, Appendix I).
Table 3-7 Details of turtle group size estimates for whole blocks and correction factors used in population estimates for the D3 aerial survey These parameters were used in the Marsh and Sinclair (1989) population estimate methods only; PCF – Perception Correction Factor; CV – coefficient of variation; Parameter estimates were based upon all sightings in the ‘inside’ and ‘outside’ zones
Survey Block Replicate Mean group size (CV) PCF (CV)
Starboard Port
D3
C1 1 2 3
1.00 (0) 1.02 (0.02)
1.00 (0) 1.14 (0.08) 2.60 (0.22)
IM 1 2 3
1.00 (0) 1.00 (0) 1.00 (0)
1.62 (0.11) 2.73 (0.24)
C2 1 2 3
1.02 (0) 1.05 (0.03) 1.08 (0.04)
1.28 (0.05) 2.09 (0.16)

Routine Turtle and Dugong Monitoring Program Report – Dredging Report 3 Ichthys Nearshore Environmental Monitoring Program
Prepared for INPEX Cardno Page 41
Table 3-8 Sighting histories for turtles sighted during D3 aerial surveys in July 2013 by (a) individual observers for each replicate flight and (b) all combined*
a)
Block Rep. Number of turtles groups seen by: Total # turtle groups sighted
% turtle groups sighted by both observers
SF SR SB PF PR PB Starboard Port
C1
1 8 7 15 15 12 1 58 50 4
2 11 12 4 16 8 6 57 15 20
3 5 18 6 15 10 3 57 21 11
IM
1 5 3 5 12 23 2 50 38 5
2 16 10 4 9 10 5 54 13 21
3 12 16 10 11 6 2 57 26 11
C2
1 7 8 10 8 7 5 45 40 25
2 14 5 7 17 13 4 60 27 12
3 11 13 16 28 7 5 80 40 13
b)
Block Number of turtles groups seen by: Total # turtle groups sighted
% turtle groups sighted by both observers
SF SR SB PF PR PB Starboard Port
C1 24 37 25 46 30 10 172 29 12
IM 33 29 19 32 39 9 161 23 11
C2 24 37 25 46 30 10 172 29 12
Starboard front (SF); starboard rear (SR); starboard both (SB); port front (PF); port rear (PR) and port both (PB) * Replicates combined per block were used for population estimates and MARK analysis in D3 survey
Table 3-9 Comparison of turtle population estimates within each block during D3 and the Baseline Phase, based on Marsh and Sinclair (1989) and Pollock et al. (2006) methods
Baseline Phase D3
Estimation Method Block Estimate SE n Estimate SE n
Marsh and Sinclair C1 875 630 8 650 85 3
IM 1061 709 8 641 91 3
C2 831 295 8 565 113 3
Pollock et al. C1 874 730 8 649 95 3
IM 1047 851 8 641 60 3
C2 868 485 8 566 107 3

Routine Turtle and Dugong Monitoring Program Report – Dredging Report 3 Ichthys Nearshore Environmental Monitoring Program
Prepared for INPEX Cardno Page 42
Figure 3-18 Mean population estimates of turtles within each block during D3 and the Baseline Phase
based on: a) Marsh and Sinclair (1989); and b) Pollock et al. (2006) population estimate methodologies
0
400
800
1200
1600
2000
0
400
800
1200
1600
2000
C1 IM C2
Baseline PhaseD3
Baseline PhaseD3
a) Marsh and Sinclair
b) Pollock et al.
Mea
n tu
rtle
pop
ulat
ion
estim
ate
+SE
Location

Routine Turtle and Dugong Monitoring Program Report – Dredging Report 3 Ichthys Nearshore Environmental Monitoring Program
Prepared for INPEX Cardno Page 43
3.1.3.4 Turtle Densities – Whole Blocks
Mean turtle density (± SE) based on the Marsh and Sinclair (1989) population estimate method was 0.79 ± 0.06 per km2 in the C1 block, 0.56 ± 0.05 per km2 in IM and 0.55 ± 0.04 per km2 in C2 during D3 (Figure 3-19). Based on the Pollock et al. (2006) population estimate method, mean turtle density (± SE) was 0.8 ± 0.1 per km2 in C1, 0.6 ± 0.03 per km2 in IM and 0.6 ± 0.03 per km2 at C2 during B3 (Figure 3-19).
The mean density (± SE) of turtles based on raw counts was 0.4 ± 0.001 per km2 in C1, 0.3 ± 0.01 per km2 in IM and 0.3 ± 0.06 per km2 in C2 during B3. Mean turtle densities were lower during D3 compared to the Baseline Phase (Figure 3-19). The density of turtles per km2 based on Marsh and Sinclair (1989), Pollock et al. (2006) and raw counts for each replicate flight and survey period within each of the three blocks are presented in Appendix J.
Based on data derived using the Marsh and Sinclair (1989) and Pollock et al. (2006) population estimate methods, no significant Phase x Treatment interaction was detected for the density of turtles, indicating that mean density did not significantly differ between Impact and Control Treatments in either Phase, or between Baseline and Dredging Phases for either Treatment (Table 3-10a and b). There were also no other significant interactions between Phases or Surveys within Phases and Treatments or Blocks within Treatments, nor significant differences between Phases (Treatments combined), Treatments (Phases combined), Blocks (within Treatments; Phases combined), or among Surveys (within Phases; Treatments combined).
In contrast, significant differences in turtle density estimates derived from raw observations were detected among Surveys within Phases (blocks combined) (p < 0.01), while no other terms in the analysis were significant (Table 3-10c). Pairwise comparisons revealed that during the Baseline Phase the mean density of turtles was significantly higher in D3 (0.6 ± 0.07 per km2) than in B1 (0.3 ± 0.04 per km2) and B2 (0.4 ± 0.05 per km2), while B1 and B2 did not significantly differ. During the Dredging Phase the mean density of turtles was significantly higher in D2 (0.5 ± 0.08 per km2) than in D3 (0.3 ± 0.03 per km2).
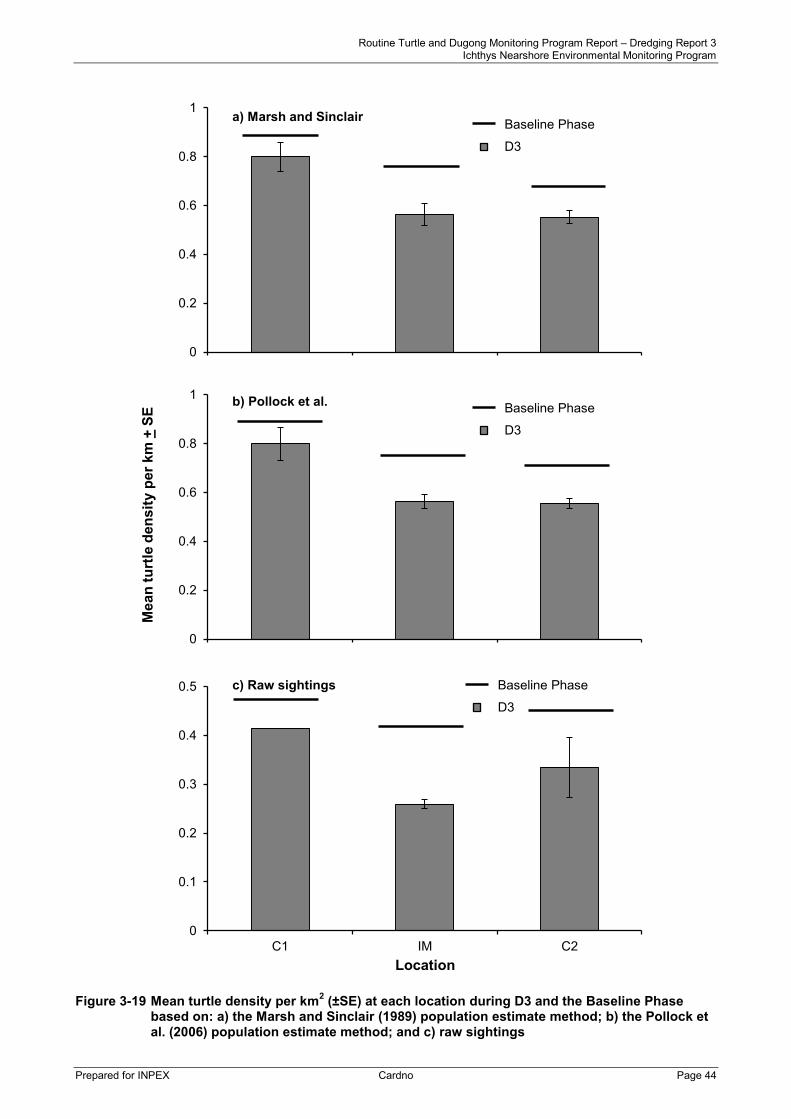
Routine Turtle and Dugong Monitoring Program Report – Dredging Report 3 Ichthys Nearshore Environmental Monitoring Program
Prepared for INPEX Cardno Page 44
Figure 3-19 Mean turtle density per km2 (±SE) at each location during D3 and the Baseline Phase
based on: a) the Marsh and Sinclair (1989) population estimate method; b) the Pollock et al. (2006) population estimate method; and c) raw sightings
0
0.1
0.2
0.3
0.4
0.5
C1 IM C2
0
0.2
0.4
0.6
0.8
1
0
0.2
0.4
0.6
0.8
1
Location
Mea
n tu
rtle
den
sity
per
km
+SE
a) Marsh and Sinclair
b) Pollock et al.
c) Raw sightings
Baseline Phase
D3
Baseline Phase
D3
Baseline Phase
D3

Routine Turtle and Dugong Monitoring Program Report – Dredging Report 3 Ichthys Nearshore Environmental Monitoring Program
Prepared for INPEX Cardno Page 45
Table 3-10 Results of univariate PERMANOVA tests for differences in the density of turtles per km based on: a) the Marsh and Sinclair (1989) population estimate method; b) the Pollock et al. (2006) population estimate method; and c) raw sightings between two Phases (Baseline and Dredging), Phase (B1, B2 and B3 within Baseline Phase and D3 within Dredging Phase), two Treatments (Control and Impact) and three Blocks (C1 and C2 within Control and IM within Impact) ( ) Pooled with those for the Residual/Pooled term in the final analysis; ^ No. permutations < 100 so Monte Carlo calculated p-value presented
Source of Variation df MS Pseu-F p-(perm) df MS Pseu-F p-(perm) df MS Pseu-F p-(perm)
(a) Marsh and Sinclair (1989) (b) Pollock et al. (2006) (c) Raw sightings
Phase 1 0.71 1.45 ^0.31 1 0.68 1.36 ^0.31 1 0.02 0.15 ^0.72
Treatment 1 0.23 0.53 ^0.59 1 0.29 0.94 0.34 1 0.11 2.88 ^0.34
Phase x Treatment 1 0.11 0.59 0.45 1 0.09 0.47 0.51 1 0.04 1.79 0.19
Survey (Phase) 3 1.56 2.71 > 0.05 3 0.53 2.62 >0.05 3 0.16 7.15 < 0.01
Block (Treatment) 1 0.44 2.30 0.14 1 0.30 1.5 0.24 1 0.03 1.77 0.20
Phase x Block (Treatment) (1) (0.01) (0.06) 0.80 (1) (0.01) (<0.01) 0.82 (1) (0.02) (1.09) 0.30
Treatment x Survey (Phase) (3) (0.03) (0.18) 0.90 (3) (0.04) (0.18) 0.91 (3) (<0.01) (0.29) 0.83
Survey (Phase) x Block (Treatment) (3) (0.21) (0.97) 0.42 (3) (0.18) (0.79) 0.51 (3) (0.02) (1.00) 0.39
Residual/ Pooled 26 0.21 26 0.23 26 0.02
Total 40 40 40
Pairwise Comparisons Baseline: B2 = B1
(ranked from largest (left) to smallest (right)) Baseline: B3 > B1
Baseline: B3 > B2
Dredging: D2 > D3

Routine Turtle and Dugong Monitoring Program Report – Dredging Report 3 Ichthys Nearshore Environmental Monitoring Program
Prepared for INPEX Cardno Page 46
3.1.3.5 Turtle Sub-block Population Estimates
Turtle sub-block population estimates (± SE; averaged across replicate flights) among the four sub-blocks within C1 ranged between 38 ± 16 and 370 ± 59 turtles based on Marsh and Sinclair (1989) methods and between 38 ± 16 and 362 ± 62 based on Pollock et al (2006) methods (Table 3-11).
Population estimates among the four C2 sub-blocks ranged between 116 ± 36 and 205 ± 47 turtles, and between 104 ± 28 and 217 ± 52 turtles for those two estimation methods respectively. In IM, estimates among the six sub-blocks ranged between 72 ± 18 and 155 ± 27 turtles and between 69 ± 10 and 159 ± 29 turtles respectively (Figure 3-11, Appendix K).
Table 3-11 Turtle population estimates for each sub-block during D3 based on average Marsh and Sinclair (1989) and Pollock et al. (2006) methods across replicate flights for each sub-block during D3
Marsh and Sinclair (1989). Pollock et al. (2006)
Block Sub-block n Population
estimate SE Population estimate SE
C1
1 3 36 11 36 6
2 3 370 59 362 62
3 3 95 22 98 20
4 3 52 17 52 10
IM
1 3 121 29 112 22
2 3 72 18 69 10
3 3 128 35 137 28
4 3 155 27 159 29
5 3 40 16 37 6
6 3 71 28 72 26
C2
1 3 60 33 59 32
2 3 205 47 217 52
3 3 144 30 144 29
4 3 116 36 104 28
n = number of replicate flights where ≥1 turtle sighting was recorded

Routine Turtle and Dugong Monitoring Program Report – Dredging Report 3 Ichthys Nearshore Environmental Monitoring Program
Prepared for INPEX Cardno Page 47
3.1.3.6 Turtle Sub-block Densities
Estimates of mean density of turtles (± SE) among C1 sub-blocks ranged between 0.4 ± 0.2 and 1.2 ± 0.2 per km2 based on Marsh and Sinclair (1989) population estimates, and between 0.4 ± 0.1 and 1.2 ± 0.2 per km2 based on Pollock et al. (2006) population estimates (Table 3-12).
Mean density among C2 sub-blocks ranged between 0.4 ± 0.1 and 1.0 ± 0.2 per km2 and between 0.4 ± 0.1 and 1.0 ± 0.3 based on the two estimation methods respectively, while among IM sub-blocks the mean density ranged between 0.3 ± 0.1 and 1.1 ± 0.3 per km2 and between 0.3 ± 0.1 and 1.1 ± 0.2 per km2
respectively (Table 3-12, Appendix L).
Table 3-12 Turtle density estimates (per km2) for each sub-block during D3 based on Marsh and Sinclair (1989) and Pollock et al. (2006) population estimate methods
Marsh and Sinclair (1989) Pollock et al. (2006)
Block Sub-block Area (km²) Density estimate SE Density
estimate SE
C1
1 94.7 0.4 0.2 0.4 0.1
2 296.4 1.2 0.2 1.2 0.2
3 150.2 0.6 0.1 0.7 0.1
4 145.8 0.4 0.2 0.4 0.1
IM
1 193.8 0.6 0.1 0.6 0.1
2 128.7 0.6 0.1 0.5 0.1
3 121.5 1.1 0.3 1.1 0.2
4 171.5 0.9 0.2 0.9 0.2
5 85.9 0.5 0.2 0.4 0.1
6 333.1 0.3 0.1 0.3 0.1
C2
1 224.5 0.5 0.3 0.5 0.3
2 207.1 1.0 0.2 1.0 0.3
3 393.6 0.4 0.1 0.4 0.1
4 150.7 0.8 0.2 0.7 0.2
3.1.3.7 Turtle Whole Block vs. Sub-block Population Estimates
Population estimates for turtles for D3 and associated standard errors derived from whole block estimates were higher than those derived using the combination of sub-block estimates for all three blocks in the cases of both the Marsh and Sinclair (1989) and Pollock et al. (2006) estimation methods. Based on the Marsh and Sinclair (1989) population estimate method, mean turtle population size estimates (± SE) derived from whole blocks were 650 ± 85 for C1, 641 ± 91 for IM and 565 ± 113 for C2 (Figure 3-20). Estimates derived from the combination of sub-block estimates using the Marsh and Sinclair (1989) method were 552 ± 65 for C1, 587 ± 56 for IM and 524 ± 113 for C2.
Based on the Pollock et al. (2006) method, the mean population size estimates derived from whole blocks were 649 ± 95 for C1, 641 ± 60 for IM and 566 ± 107 for C2 (Figure 3-20). Estimates derived from the combination sub-block estimates based on the Pollock et al. (2006) method were 548 ± 65 for C1, 586 ± 44 for IM and 524 ± 107 for C2 (Appendix I and K).

Routine Turtle and Dugong Monitoring Program Report – Dredging Report 3 Ichthys Nearshore Environmental Monitoring Program
Prepared for INPEX Cardno Page 48
Figure 3-20 Mean population estimates (±SE) for turtles derived from whole block and sub-block calculations based on the: a) Marsh and Sinclair (1989); and b) Pollock et al. (2006) population estimate methods at each location during D3
0
100
200
300
400
500
600
700
800 BlockSub-block
a) Marsh and Sinclair
0
100
200
300
400
500
600
700
800
C1 IM C2
BlockSub-block
b) Pollock et al.
Location
Mea
n tu
rtle
pop
ulat
ion
estim
ate
+SE

Routine Turtle and Dugong Monitoring Program Report – Dredging Report 3 Ichthys Nearshore Environmental Monitoring Program
Prepared for INPEX Cardno Page 49
3.2 Land Surveys
3.2.1 Survey Effort
The mean sea state (BSS ± SE) at the start of 30-minute observation periods during the first and second sampling surveys at Channel Island Bridge was 1.5 ± 0.3 and 2.9 ± 0.2, respectively, while at Cullen Bay rock wall, mean sea state was 1.8 ± 0.1 and 1.3 ± 0.2 for the two surveys respectively (Table 3-13).
Land-based surveys undertaken on the first and second surveys commenced during a rising and falling neap tide respectively, while the tidal change over which sampling was conducted was 1.56 m and 1.26 m respectively (Table 3-13). Raw data for each land survey period are presented in Appendix M.
Table 3-13 Survey effort for land-based observations during D3
Date Location surveyed Tidal window (cm)
Survey start time
Mean (±SE) sea state at each
start time
Mean (±SE) turbidity at
each start time
30 July 2013 Channel Island Bridge 427.5 – 583.0 07:30 1.5 (0.3) 4.0 (0.0)
30 July 2013 Cullen Bay rock wall 427.5 – 583.0 07:30 1.8 (0.1) 4.0 (0.0)
3 August 2013 Channel Island Bridge 481.0 – 355.0 07:30 2.9 (0.2) 4.0 (0.0)
3 August 2013 Cullen Bay rock wall 481.0 – 355.0 07:30 1.3 (0.2) 4.0 (0.0)
3.2.2 Channel Island Bridge
Two hundred and ninety one turtle sightings were recorded from Channel Island Bridge during D3, with the majority off the northern side of the bridge and during the second survey (Figure 3-21, Table 3-14). Ninety-six per cent of sightings were identified as individual turtles (n = 280), with 95% of those identified as green turtles and the remainder unable to be identified to species level. The majority (93%) of turtles observed from Channel Island Bridge were considered to be juvenile. No dolphins or dugongs were observed during either of the two surveys at Channel Island Bridge during D3.
3.2.3 Cullen Bay Rock Wall
At Cullen Bay Rock Wall during D3 a single dugong sighting was recorded during the first survey and again, another single dugong was sighted several times over an approximate 50-minute period during the second survey. A pod of dolphins consisting of 4 to 10 adults was sighted to the north-west of the wall during the first survey and observed over a 2-hour period. Dolphins within this pod displayed behaviour consistent with socialising and foraging activities. No turtles were observed during either of the two surveys at Cullen Bay rock wall (Table 3-14).

Routine Turtle and Dugong Monitoring Program Report – Dredging Report 3 Ichthys Nearshore Environmental Monitoring Program
Prepared for INPEX Cardno Page 50
Table 3-14 Number of megafaunal sightings and number of individual animals observed at Channel Island Bridge and Cullen Bay rock wall during D3
Channel Island Bridge Survey 1 Survey 2
Total sightings Individuals* Total sightings Individuals*
Unidentified turtle 14 14 0 0
Green turtle 98 87 179 179
Dugong 0 0 0 0
Dolphin 0 0 0 0
Total sightings 112 101 179 179
Cullen Bay Rock Wall Survey 1 Survey 2
Total sightings Individuals* Total sightings Individuals*
Unidentified turtle 0 0 0 0
Green turtle 0 0 0 0
Dugong 1 1 5 1
Dolphin 1^ 4 - 10 0 0
Total sightings 2 5 - 11 5 1
* Individual turtles recognised through recognisable features or observation of dive behaviour
^ Refers to group sighting, with between 4 and 10 individual dolphins in the one group

Routine Turtle and Dugong Monitoring Program Report – Dredging Report 3 Ichthys Nearshore Environmental Monitoring Program
Prepared for INPEX Cardno 51
Figure 3-21 Distribution of species sighted during land surveys in D3 (July 2013). N.B. Sightings of dolphins (blue dots) at Cullen Bay are a group of
between 4 and 10 individuals sighted over a 2 hour period
Routine Turtle and Dugong Monitoring Program Report – Dredging Report 3 Ichthys Nearshore Environmental Monitoring Program
Prepared for INPEX Cardno 52
3.3 Rehabilitated Turtle Update A summary of all rehabilitated turtles (current and past) reported to Cardno by the Arafura Timor Research Facility or DLRM since the commencement of the Project is provided in Appendix N. Rehabilitated turtles have included one olive ridley and six flatback turtles.
To date, no satellite tagging of rehabilitated turtles has been undertaken by Cardno during the Project. Of the ten turtles rehabilitated to date, only three belonged to species targeted for satellite tagging (one green and two hawksbill turtles), with all unsuitable for tagging due to their existing injuries. One hawksbill turtle was found outside of the Project area (Dundee Beach, west of Bynoe Harbour) and was subsequently released at this location by Arafura Timor Research Facility staff. Another hawksbill turtle had lost its fore flipper and the green turtle had severe head injuries, therefore both were immunocompromised and not suitable for tagging for this Project.
3.4 Quality Assurance and Quality Control Within the aerial survey observer database, a total of 256 line entries were quality checked, with three errors detected (1%). As part of the Environmental database quality control check, 272 line entries were checked, with 19 errors detected (7%). During the master database quality check there were 330 entries checked, with two errors detected (1%). All errors were subsequently corrected.
All entries in the land-based survey observer database were checked against the datasheets for quality assurance and no data entry errors were found.

Routine Turtle and Dugong Monitoring Program Report – Dredging Report 3 Ichthys Nearshore Environmental Monitoring Program
Prepared for INPEX Cardno 53
4 Discussion
The TDMP incorporates various visual survey techniques to estimate and monitor turtle and dugong populations within Darwin Harbour, Hope Inlet, Shoal Bay, Bynoe Harbour and from the Vernon Islands to Melville Island. Sampling for D3 was completed during July 2013 and August 2013, approximately eight months after the commencement of CSD operations. Data collected via standardised aerial transects during D3 has enabled a comparison of sightings, population estimates and density estimates at three locations; Bynoe Harbour (C1), Darwin Harbour/ Hope Inlet (IM) and around the Vernon Islands (C2), with comparable data collected during the Baseline Phase. Land observations undertaken during D3 have provided an opportunity to identify fine-scale turtle and dugong habitat associations within Darwin Harbour.
4.1 Aerial Surveys
4.1.1 Dugongs
The number of dugongs sightings during D3 aerial surveys (71 individuals in total) was approximately 19% lower than the average for Baseline Phase (mean of 88 individuals), but more than twice the number of individuals sighted during D2 (33 individuals in total) which was undertaken in May 2013. Fewer dugongs were sighted during D3 than during the survey undertaken at a similar time of year during the Baseline Phase (B2, July 2012, 92 individuals in total).
Dugong population estimates within the Darwin Harbour region (IM) during D3, estimated using two alternative population estimation methods (Marsh and Sinclair (1989) and Pollock et al. (2006)), were 316 ± 121 and 167 ± 39 individuals, respectively. These estimates were 12% and 28% lower, respectively, than the Baseline Phase estimates, but substantially higher than estimates for D2 (90 and 99 individuals for the two methods, respectively). Dugong population estimates for the Bynoe Harbour region (C1) were 134 ± 58 individuals using the Marsh and Sinclair (1989) method and 48 ± 12 individuals based on the Pollock et al. (2006) method. These estimates were lower than Baseline Phase estimates of 190 ± 103 and 167 ± 168 individuals, respectively. Fewer than five dugongs were sighted during any replicate flight completed within the C2 block during D3, preventing the calculation of reliable population estimates. In comparison, during the B2, the calculated population estimate for IM was 411 ± 139 based on the Marsh and Sinclair (1989) method and 249 ± 150 using the Pollock et al. (2006) method based on four of the nine replicate flights.
Results from previous surveys (Cardno 2012a; 2013b, c) and from D3 suggest that the sizes of dugong populations in the three blocks have been spatially and temporally variable throughout the monitoring program. Environmental conditions, such as sea state and turbidity, can affect the number of dugong sightings and consequently population estimates (Marsh and Sinclair 1989). As these environmental conditions have been relatively similar among surveys, the observed variability in dugong sightings is likely to be associated with inherent behaviour characteristics of dugongs, including being highly mobile, migratory and frequently submerging (Bayliss and Freeland 1989; Marsh et al. 2002). Seasonal trends in dugong population estimates have been recorded throughout their geographic range, particularly within Moreton Bay, Queensland (Preen 1993). Additional surveys in Darwin may further facilitate examination of the effect of seasonality on dugong population estimates within Darwin Harbour and surrounding locations.
Dugongs were distributed throughout the entire survey area, although the frequency of sightings was not uniform among survey blocks. Dugongs were observed in association with shallow areas near the Vernon Islands, off the islands at the mouth of Bynoe Harbour, such as north around Bare Sand Island or around Dum In Mirrie Island, but in far greater frequency throughout Hope Inlet. The density of dugong sightings has not differed statistically through time or among blocks for the duration of the TDMP. While no dugongs were observed in the Upper East Arm of Darwin Harbour during D3, some dugongs were sighted around Blaydin Point and Channel Island during sampling done at the corresponding time of the year during the Baseline Phase (i.e. B2). This disparity resulted in an estimated change in density for that area to be in excess of many other areas inside and outside Darwin Harbour. However, decreases in dugong density of similar extent were also apparent for areas well away from dredging activities (i.e. west arm). This inter-
Routine Turtle and Dugong Monitoring Program Report – Dredging Report 3 Ichthys Nearshore Environmental Monitoring Program
Prepared for INPEX Cardno 54
survey variability may be a function of re-distribution of animals resulting from short-term movement in and out of specific areas, possibly due to avoidance behaviour and/or the pursuit of more optimal foraging areas.
As observed during previous surveys, the highest densities of dugong sightings during D3 were recorded in Shoal Bay and Hope Inlet in IM, which corresponds with the presence of a large seagrass area dominated by Halophila decipiens (Geo Oceans 2013b). Seagrass habitat mapping surveys in the IM block (conducted every three months as part of the Seagrass Monitoring Program) have indicated that ephemeral H. decipiens seagrass beds are usually present in the area between Charles Point and Lee Point from approximately May to October. This genus of seagrass has been recognised as a preferred food source of dugongs and is possibly actively selected by dugongs over other seagrass species on the basis of higher nutritional value, nitrogen content and less inedible fibre (Preen 1993). The consistently high concentrations of dugongs in habitats with known H. decipiens beds such as around Lee Point and Shoal Bay indicate these areas are likely to be important foraging grounds for dugongs. Lanyon (2003) has suggested that the repeated regrazing of particular areas by dugongs could be described as a form of ‘cultivation grazing’ that could serve to maintain the nutritional quality of their seagrass diet (Preen 2005).
4.1.2 Turtles
Five hundred and twenty nine turtles were sighted during D3, which was approximately 17% lower than the average number of turtles sighted per survey during the Baseline Phase (634 turtles), and approximately 16% lower than the number of sightings during D2 in May 2013 (627 turtles). Turtle sightings during D3 were also slightly lower (by ~10%) than the number recorded during B2 (585 turtles), undertaken at the same time of year (July) in 2012.
The average number of turtle sightings per replicate flight was similar across all surveyed areas (C1: 58, IM: 54, C2: 64) during D3, and generally lower than corresponding averages for Baseline Phase surveys (65, 86, and 87 turtle sightings, respectively). In the case of IM, the mean turtle sightings per flight during D3 was approximately 12% lower compared to the B2 average (69 turtles per flight), while for blocks C1 and C2 the D3 average was similar to that recorded for B2 (62 and 64 turtles, respectively). Mean turtle population estimates for D3 were lower than the average of the Baseline Phase population estimates for all three blocks and in the cases of both population estimation methods (Marsh and Sinclair (1989) and Pollock et al. (2006)). However, population estimates for Baseline Phase surveys was highly variable.
Statistical analyses of density of turtle sightings revealed no significant difference in density between Impact and Control Treatments in either Phase or between Baseline and Dredging Phases for either Treatment, indicating that there is no evidence that the spatial and temporal patterns in turtle densities in the region have been affected by dredging. In contrast, the density of turtles based on raw observations was significantly higher during D2 compared to D3 and higher in B3 compared to either B1 or B2. Inter-survey temporal variation in turtle densities could be a result of short-term movements in and out of specific areas or due to the ongoing pursuit of optimal foraging grounds.
The smaller-scale spatial distribution of turtles within each block was generally similar during D3 compared with the Baseline Phase. Turtle sightings to date have most frequently been recorded within relatively shallow water habitats. Where benthic habitat type has been identified, turtle sightings have primarily been recorded over reef, sand and seagrass. Known foraging habitats of green turtles include coral and rocky reefs, and inshore areas that support algae and/or seagrass growth (Whiting 2000; Limpus 2008). The spatial distribution of turtle sightings may therefore have been influenced by the distribution of habitats in which they forage. Similarly, the inter-survey variability in turtle density observed for areas inside and outside Darwin Harbour may also be a result of such patterns in behaviour. It is unclear whether the turtles sighted in deeper waters were travelling between shallow water locations or foraging within unsurveyed habitats.
Density estimates of turtles in D3 (across both population estimation methods) ranged from approximately 0.4 turtles per km2 in C2, to approximately 0.8 per km2 in C1. These values are generally similar to those reported in Shark Bay, Western Australia (0.4 per km2, Preen et al. 1997), but lower than those reported for the Torres Straight (2.1 per km2, Marsh and Lawler 1992).

Routine Turtle and Dugong Monitoring Program Report – Dredging Report 3 Ichthys Nearshore Environmental Monitoring Program
Prepared for INPEX Cardno 55
4.1.3 Block vs. sub-block population and variance estimates
The dugong and turtle population size estimates derived for each block during D3 (and previous surveys (Cardno 2012a, 2013b, c)) have been quite imprecise. Partitioning of survey blocks into non-overlapping sub-blocks that each comprise of relatively homogeneous characteristics (i.e. habitat type and depth profile) has the potential to reduce imprecision associated with these estimates (Cochran 1963).
Mean turtle population estimates and associated variances for each block in D3 were lower when calculated by combining sub-block estimates compared to when derived from whole block estimates for both population estimation methods (i.e. Marsh and Sinclair (1989) and Pollock et al. (2006)). In contrast, mean dugong population estimates based on sub-blocks were higher than those based on whole block estimates at both IM and C1 when the Pollock et al. (2006) method was used, but only in IM when the Marsh and Sinclair (1989) method was used. Variances associated with dugong population estimates derived by the combination of sub-blocks were similar to those derived from whole blocks regardless of the population estimation method used. The Marsh and Sinclair (1989) and Pollock et al. (2006) population estimation methods used to determine dugong and turtle population sizes are sensitive to small sample sizes and become increasingly unreliable and variable as fewer animal sightings are recorded. Unlike the whole block population estimates, sub-block population estimates for dugongs were calculated when fewer than five sightings were recorded, and in the cases of C1-3, IM-2, IM-3 and IM-6, calculated when only one individual dugong was sighted. Hence, producing dugong population estimates by combining sub-block estimates with few sightings probably contributed to the relatively higher population estimates compared to whole block estimates, which were only calculated when only five or more dugong sighting were recorded. The precision associated with dugong population estimates derived from the combination of sub-block estimates and whole block estimates were not substantially different. As few sub-blocks within each of the three sampling locations have recorded greater than five dugong sightings during a particular replicate flight, it is unlikely that partitioning of whole blocks into sub-blocks would reduce the variance associated with dugong population estimates or provide more accurate estimates of the dugong population size if applied to data recorded during future surveys.
The precision associated with turtle population estimates derived from the combination of sub-block estimates was higher than for those derived via whole block estimates, for all three blocks. Unlike dugongs, turtle sightings were more frequent and, with the exception of C2-1 during replicate flight three, tallied to more than five sightings for any replicate flight within any particular sub-block. The non-uniform distribution and abundance of turtles within blocks likely facilitated the observed reduction in variance associated with estimated population sizes based on sub-blocks compared to whole block population estimates. If the distribution of turtles remains non-uniform during future surveys, combining sub-block population estimates may prove beneficial in improving precision associated with turtle population estimates.
4.2 Land Surveys One dugong was sighted off the rock wall at Cullen Bay on each of the two days of land observations (30 July 2013 and 3 August 2013) during D3, while no turtles were observed during the same period. The dugongs were observed close to mapped Halodule seagrass habitat (Geo Oceans 2013a). The long diving times observed within this area indicated that these dugongs may have been foraging during this observational period. Several dolphins were also sighted in the area, displaying distinctive foraging behaviour. At Channel Island Bridge, 280 individual turtles were sighted during D3. The majority of these turtles were identified as green turtles and many of these classified as juveniles. In contrast to Cullen Bay rock wall observations, no dugongs were observed from Channel Island Bridge. The large number of turtle observations recorded at Channel Island Bridge indicated that Channel Island may provide an important habitat for turtles, with the extensive reef habitat surrounding Channel Island possibly providing important foraging grounds.
4.3 Rehabilitated Turtle Update To date, no satellite tagging of rehabilitated turtles has been conducted as part of the TDMP. The ten turtles that have been rehabilitated and released by Arafura Timor Research Facility or DLRM since the start of the TDMP have proved unsuitable for tagging due to severe injuries or having originated from areas outside Darwin Harbour. Assessments of the suitability of rehabilitated turtles for satellite tagging will continue as part of the TDMP.

Routine Turtle and Dugong Monitoring Program Report – Dredging Report 3 Ichthys Nearshore Environmental Monitoring Program
Prepared for INPEX Cardno 56
5 Conclusions
It is important to gain a comprehensive spatial and temporal understanding of abundance, density and distribution of dugongs and turtles in Darwin Harbour and surrounding locations, especially during potential disturbance events. Aerial surveys have been appropriate for the collection of broad-scale data to meet this objective and the broad objectives of the TDMP.
Aerial surveys during D3 (July 2013 and August 2013) resulted in 71 and 529 individual sightings of dugongs and turtles respectively. The number of dugong and turtle sightings was slightly lower during D3 compared to the Baseline Phase survey completed at the corresponding time of year (B2 – July/August 2012) at each of the three locations sampled, although there is no clear evidence to suggest that the distribution or abundance of these animals have changed as a consequence of dredging activities. The temporal and spatial variation in dugong and turtle distribution and abundance observed may be a result of movement in and out of specific areas, possibly due to avoidance behaviour and/or the pursuit of more optimal foraging areas.
Dugong sightings within IM were concentrated within the Shoal Bay area between Lee Point and Charles Point. As per previous surveys, the patchy distribution of dugongs within IM may be associated with the distribution of seagrass beds in the area, which could serve as foraging areas. Similarly, many turtle sightings were recorded in association with habitats such as reefs, sand and seagrass, which they may use as foraging areas. These observations indicate that the spatial and temporal distribution of both dugongs and turtles is most likely strongly influenced by the availability of suitable foraging habitats.
Aerial survey blocks were further partitioned into non-overlapping sub-blocks comprised of relatively homogeneous characteristics (i.e. habitat type and depth profile), with the aim of reducing imprecision associated with block population estimates. Variances associated with dugong block population estimates derived via sub-blocks were similar to those derived from whole block estimates regardless of the population estimation method used. Conversely, the non-uniform distribution and abundance of turtles within blocks facilitated an observed reduction in variance associated with estimated population sizes based on sub-blocks compared to whole block population estimates. If the distribution of turtles remains non-uniform during future surveys, combining sub-block population estimates may prove beneficial in improving precision associated with turtle block population estimates.
Continued monitoring of the distribution and abundance of dugongs and turtles within Darwin Harbour and surrounding locations will provide a strong foundation with which to investigate long-term trends during the dredging and post dredging phases of the Project.

Routine Turtle and Dugong Monitoring Program Report – Dredging Report 3 Ichthys Nearshore Environmental Monitoring Program
Prepared for INPEX Cardno 57
6 Acknowledgements
This report was written by Dr Michelle Blewitt, Megan Rice and Dr Lachlan Barnes, and reviewed by Dr Will Macbeth and Dr Craig Blount. Fieldwork was undertaken by Megan Rice, Dr Glenn Dunshea, Dr Susan Gibbs, Barry Krueger and Paul Tod. GIS support was provided by Amy Steiger and the Wollongong Cardno team. Data analysis was undertaken by Dr Glenn Dunshea, Dr Lachlan Barnes, Megan Rice and Dr Michelle Blewitt. The figures, tables and appendices were prepared by Dr Lachlan Barnes, Megan Rice and Dr Michelle Blewitt. The TDMP was reviewed by Professor Helene Marsh from James Cook University. The authors would like to thank the Ichthys Project Dredging Expert Panel (IPDEP) members for constructive criticism throughout the ongoing monitoring program.
Routine Turtle and Dugong Monitoring Program Report – Dredging Report 3 Ichthys Nearshore Environmental Monitoring Program
Prepared for INPEX Cardno 58
7 References Anderson, M.J. (2001). A new method for non-parametric multivariate analysis of variance. Austral Ecology 26, pp. 32-46.
Bayliss, P. and Freeland, W.J. (1989). Seasonal distribution and abundance of dugongs in the Western Gulf of Carpentaria. Australian Wildlife Research 16, pp. 141-149.
Cardno (2012a). Turtle and Dugong Monitoring Program Baseline Report. Ichthys Nearshore Environmental Monitoring Program. Prepared for INPEX. November 2012, pp. 338.
Cardno (2013a). Nearshore Environmental Monitoring Plan (Rev. 2). Prepared for INPEX. Cardno (NSW/ACT) Pty Ltd, Sydney.
Cardno (2013b). Routine Turtle and Dugong Monitoring Program Report – Dredging Report 1. Ichthys Nearshore Environmental Monitoring Program. Prepared for INPEX. January 2013, pp. 226.
Cardno (2013c). Routine Turtle and Dugong Monitoring Program Report – Dredging Report 2. Ichthys Nearshore Environmental Monitoring Program. Prepared for INPEX. July 2013, pp. 110.
Chatto, R. and Baker, B. (2008). The Distribution and Status of Marine Turtle Nesting in the Northern Territory. Technical Report 77. Parks and Wildlife Service, Department of Natural Resources, Environment, The Arts and Sport.
Cochran, W.G. (1963). Sampling Techniques, 2nd Ed., John Wiley and Sons, New York.
Geo Oceans (2012). Ichthys Nearshore Environmental Monitoring Program: Seagrass Habitat Monitoring Survey, October 2012. Technical Report. Prepared for Cardno on behalf of INPEX, November 2012.
Geo Oceans (2013a). Ichthys Nearshore Environmental Monitoring Program: Seagrass Habitat Monitoring Survey, July 2013. Technical Report. Prepared for Cardno on behalf of INPEX, June 2013.
Geo Oceans (2013b). Ichthys Nearshore Environmental Monitoring Program: Seagrass Habitat Monitoring Survey, October 2013. Technical Report. Prepared for Cardno on behalf of INPEX, October 2013.
Hodgson, A., Marsh, H., Marsh, L., Grech, A., McMahon, A. and Parra, G. (2011). Dugong Aerial Survey Manual. James Cook University, Townsville.
INPEX (2012). Dredging and Spoil Disposal Management Plan - East Arm. INPEX Operations Australia Pty Ltd.
Lanyon, J.M. (1991). The nutritional ecology of the dugong (Dugong dugon) in tropical north Queensland. Ph.D. Thesis, Monash University, Melbourne.
Lanyon, J.M. (2003). Distribution and abundance of dugongs in Moreton Bay, Queensland, Australia. Wildlife Research 30, pp. 397-409.
Limpus, C.J. (2008). Green turtle, Chelonia mydas (Linnaeus). In: A Biological Review of Australian Marine Turtles. Queensland Government Environmental Protection Agency.
Limpus, C.J. and Chaloupka, M. (1997). Nonparametric regression modelling of green sea turtle growth rates (southern Great Barrier Reef). Marine Ecology Progress Series 149, pp. 23-34.
Makowski, C., Seminoff, J.A. and Salmon, M. (2006). Home range and habitat use of juvenile Atlantic green turtles (Chelonia mydas L.) on shallow reef habitats in Palm Beach, Florida, USA. Marine Biology. 148, pp. 1167-1179.
Marsh, H. and Lawler, I. (1992). The Status of Dugongs, Sea Turtles and Dolphins in the Torres Strait Region. Report to The Australian Fish Management Authority., June 1992.
Marsh, H. and Sinclair, D.F. (1989). Correcting for visibility bias in strip transect aerial surveys of aquatic fauna. Journal of Wildlife Management 53, pp. 1017-1024.
Marsh, H., Penrose, H., Eros, C. and Hughes, J. (2002). Dugong: status reports and action plans for countries and territories in its range. Cambridge, UK: IUCN.
Pollock, K., Marsh, H., Lawler, I. R. and Alldredge, M.W. (2006). Estimating animal abundance in heterogeneous environments: an application to aerial surveys for dugongs. Journal of Wildlife Management 70, pp. 255-262.
Preen, A.R. (1993). Interactions between dugongs and seagrasses in a sub-tropical environment. Ph.D. Thesis, James Cook University, Townsville.
Preen, A. (1995). Impacts of dugong foraging on seagrass habitats: observational and experimental evidence for cultivation grazing. Marine Ecology Progress Series 124, pp. 201-213.
Preen A.R., Marsh, H., Lawler, I.R., Prince, R.I.T. and Shepherd, R. (1997). Distribution and abundance of dugongs, turtles, dolphins and other megafauna in Shark Bay, Ningaloo Reef and Exmouth Gulf, Western Australia. Wildlife Research 24, pp. 185-208.

Routine Turtle and Dugong Monitoring Program Report – Dredging Report 3 Ichthys Nearshore Environmental Monitoring Program
Prepared for INPEX Cardno 59
Whiteway, T. (2009). Australian Bathymetry and Topography Grid. Geoscience Australia.
Whiting, S.D. (2000). ‘The ecology of immature green and hawksbill turtles foraging on two reef systems in northern Australia’, Ph.D. Thesis. Northern Territory University, Darwin.
Whiting, S.D. (2004). Conserving dugongs in Darwin Harbour. Report to Natural Heritage Trust, Coast and Clean Seas Project, #28491.

Routine Turtle and Dugong Monitoring Program Report- Dredging Report 3 Ichthys Nearshore Environmental Monitoring Program
Prepared for INPEX Cardno 1
Ichthys Nearshore Environmental Monitoring Program
APPENDIX A SUMMARY OF AERIAL SURVEY EFFORT DURING BASELINE AND DREDGING PHASE SURVEYS

Routine Turtle and Dugong Monitoring Program Report- Dredging Report 3 Ichthys Nearshore Environmental Monitoring Program
Prepared for INPEX Cardno 61
Appendix A: Summary of aerial survey effort for each block (C1, IM and C2) during Baseline and Dredging Phase surveys
Bynoe Harbour (C1) Darwin Harbour (IM) Vernon Islands (C2)
Baseline Survey Period B1 B2 B3 D2 D3 B1 B2 B3 D2 D3 B1 B2 B3 D2 D3
Number of transects 20 20 20 20 20 - 22^ 29 27 27 27 27 21 22 22 22 22 - 19^
Total length transectsª (km) 299.5 350.3 349.5 349.5 348.37 -
344.94^ 524.4 517.4 517.1 517.1 519.06 469.6 491.9 491.9 491.9 429.01 - 482.85^
Total sampled area (km²) 119.8 140.1 139.8 139.8 139.35 - 137.98^ 209.8 207 206.8 206.8 207.62 187.9 196.8 196.7 196.7 196.7 -
204.2^
Overall surveyed area (km²) 793.2 849 812.3 812.3 734.01 1210.6 1164.9 1140.5 1140.5 1105.96 1024.9 1025.5 1021 1021 1010.48
Proportion surveyed* (%) 15.1 16.5 17.2 17.2 19.0 - 18.8^ 17.3 17.8 18.1 18.1 18.8 18.3 19.2 19.3 19.3 19.5 - 20.2
Average survey duration (h: min: sec) 0:54:17 1:23:23 1:27:53 1:06:32 1:28:45 1:25:47 1:25:36 1:26:55 1:36:53 2:21:30 1:36:17 1:12:08 1:20:3
6 1:15:09 1:28:51
ª Transect length over water. * The proportion of surveyed area is averaged in the calculation of total area surveyed. B1 = 2 replicates, B2 and B3 = 3 replicates; D2 = 2/3 replicates. ^ Variation due to flight orientation.

Routine Turtle and Dugong Monitoring Program Report- Dredging Report 3 Ichthys Nearshore Environmental Monitoring Program
Prepared for INPEX Cardno 62
Ichthys Nearshore Environmental Monitoring Program
APPENDIX B SUMMARY OF DUGONG SIGHTINGS ACROSS DREDGING AND BASELINE PHASE SURVEYS

Routine Turtle and Dugong Monitoring Program Report- Dredging Report 3 Ichthys Nearshore Environmental Monitoring Program
Prepared for INPEX Cardno 63
Appendix B: Summary of the number of dugongs recorded during Dredging and Baseline Phase
All areas Total sightings
Survey period D3 B1 B2 B3 D2
Replication number R1 R2 R3 Total Number of observations 20 17 15 52 45 62 81 28
Number of animals 30 21 20 71 58 92 113 33
Number of calves 2 1 1 4 4 7 2 1
Maximum group size 4 3 2 4 3 4 7 3
Bynoe Harbour (C1) Total sightings
Survey period D3 B1 B2 B3 D2
Replication number R1 R2 R3 Total Number of observations 3 5 3 11 14 14 15 6
Number of animals 8 7 4 19 14 21 21 6
Number of calves 0 1 0 1 1 0 0 0
Maximum group size 4 3 2 4 1 3 3 1
Darwin Harbour (IM) Total sightings
Survey period D3 B1 B2 B3 D2
Replication number R1 R2 R3 Total Number of observations 13 9 10 32 16 29 42 14
Number of animals 17 10 12 39 25 43 65 16
Number of calves 1 0 0 1 2 5 2 1
Maximum group size 2 2 2 2 2 4 7 3
Vernon Islands (C2) Total sightings
Survey period D3 B1 B2 B3 D2
Replication number R1 R2 R3 Total Number of observations 4 3 2 9 15 19 24 8
Number of animals 5 4 4 13 19 28 27 11
Number of calves 1 0 1 2 1 2 0 0
Maximum group size 2 2 2 2 3 4 2 3 B1= 2 replicate flights; D2= 2-3 replicate flights; B2, B3, D3 = 3 replicate flights

Routine Turtle and Dugong Monitoring Program Report- Dredging Report 3 Ichthys Nearshore Environmental Monitoring Program
Prepared for INPEX Cardno 69
Ichthys Nearshore Environmental Monitoring Program
APPENDIX C SUMMARY OF TURTLE AND DUGONG SIGHTINGS OVERLAID WITH CONFIRMED SEAGRASS HABITAT DURING B2 AND D3 SURVEYS

Routine Turtle and Dugong Monitoring Program Report- Dredging Report 3 Ichthys Nearshore Environmental Monitoring Program
Prepared for INPEX Cardno 65
Appendix C: Distribution of dugongs and turtles in Darwin Harbour (IM) in July 2012 (B2) and July 2013 (D3), overlaid with confirmed seagrass habitat (seagrass data for June 2012 and August 2013, respectively: Geo Oceans 2013)

Routine Turtle and Dugong Monitoring Program Report- Dredging Report 3 Ichthys Nearshore Environmental Monitoring Program
Prepared for INPEX Cardno 2
Ichthys Nearshore Environmental Monitoring Program
APPENDIX D DUGONG POPULATION SIZE ESTIMATES DURING DREDGING AND BASELINE PHASE SURVEYS

Routine Turtle and Dugong Monitoring Program Report- Dredging Report 3 Ichthys Nearshore Environmental Monitoring Program
Prepared for INPEX Cardno 67
Appendix D: Comparison of dugong population size estimates (±SE) during Baseline Phase (B1 (May 2012), B2 (July 2012) and B3 (September 2012 and October 2012)) and Dredging Phase (D2 (May 2013) and D3 (July 2013 and August 2013)) Marsh and Sinclair (1989) Pollock et al. (2006)
Block Month Replicate Estimate ± SE Estimate ± SE
C1
June (B1) 1 238 86 121 87 2 114 40 100 83 3 - - - -
July (B2) 1 - - - - 2 - - - - 3 287 65 424 206
September/October (B3)
1 81 74 68 35 2 232 149 122 51 3 - - - -
May (D2) 1 - - - - 2 - - - - 3 - - - -
July (D3) 1 - - - - 2 134 58 48 12 3 - - - -
C2
June (B1) 1 252 85 130 71 2 124 45 98 79 3 - - - -
July (B2) 1 - - - - 2 - - - - 3 325 78 273 139
September/October (B3)
1 99 42 76 30 2 337 103 162 42 3 - - - -
May (D2) 1 - - - - 2 93 45 67 26 3 - - - -
July (D3) 1 - - - - 2 - - - - 3 - - - -
IM
June (B1) 1 254 76 128 67 2 232 56 185 121
3 - - - -
July (B2) 1 461 138 223 111 2 361 139 274 180 3 - - - -
September/October (B3)
1 485 161 434 82 2 364 185 180 56 3 353 207 190 69
May (D2) 1 - - - - 2 - - - - 3 99 48 90 37
July (D3) 1 331 209 195 71 2 226 113 139 54 3 391 248 167 62
Routine Turtle and Dugong Monitoring Program Report- Dredging Report 3 Ichthys Nearshore Environmental Monitoring Program
Prepared for INPEX Cardno 2
Ichthys Nearshore Environmental Monitoring Program
APPENDIX E CORRECTED DUGONG DENSITIES DURING DREDGING AND BASELINE PHASE SURVEYS

Routine Turtle and Dugong Monitoring Program Report- Dredging Report 3 Ichthys Nearshore Environmental Monitoring Program
Prepared for INPEX Cardno 69
Appendix E: Dugong density (±SE) for blocks C1, C2 and IM during the Baseline Phase (B1 (May 2012), B2 (July 2012) and B3 (September 2012 and October 2012)) and Dredging Phase (D2 (May 2013) and D3 (July 2013)) using the Marsh and Sinclair (1989) and the Pollock et al. (2006) methods and raw data
Marsh and Sinclair (1989) Pollock et al. (2006) Raw
Block Month Replicate Estimate ± SE Estimate ± SE
C1
June (B1) 1 0.3 0.11 0.15 0.11 0.07 2 0.14 0.05 0.12 0.1 0.05 3 - - - -
July (B2) 1 - - - - - 2 - - - - - 3 0.34 0.08 0.5 0.24 0.11
September/October (B3)
1 0.10 0.09 0.08 0.04 0.04 2 0.29 0.18 0.15 0.06 0.06 3 - - - - -
May (D2) 1 - - - - - 2 - - - - - 3 - - - - -
July (D3) 1 - - - - - 2 0.16 0.07 0.06 0.01 0.05 3 - - - - -
C2
June (B1) 1 0.25 0.08 0.13 0.07 0.06 2 0.12 0.04 0.1 0.08 0.04 3 - - - - -
July (B2) 1 - - - - - 2 - - - - - 3 0.32 0.08 0.27 0.14 0.11
September/October (B3)
1 0.10 0.04 0.07 0.03 0.04 2 0.33 0.10 0.16 0.04 0.09 3 - - - - -
May (D2) 1 - - - - 0.02 2 0.09 0.04 0.07 0.03 0.04 3 - - - - -
July (D3) 1 - - - - - 2 - - - - - 3 - - - - -
IM
June (B1) 1 0.21 0.06 0.11 0.06 0.05 2 0.19 0.05 0.15 0.1 0.07 3 - - - - -
July (B2) 1 0.36 0.11 0.17 0.09 0.10 2 0.31 0.12 0.24 0.15 0.08 3 - - - - -
September/October (B3)
1 0.43 0.14 0.38 0.07 0.17 2 0.32 0.16 0.16 0.05 0.08 3 0.31 0.18 0.17 0.06 0.07
May (D2) 1 - - - - - 2 - - - - - 3 0.09 0.04 0.08 0.03 0.04
July (D3) 1 0.29 0.18 0.17 0.06 0.08 2 0.2 0.1 0.12 0.05 0.05 3 0.34 0.22 0.15 0.05 0.06

Routine Turtle and Dugong Monitoring Program Report- Dredging Report 3 Ichthys Nearshore Environmental Monitoring Program
Prepared for INPEX Cardno 70
Ichthys Nearshore Environmental Monitoring Program
APPENDIX F DUGONG SUB-BLOCK POPULATION SIZE ESTIMATES DURING D3 AERIAL SURVEYS

Routine Turtle and Dugong Monitoring Program Report- Dredging Report 3 Ichthys Nearshore Environmental Monitoring Program
Prepared for INPEX Cardno 71
Appendix F: Dugong sub-block population size estimates (±SE) within: a) IM; and b) C1 during D3 aerial surveys (July 2013 and August 2103) (no sub-block population estimates were calculated for C2 due to limited sightings, C1 estimates were only calculated for C1 in Rep 2)
a)
IM Marsh and Sinclair (1989) Pollock et al. (2006)
Replicate Sub-Block Sightings in Transect Estimate ± SE Estimate ± SE
1 1 0 - - - -
1 2 0 - - - -
1 3 1 20 17 13 4
1 4 10 258 78 169 66
1 5 0 - - - -
1 6 0 - - - -
Combined 11 278 80 182 66
2 1 0 - - - -
2 2 1 20 17 13 4
2 3 1 20 19 13 3
2 4 6 150 90 91 35
2 5 0 - - - -
2 6 1 19 18 12 4
Combined 9 209 95 129 36
3 1 0 - - - -
3 2 0 - - - -
3 3 2 50 43 25 6
3 4 8 238 128 130 41
3 5 0 - - - -
3 6 0 - - - -
Combined 11 288 135 155 41
b)
C1 Marsh and Sinclair (1989) Pollock et al. (2006)
Replicate Sub-Block Sightings in Transect Estimate ± SE Estimate ± SE
2 1 0 - - - -
2 2 4 85 45 76 19
2 3 1 29 27 12 3
2 4 0 - - - -
Combined 5 114 52 88 19

Routine Turtle and Dugong Monitoring Program Report- Dredging Report 3 Ichthys Nearshore Environmental Monitoring Program
Prepared for INPEX Cardno 72
Ichthys Nearshore Environmental Monitoring Program
APPENDIX G CORRECTED DUGONG SUB-BLOCK DENSITIES DURING D3 AERIAL SURVEYS
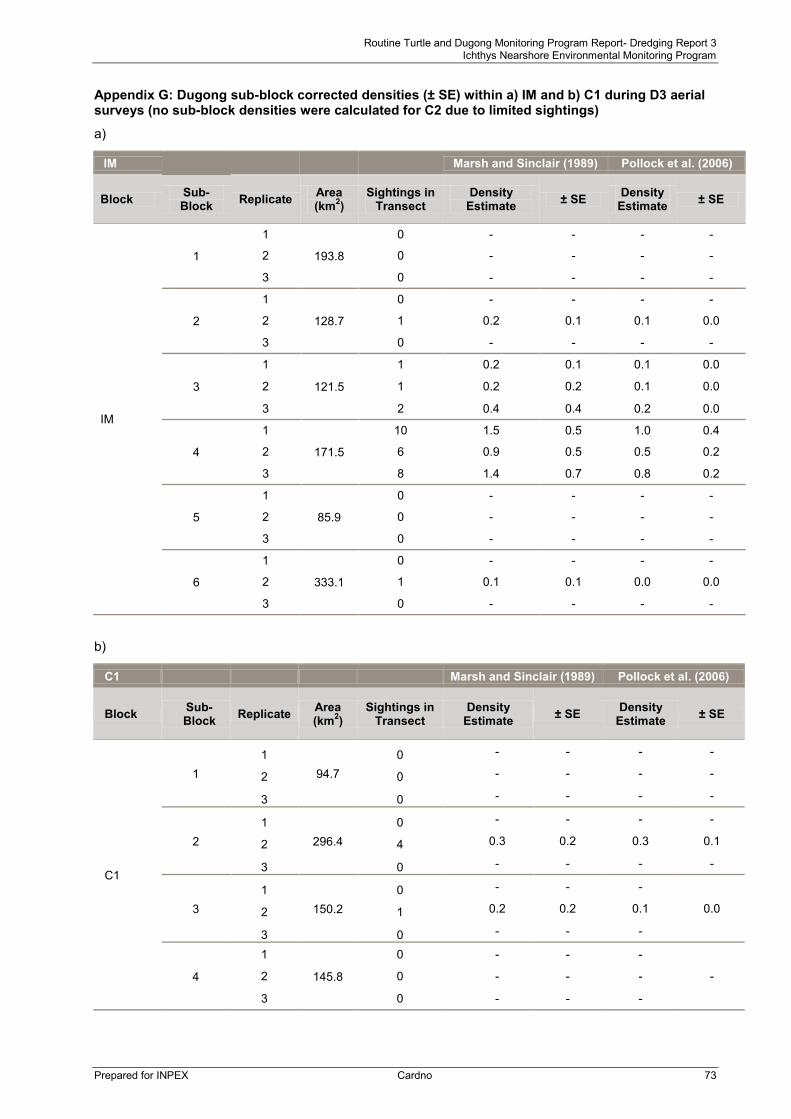
Routine Turtle and Dugong Monitoring Program Report- Dredging Report 3 Ichthys Nearshore Environmental Monitoring Program
Prepared for INPEX Cardno 73
Appendix G: Dugong sub-block corrected densities (± SE) within a) IM and b) C1 during D3 aerial surveys (no sub-block densities were calculated for C2 due to limited sightings)
a)
IM Marsh and Sinclair (1989) Pollock et al. (2006)
Block Sub-Block Replicate Area
(km2) Sightings in
Transect Density
Estimate ± SE Density Estimate ± SE
IM
1
1
193.8
0 - - - -
2 0 - - - -
3 0 - - - -
2
1
128.7
0 - - - -
2 1 0.2 0.1 0.1 0.0
3 0 - - - -
3
1
121.5
1 0.2 0.1 0.1 0.0
2 1 0.2 0.2 0.1 0.0
3 2 0.4 0.4 0.2 0.0
4
1
171.5
10 1.5 0.5 1.0 0.4
2 6 0.9 0.5 0.5 0.2
3 8 1.4 0.7 0.8 0.2
5
1
85.9
0 - - - -
2 0 - - - -
3 0 - - - -
6
1
333.1
0 - - - -
2 1 0.1 0.1 0.0 0.0
3 0 - - - -
b)
C1 Marsh and Sinclair (1989) Pollock et al. (2006)
Block Sub- Block Replicate Area
(km2) Sightings in
Transect Density
Estimate ± SE Density Estimate ± SE
C1
1 1
94.7 0 - - - -
2 0 - - - -
3 0 - - - -
2 1
296.4 0 - - - -
2 4 0.3 0.2 0.3 0.1
3 0 - - - -
3 1
150.2 0 - - -
2 1 0.2 0.2 0.1 0.0
3 0 - - -
4
1
145.8
0 - - - 2 0 - - - -
3 0 - - -

Routine Turtle and Dugong Monitoring Program Report- Dredging Report 3 Ichthys Nearshore Environmental Monitoring Program
Prepared for INPEX Cardno 74
Ichthys Nearshore Environmental Monitoring Program
APPENDIX H SUMMARY OF TURTLE SIGHTINGS ACROSS DREDGING AND BASELINE PHASE SURVEYS

Routine Turtle and Dugong Monitoring Program Report- Dredging Report 3 Ichthys Nearshore Environmental Monitoring Program
Prepared for INPEX Cardno 75
Appendix H: Summary of the number of turtles recorded during Baseline Phase and Dredging Surveys All Areas Total sightings
Survey period D3 B1 B2 B3 D2
Replication number R1 R2 R3 Total Number of observations 153 171 194 518 323 567 903 597
Number of animals 154 175 200 529 334 585 984 627
Maximum group size 2 2 4 4 2 2 4 5
Bynoe Harbour (C1) Total sightings
Survey period D3 B1 B2 B3 D2
Replication number R1 R2 R3 Total Number of observations 58 57 57 172 52 181 266 250
Number of animals 58 58 57 173 52 187 282 273
Maximum group size 1 2 1 2 1 3 3 5
Darwin Harbour (IM) Total sightings
Survey period D3 B1 B2 B3 D2
Replication number R1 R2 R3 Total Number of observations 50 54 57 161 126 200 299 184
Number of animals 50 54 57 161 132 206 349 188
Maximum group size 1 1 1 1 2 2 4 2
Vernon Islands (C2) Total sightings
Survey period D3 B1 B2 B3 D2
Replication number R1 R2 R3 Total Number of observations 45 60 80 185 145 186 338 163
Number of animals 46 63 86 195 150 192 353 166
Maximum group size 2 2 4 4 2 2 3 4 B1 = 2 replicate flights; D2= 2-3 replicate flights; B2, B3, D3 = 3 replicate flights

Routine Turtle and Dugong Monitoring Program Report- Dredging Report 3 Ichthys Nearshore Environmental Monitoring Program
Prepared for INPEX Cardno 69
Ichthys Nearshore Environmental Monitoring Program
APPENDIX I TURTLE POPULATION SIZE ESTIMATES DURING DREDGING AND BASELINE PHASE SURVEYS
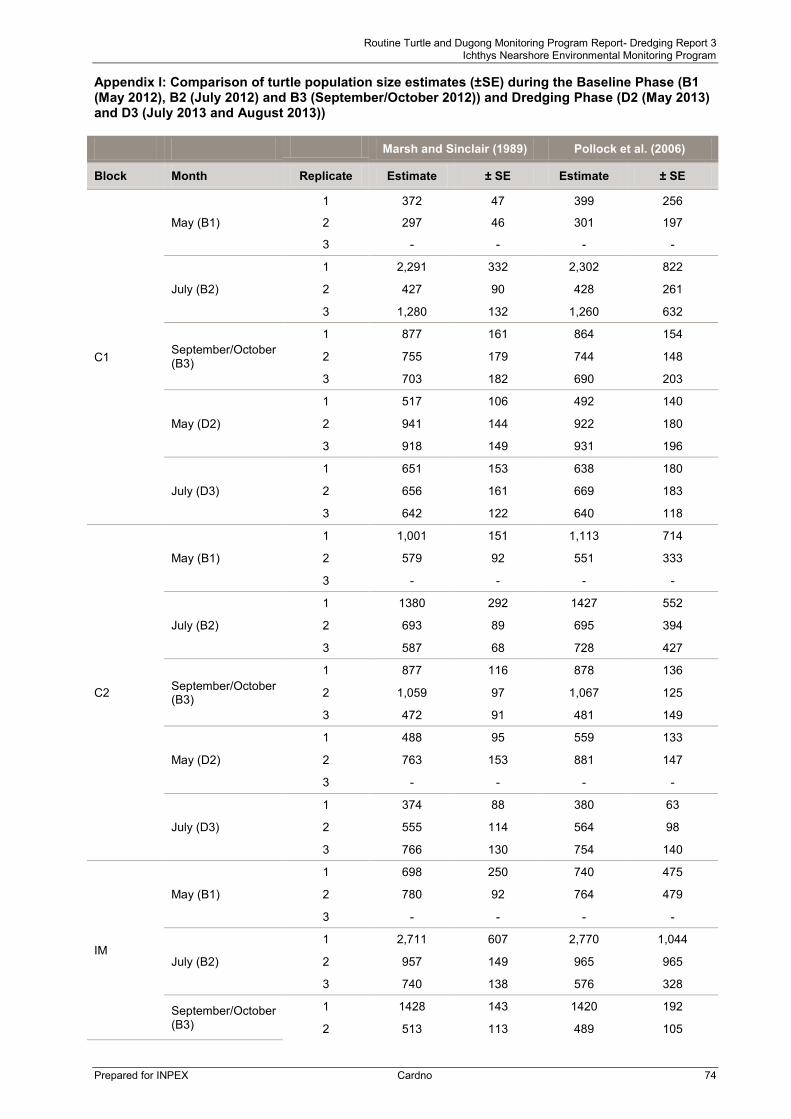
Routine Turtle and Dugong Monitoring Program Report- Dredging Report 3 Ichthys Nearshore Environmental Monitoring Program
Prepared for INPEX Cardno 74
Appendix I: Comparison of turtle population size estimates (±SE) during the Baseline Phase (B1 (May 2012), B2 (July 2012) and B3 (September/October 2012)) and Dredging Phase (D2 (May 2013) and D3 (July 2013 and August 2013)) Marsh and Sinclair (1989) Pollock et al. (2006)
Block Month Replicate Estimate ± SE Estimate ± SE
C1
May (B1)
1 372 47 399 256
2 297 46 301 197
3 - - - -
July (B2)
1 2,291 332 2,302 822
2 427 90 428 261
3 1,280 132 1,260 632
September/October (B3)
1 877 161 864 154
2 755 179 744 148
3 703 182 690 203
May (D2)
1 517 106 492 140
2 941 144 922 180
3 918 149 931 196
July (D3)
1 651 153 638 180
2 656 161 669 183
3 642 122 640 118
C2
May (B1)
1 1,001 151 1,113 714
2 579 92 551 333
3 - - - -
July (B2)
1 1380 292 1427 552
2 693 89 695 394
3 587 68 728 427
September/October (B3)
1 877 116 878 136
2 1,059 97 1,067 125
3 472 91 481 149
May (D2)
1 488 95 559 133
2 763 153 881 147
3 - - - -
July (D3)
1 374 88 380 63
2 555 114 564 98
3 766 130 754 140
IM
May (B1)
1 698 250 740 475
2 780 92 764 479
3 - - - -
July (B2)
1 2,711 607 2,770 1,044
2 957 149 965 965
3 740 138 576 328
September/October (B3)
1 1428 143 1420 192
2 513 113 489 105

Routine Turtle and Dugong Monitoring Program Report- Dredging Report 3 Ichthys Nearshore Environmental Monitoring Program
Prepared for INPEX Cardno 75
Marsh and Sinclair (1989) Pollock et al. (2006)
Block Month Replicate Estimate ± SE Estimate ± SE
3 662 112 652 178
May (D2)
1 287 54 315 68
2 391 69 425 98
3 557 89 559 132
July (D3)
1 667 156 677 109
2 645 157 633 98
3 612 153 613 96

Routine Turtle and Dugong Monitoring Program Report- Dredging Report 3 Ichthys Nearshore Environmental Monitoring Program
Prepared for INPEX Cardno 69
Ichthys Nearshore Environmental Monitoring Program
APPENDIX J CORRECTED TURTLE DENSITIES DURING DREDGING AND BASELINE PHASE SURVEYS

Routine Turtle and Dugong Monitoring Program Report- Dredging Report 3 Ichthys Nearshore Environmental Monitoring Program
Prepared for INPEX Cardno 77
Appendix J: Turtle density (± SE) for blocks C1, C2 and IM during Baseline Phase surveys (B1 (May 2012), B2 (July 2012) and B3 (Sept. /Oct. 2013)) and Dredging (D2 (May 2013) and D3 (July 2013)) and using the Marsh and Sinclair (1989), Pollock et al. (2006) methods, and the raw data Marsh and Sinclair (1989) Pollock et al. (2006) Raw data
Block Month Replicate Estimate ± SE Estimate ± SE
C1
June (B1)
1 0.47 0.06 0.50 0.32 0.23
2 0.37 0.06 0.37 0.25 0.21
3 - - - - -
July (B2)
1 2.70 0.39 2.71 0.97 0.38
2 0.50 0.11 0.50 0.31 0.23
3 1.51 0.16 1.49 0.75 0.73
September/October (B3)
1 1.08 0.20 1.06 0.19 0.72
2 0.93 0.22 0.92 0.18 0.73
3 0.87 0.22 0.85 0.25 0.57
May (D2)
1 0.64 0.13 0.61 0.17 0.40
2 1.16 0.18 1.14 0.22 0.78
3 1.13 0.18 1.15 0.24 0.77
July (D3)
1 0.80 0.19 0.79 0.22 0.41
2 0.81 0.20 0.82 0.23 0.41
3 0.79 0.15 0.79 0.15 0.41
C2
June (B1)
1 0.98 0.15 1.09 0.70 0.47
2 0.57 0.09 0.54 0.33 0.33
3 - - - - -
July (B2)
1 1.35 0.29 1.40 0.54 0.26
2 0.68 0.09 0.68 0.39 0.32
3 0.72 0.08 0.89 0.52 0.40
September/October (B3)
1 0.86 0.11 0.86 0.13 0.60
2 1.04 0.10 1.05 0.12 0.85
3 0.46 0.09 0.47 0.15 0.34
May (D2)
1 0.48 0.09 0.55 0.13 0.31
2 0.75 0.15 0.86 0.14 0.53
3 - - - - -
July (D3)
1 0.37 0.09 0.37 0.06 0.23
2 0.54 0.11 0.55 0.10 0.33
3 0.75 0.13 0.74 0.14 0.45
IM
June (B1) 1 0.58 0.21 0.61 0.39 0.27
2 0.64 0.08 0.63 0.39 0.36
3 - - - - -
July (B2)
1 2.33 0.52 2.38 0.90 0.36
2 0.82 0.13 0.83 0.83 0.39
3 0.50 0.09 0.39 0.22 0.25
September/October (B3)
1 1.25 0.13 1.25 0.17 0.88
2 0.45 0.10 0.43 0.09 0.39

Routine Turtle and Dugong Monitoring Program Report- Dredging Report 3 Ichthys Nearshore Environmental Monitoring Program
Prepared for INPEX Cardno 78
Marsh and Sinclair (1989) Pollock et al. (2006) Raw data
Block Month Replicate Estimate ± SE Estimate ± SE
3 0.58 0.10 0.57 0.16 0.42
May (D2)
1 0.25 0.05 0.28 0.06 0.21
2 0.34 0.06 0.37 0.09 0.30
3 0.49 0.08 0.49 0.12 0.40
July (D3)
1 0.58 0.14 0.59 0.10 0.24
2 0.57 0.14 0.56 0.09 0.26
3 0.54 0.13 0.54 0.08 0.28

Routine Turtle and Dugong Monitoring Program Report- Dredging Report 3 Ichthys Nearshore Environmental Monitoring Program
Prepared for INPEX Cardno 69
Ichthys Nearshore Environmental Monitoring Program
APPENDIX K TURTLE SUB-BLOCK POPULATION SIZE ESTIMATES DURING D3 AERIAL SURVEYS

Routine Turtle and Dugong Monitoring Program Report- Dredging Report 3 Ichthys Nearshore Environmental Monitoring Program
Prepared for INPEX Cardno 80
Appendix K: Turtle sub-block population size estimates in: a) IM; b) C1; and c) C2, during D3 Aerial Surveys (July 2013)
a)
IM Marsh and Sinclair (1989) Pollock et al. (2006)
Sub-Block Replicate Sightings in Transect Estimate ± SE Estimate ± SE
1 1 9 121 55 113 31
1 2 13 151 42 140 36
1 3 8 90 27 82 19
Combined 10 121 29 112 22
2 1 7 70 30 68 17
2 2 6 70 30 66 15
2 3 7 75 34 74 20
Combined 7 72 18 69 10
3 1 10 130 62 146 46
3 2 9 100 43 102 27
3 3 15 155 60 162 47
Combined 11 128 35 137 28
4 1 10 119 45 119 30
4 2 16 176 37 181 48
4 3 19 170 33 177 47
Combined 15 155 27 159 29
5 1 3 45 20 41 8
5 2 4 40 37 38 12
5 3 4 35 22 32 7
Combined 4 40 16 37 6
6 1 10 126 32 128 31
6 2 6 53 30 53 13
6 3 3 34 23 35 8
Combined 6 71 28 72 26

Routine Turtle and Dugong Monitoring Program Report- Dredging Report 3 Ichthys Nearshore Environmental Monitoring Program
Prepared for INPEX Cardno 81
b)
c)
C2 Marsh andSinclair (1989) Pollock et al. (2006)
Sub-Block Replicate Sightings in Transect Estimate ± SE Estimate ± SE
1 1 4 30 16 29 9
1 2 3 31 21 32 10
1 3 12 118 62 116 65
Combined 6 60 33 59 32
2 1 16 123 43 135 42
2 2 28 261 69 257 75
2 3 26 231 54 260 84
Combined 23 205 47 217 52
3 1 15 134 51 131 40
3 2 15 121 44 125 43
3 3 21 176 46 176 52
Combined 17 144 30 144 29
4 1 8 70 49 68 26
4 2 13 106 28 96 24
4 3 20 172 56 148 48
Combined 14 116 36 104 28
C1 Marsh and Sinclair (1989) Pollock et al. (2006)
Sub-Block Replicate Sightings in Transect Estimate ± SE Estimate ± SE
1 1 3 32 15 31 7
1 2 5 28 12 33 8
1 3 5 47 23 43 10
Combined 4 36 11 36 6
2 1 39 381 100 377 112
2 2 33 371 127 371 113
2 3 34 357 71 338 91
Combined 35 370 59 362 62
3 1 7 73 27 72 18
3 2 13 112 41 120 34
3 3 12 100 34 103 28
Combined 11 95 22 98 20
4 1 7 70 35 68 19
4 2 5 45 20 47 10
4 3 4 40 24 41 10
Combined 5 52 17 52 10

Routine Turtle and Dugong Monitoring Program Report- Dredging Report 3 Ichthys Nearshore Environmental Monitoring Program
Prepared for INPEX Cardno 69
Ichthys Nearshore Environmental Monitoring Program
APPENDIX L CORRECTED TURTLE SUB-BLOCK DENSITIES DURING D3 AERIAL SURVEYS

Routine Turtle and Dugong Monitoring Program Report- Dredging Report 3 Ichthys Nearshore Environmental Monitoring Program
Prepared for INPEX Cardno 83
Appendix L: Turtle Sub-block corrected densities within: a) IM; b) C1; and c) C2 during D3 Aerial Surveys
a)
IM Marsh and Sinclair
(1989) Pollock et al. (2006)
Block Sub-Block Replicate Area
(km2) Sightings
in Transect
Density Estimate ± SE Density
Estimate ± SE
IM
1
1
193.8
9 0.6 0.3 0.6 0.2
2 13 0.8 0.2 0.7 0.2
3 8 0.5 0.1 0.4 0.1
2
1
128.7
7 0.5 0.2 0.5 0.1
2 6 0.5 0.2 0.5 0.1
3 7 0.6 0.3 0.6 0.2
3
1
121.5
10 1.1 0.5 1.2 0.4
2 9 0.8 0.4 0.8 0.2
3 15 1.3 0.5 1.3 0.4
4
1
171.5
10 0.7 0.3 0.7 0.2
2 16 1.0 0.2 1.1 0.3
3 19 1.0 0.2 1.0 0.3
5
1
85.9
3 0.5 0.2 0.5 0.1
2 4 0.5 0.4 0.4 0.1
3 4 0.4 0.3 0.4 0.1
6
1
333.1
10 0.4 0.1 0.4 0.1
2 6 0.2 0.1 0.2 0.0
3 3 0.1 0.1 0.1 0.0
b)
C1 Marsh and Sinclair (1989) Pollock et al. (2006)
Block Sub-Block Replicate Area
(km2) Sightings
in Transect
Density Estimate ± SE Density
Estimate ± SE
C1
1
1
94.7
3 0.3 0.2 0.3 0.1
2 5 0.3 0.1 0.3 0.1
3 5 0.5 0.2 0.5 0.1
2
1
296.4
39 1.3 0.3 1.3 0.4
2 33 1.3 0.4 1.3 0.4
3 34 1.2 0.2 1.1 0.3
3
1
150.2
7 0.5 0.2 0.5 0.1
2 13 0.7 0.3 0.8 0.2
3 12 0.7 0.2 0.7 0.2
4
1
145.8
7 0.5 0.2 0.5 0.1
2 5 0.3 0.1 0.3 0.1
3 4 0.3 0.2 0.3 0.1
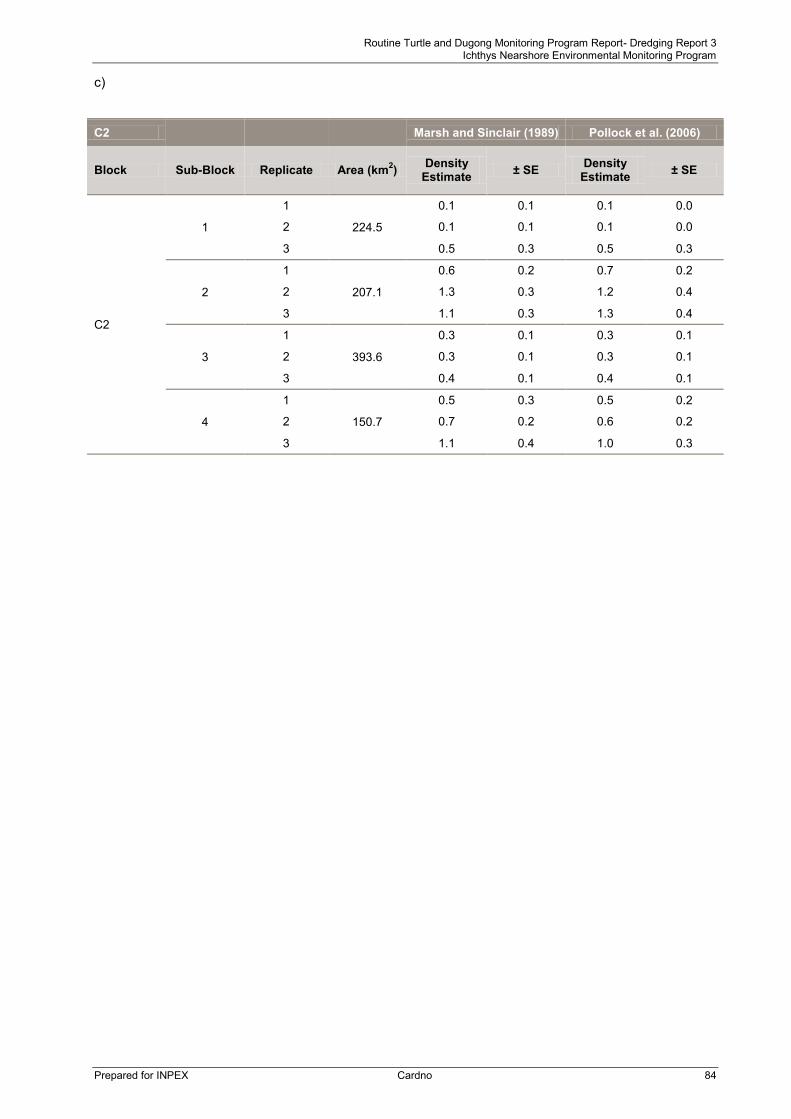
Routine Turtle and Dugong Monitoring Program Report- Dredging Report 3 Ichthys Nearshore Environmental Monitoring Program
Prepared for INPEX Cardno 84
c)
C2 Marsh and Sinclair (1989) Pollock et al. (2006)
Block Sub-Block Replicate Area (km2) Density Estimate ± SE Density
Estimate ± SE
C2
1
1
224.5
0.1 0.1 0.1 0.0
2 0.1 0.1 0.1 0.0
3 0.5 0.3 0.5 0.3
2
1
207.1
0.6 0.2 0.7 0.2
2 1.3 0.3 1.2 0.4
3 1.1 0.3 1.3 0.4
3
1
393.6
0.3 0.1 0.3 0.1
2 0.3 0.1 0.3 0.1
3 0.4 0.1 0.4 0.1
4
1
150.7
0.5 0.3 0.5 0.2
2 0.7 0.2 0.6 0.2
3 1.1 0.4 1.0 0.3

Routine Turtle and Dugong Monitoring Program Report- Dredging Report 3 Ichthys Nearshore Environmental Monitoring Program
Prepared for INPEX Cardno 85
Ichthys Nearshore Environmental Monitoring Program
APPENDIX M LAND-BASED OBSERVATION SIGHTINGS DATA

Routine Turtle and Dugong Monitoring Program Report- Dredging Report 3 Ichthys Nearshore Environmental Monitoring Program
Prepared for INPEX Cardno 86
Appendix M: Land based observations at Channel Island and Cullen Bay during D3 surveys
Location Replicate Date: Observer Position (Latitude)
Observer Position (Longitude)
Time Animal group No. individuals
Age Class (juvenile/adult)
Direction observed
Bearing from observer (degrees)
Estimated distance from observer (m)
Comments (e.g. max be same/different animal, distinguishing feature)
Cullen Bay Rep 1 30-Jul-13 12°26.849' S 130°49.404' E 8.30-10.17 AM dolphins 10 adult NW 213° - 246° 30 m – 1000 m same group of animals observed through the survey period
Cullen Bay Rep 1 30-Jul-13 12°26.849' S 130°49.404' E 8:30:00 AM dolphins 10 NW 313 - 252 30m at closest point
Cullen Bay Rep 1 30-Jul-13 12°26.849' S 130°49.404' E 8:45:00 AM dolphins 10 NW 273 300
Cullen Bay Rep 1 30-Jul-13 12°26.849' S 130°49.404' E 9:20:00 AM dolphins 10 NW 246 300
Cullen Bay Rep 1 30-Jul-13 12°26.849' S 130°49.404' E 9:45:00 AM dolphins 5 NW 254 80
Cullen Bay Rep 1 30-Jul-13 12°26.849' S 130°49.404' E 10:02:00 AM dolphins 5 NW 310 300
Cullen Bay Rep 1 30-Jul-13 12°26.849' S 130°49.404' E 10:15:00 AM dolphins 5 NW 295 300
Cullen Bay Rep 1 30-Jul-13 12°26.849' S 130°49.404' E 8:29:00 AM dolphin 6 adult E- NW 5 25 All three dolphin sightings are the same individuals
Cullen Bay Rep 1 30-Jul-13 12°26.849' S 130°49.404' E 8:30:00 AM dolphin 4 adult E- NW 43 40
Cullen Bay Rep 1 30-Jul-13 12°26.849' S 130°49.404' E 9:53:00 AM dolphin 5 adult E- NW 325 100
Cullen Bay Rep 1 30-Jul-13 12°26.849' S 130°49.404' E 10:03:00 AM dugong 1 adult E- NW 55 60 Separate sighting
Cullen Bay Rep 2 03-Aug-13 12°26.849' S 130°49.404' E 7:33:00 AM Dugong 1 sub adult E- NW 68 50 All three dugong sightings are the same individuals
Cullen Bay Rep 2 03-Aug-13 12°26.849' S 130°49.404' E 7:35:00 AM Dugong 1 sub adult E- NW 75 60
Cullen Bay Rep 2 03-Aug-13 12°26.849' S 130°49.404' E 7:45:00 AM Dugong 1 sub adult E- NW 82 70
Cullen Bay Rep 2 03-Aug-13 12°26.849' S 130°49.404' E 8:22:00 AM Dugong 1 sub adult NW- W 262 300 Separate sighting
Channel Island Bridge Rep 1 30-Jul-13 12°33.245' S 130°52.419' E 7:40:00 AM Green turtle 1 juvenile S 110 45
Channel Island Bridge Rep 1 30-Jul-13 12°33.245' S 130°52.419' E 8:17:00 AM Green turtle 1 juvenile S 144 45 Channel Island Bridge Rep 1 30-Jul-13 12°33.242' S 130°52.419' E 8:36:00 AM uncertain 1 juvenile N 45 350
Channel Island Bridge Rep 1 30-Jul-13 12°33.242' S 130°52.419' E 8:44:00 AM uncertain 1 uncertain N 0 70 Channel Island Bridge Rep 1 30-Jul-13 12°33.245' S 130°52.419' E 9:10:00 AM uncertain 1 juvenile S 214 75
Channel Island Bridge Rep 1 30-Jul-13 12°33.242' S 130°52.419' E 9:18:10 AM Green turtle 1 juvenile N 75 80 Channel Island Bridge Rep 1 30-Jul-13 12°33.245' S 130°52.419' E 9:19:00 AM Green turtle 1 adult S 118 30
Channel Island Bridge Rep 1 30-Jul-13 12°33.245' S 130°52.419' E 9:27:00 AM Green turtle 1 juvenile S 197 70
Channel Island Bridge Rep 1 30-Jul-13 12°33.242' S 130°52.419' E 9:29:30 AM Green turtle 1 juvenile N 7 150
Channel Island Bridge Rep 1 30-Jul-13 12°33.242' S 130°52.419' E 9:47:00 AM Green turtle 1 juvenile N 45 50
Channel Island Bridge Rep 1 30-Jul-13 12°33.245' S 130°52.419' E 9:47:00 AM Green turtle 1 juvenile S 132 75
Channel Island Bridge Rep 1 30-Jul-13 12°33.245' S 130°52.419' E 9:50:00 AM Green turtle 1 adult S 122 25
Channel Island Bridge Rep 1 30-Jul-13 12°33.245' S 130°52.419' E 9:53:00 AM Green turtle 1 juvenile S 108 40
Channel Island Bridge Rep 1 30-Jul-13 12°33.242' S 130°52.419' E 9:56:00 AM Green turtle 1 uncertain N 45 30
Channel Island Bridge Rep 1 30-Jul-13 12°33.245' S 130°52.419' E 10:00:00 AM Green turtle 1 juvenile S 221 not recorded
Channel Island Bridge Rep 1 30-Jul-13 12°33.245' S 130°52.419' E 10:00:00 AM uncertain 1 juvenile S 189 not recorded
Channel Island Bridge Rep 1 30-Jul-13 12°33.242' S 130°52.419' E 10:01:00 AM Green turtle 1 juvenile N 45 100
Channel Island Bridge Rep 1 30-Jul-13 12°33.242' S 130°52.419' E 10:07:00 AM Green turtle 1 juvenile N 335 100
Channel Island Bridge Rep 1 30-Jul-13 12°33.245' S 130°52.419' E 10:07:00 AM Green turtle 1 adult S 169 120
Channel Island Bridge Rep 1 30-Jul-13 12°33.242' S 130°52.419' E 10:08:00 AM Green turtle 1 juvenile N 45 30
Channel Island Bridge Rep 1 30-Jul-13 12°33.245' S 130°52.419' E 10:08:00 AM Green turtle 1 adult S 244 100
Channel Island Bridge Rep 1 30-Jul-13 12°33.242' S 130°52.419' E 10:10:00 AM Green turtle 1 juvenile N 7 70
Channel Island Bridge Rep 1 30-Jul-13 12°33.245' S 130°52.419' E 10:12:00 AM Green turtle 1 juvenile S 113 70

Routine Turtle and Dugong Monitoring Program Report- Dredging Report 3 Ichthys Nearshore Environmental Monitoring Program
Prepared for INPEX Cardno 87
Location Replicate Date: Observer Position (Latitude)
Observer Position (Longitude)
Time Animal group No. individuals
Age Class (juvenile/adult)
Direction observed
Bearing from observer (degrees)
Estimated distance from observer (m)
Comments (e.g. max be same/different animal, distinguishing feature)
Channel Island Bridge Rep 1 30-Jul-13 12°33.242' S 130°52.419' E 10:13:00 AM Green turtle 1 juvenile N 315 25
Channel Island Bridge Rep 1 30-Jul-13 12°33.245' S 130°52.419' E 10:14:00 AM Green turtle 1 juvenile S 251 100
Channel Island Bridge Rep 1 30-Jul-13 12°33.242' S 130°52.419' E 10:15:00 AM Green turtle 1 juvenile N 60 100
Channel Island Bridge Rep 1 30-Jul-13 12°33.242' S 130°52.419' E 10:36:00 AM Green turtle 1 juvenile N 65 25
Channel Island Bridge Rep 1 30-Jul-13 12°33.245' S 130°52.419' E 10:36:00 AM Green turtle 1 juvenile S 138 40
Channel Island Bridge Rep 1 30-Jul-13 12°33.245' S 130°52.419' E 10:36:00 AM Green turtle 1 adult S 180 Not recorded
Channel Island Bridge Rep 1 30-Jul-13 12°33.245' S 130°52.419' E 10:37:00 AM Green turtle 1 adult S 243 90
Channel Island Bridge Rep 1 30-Jul-13 12°33.242' S 130°52.419' E 10:39:00 AM uncertain 1 juvenile N 285 180
Channel Island Bridge Rep 1 30-Jul-13 12°33.245' S 130°52.419' E 10:39:00 AM Green turtle 1 juvenile S 135 30
Channel Island Bridge Rep 1 30-Jul-13 12°33.245' S 130°52.419' E 10:39:00 AM Green turtle 1 juvenile S 98 35
Channel Island Bridge Rep 1 30-Jul-13 12°33.245' S 130°52.419' E 10:40:00 AM Green turtle 1 adult S 120 55
Channel Island Bridge Rep 1 30-Jul-13 12°33.242' S 130°52.419' E 10:41:00 AM Green turtle 1 juvenile N 60 140
Channel Island Bridge Rep 1 30-Jul-13 12°33.242' S 130°52.419' E 10:41:30 AM Green turtle 1 juvenile N 5 30
Channel Island Bridge Rep 1 30-Jul-13 12°33.245' S 130°52.419' E 10:42:00 AM Green turtle 1 adult S 180 75
Channel Island Bridge Rep 1 30-Jul-13 12°33.242' S 130°52.419' E 10:43:00 AM Green turtle 1 juvenile N 60 35
Channel Island Bridge Rep 1 30-Jul-13 12°33.242' S 130°52.419' E 10:45:00 AM Green turtle 1 juvenile N 15 20
Channel Island Bridge Rep 1 30-Jul-13 12°33.242' S 130°52.419' E 10:47:00 AM Green turtle 1 juvenile N 15 40
Channel Island Bridge Rep 1 30-Jul-13 12°33.245' S 130°52.419' E 10:48:00 AM Green turtle 1 juvenile S 196 20
Channel Island Bridge Rep 1 30-Jul-13 12°33.242' S 130°52.419' E 10:50:00 AM Green turtle 1 juvenile N 345 50
Channel Island Bridge Rep 1 30-Jul-13 12°33.245' S 130°52.419' E 10:50:00 AM Green turtle 1 juvenile S 124 80
Channel Island Bridge Rep 1 30-Jul-13 12°33.245' S 130°52.419' E 10:55:00 AM Green turtle 1 juvenile S 132 60
Channel Island Bridge Rep 1 30-Jul-13 12°33.242' S 130°52.419' E 10:56:00 AM uncertain 1 juvenile N 80 150
Channel Island Bridge Rep 1 30-Jul-13 12°33.242' S 130°52.419' E 11:00:00 AM uncertain 1 juvenile N 307 70
Channel Island Bridge Rep 1 30-Jul-13 12°33.242' S 130°52.419' E 11:00:00 AM uncertain 1 juvenile N 60 200
Channel Island Bridge Rep 1 30-Jul-13 12°33.242' S 130°52.419' E 11:21:00 AM uncertain 1 juvenile N 65 140
Channel Island Bridge Rep 1 30-Jul-13 12°33.245' S 130°52.419' E 11:21:00 AM Green turtle 1 adult S 125 35
Channel Island Bridge Rep 1 30-Jul-13 12°33.245' S 130°52.419' E 11:21:00 AM Green turtle 1 juvenile S 224 40
Channel Island Bridge Rep 1 30-Jul-13 12°33.245' S 130°52.419' E 11:22:00 AM Green turtle 1 juvenile S 108 80
Channel Island Bridge Rep 1 30-Jul-13 12°33.242' S 130°52.419' E 11:24:00 AM Green turtle 1 juvenile N 300 30
Channel Island Bridge Rep 1 30-Jul-13 12°33.242' S 130°52.419' E 11:25:00 AM Green turtle 1 juvenile N 65 120
Channel Island Bridge Rep 1 30-Jul-13 12°33.245' S 130°52.419' E 11:29:00 AM Green turtle 1 juvenile S 98 60
Channel Island Bridge Rep 1 30-Jul-13 12°33.242' S 130°52.419' E 11:32:00 AM Green turtle 1 juvenile N 300 35
Channel Island Bridge Rep 1 30-Jul-13 12°33.242' S 130°52.419' E 11:37:00 AM Green turtle 1 juvenile N 30 45
Channel Island Bridge Rep 1 30-Jul-13 12°33.245' S 130°52.419' E 11:38:00 AM Green turtle 1 adult S 185 20
Channel Island Bridge Rep 1 30-Jul-13 12°33.242' S 130°52.419' E 11:41:00 AM Green turtle 1 juvenile N 45 10
Channel Island Bridge Rep 1 30-Jul-13 12°33.242' S 130°52.419' E 11:42:00 AM Green turtle 1 juvenile N 330 30
Channel Island Bridge Rep 1 30-Jul-13 12°33.242' S 130°52.419' E 11:43:00 AM Green turtle 1 adult N 285 30
Channel Island Bridge Rep 1 30-Jul-13 12°33.242' S 130°52.419' E 11:45:00 AM Green turtle 1 juvenile N 45 150
Channel Island Bridge Rep 1 30-Jul-13 12°33.242' S 130°52.419' E 12:00:00 PM uncertain 1 juvenile N 15 250

Routine Turtle and Dugong Monitoring Program Report- Dredging Report 3 Ichthys Nearshore Environmental Monitoring Program
Prepared for INPEX Cardno 88
Location Replicate Date: Observer Position (Latitude)
Observer Position (Longitude)
Time Animal group No. individuals
Age Class (juvenile/adult)
Direction observed
Bearing from observer (degrees)
Estimated distance from observer (m)
Comments (e.g. max be same/different animal, distinguishing feature)
Channel Island Bridge Rep 1 30-Jul-13 12°33.245' S 130°52.419' E 12:02:00 PM Green turtle 1 juvenile S 183 60
Channel Island Bridge Rep 1 30-Jul-13 12°33.242' S 130°52.419' E 12:05:00 PM Green turtle 1 juvenile N 285 60
Channel Island Bridge Rep 1 30-Jul-13 12°33.242' S 130°52.419' E 12:08:00 PM Green turtle 1 juvenile N 45 90
Channel Island Bridge Rep 1 30-Jul-13 12°33.242' S 130°52.419' E 12:08:00 PM Green turtle 1 juvenile N 45 300
Channel Island Bridge Rep 1 30-Jul-13 12°33.242' S 130°52.419' E 12:10:00 PM uncertain 1 uncertain N 57 300
Channel Island Bridge Rep 1 30-Jul-13 12°33.245' S 130°52.419' E 12:10:00 PM Green turtle 1 adult S 173 80
Channel Island Bridge Rep 1 30-Jul-13 12°33.245' S 130°52.419' E 12:14:00 PM Green turtle 1 adult S 179 100
Channel Island Bridge Rep 1 30-Jul-13 12°33.245' S 130°52.419' E 12:16:00 PM Green turtle 1 juvenile S 201 70
Channel Island Bridge Rep 1 30-Jul-13 12°33.242' S 130°52.419' E 12:18:00 PM uncertain 1 uncertain N 315 150
Channel Island Bridge Rep 1 30-Jul-13 12°33.245' S 130°52.419' E 12:21:00 PM Green turtle 1 juvenile S 154 35
Channel Island Bridge Rep 1 30-Jul-13 12°33.242' S 130°52.419' E 12:24:00 PM uncertain 1 uncertain N 37 160
Channel Island Bridge Rep 1 30-Jul-13 12°33.242' S 130°52.419' E 12:25:00 PM Green turtle 1 juvenile N 300 25
Channel Island Bridge Rep 1 30-Jul-13 12°33.242' S 130°52.419' E 12:25:00 PM Green turtle 1 juvenile N 45 90
Channel Island Bridge Rep 1 30-Jul-13 12°33.245' S 130°52.419' E 12:27:00 PM Green turtle 1 juvenile S 137 45
Channel Island Bridge Rep 1 30-Jul-13 12°33.242' S 130°52.419' E 12:29:00 PM uncertain 1 uncertain N 75 160
Channel Island Bridge Rep 1 30-Jul-13 12°33.245' S 130°52.419' E 12:30:00 PM Green turtle 1 juvenile S 142 80
Channel Island Bridge Rep 1 30-Jul-13 12°33.245' S 130°52.419' E 12:48:00 PM Green turtle 1 juvenile S 232 80
Channel Island Bridge Rep 1 30-Jul-13 12°33.242' S 130°52.419' E 12:52:00 PM Green turtle 1 juvenile N 310 80
Channel Island Bridge Rep 1 30-Jul-13 12°33.245' S 130°52.419' E 12:52:00 PM Green turtle 1 juvenile S 132 65
Channel Island Bridge Rep 1 30-Jul-13 12°33.245' S 130°52.419' E 12:53:00 PM Green turtle 1 juvenile S 158 80
Channel Island Bridge Rep 1 30-Jul-13 12°33.242' S 130°52.419' E 12:58:00 PM Green turtle 1 juvenile N 75 40
Channel Island Bridge Rep 1 30-Jul-13 12°33.242' S 130°52.419' E 1:02:00 PM Green turtle 1 juvenile N 310 40
Channel Island Bridge Rep 1 30-Jul-13 12°33.245' S 130°52.419' E 1:06:00 PM Green turtle 1 juvenile S 219 75
Channel Island Bridge Rep 2 03-Aug-13 12°33.245' S 130°52.419' E 8:10:00 AM Green turtle 1 juvenile Sth 140 30
Channel Island Bridge Rep 2 03-Aug-13 12°33.245' S 130°52.419' E 8:10:00 AM Green turtle 1 juvenile Sth 140 50
Channel Island Bridge Rep 2 03-Aug-13 12°33.245' S 130°52.419' E 8:11:00 AM Green turtle 1 juvenile Sth 120 70
Channel Island Bridge Rep 2 03-Aug-13 12°33.245' S 130°52.419' E 8:11:00 AM Green turtle 1 juvenile Sth 125 50
Channel Island Bridge Rep 2 03-Aug-13 12°33.245' S 130°52.419' E 8:13:00 AM Green turtle 1 juvenile Sth 120 40
Channel Island Bridge Rep 2 03-Aug-13 12°33.245' S 130°52.419' E 8:19:00 AM Green turtle 1 juvenile Sth 120 50
Channel Island Bridge Rep 2 03-Aug-13 12°33.245' S 130°52.419' E 8:21:00 AM Green turtle 1 juvenile Sth 140 30
Channel Island Bridge Rep 2 03-Aug-13 12°33.245' S 130°52.419' E 8:21:00 AM Green turtle 1 juvenile Sth 135 40
Channel Island Bridge Rep 2 03-Aug-13 12°33.245' S 130°52.419' E 8:29:00 AM Green turtle 1 juvenile Sth 120 40
Channel Island Bridge Rep 2 03-Aug-13 12°33.245' S 130°52.419' E 8:47:00 AM Green turtle 1 juvenile Sth 140 30
Channel Island Bridge Rep 2 03-Aug-13 12°33.245' S 130°52.419' E 8:49:00 AM Green turtle 1 juvenile Sth 110 50
Channel Island Bridge Rep 2 03-Aug-13 12°33.242' S 130°52.419' E 8:50:00 AM Green turtle 1 juvenile Nth 36 40
Channel Island Bridge Rep 2 03-Aug-13 12°33.245' S 130°52.419' E 8:51:00 AM Green turtle 1 juvenile Sth 120 30
Channel Island Bridge Rep 2 03-Aug-13 12°33.245' S 130°52.419' E 8:59:00 AM Green turtle 1 juvenile Sth 145 40
Channel Island Bridge Rep 2 03-Aug-13 12°33.242' S 130°52.419' E 8:59:00 AM Green turtle 1 juvenile Nth 42 100
Channel Island Bridge Rep 2 03-Aug-13 12°33.242' S 130°52.419' E 9:03:00 AM Green turtle 1 juvenile Nth 47 90

Routine Turtle and Dugong Monitoring Program Report- Dredging Report 3 Ichthys Nearshore Environmental Monitoring Program
Prepared for INPEX Cardno 89
Location Replicate Date: Observer Position (Latitude)
Observer Position (Longitude)
Time Animal group No. individuals
Age Class (juvenile/adult)
Direction observed
Bearing from observer (degrees)
Estimated distance from observer (m)
Comments (e.g. max be same/different animal, distinguishing feature)
Channel Island Bridge Rep 2 03-Aug-13 12°33.245' S 130°52.419' E 9:04:00 AM Green turtle 1 juvenile Sth 135 40
Channel Island Bridge Rep 2 03-Aug-13 12°33.242' S 130°52.419' E 9:04:00 AM Green turtle 1 juvenile Nth 0 30
Channel Island Bridge Rep 2 03-Aug-13 12°33.245' S 130°52.419' E 9:06:00 AM Green turtle 1 juvenile Sth 135 30
Channel Island Bridge Rep 2 03-Aug-13 12°33.242' S 130°52.419' E 9:06:00 AM Green turtle 1 juvenile Nth 285 30
Channel Island Bridge Rep 2 03-Aug-13 12°33.245' S 130°52.419' E 9:07:00 AM Green turtle 1 juvenile Sth 115 70
Channel Island Bridge Rep 2 03-Aug-13 12°33.242' S 130°52.419' E 9:09:00 AM Green turtle 1 juvenile Nth 10 50
Channel Island Bridge Rep 2 03-Aug-13 12°33.242' S 130°52.419' E 9:11:00 AM Green turtle 1 juvenile Nth 6 30
Channel Island Bridge Rep 2 03-Aug-13 12°33.242' S 130°52.419' E 9:13:00 AM Green turtle 1 juvenile Nth 295 35
Channel Island Bridge Rep 2 03-Aug-13 12°33.245' S 130°52.419' E 9:14:00 AM Green turtle 1 juvenile Sth 125 50
Channel Island Bridge Rep 2 03-Aug-13 12°33.245' S 130°52.419' E 9:14:00 AM Green turtle 1 juvenile Sth 135 30
Channel Island Bridge Rep 2 03-Aug-13 12°33.245' S 130°52.419' E 9:33:00 AM Green turtle 1 juvenile Sth 250 50
Channel Island Bridge Rep 2 03-Aug-13 12°33.245' S 130°52.419' E 9:35:00 AM Green turtle 1 juvenile Sth 225 40
Channel Island Bridge Rep 2 03-Aug-13 12°33.242' S 130°52.419' E 9:36:00 AM Green turtle 1 juvenile Nth 7 100
Channel Island Bridge Rep 2 03-Aug-13 12°33.245' S 130°52.419' E 9:37:00 AM Green turtle 1 juvenile Sth 225 20
Channel Island Bridge Rep 2 03-Aug-13 12°33.242' S 130°52.419' E 9:37:00 AM Green turtle 1 juvenile Nth 74 40
Channel Island Bridge Rep 2 03-Aug-13 12°33.245' S 130°52.419' E 9:38:00 AM Green turtle 1 juvenile Sth 185 20
Channel Island Bridge Rep 2 03-Aug-13 12°33.242' S 130°52.419' E 9:38:00 AM Green turtle 1 juvenile Nth 346 80
Channel Island Bridge Rep 2 03-Aug-13 12°33.245' S 130°52.419' E 9:40:00 AM Green turtle 1 juvenile Sth 150 40
Channel Island Bridge Rep 2 03-Aug-13 12°33.245' S 130°52.419' E 9:40:00 AM Green turtle 1 juvenile Sth 120 50
Channel Island Bridge Rep 2 03-Aug-13 12°33.242' S 130°52.419' E 9:40:00 AM Green turtle 1 juvenile Nth 12 25
Channel Island Bridge Rep 2 03-Aug-13 12°33.242' S 130°52.419' E 9:41:00 AM Green turtle 1 juvenile Nth 14 120
Channel Island Bridge Rep 2 03-Aug-13 12°33.242' S 130°52.419' E 9:41:00 AM Green turtle 1 juvenile Nth 11 60
Channel Island Bridge Rep 2 03-Aug-13 12°33.245' S 130°52.419' E 9:43:00 AM Green turtle 1 juvenile Sth 195 15
Channel Island Bridge Rep 2 03-Aug-13 12°33.245' S 130°52.419' E 9:43:00 AM Green turtle 1 juvenile Sth 180 30
Channel Island Bridge Rep 2 03-Aug-13 12°33.242' S 130°52.419' E 9:45:00 AM Green turtle 1 juvenile Nth 66 30
Channel Island Bridge Rep 2 03-Aug-13 12°33.245' S 130°52.419' E 9:46:00 AM Green turtle 1 juvenile Sth 135 30
Channel Island Bridge Rep 2 03-Aug-13 12°33.242' S 130°52.419' E 9:47:00 AM Green turtle 1 juvenile Nth 4 10
Channel Island Bridge Rep 2 03-Aug-13 12°33.242' S 130°52.419' E 9:50:00 AM Green turtle 1 juvenile Nth 288 40
Channel Island Bridge Rep 2 03-Aug-13 12°33.242' S 130°52.419' E 9:52:00 AM Green turtle 1 juvenile Nth 25 30
Channel Island Bridge Rep 2 03-Aug-13 12°33.245' S 130°52.419' E 9:53:00 AM Green turtle 1 juvenile Sth 180 60
Channel Island Bridge Rep 2 03-Aug-13 12°33.242' S 130°52.419' E 9:54:00 AM Green turtle 1 juvenile Nth 344 100
Channel Island Bridge Rep 2 03-Aug-13 12°33.245' S 130°52.419' E 9:55:00 AM Green turtle 1 juvenile Sth 135 40
Channel Island Bridge Rep 2 03-Aug-13 12°33.242' S 130°52.419' E 9:56:00 AM Green turtle 1 juvenile Nth 284 20
Channel Island Bridge Rep 2 03-Aug-13 12°33.245' S 130°52.419' E 9:57:00 AM Green turtle 1 juvenile Sth 125 50
Channel Island Bridge Rep 2 03-Aug-13 12°33.245' S 130°52.419' E 9:57:00 AM Green turtle 1 juvenile Sth 125 30
Channel Island Bridge Rep 2 03-Aug-13 12°33.242' S 130°52.419' E 9:59:00 AM Green turtle 1 juvenile Nth 285 30
Channel Island Bridge Rep 2 03-Aug-13 12°33.245' S 130°52.419' E 10:00:00 AM Green turtle 1 juvenile Sth 240 20
Channel Island Bridge Rep 2 03-Aug-13 12°33.245' S 130°52.419' E 10:15:00 AM Green turtle 1 juvenile Sth 120 40
Channel Island Bridge Rep 2 03-Aug-13 12°33.242' S 130°52.419' E 10:15:00 AM Green turtle 1 juvenile Nth 320 40

Routine Turtle and Dugong Monitoring Program Report- Dredging Report 3 Ichthys Nearshore Environmental Monitoring Program
Prepared for INPEX Cardno 90
Location Replicate Date: Observer Position (Latitude)
Observer Position (Longitude)
Time Animal group No. individuals
Age Class (juvenile/adult)
Direction observed
Bearing from observer (degrees)
Estimated distance from observer (m)
Comments (e.g. max be same/different animal, distinguishing feature)
Channel Island Bridge Rep 2 03-Aug-13 12°33.245' S 130°52.419' E 10:18:00 AM Green turtle 1 juvenile Sth 120 40
Channel Island Bridge Rep 2 03-Aug-13 12°33.242' S 130°52.419' E 10:18:00 AM Green turtle 1 juvenile Nth 11 40
Channel Island Bridge Rep 2 03-Aug-13 12°33.242' S 130°52.419' E 10:20:00 AM Green turtle 1 juvenile Nth 323 50
Channel Island Bridge Rep 2 03-Aug-13 12°33.242' S 130°52.419' E 10:21:00 AM Green turtle 1 juvenile Nth 335 100
Channel Island Bridge Rep 2 03-Aug-13 12°33.245' S 130°52.419' E 10:24:00 AM Green turtle 1 juvenile Sth 150 70
Channel Island Bridge Rep 2 03-Aug-13 12°33.245' S 130°52.419' E 10:24:00 AM Green turtle 1 juvenile Sth 180 50
Channel Island Bridge Rep 2 03-Aug-13 12°33.242' S 130°52.419' E 10:24:00 AM Green turtle 1 juvenile Nth 325 40
Channel Island Bridge Rep 2 03-Aug-13 12°33.245' S 130°52.419' E 10:29:00 AM Green turtle 1 juvenile Sth 180 60
Channel Island Bridge Rep 2 03-Aug-13 12°33.242' S 130°52.419' E 10:29:00 AM Green turtle 1 juvenile Nth 342 50
Channel Island Bridge Rep 2 03-Aug-13 12°33.242' S 130°52.419' E 10:29:00 AM Green turtle 1 juvenile Nth 326 40
Channel Island Bridge Rep 2 03-Aug-13 12°33.245' S 130°52.419' E 10:30:00 AM Green turtle 1 juvenile Sth 115 20
Channel Island Bridge Rep 2 03-Aug-13 12°33.242' S 130°52.419' E 10:32:00 AM Green turtle 1 juvenile Nth 12 50
Channel Island Bridge Rep 2 03-Aug-13 12°33.242' S 130°52.419' E 10:33:00 AM Green turtle 1 juvenile Nth 324 40
Channel Island Bridge Rep 2 03-Aug-13 12°33.242' S 130°52.419' E 10:35:00 AM Green turtle 1 juvenile Nth 23 30
Channel Island Bridge Rep 2 03-Aug-13 12°33.242' S 130°52.419' E 10:37:00 AM Green turtle 1 juvenile Nth 11 60
Channel Island Bridge Rep 2 03-Aug-13 12°33.242' S 130°52.419' E 10:37:00 AM Green turtle 1 juvenile Nth 321 20
Channel Island Bridge Rep 2 03-Aug-13 12°33.242' S 130°52.419' E 10:39:00 AM Green turtle 1 juvenile Nth 358 20
Channel Island Bridge Rep 2 03-Aug-13 12°33.242' S 130°52.419' E 10:41:00 AM Green turtle 1 juvenile Nth 68 40
Channel Island Bridge Rep 2 03-Aug-13 12°33.242' S 130°52.419' E 10:42:00 AM Green turtle 1 juvenile Nth 339 40
Channel Island Bridge Rep 2 03-Aug-13 12°33.242' S 130°52.419' E 10:43:00 AM Green turtle 1 juvenile Nth 310 30
Channel Island Bridge Rep 2 03-Aug-13 12°33.242' S 130°52.419' E 10:44:00 AM Green turtle 1 juvenile Nth 311 80
Channel Island Bridge Rep 2 03-Aug-13 12°33.242' S 130°52.419' E 11:01:00 AM Green turtle 1 juvenile Nth 340 40
Channel Island Bridge Rep 2 03-Aug-13 12°33.242' S 130°52.419' E 11:03:00 AM Green turtle 1 juvenile Nth 328 20
Channel Island Bridge Rep 2 03-Aug-13 12°33.245' S 130°52.419' E 11:06:00 AM Green turtle 1 juvenile Sth 145 15
Channel Island Bridge Rep 2 03-Aug-13 12°33.242' S 130°52.419' E 11:07:00 AM Green turtle 1 juvenile Nth 47 40
Channel Island Bridge Rep 2 03-Aug-13 12°33.242' S 130°52.419' E 11:08:00 AM Green turtle 1 juvenile Nth 61 50
Channel Island Bridge Rep 2 03-Aug-13 12°33.245' S 130°52.419' E 11:11:00 AM Green turtle 1 juvenile Sth 115 20
Channel Island Bridge Rep 2 03-Aug-13 12°33.245' S 130°52.419' E 11:12:00 AM Green turtle 1 juvenile Sth 150 10
Channel Island Bridge Rep 2 03-Aug-13 12°33.242' S 130°52.419' E 11:12:00 AM Green turtle 1 juvenile Nth 75 40
Channel Island Bridge Rep 2 03-Aug-13 12°33.245' S 130°52.419' E 11:13:00 AM Green turtle 1 juvenile Sth 155 30
Channel Island Bridge Rep 2 03-Aug-13 12°33.242' S 130°52.419' E 11:14:00 AM Green turtle 1 juvenile Nth 352 120
Channel Island Bridge Rep 2 03-Aug-13 12°33.245' S 130°52.419' E 11:16:00 AM Green turtle 1 juvenile Sth 120 60
Channel Island Bridge Rep 2 03-Aug-13 12°33.245' S 130°52.419' E 11:18:00 AM Green turtle 1 juvenile Sth 180 30
Channel Island Bridge Rep 2 03-Aug-13 12°33.242' S 130°52.419' E 11:18:00 AM Green turtle 1 juvenile Nth 341 60
Channel Island Bridge Rep 2 03-Aug-13 12°33.245' S 130°52.419' E 11:20:00 AM Green turtle 1 juvenile Sth 130 50
Channel Island Bridge Rep 2 03-Aug-13 12°33.245' S 130°52.419' E 11:21:00 AM Green turtle 1 juvenile Sth 155 40
Channel Island Bridge Rep 2 03-Aug-13 12°33.242' S 130°52.419' E 11:21:00 AM Green turtle 1 juvenile Nth 25 70
Channel Island Bridge Rep 2 03-Aug-13 12°33.242' S 130°52.419' E 11:23:00 AM Green turtle 1 juvenile Nth 302 30
Channel Island Bridge Rep 2 03-Aug-13 12°33.242' S 130°52.419' E 11:24:00 AM Green turtle 1 juvenile Nth 342 10

Routine Turtle and Dugong Monitoring Program Report- Dredging Report 3 Ichthys Nearshore Environmental Monitoring Program
Prepared for INPEX Cardno 91
Location Replicate Date: Observer Position (Latitude)
Observer Position (Longitude)
Time Animal group No. individuals
Age Class (juvenile/adult)
Direction observed
Bearing from observer (degrees)
Estimated distance from observer (m)
Comments (e.g. max be same/different animal, distinguishing feature)
Channel Island Bridge Rep 2 03-Aug-13 12°33.242' S 130°52.419' E 11:25:00 AM Green turtle 1 juvenile Nth 319 15
Channel Island Bridge Rep 2 03-Aug-13 12°33.242' S 130°52.419' E 11:25:00 AM Green turtle 1 juvenile Nth 327 20
Channel Island Bridge Rep 2 03-Aug-13 12°33.245' S 130°52.419' E 11:27:00 AM Green turtle 1 juvenile Sth 105 50
Channel Island Bridge Rep 2 03-Aug-13 12°33.242' S 130°52.419' E 11:27:00 AM Green turtle 1 juvenile Nth 50 80
Channel Island Bridge Rep 2 03-Aug-13 12°33.242' S 130°52.419' E 11:28:00 AM Green turtle 1 juvenile Nth 320 60
Channel Island Bridge Rep 2 03-Aug-13 12°33.245' S 130°52.419' E 11:29:00 AM Green turtle 1 juvenile Sth 165 70
Channel Island Bridge Rep 2 03-Aug-13 12°33.245' S 130°52.419' E 11:46:00 AM Green turtle 1 juvenile Sth 105 40
Channel Island Bridge Rep 2 03-Aug-13 12°33.245' S 130°52.419' E 11:48:00 AM Green turtle 1 juvenile Sth 180 10
Channel Island Bridge Rep 2 03-Aug-13 12°33.242' S 130°52.419' E 11:48:00 AM Green turtle 1 juvenile Nth 2 60
Channel Island Bridge Rep 2 03-Aug-13 12°33.245' S 130°52.419' E 11:50:00 AM Green turtle 1 juvenile Sth 140 40
Channel Island Bridge Rep 2 03-Aug-13 12°33.245' S 130°52.419' E 11:50:00 AM Green turtle 1 juvenile Sth 120 60
Channel Island Bridge Rep 2 03-Aug-13 12°33.242' S 130°52.419' E 11:50:00 AM Green turtle 1 juvenile Nth 354 100
Channel Island Bridge Rep 2 03-Aug-13 12°33.245' S 130°52.419' E 11:53:00 AM Green turtle 1 juvenile Sth 170 10
Channel Island Bridge Rep 2 03-Aug-13 12°33.242' S 130°52.419' E 11:57:00 AM Green turtle 1 juvenile Nth 37 20
Channel Island Bridge Rep 2 03-Aug-13 12°33.245' S 130°52.419' E 11:59:00 AM Green turtle 1 juvenile Sth 180 40
Channel Island Bridge Rep 2 03-Aug-13 12°33.245' S 130°52.419' E 11:59:00 AM Green turtle 1 juvenile Sth 150 30
Channel Island Bridge Rep 2 03-Aug-13 12°33.242' S 130°52.419' E 11:59:00 AM Green turtle 1 juvenile Nth 18 50
Channel Island Bridge Rep 2 03-Aug-13 12°33.242' S 130°52.419' E 11:59:00 AM Green turtle 1 juvenile Nth 275 40
Channel Island Bridge Rep 2 03-Aug-13 12°33.245' S 130°52.419' E 12:00:00 PM Green turtle 1 juvenile Sth 105 50
Channel Island Bridge Rep 2 03-Aug-13 12°33.242' S 130°52.419' E 12:01:00 PM Green turtle 1 juvenile Nth 53 100
Channel Island Bridge Rep 2 03-Aug-13 12°33.245' S 130°52.419' E 12:02:00 PM Green turtle 1 juvenile Sth 100 20
Channel Island Bridge Rep 2 03-Aug-13 12°33.242' S 130°52.419' E 12:04:00 PM Green turtle 1 juvenile Nth 4 40
Channel Island Bridge Rep 2 03-Aug-13 12°33.242' S 130°52.419' E 12:04:00 PM Green turtle 1 juvenile Nth 53 80
Channel Island Bridge Rep 2 03-Aug-13 12°33.245' S 130°52.419' E 12:08:00 PM Green turtle 1 juvenile Sth 105 50
Channel Island Bridge Rep 2 03-Aug-13 12°33.242' S 130°52.419' E 12:08:00 PM Green turtle 1 juvenile Nth 45 10
Channel Island Bridge Rep 2 03-Aug-13 12°33.245' S 130°52.419' E 12:09:00 PM Green turtle 1 juvenile Sth 155 30
Channel Island Bridge Rep 2 03-Aug-13 12°33.245' S 130°52.419' E 12:09:00 PM Green turtle 1 juvenile Sth 105 50
Channel Island Bridge Rep 2 03-Aug-13 12°33.242' S 130°52.419' E 12:11:00 PM Green turtle 1 juvenile Nth 285 30
Channel Island Bridge Rep 2 03-Aug-13 12°33.242' S 130°52.419' E 12:12:00 PM Green turtle 1 juvenile Nth 15 50
Channel Island Bridge Rep 2 03-Aug-13 12°33.245' S 130°52.419' E 12:13:00 PM Green turtle 1 juvenile Sth 190 40
Channel Island Bridge Rep 2 03-Aug-13 12°33.245' S 130°52.419' E 12:14:00 PM Green turtle 1 juvenile Sth 115 50
Channel Island Bridge Rep 2 03-Aug-13 12°33.245' S 130°52.419' E 12:31:00 PM Green turtle 1 juvenile Sth 135 40
Channel Island Bridge Rep 2 03-Aug-13 12°33.245' S 130°52.419' E 12:34:00 PM Green turtle 1 juvenile Sth 110 30
Channel Island Bridge Rep 2 03-Aug-13 12°33.242' S 130°52.419' E 12:34:00 PM Green turtle 1 juvenile Nth 278 60
Channel Island Bridge Rep 2 03-Aug-13 12°33.242' S 130°52.419' E 12:37:00 PM Green turtle 1 juvenile Nth 357 50
Channel Island Bridge Rep 2 03-Aug-13 12°33.245' S 130°52.419' E 12:38:00 PM Green turtle 1 juvenile Sth 150 30
Channel Island Bridge Rep 2 03-Aug-13 12°33.242' S 130°52.419' E 12:38:00 PM Green turtle 1 juvenile Nth 10 50
Channel Island Bridge Rep 2 03-Aug-13 12°33.245' S 130°52.419' E 12:39:00 PM Green turtle 1 juvenile Sth 195 20
Channel Island Bridge Rep 2 03-Aug-13 12°33.245' S 130°52.419' E 12:43:00 PM Green turtle 1 juvenile Sth 200 15

Routine Turtle and Dugong Monitoring Program Report- Dredging Report 3 Ichthys Nearshore Environmental Monitoring Program
Prepared for INPEX Cardno 92
Location Replicate Date: Observer Position (Latitude)
Observer Position (Longitude)
Time Animal group No. individuals
Age Class (juvenile/adult)
Direction observed
Bearing from observer (degrees)
Estimated distance from observer (m)
Comments (e.g. max be same/different animal, distinguishing feature)
Channel Island Bridge Rep 2 03-Aug-13 12°33.245' S 130°52.419' E 12:44:00 PM Green turtle 1 juvenile Sth 225 15
Channel Island Bridge Rep 2 03-Aug-13 12°33.242' S 130°52.419' E 12:44:00 PM Green turtle 1 juvenile Nth 359 80
Channel Island Bridge Rep 2 03-Aug-13 12°33.242' S 130°52.419' E 12:45:00 PM Green turtle 1 juvenile Nth 314 80
Channel Island Bridge Rep 2 03-Aug-13 12°33.245' S 130°52.419' E 12:46:00 PM Green turtle 1 juvenile Sth 210 40
Channel Island Bridge Rep 2 03-Aug-13 12°33.245' S 130°52.419' E 12:46:00 PM Green turtle 1 juvenile Sth 160 10
Channel Island Bridge Rep 2 03-Aug-13 12°33.245' S 130°52.419' E 12:47:00 PM Green turtle 1 juvenile Sth 165 30
Channel Island Bridge Rep 2 03-Aug-13 12°33.245' S 130°52.419' E 12:49:00 PM Green turtle 1 juvenile Sth 210 10
Channel Island Bridge Rep 2 03-Aug-13 12°33.242' S 130°52.419' E 12:51:00 PM Green turtle 1 juvenile Nth 305 30
Channel Island Bridge Rep 2 03-Aug-13 12°33.242' S 130°52.419' E 12:53:00 PM Green turtle 1 juvenile Nth 310 50
Channel Island Bridge Rep 2 03-Aug-13 12°33.245' S 130°52.419' E 12:55:00 PM Green turtle 1 juvenile Sth 225 60
Channel Island Bridge Rep 2 03-Aug-13 12°33.245' S 130°52.419' E 12:56:00 PM Green turtle 1 juvenile Sth 170 30
Channel Island Bridge Rep 2 03-Aug-13 12°33.245' S 130°52.419' E 12:56:00 PM Green turtle 1 juvenile Sth 155 30
Channel Island Bridge Rep 2 03-Aug-13 12°33.242' S 130°52.419' E 12:56:00 PM Green turtle 1 juvenile Nth 315 20
Channel Island Bridge Rep 2 03-Aug-13 12°33.242' S 130°52.419' E 12:57:00 PM Green turtle 1 juvenile Nth 23 120
Channel Island Bridge Rep 2 03-Aug-13 12°33.245' S 130°52.419' E 12:58:00 PM Green turtle 1 juvenile Sth 160 20
Channel Island Bridge Rep 2 03-Aug-13 12°33.242' S 130°52.419' E 12:58:00 PM Green turtle 1 juvenile Nth 44 40
Channel Island Bridge Rep 2 03-Aug-13 12°33.245' S 130°52.419' E 12:59:00 PM Green turtle 1 juvenile Sth 165 30
Channel Island Bridge Rep 2 03-Aug-13 12°33.242' S 130°52.419' E 12:59:00 PM Green turtle 1 juvenile Nth 299 30
Channel Island Bridge Rep 2 03-Aug-13 12°33.245' S 130°52.419' E 1:16:00 PM Green turtle 1 juvenile Sth 240 40
Channel Island Bridge Rep 2 03-Aug-13 12°33.242' S 130°52.419' E 13:17:00 PM Green turtle 1 juvenile Nth 35 40
Channel Island Bridge Rep 2 03-Aug-13 12°33.242' S 130°52.419' E 13:20:00 PM Green turtle 1 juvenile Nth 276 40
Channel Island Bridge Rep 2 03-Aug-13 12°33.242' S 130°52.419' E 13:20:00 PM Green turtle 1 juvenile Nth 320 30
Channel Island Bridge Rep 2 03-Aug-13 12°33.245' S 130°52.419' E 13:21:00 PM Green turtle 1 juvenile Sth 240 20
Channel Island Bridge Rep 2 03-Aug-13 12°33.242' S 130°52.419' E 13:21:00 PM Green turtle 1 juvenile Nth 17 120
Channel Island Bridge Rep 2 03-Aug-13 12°33.245' S 130°52.419' E 13:22:00 PM Green turtle 1 juvenile Sth 160 20
Channel Island Bridge Rep 2 03-Aug-13 12°33.245' S 130°52.419' E 13:22:00 PM Green turtle 1 juvenile Sth 160 20
Channel Island Bridge Rep 2 03-Aug-13 12°33.245' S 130°52.419' E 13:24:00 PM Green turtle 1 juvenile Sth 165 20
Channel Island Bridge Rep 2 03-Aug-13 12°33.242' S 130°52.419' E 13:24:00 PM Green turtle 1 juvenile Nth 331 50
Channel Island Bridge Rep 2 03-Aug-13 12°33.242' S 130°52.419' E 13:25:00 PM Green turtle 1 juvenile Nth 325 40
Channel Island Bridge Rep 2 03-Aug-13 12°33.242' S 130°52.419' E 13:27:00 PM Green turtle 1 juvenile Nth 320 30
Channel Island Bridge Rep 2 03-Aug-13 12°33.245' S 130°52.419' E 13:28:00 PM Green turtle 1 juvenile Sth 155 30
Channel Island Bridge Rep 2 03-Aug-13 12°33.242' S 130°52.419' E 13:28:00 PM Green turtle 1 juvenile Nth 45 40
Channel Island Bridge Rep 2 03-Aug-13 12°33.245' S 130°52.419' E 13:29:00 PM Green turtle 1 juvenile Sth 210 30
Channel Island Bridge Rep 2 03-Aug-13 12°33.245' S 130°52.419' E 13:29:00 PM Green turtle 1 juvenile Sth 165 20
Channel Island Bridge Rep 2 03-Aug-13 12°33.242' S 130°52.419' E 13:30:00 PM Green turtle 1 juvenile Nth 0 80
Channel Island Bridge Rep 2 03-Aug-13 12°33.245' S 130°52.419' E 13:32:00 PM Green turtle 1 juvenile Sth 200 20
Channel Island Bridge Rep 2 03-Aug-13 12°33.242' S 130°52.419' E 13:35:00 PM Green turtle 1 juvenile Nth 310 30
Channel Island Bridge Rep 2 03-Aug-13 12°33.245' S 130°52.419' E 13:36:00 PM Green turtle 1 juvenile Sth 180 20
Channel Island Bridge Rep 2 03-Aug-13 12°33.245' S 130°52.419' E 13:36:00 PM Green turtle 1 juvenile Sth 180 10

Routine Turtle and Dugong Monitoring Program Report- Dredging Report 3 Ichthys Nearshore Environmental Monitoring Program
Prepared for INPEX Cardno 93
Location Replicate Date: Observer Position (Latitude)
Observer Position (Longitude)
Time Animal group No. individuals
Age Class (juvenile/adult)
Direction observed
Bearing from observer (degrees)
Estimated distance from observer (m)
Comments (e.g. max be same/different animal, distinguishing feature)
Channel Island Bridge Rep 2 03-Aug-13 12°33.242' S 130°52.419' E 13:37:00 PM Green turtle 1 juvenile Nth 6 100
Channel Island Bridge Rep 2 03-Aug-13 12°33.242' S 130°52.419' E 13:38:00 PM Green turtle 1 juvenile Nth 347 80
Channel Island Bridge Rep 2 03-Aug-13 12°33.245' S 130°52.419' E 13:39:00 PM Green turtle 1 juvenile Sth 210 30
Channel Island Bridge Rep 2 03-Aug-13 12°33.245' S 130°52.419' E 13:41:00 PM Green turtle 1 juvenile Sth 170 20
Channel Island Bridge Rep 2 03-Aug-13 12°33.245' S 130°52.419' E 13:42:00 PM Green turtle 1 juvenile Sth 185 10
Channel Island Bridge Rep 2 03-Aug-13 12°33.245' S 130°52.419' E 13:43:00 PM Green turtle 1 juvenile Sth 190 20
Channel Island Bridge Rep 2 03-Aug-13 12°33.245' S 130°52.419' E 13:44:00 PM Green turtle 1 juvenile Sth 175 20

Routine Turtle and Dugong Monitoring Program Report- Dredging Report 3 Ichthys Nearshore Environmental Monitoring Program
Prepared for INPEX Cardno 77
Ichthys Nearshore Environmental Monitoring Program
APPENDIX N REHABILITATED TURTLE SUMMARY DATA

Routine Turtle and Dugong Monitoring Program Report- Dredging Report 3 Ichthys Nearshore Environmental Monitoring Program
Prepared for INPEX Cardno 95
Appendix N: Details of turtle rehabilitation to date
ID Date of stranding
Turtle Species Life stage Details of stranding Rehab details Contact details Release details Comments
General location Injuries
Approx. rehab time
Proposed release location
Suitability for tagging
Point of contact
Housed at
Release details
Release date
1 July 2011 Olive Ridley juvenile Bare Sand
Island
Hatchling located on Bare sand Island- severely dehydrated and weakened. Taken to Territory Wildlife Park for recovery
22 months
Bynoe Harbour- Bare Sand Island
Unsuitable for TDMP- targeted species include Hawksbill and Green Turtles
Territory Wildlife Park
Released- satellite tagged by Kiki Dethmers, Arafura Timor Research Facility, NAMRA, May 2013
1/05/2013
"Oliver" - as of Sept 2013, tracks still being transmitted, data on Seaturtle.org
2 July 2011 Flatback juvenile Bare Sand Island
Hatchling located on Bare sand Island- severely dehydrated and weakened. Taken to Territory Wildlife Park for recovery
22 months
Bynoe Harbour- Bare Sand Island
Unsuitable for TDMP- targeted species include Hawksbill and Green Turtles
Territory Wildlife Park
Released- satellite tagged by Kiki Dethmers, Arafura Research Station, CDU, May 2013
1/05/2013
"Henderson" - as of Sept 2013, tracks still being transmitted, data on Seaturtle.org
3 Sept 2012 Flatback adult Dundee Beach
Boat strike injury- mid carapace damage
6 months NA
Unsuitable for TDMP due to boat strike injury (position needed for harness and transmitter) - flipper tagged attached by Kiki
Stephen Cutter Ray Chatto
Ark Animal Hospital
Released - Ray Chatto (DLRM)
Feb 2013
Turtle measurements: 56.8cm long, 48.9cm wide & weighs 20kg; the plastron length is 55.5 cm & width is 54.8cm. Boat strike injury left a significant area of scar tissue on the turtles carapace. The turtle was not able to carry a harness due to the injury. Released without satellite tag, flipper tagged by Ray Chatto on release in February 2013

Routine Turtle and Dugong Monitoring Program Report- Dredging Report 3 Ichthys Nearshore Environmental Monitoring Program
Prepared for INPEX Cardno 96
ID Date of stranding
Turtle Species Life stage Details of stranding Rehab details Contact details Release details Comments
General location Injuries
Approx. rehab time
Proposed release location
Suitability for tagging
Point of contact
Housed at
Release details
Release date
4 Oct 2012 Flatback adult (female)
east of Hotham Point (~ 70km from Darwin)
Floater 1 month Lee Point
Unsuitable for TDMP, but released by Kiki
Ray Chatto
Ark & CDU
Released - Kiki Dethmers, Arafura Timor Research Facility, NAMRA, - satellite transmitter attached & flipper tagged at Lee Point
7/12/2012
Turtle measured on captured by TD team in early Oct 2012, 81.9cm long (CCL), 67cm wide (CCW), weight 67kg; "Michala" - tracks transmitted for 2 months, data on Seaturtle.org
5 Oct 2012 Flatback juvenile
Pioneer Beach, Byone Harbour
Floater (no other injuries) Ray
Chatto
Ark Animal Hospital
Unknown Unknown Unknown
6 unknown Green unknown
Found at Mandorah Beach, Darwin Harbour
Boat strike injury- severe head and carapace damage
unknown unknown unknown Tess Cooper
Ark Animal Hospital
Unknown Unknown Unknown
7 May 2013 Flatback adult male near Charles Point
Possible boat strike, carapace damage
1.5 months
Nightcliff jetty
Unsuitable for TDMP- targeted species include Hawksbill and Green Turtles
Stephen Cutter
Ark Animal Hospital
Released- satellite tagged by Kiki Dethmers, Arafura Timor Research Facility, NAMRA, May 2013
1/05/2013
"Charlie" - as of Sept 2013, trackes still being transmitted, data on Seaturtle.org
8 May 2013 Hawksbill juvenile Darwin Harbour Head injury 3 - 4
months To be determined
Unsuitable for TDMP-the turtle was found outside of the project area
Stephen Cutter
Ark Animal Hospital CDU Aquaculture Centre
will be released in late 2013, not suitable for TDMP
Aug/Sept-13
Still in rehab (as of Sept 2013), update from Stephen Cutter (21 Aug) - head injuries appear to have subsided- the turtle will be flipper tagged and released

Routine Turtle and Dugong Monitoring Program Report- Dredging Report 3 Ichthys Nearshore Environmental Monitoring Program
Prepared for INPEX Cardno 97
ID Date of stranding
Turtle Species Life stage Details of stranding Rehab details Contact details Release details Comments
General location Injuries
Approx. rehab time
Proposed release location
Suitability for tagging
Point of contact
Housed at
Release details
Release date
9 May 2013 Hawksbill juvenile Darwin Harbour Darwin
Harbour
Unsuitable- missing fore flipper
Stephen Cutter
Ark Animal Hospital CDU Aquaculture Centre
Released without tag by Ray Chatto, May 2013
1/05/2013
10 July 2013 Flatback juvenile Darwin Harbour
Floater? Possible boat strike unknown unknown
Unsuitable for TDMP- targeted species include Hawksbill and Green Turtles
Paula- vet nurse at Animal Ark Hospital
Ark Animal Hospital CDU Aquaculture Centre
Will be released in late 2013, not suitable for TDMP
TBC
Housed at CDU - update from SC (21 Aug) - will be released late 2013 and tagged by Kiki Dethmers